quantitative imaging from single molecules to (bio)polymers · determining the material properties...
TRANSCRIPT
page 1/8
NanoWizard, CellHesion, BioMAT, NanoTracker, ForceRobot and QI are trademarks or registered trademarks of JPK Instruments AG
© JPK Instruments AG - all rights reserved – www.jpk.com This material shall not be used for an offer in: USA China Japan Europe & other regions
Quantitative imaging from single molecules to (bio)polymers
Introduction
Scanning force microscopy (SFM), also known as atomic
force microscopy (AFM), is a surface imaging technique
based on a purely mechanical imaging process. During
its development over the last 20 years, SFM has become
a key instrument in nanoscience and nanotechnology. In
AFM, a very sharp tip attached to a cantilever is brought
into very close proximity to the surface and then scanned
line by line to probe the surface texture of the sample.
AFM has become an important tool for the field of
material science for probing sample surfaces and
determining the material properties at the nano scale.
The technique gives fast reliable results in many aspects
of the work of physicists, chemists, engineers and
material scientists. AFMs have enhanced much of the
technological progress of the last three decades.
The applications of polymers range from materials for the
photovoltaic industry, research in automotive industry to
the fields of medicine and life sciences.
Polymers are very diverse and their properties are widely
spread. Polymers under the influence of temperature
changes may show phase changes or melt. Also in liquid
and solvents, they can change their behavior drastically
due to swelling.
To characterize polymers on a nanometer scale, a high
resolution instrument is required which enables the user
to probe different aspects of the sample in question.
Traditional imaging modes of AFMs have well known
drawbacks for challenging samples that exhibit steep
edges or that are soft, sticky or loosely attached to the
surface [1][2]. The most common modes such as contact
mode or intermittent-contact (AC) mode introduce
unwanted forces that might damage or compress the
sample. Loosely attached objects might be moved due to
lateral forces. The force applied when using AC mode is
hard to control and might change when measuring soft
biological samples.
JPK Instruments has released the new imaging mode
Quantitative Imaging (QI™) which works without applying
any lateral force and allows the user to control the
vertical force at each pixel.
Working Principle
QI™ is a force curve based imaging mode that ensures
that not more than a set force is applied to the sample.
The working principle allows easy imaging of soft
materials such as hydrogels or biomolecules, sticky
samples such as polymers or bacteria, loosely attached
samples such as nanotubes or virus particles in fluid or
samples with steep edges such as powders or MEMS
structures.
QI™ can be used without limitations on the sample
geometry, in any environment and does not require
special cantilevers.
A novel tip movement algorithm records a complete force
curve at every pixel while only performing lateral
movement in between pixels. That way, a complete map
with high spatial resolution is recorded with standard
imaging speed and can be analyzed to extract different
material properties.
The force that is applied to the sample can be exactly
controlled and the resulting force curves can be saved
along with the created image.
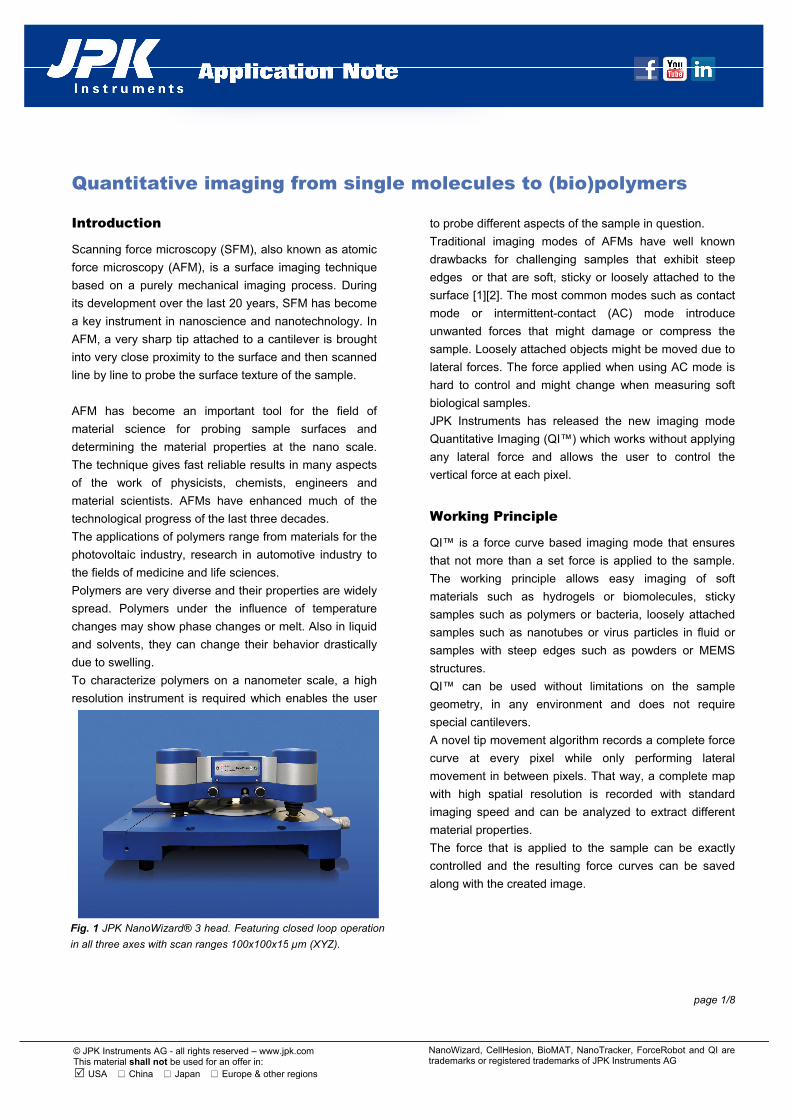
Fig. 1 JPK NanoWizard® 3 head. Featuring closed loop operation
in all three axes with scan ranges 100x100x15 µm (XYZ).
page 2/8
NanoWizard, CellHesion, BioMAT, NanoTracker, ForceRobot and QI are trademarks or registered trademarks of JPK Instruments AG
© JPK Instruments AG - all rights reserved – www.jpk.com This material shall not be used for an offer in: USA China Japan Europe & other regions
By adjusting the imaging speed, the rate of deformation
of the sample can easily be altered. The dependence of
the Young’s modulus with respect to this parameter can
thus be investigated with ease.
In AC mode, the phase image represents stiffness
contrast. However, it has always been hard to interpret
these images regarding the extraction of quantitative
data. QI™ gives the possibility to use the acquired data
to calculate the properties in question using any fit
algorithm. Parameters such as the tip shape which
greatly influence the outcome of the fit can be freely
chosen by the user.
Several parameters can be calculated such as the work
of adhesion, the acting adhesion and the contact point
height. Specific adhesion events can be detected and the
Young’s modulus of the sample can be calculated using
contact mechanical models.
Further, the contact point height can be used to create a
zero force image that most accurately resembles the real
surface of the sample without indentation. Please see
also the product note “The new JPK Contact Point
Imaging (CPI) option based on QI™ mode” available on
the JPK website.
Quantitative Imaging comes as standard with all models
of the NanoWizard® 3 family making imaging even the
toughest samples as easy as never before.
The add-on Advanced QI™ allows saving and post-
processing of all recorded data and provides freely
selectable online channels.
The challenges that are offered by many bulk and
structured polymer samples are most diverse. High and
steep edges, big height differences across the sample,
temperature dependence and a great range of elasticity
create high demands on the instrument. The following
application examples give an impression of how powerful
the new QI™ mode is.
Examples
Celgard®
Celgard® is a commercially available microporous
membrane that is applied in rechargeable batteries as
separator. This polypropylene monolayer is produced by
a special dry-stretch process. The most important
macroscopic properties are determined by its fiber
thickness as well as the size of its pores.
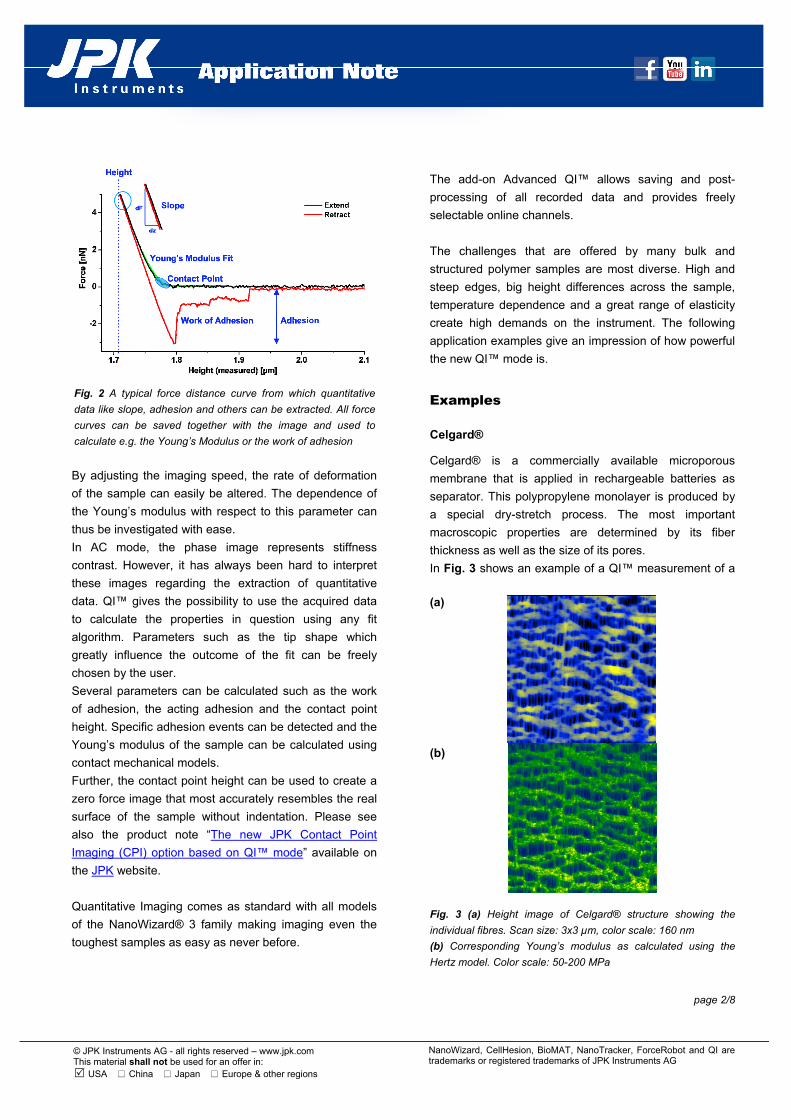
In Fig. 3 shows an example of a QI™ measurement of a
(a)
(b)
Fig. 3 (a) Height image of Celgard® structure showing the
individual fibres. Scan size: 3x3 µm, color scale: 160 nm
(b) Corresponding Young’s modulus as calculated using the
Hertz model. Color scale: 50-200 MPa
Fig. 2 A typical force distance curve from which quantitative
data like slope, adhesion and others can be extracted. All force
curves can be saved together with the image and used to
calculate e.g. the Young’s Modulus or the work of adhesion

page 3/8
NanoWizard, CellHesion, BioMAT, NanoTracker, ForceRobot and QI are trademarks or registered trademarks of JPK Instruments AG
© JPK Instruments AG - all rights reserved – www.jpk.com This material shall not be used for an offer in: USA China Japan Europe & other regions
Celgard® sample. The individual fibers can be clearly
resolved in the height image (figure 3a). Due to the
unique scanning procedure of Quantitative Imaging, no
obstructions are present as may be observed in AC
mode.
Analysis of the recorded data with the Hertzian model of
elasticity yields the corresponding Young’s modulus
distribution as depicted in Fig. 3(b).
By overlaying the elasticity information over the 3D
topography representation (Fig. 4), any inhomogeneities
can be readily discovered.
Nanofibers
Nanofibrous materials are used in a wide range of
applications in fields ranging from drug delivery, filtration
and nanocomposites to regenerative medicine and
responsive devices.
These kinds of materials show exceptional properties
through their high surface to volume ratio and significant
fiber interconnectivity. AFM is used to study the fiber
density, network structure, micro scale interstitial spaces
and fiber thickness. The challenges in imaging nanofibers
with conventional intermittent-contact mode, such as its
softness and deep trenches are overcome by QI™. The
force that is applied to the individual fibers can be
controlled with high precision.
The nanofiber network shown in Fig. 5 was produced by
electrospinning a solution of 11wt% PCL in acetic acid
with 2wt% of TEA. Coiled nanofibers with different
bending angles are randomly ordered in this structure.
Areas with higher fiber density exhibit higher elasticity
values which can be seen in the 3D image.
Polytetrafluoroethylene
Polytetrafluoroethylene (PTFE), better known under the
brand name Teflon®, is a synthetic fluoropolymer with
remarkable properties. Due to its hydrophobic character
[3] and resistance to Van der Waals forces, it is used as
(a)
(b)
Fig. 5 (a) Height image of nanofibers, deep trenches can be
resolved with tip-limited resolution. Scan size: 10x10 µm, color
scale: 710 nm
(b) Corresponding overlay of 3D topography with elasticity
information, color scale: 2-8 MPa
Fig. 4 Overlay of 3D topography with elasticity
information, color scale: 50-200 MPa
page 4/8
NanoWizard, CellHesion, BioMAT, NanoTracker, ForceRobot and QI are trademarks or registered trademarks of JPK Instruments AG
© JPK Instruments AG - all rights reserved – www.jpk.com This material shall not be used for an offer in: USA China Japan Europe & other regions
a non-stick coating. Further, PTFE is highly non-reactive
which makes it an ideal material for reactive
environments of acids and other corrosive materials.
AFM-studies have shown that the hydrophobic properties
of PTFE can be minimized by surface modification using
poly(ethylene glycol) methacrylate in order to increase
resistance to biofouling [5]. This could reduce drawbacks
in the manufacturing of biomaterials using PTFE.
Most of the previously mentioned properties stem from
the electronegativity of fluorine as well as the strong
fluorine-carbon bonds. The applications, however,
require a detailed knowledge of the pore size, stiffness
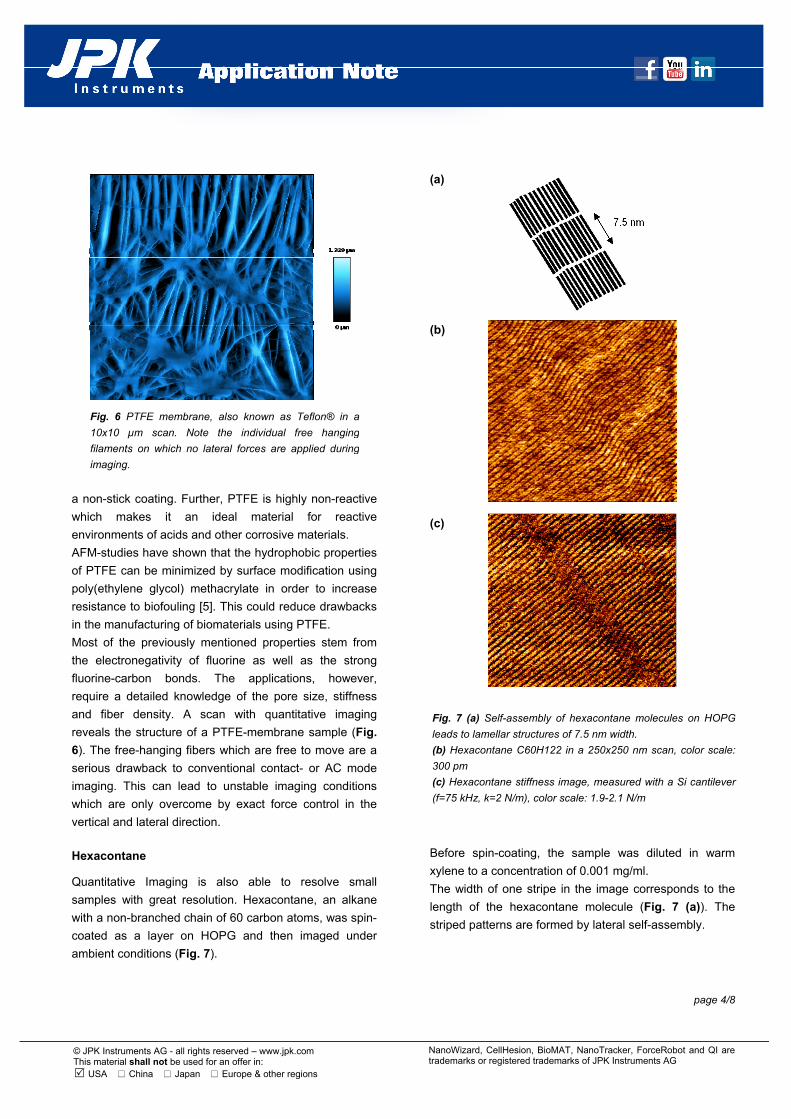
and fiber density. A scan with quantitative imaging
reveals the structure of a PTFE-membrane sample (Fig.
6). The free-hanging fibers which are free to move are a
serious drawback to conventional contact- or AC mode
imaging. This can lead to unstable imaging conditions
which are only overcome by exact force control in the
vertical and lateral direction.
Hexacontane
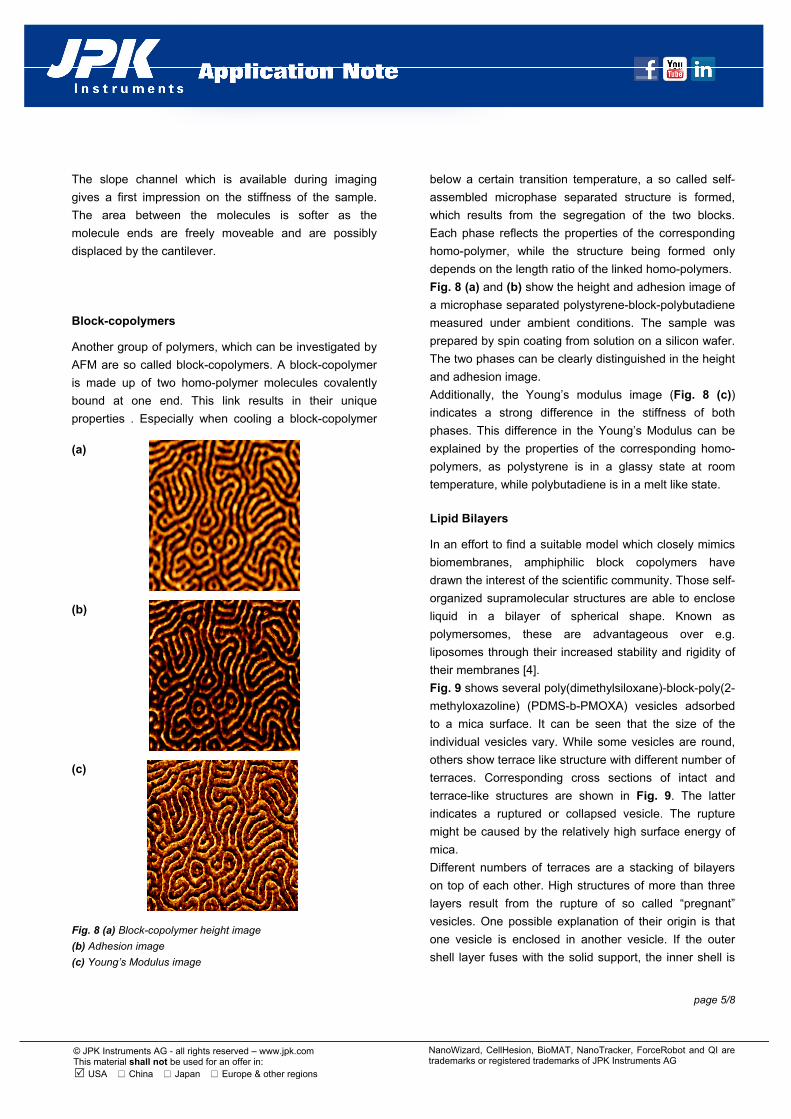
Quantitative Imaging is also able to resolve small
samples with great resolution. Hexacontane, an alkane
with a non-branched chain of 60 carbon atoms, was spin-
coated as a layer on HOPG and then imaged under
ambient conditions (Fig. 7).
(a)
(b)
(c)
Before spin-coating, the sample was diluted in warm
xylene to a concentration of 0.001 mg/ml.
The width of one stripe in the image corresponds to the
length of the hexacontane molecule (Fig. 7 (a)). The
striped patterns are formed by lateral self-assembly.
Fig. 6 PTFE membrane, also known as Teflon® in a
10x10 µm scan. Note the individual free hanging
filaments on which no lateral forces are applied during
imaging.
Fig. 7 (a) Self-assembly of hexacontane molecules on HOPG
leads to lamellar structures of 7.5 nm width.
(b) Hexacontane C60H122 in a 250x250 nm scan, color scale:
300 pm
(c) Hexacontane stiffness image, measured with a Si cantilever
(f=75 kHz, k=2 N/m), color scale: 1.9-2.1 N/m
page 5/8
NanoWizard, CellHesion, BioMAT, NanoTracker, ForceRobot and QI are trademarks or registered trademarks of JPK Instruments AG
© JPK Instruments AG - all rights reserved – www.jpk.com This material shall not be used for an offer in: USA China Japan Europe & other regions
The slope channel which is available during imaging
gives a first impression on the stiffness of the sample.
The area between the molecules is softer as the
molecule ends are freely moveable and are possibly
displaced by the cantilever.
Block-copolymers
Another group of polymers, which can be investigated by
AFM are so called block-copolymers. A block-copolymer
is made up of two homo-polymer molecules covalently
bound at one end. This link results in their unique
properties . Especially when cooling a block-copolymer
below a certain transition temperature, a so called self-
assembled microphase separated structure is formed,
which results from the segregation of the two blocks.
Each phase reflects the properties of the corresponding
homo-polymer, while the structure being formed only
depends on the length ratio of the linked homo-polymers.
Fig. 8 (a) and (b) show the height and adhesion image of
a microphase separated polystyrene-block-polybutadiene
measured under ambient conditions. The sample was
prepared by spin coating from solution on a silicon wafer.
The two phases can be clearly distinguished in the height
and adhesion image.
Additionally, the Young’s modulus image (Fig. 8 (c))
indicates a strong difference in the stiffness of both
phases. This difference in the Young’s Modulus can be
explained by the properties of the corresponding homo-
polymers, as polystyrene is in a glassy state at room
temperature, while polybutadiene is in a melt like state.
Lipid Bilayers
In an effort to find a suitable model which closely mimics
biomembranes, amphiphilic block copolymers have
drawn the interest of the scientific community. Those self-
organized supramolecular structures are able to enclose
liquid in a bilayer of spherical shape. Known as
polymersomes, these are advantageous over e.g.
liposomes through their increased stability and rigidity of
their membranes [4].
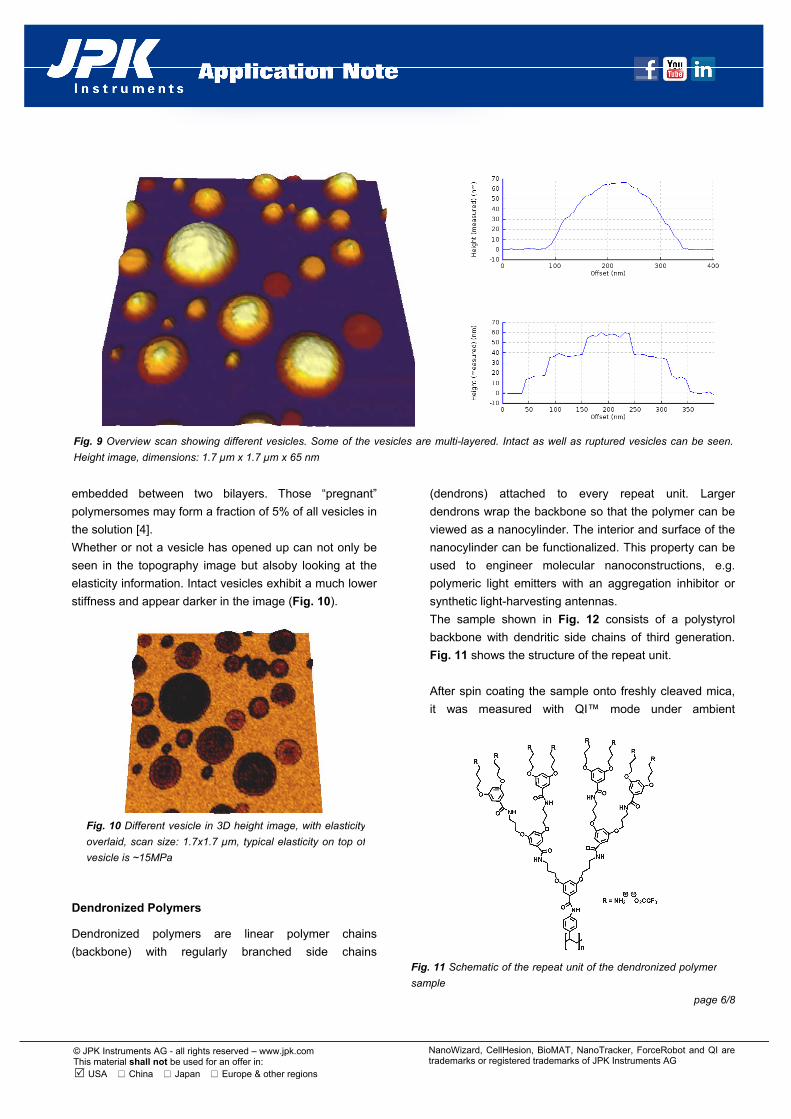
Fig. 9 shows several poly(dimethylsiloxane)-block-poly(2-
methyloxazoline) (PDMS-b-PMOXA) vesicles adsorbed
to a mica surface. It can be seen that the size of the
individual vesicles vary. While some vesicles are round,
others show terrace like structure with different number of
terraces. Corresponding cross sections of intact and
terrace-like structures are shown in Fig. 9. The latter
indicates a ruptured or collapsed vesicle. The rupture
might be caused by the relatively high surface energy of
mica.
Different numbers of terraces are a stacking of bilayers
on top of each other. High structures of more than three
layers result from the rupture of so called “pregnant”
vesicles. One possible explanation of their origin is that
one vesicle is enclosed in another vesicle. If the outer
shell layer fuses with the solid support, the inner shell is
(a)
(b)
(c)
Fig. 8 (a) Block-copolymer height image
(b) Adhesion image
(c) Young’s Modulus image
page 6/8
NanoWizard, CellHesion, BioMAT, NanoTracker, ForceRobot and QI are trademarks or registered trademarks of JPK Instruments AG
© JPK Instruments AG - all rights reserved – www.jpk.com This material shall not be used for an offer in: USA China Japan Europe & other regions
embedded between two bilayers. Those “pregnant”
polymersomes may form a fraction of 5% of all vesicles in
the solution [4].
Whether or not a vesicle has opened up can not only be
seen in the topography image but alsoby looking at the
elasticity information. Intact vesicles exhibit a much lower
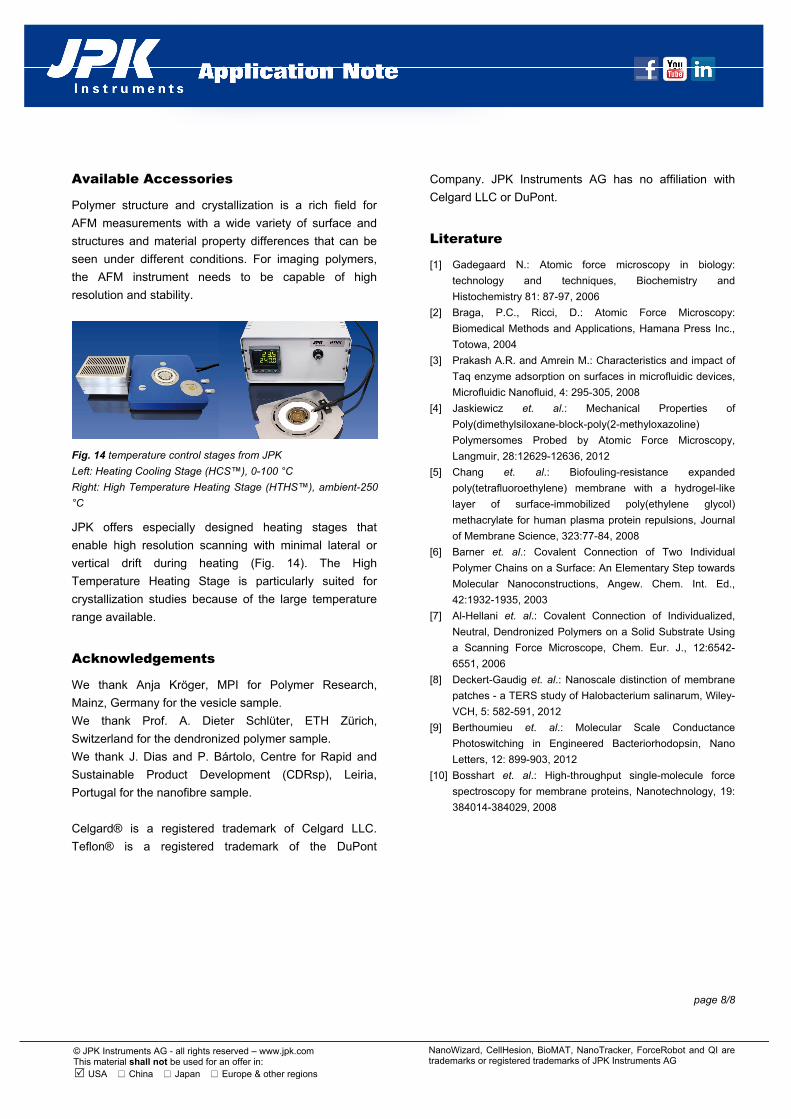
stiffness and appear darker in the image (Fig. 10).
Dendronized Polymers
Dendronized polymers are linear polymer chains
(backbone) with regularly branched side chains
(dendrons) attached to every repeat unit. Larger
dendrons wrap the backbone so that the polymer can be
viewed as a nanocylinder. The interior and surface of the
nanocylinder can be functionalized. This property can be
used to engineer molecular nanoconstructions, e.g.
polymeric light emitters with an aggregation inhibitor or
synthetic light-harvesting antennas.
The sample shown in Fig. 12 consists of a polystyrol
backbone with dendritic side chains of third generation.
Fig. 11 shows the structure of the repeat unit.
After spin coating the sample onto freshly cleaved mica,
it was measured with QI™ mode under ambient
Fig. 9 Overview scan showing different vesicles. Some of the vesicles are multi-layered. Intact as well as ruptured vesicles can be seen.
Height image, dimensions: 1.7 µm x 1.7 µm x 65 nm
Fig. 11 Schematic of the repeat unit of the dendronized polymer
sample
Fig. 10 Different vesicle in 3D height image, with elasticity
overlaid, scan size: 1.7x1.7 µm, typical elasticity on top of
vesicle is ~15MPa

page 7/8
NanoWizard, CellHesion, BioMAT, NanoTracker, ForceRobot and QI are trademarks or registered trademarks of JPK Instruments AG
© JPK Instruments AG - all rights reserved – www.jpk.com This material shall not be used for an offer in: USA China Japan Europe & other regions
conditions.
The preparation of the dendronized polymers on the
substrate can be easily checked with the fast and
reproducible scanning procedure offered by the
NanoWizard® 3 system. This offers not only the
possibility to calculate the stiffness (Fig. 12 (b)), but also
to manipulate the individual polymer strands [6], [7].
Bacteriorhodopsin
Cellular membranes have drawn the interest of the
scientific community in the past decades. They are
thought to consist of different protein patches that
determine different membranes functions.
Bacteriorhodopsin is a protein found in membranes of
Archaea where it acts as a proton pump and hence
allows energy storage in a cell. In an effort to find new
methods to characterize cellular membrane patches,
bacteriorhodopsin was employed as a marker for purple
membrane patches to identify them on bacterial surfaces
[8] using Tip-enhanced Raman spectroscopy. Other
studies employed conductive AFM [9] or force
spectroscopy [10] to investigate bacteriorhodopsin
patches.
Here we show images of a bacteriorhodopsin patch (Fig.
13) that was adsorbed on mica and imaged in buffer
solution. Single defects prove the single molecule
resolution of Quantitative Imaging in liquid. A Fourier
transform image shows the periodicity of the structure
(Fig. 13 (c)).
(a)
(b)
Fig. 12 (a) Dendronized polymers 3D height image, Scan size:
1.3x1.3 µm, color scale: 2 nm
(b) Detail scan of different region with calculated Young’s
modulus overlaid. Scan size: 1.1x0.55 µm, color scale: 1-2 MPa
(a)
(b)
(c)
Fig. 13 (a) Height and stiffness image of bacteriorhodopsin.
Scan size: 120x120 nm, color scale: 480 pm
(b)Stiffness image, color scale: 72 nN/µm
(c) Fourier Transform image of stiffness data showing periodicity
of the structure.
page 8/8
NanoWizard, CellHesion, BioMAT, NanoTracker, ForceRobot and QI are trademarks or registered trademarks of JPK Instruments AG
© JPK Instruments AG - all rights reserved – www.jpk.com This material shall not be used for an offer in: USA China Japan Europe & other regions
Available Accessories
Polymer structure and crystallization is a rich field for
AFM measurements with a wide variety of surface and
structures and material property differences that can be
seen under different conditions. For imaging polymers,
the AFM instrument needs to be capable of high
resolution and stability.
In combination with an inverse microscope, the High
emperature Heating Stage (HTHS™) offers the same
JPK offers especially designed heating stages that
enable high resolution scanning with minimal lateral or
vertical drift during heating (Fig. 14). The High
Temperature Heating Stage is particularly suited for
crystallization studies because of the large temperature
range available.
Acknowledgements
We thank Anja Kröger, MPI for Polymer Research,
Mainz, Germany for the vesicle sample.
We thank Prof. A. Dieter Schlüter, ETH Zürich,
Switzerland for the dendronized polymer sample.
We thank J. Dias and P. Bártolo, Centre for Rapid and
Sustainable Product Development (CDRsp), Leiria,
Portugal for the nanofibre sample.
Celgard® is a registered trademark of Celgard LLC.
Teflon® is a registered trademark of the DuPont
Company. JPK Instruments AG has no affiliation with
Celgard LLC or DuPont.
Literature
[1] Gadegaard N.: Atomic force microscopy in biology:
technology and techniques, Biochemistry and
Histochemistry 81: 87-97, 2006
[2] Braga, P.C., Ricci, D.: Atomic Force Microscopy:
Biomedical Methods and Applications, Hamana Press Inc.,
Totowa, 2004
[3] Prakash A.R. and Amrein M.: Characteristics and impact of
Taq enzyme adsorption on surfaces in microfluidic devices,
Microfluidic Nanofluid, 4: 295-305, 2008
[4] Jaskiewicz et. al.: Mechanical Properties of
Poly(dimethylsiloxane-block-poly(2-methyloxazoline)
Polymersomes Probed by Atomic Force Microscopy,
Langmuir, 28:12629-12636, 2012
[5] Chang et. al.: Biofouling-resistance expanded
poly(tetrafluoroethylene) membrane with a hydrogel-like
layer of surface-immobilized poly(ethylene glycol)
methacrylate for human plasma protein repulsions, Journal
of Membrane Science, 323:77-84, 2008
[6] Barner et. al.: Covalent Connection of Two Individual
Polymer Chains on a Surface: An Elementary Step towards
Molecular Nanoconstructions, Angew. Chem. Int. Ed.,
42:1932-1935, 2003
[7] Al-Hellani et. al.: Covalent Connection of Individualized,
Neutral, Dendronized Polymers on a Solid Substrate Using
a Scanning Force Microscope, Chem. Eur. J., 12:6542-
6551, 2006
[8] Deckert-Gaudig et. al.: Nanoscale distinction of membrane
patches - a TERS study of Halobacterium salinarum, Wiley-
VCH, 5: 582-591, 2012
[9] Berthoumieu et. al.: Molecular Scale Conductance
Photoswitching in Engineered Bacteriorhodopsin, Nano
Letters, 12: 899-903, 2012
[10] Bosshart et. al.: High-throughput single-molecule force
spectroscopy for membrane proteins, Nanotechnology, 19:
384014-384029, 2008
Fig. 14 temperature control stages from JPK
Left: Heating Cooling Stage (HCS™), 0-100 °C
Right: High Temperature Heating Stage (HTHS™), ambient-250
°C