quantitative easing, changes in global liquidity and ... · quantitative easing, changes in global...
TRANSCRIPT

Quantitative Easing, Changes in Global Liquidity and Financial Instability
Esteban Pérez Caldentey
February 2017
Post Keynesian Economics Study Group
Working Paper 1701
This paper may be downloaded free of charge from www.postkeynesian.net
© Esteban Pérez Caldentey
Users may download and/or print one copy to facilitate their private study or for non-commercial research and may
forward the link to others for similar purposes. Users may not engage in further distribution of this material or use it
for any profit-making activities or any other form of commercial gain.

Quantitative Easing, changes in global liquidity and financial
instability
Abstract: This paper argues that Quantitative Easing (QE) led to significant changes in the
global financial system, which, are not conducive to greater financial stability. Through a policy
of reserve accumulation, QE disconnected base money from the money supply and deposits from
loans. Jointly with the deleveraging process of global banks, QE contributed to restrain the
supply of bank credit growth throughout the world. Also global banks continued to expand their
trading on the basis of opaque instruments such as derivatives. Moreover, by altering the relative
profitability of investing in different assets, QE exerted a positive effect on the performance of
the international bond market. This not only spilled into emerging market economies expanding
the debt of both the financial sector and the non-financial corporate sector but also has reinforced
the role of the asset management industry in financial markets. Due to its concentration and
interconnectedness, illiquidity, and pro-cyclicality the asset management industry poses
important risks to financial stability.
Keywords: Quantitative easing, financial system, global banks, asset management industry
JEL classifications: E12, E42, E44, E51
The author wishes to express his gratitude for the very valuable comments and suggestions
provided by Cecilia Vera and Manuel Cruz.
Esteban Pérez Caldentey
Financing for Development Unit at the Economic Commission for Latin America and the
Caribbean (ECLAC). Office T-423 Comisión Económica para América Latina y el Caribe
(CEPAL) Avenida Dag Hammarskjold 3477, Vitacura. Santiago. Chile Postal Code 7630412

1
Introduction
At the end of 2008 the United States implemented a monetary policy known as Quantitative
Easing (QE). This policy aimed at lowering long-term interest rates to spur aggregate demand
and promote economic growth. QE can hardly be said to have accomplished its intended effects
on the real economy. Instead, it contributed to induce important changes in the global financial
system with potential negative effects on financial stability.
Through a policy of reserve accumulation QE produced an unprecedented increase in the
balance sheet of the Federal Reserve which disconnected base money from the money supply,
and banks´ deposits from their loans. Other major central banks, including the European Central
Bank and the Bank of Japan followed similar monetary policy strategies.
In combination with the deleveraging process and decline in profitability of global banks
following the Global Financial Crisis (2007-2008), these policies contributed to restrict bank
lending throughout the world. Cross-border bank lending, which had averaged a combined rate
of growth of 16% for the United States, the Euro Zone and Japan for the period 2001-2008,
decreased to 4% in the period 2010-2015.
QE policies not only affected the level of global liquidity but also its composition by
changing the relative profitability of investing in different assets through the portfolio
rebalancing channel. Portfolio rebalancing refers to a decline in the risk premium (the difference
between the expected return on an asset and the risk free rate of interest) of an asset produced by
changes in its net supply.
Portfolio rebalancing aimed at a decline in interest rates throughout a broad range of assets
easing financial conditions in the economy and spurring aggregate spending through increased
long-term borrowing and wealth, and balance sheet effects. While there is no clear cut evidence
linking the portfolio rebalancing channel to aggregate spending, the empirical evidence shows
that by changing the relative profitability of assets, it contributed to improve the performance of
global capital markets including that of the global bond market and its importance as a source of
finance.
The combined lending of the United States, Europe and Japan to non-residents through the
bond markets increased from US$ 1.8 trillion in 2000 to US$ 3 trillion at the end of 2008
reaching US$ 6 trillion by December 2015. Since the beginning of QE policies the share of
international bond markets in total lending has risen steadily from 40% to 48% of global credit to
non-residents.
Developed economies account for the lion´s share of the international bond market.
However, developing economies, and in particular Latin America and Asia, have become the
most active and dynamic actors since the implementation of QE. Developed countries stock of
international debt issues grew on average 21% during 2000-2008 dropping to 0.23% in the

2
period 2009-2015. Contrarily, in the case of developing economies, the stock of international
issues expanded by 8% and 12% for the same periods.
These changes have not been conducive to the creation of more stable global financial
system.
First, as part of their strategy to recover their pre-crisis levels of profitability, banks have
increased their holdings of riskier financial instruments such as derivatives that were central to
the onset of the crisis. Second, the greater dependency of global banks on instruments such as
derivatives and on institutions such as corporate and investment banking has strengthened their
degree of interconnectivity. Third, the increasing importance of the bond market has been
accompanied by a growing external debt of some emerging market economies. Fourth, the
growth of the bond market is underpinned by the asset management industry which poses a
number of important risks to financial stability due to its concentration and interconnectedness,
illiquidity, and pro-cyclicality.
This paper is divided (at this stage) into seven sections. Sections two to four focus on QE and
its impact on the level and composition of global liquidity. Section five describes the importance
of the bond market. Section six discusses the implications of the changes in the financial system
for financial stability. Section seven concludes.
3
QE: the disconnection between money base and money supply and between banks deposits
and loans
Following the start of trouble in the subprime mortgage market in mid-2007 the Federal
Reserve decided to lower the Federal Funds rate (FF rate). Between July 2007 and the collapse
of Lehman Brothers (LB) in 2008, the FF rate declined from 5.26% a 1.81%. Following the LB
episode the FF rate declined further to reach a low of 0.16% by December of that same year. At
the zero-bound, the short term interest could not be reduced any further and the Federal Reserve
opted for an unconventional policy of large asset purchases or Quantitative Easing (QE).
QE consists in large-scale asset purchases, treasuries and mortgage related securities (LSAP),
by the FED from the financial system. The purpose of the QE is to ease monetary policy by
lowering long-term interest rates. As simply put by Bernanke (2013), p. 104:
“Why are we buying these securities? This is, by the way, an approach that monetarists
such as Milton Friedman have talked about. The basic idea is that when you buy
Treasuries and GSE securities and bring them onto the balance sheet that reduces the
available supply of those securities in the market. Investors want to hold those securities
and they have to settle for a lower yield…So by purchasing Treasury securities, bringing
them onto our balance sheet, and reducing the available supply of those Treasuries we
effectively lowered the interest rate of longer-termed Treasuries and GSE securities as
well. Moreover to the extent that investors no longer having available Treasuries and
GSE securities to hold in their portfolios, to the extent that they are induced to move to
other kinds of securities, such as corporate bonds, that also raises the price and lower the
yield on those securities. And so the net effect of these actions was to lower yields across
a range of securities. And as usual, lower interest rates have supportive, stimulative
effects on the economy.”
The QE policy lasted for roughly six years and consisted in three major rounds of large-scale
asset purchases. These are QE1 (December 2008-March 2010), QE2 (November 2010-June
2011), and Q3 (September 2012-December 2013). Through the implementation of the first round
of QE the FED bought up to US $1.3 trillion dollars in agency mortgage-backed securities
(MBS) and agency debt and US$ 300 billion in Treasury Securities. QE2 consisted in the
purchase of US$ 600 billion of longer-term securities. Finally, Q3 consisted in the purchase US$
1.7 trillion in longer-term and mortgage based securities.
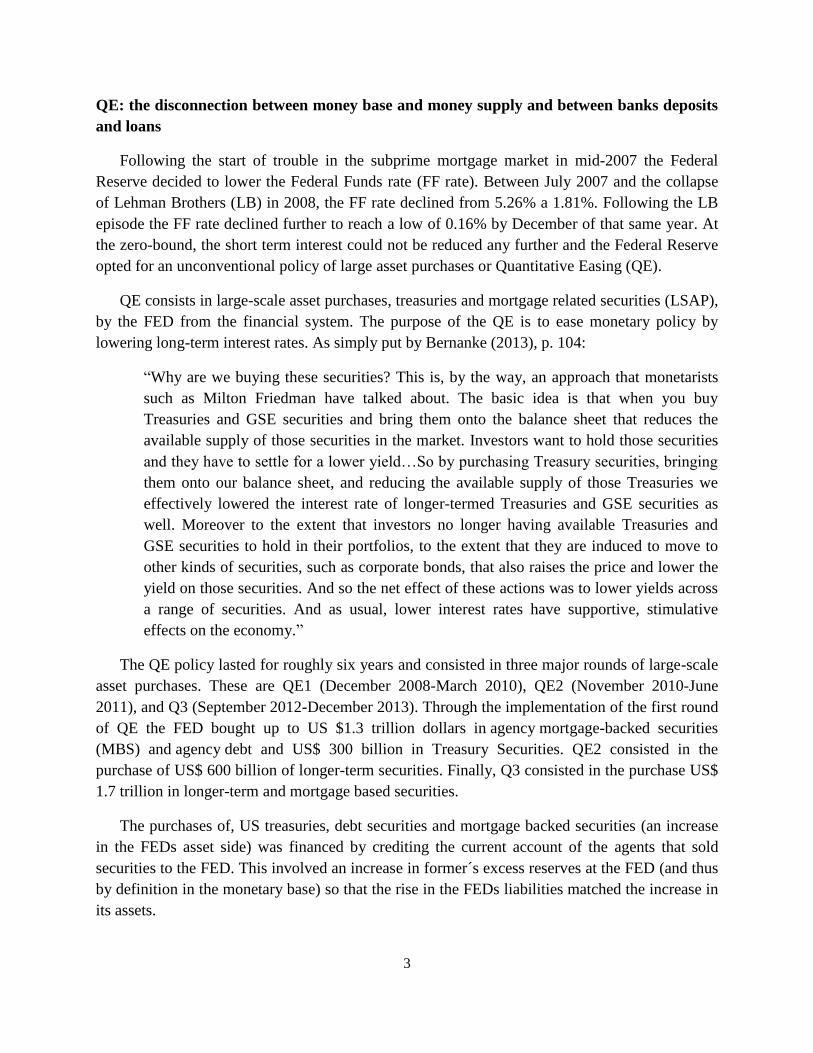
The purchases of, US treasuries, debt securities and mortgage backed securities (an increase
in the FEDs asset side) was financed by crediting the current account of the agents that sold
securities to the FED. This involved an increase in former´s excess reserves at the FED (and thus
by definition in the monetary base) so that the rise in the FEDs liabilities matched the increase in
its assets.

4
The reserves of private depository institutions at the FED (“Other deposits held by depository
institutions” in Figure 1) increased significantly after the start of QE. In the two years prior to the
start in Q1 the level of bank reserves at the FED hovered at US$20 billion. By December 2008,
the level of reserves increased to US$ 800 billion and surpassed US$ 1 trillion dollars in 2011,
stabilizing around US$ 2 trillion by 2013 (US$ 2.3 trillion in the first half of 2016). The reserves
of depository institutions represent more than 50% of the FED liabilities.
Figure 1
Federal Reserve. Selected liabilities (US$ billions). June 2008-April 2016
Source: On the basis of the Financial Accounts of the United States. Federal Reserve Bank (2016)
Prior to the start of the first stage in QE, the agents that held treasury bills included mainly,
foreign residents, state and local governments, households (hedge funds and private equity
funds), money market funds, private pension funds, state and local government retirement funds,
federal government retirement funds, US chartered commercial banks and life insurance
companies (roughly 95% of the total) (see table 1). Due to the fact that these institutions do not
have an account with the FED, the sale of treasury securities and agency mortgage backed
securities was carried out through primary dealers (either US chartered banks or through foreign
banks operating in the United States). 1
1 See Choulet, 2015.
0
1,000
2,000
3,000
4,000
5,000
6,000
01-J
un
-08
01-N
ov
-08
01-A
pr-
09
01-S
ep-0
9
01-F
eb-1
0
01-J
ul-
10
01-D
ec-1
0
01-M
ay-1
1
01-O
ct-1
1
01-M
ar-1
2
01-A
ug
-12
01-J
an-1
3
01-J
un
-13
01-N
ov
-13
01-A
pr-
14
01-S
ep-1
4
01-F
eb-1
5
01-J
ul-
15
01-D
ec-1
5
Other deposits
U.S. Treasury, supplementary
financing account
U.S. Treasury, general account
Other deposits held by depository
institutions
Term deposits held by depository
institutions
Others

5
Table 1
United States Treasury Securities by holder (Percentage of the total) 2007-2016
Sectors 2007 2008 2009 2010 2012 2014 2016
2012-
2008
2014-
2008
2016-
2008
Rest of the world 46.6 51.3 47.2 42.4 43.4 42.7 40.9 -7.9 -8.6 -10.5
Monetary authority 14.5 7.5 10.0 9.7 13.0 17.1 16.0 5.5 9.6 8.5
State and local governments 10.3 7.5 7.5 5.7 4.7 4.3 4.6 -2.8 -3.2 -2.9
Households 5.2 4.0 11.2 10.5 7.4 5.8 7.0 3.3 1.8 2.9
Mutual funds 3.5 3.0 3.2 4.0 4.4 4.7 5.5 1.4 1.8 2.6
Money market mutual funds 3.5 9.1 5.2 3.3 3.6 2.9 3.5 -5.5 -6.2 -5.6
Private pension funds 3.3 2.9 2.3 1.9 2.3 2.2 2.1 -0.6 -0.7 -0.8
State and Local Government Retirement Funds 2.8 2.3 2.0 1.5 1.3 1.2 1.0 -1.0 -1.1 -1.3
Federal government retirement funds 1.7 1.8 1.5 12.1 11.1 11.2 11.1 9.3 9.4 9.3
ABS Issuers 1.7 1.1 0.7 0.4 0.2 0.2 0.2 -1.0 -1.0 -1.0
US chartered commercial banks 1.4 0.8 1.6 2.1 1.9 2.9 2.8 1.1 2.1 2.0
Property-casualties insurance companies 1.4 1.0 1.1 0.9 0.7 0.7 0.6 -0.3 -0.3 -0.4
Life Insurance Companies 1.4 1.7 1.7 1.5 1.4 1.3 1.3 -0.3 -0.4 -0.4
Nonfinancial non-corporate business 1.2 0.8 0.6 0.5 0.4 0.4 0.4 -0.4 -0.4 -0.4
Nonfinancial corporate business 0.8 0.5 0.6 0.5 0.3 0.3 0.2 -0.2 -0.2 -0.3
Foreign Banking Offices in the US 0.6 0.6 0.7 0.6 0.6 0.4 0.5 0.0 -0.2 0.0
Exchange traded funds 0.4 0.4 0.5 0.5 0.5 0.5 0.6 0.1 0.1 0.2
Government Sponsored Enterprises 0.3 0.3 0.5 0.8 0.5 0.4 0.6 0.3 0.2 0.3
Credit Unions 0.2 0.1 0.2 0.2 0.2 0.1 0.2 0.0 0.0 0.0
Bank holding companies 0.1 0.0 0.1 0.2 0.1 0.1 0.1 0.0 0.0 0.0
Savings Institutions 0.1 0.0 0.1 0.1 0.0 0.0 0.0 0.0 0.0 0.0
Closed-end funs 0.1 0.1 0.1 0.0 0.0 0.0 0.0 0.0 0.0 0.0
Banks in US affiliated areas 0.0 0.0 0.0 0.0 0.0 0.0 0.0 0.0 0.0 0.0
Brokers and Dealers -1.2 3.0 1.6 0.9 1.9 0.4 0.6 -1.1 -2.6 -2.4
Source: On the basis of the Financial Accounts of the United States. Federal Reserve Bank (2016)
6
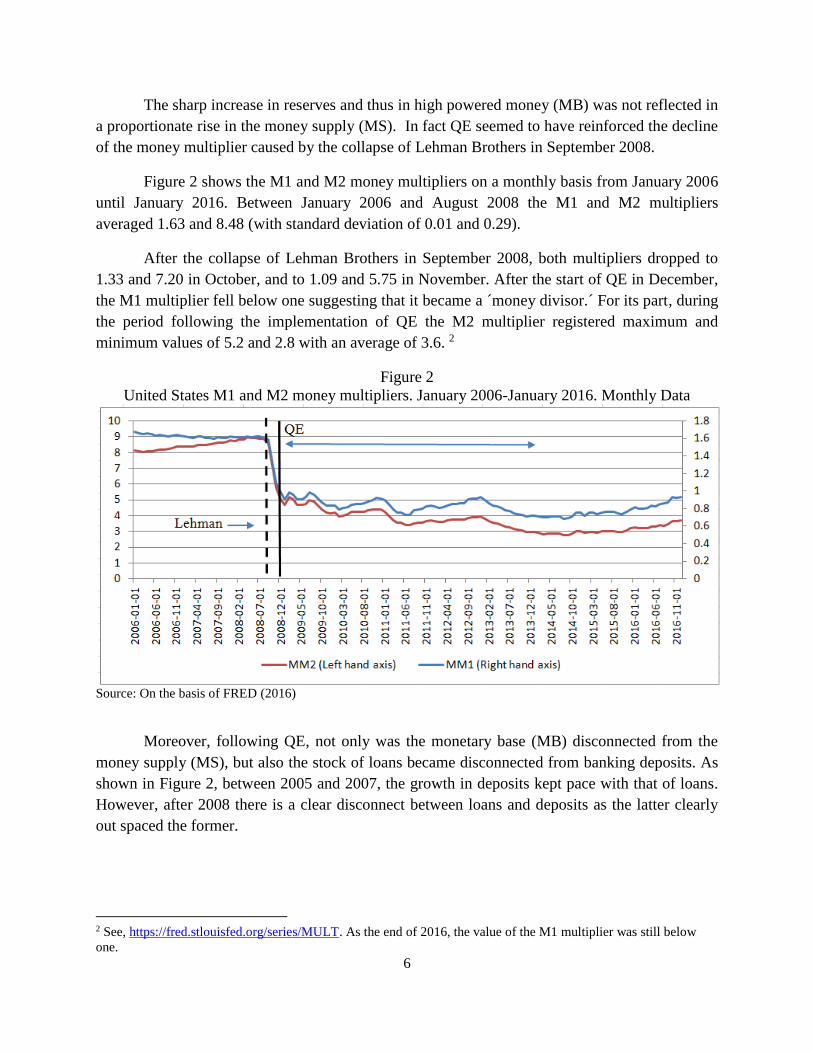
The sharp increase in reserves and thus in high powered money (MB) was not reflected in
a proportionate rise in the money supply (MS). In fact QE seemed to have reinforced the decline
of the money multiplier caused by the collapse of Lehman Brothers in September 2008.
Figure 2 shows the M1 and M2 money multipliers on a monthly basis from January 2006
until January 2016. Between January 2006 and August 2008 the M1 and M2 multipliers
averaged 1.63 and 8.48 (with standard deviation of 0.01 and 0.29).
After the collapse of Lehman Brothers in September 2008, both multipliers dropped to
1.33 and 7.20 in October, and to 1.09 and 5.75 in November. After the start of QE in December,
the M1 multiplier fell below one suggesting that it became a ´money divisor.´ For its part, during
the period following the implementation of QE the M2 multiplier registered maximum and
minimum values of 5.2 and 2.8 with an average of 3.6. 2
Figure 2
United States M1 and M2 money multipliers. January 2006-January 2016. Monthly Data
Source: On the basis of FRED (2016)
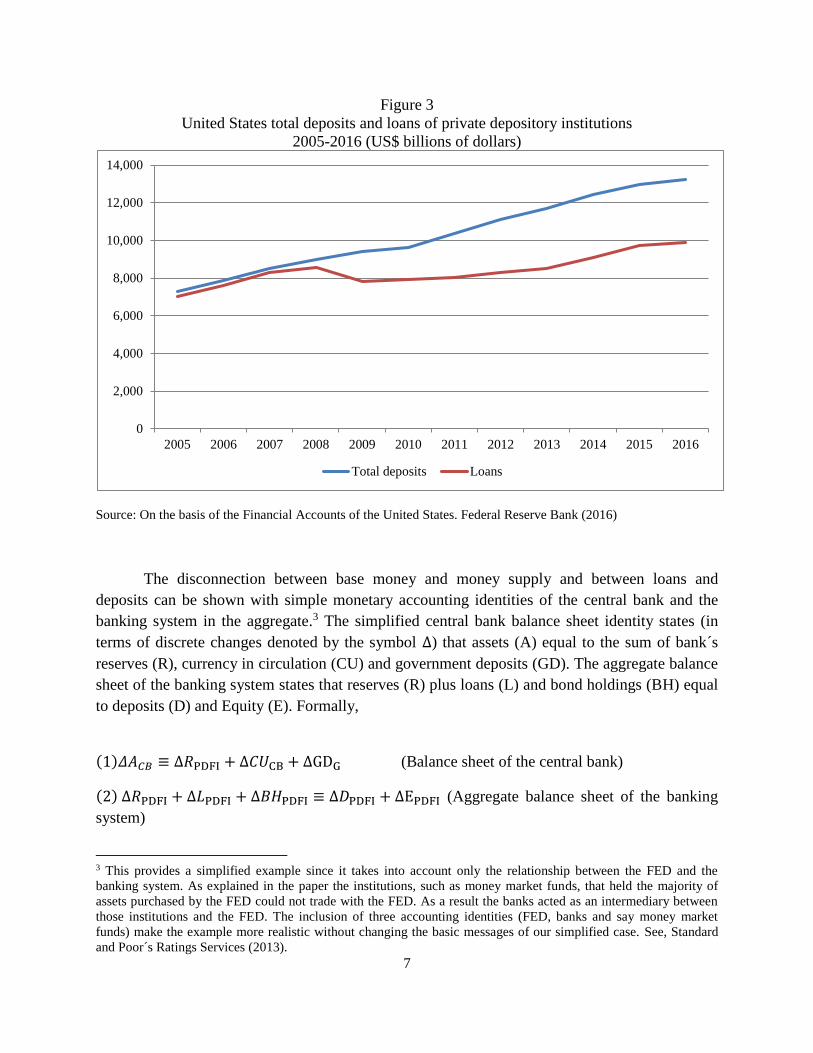
Moreover, following QE, not only was the monetary base (MB) disconnected from the
money supply (MS), but also the stock of loans became disconnected from banking deposits. As
shown in Figure 2, between 2005 and 2007, the growth in deposits kept pace with that of loans.
However, after 2008 there is a clear disconnect between loans and deposits as the latter clearly
out spaced the former.
2 See, https://fred.stlouisfed.org/series/MULT. As the end of 2016, the value of the M1 multiplier was still below
one.
7
Figure 3
United States total deposits and loans of private depository institutions
2005-2016 (US$ billions of dollars)
Source: On the basis of the Financial Accounts of the United States. Federal Reserve Bank (2016)
The disconnection between base money and money supply and between loans and
deposits can be shown with simple monetary accounting identities of the central bank and the
banking system in the aggregate.3 The simplified central bank balance sheet identity states (in
terms of discrete changes denoted by the symbol Δ) that assets (A) equal to the sum of bank´s
reserves (R), currency in circulation (CU) and government deposits (GD). The aggregate balance
sheet of the banking system states that reserves (R) plus loans (L) and bond holdings (BH) equal
to deposits (D) and Equity (E). Formally,
(1)𝛥𝐴𝐶𝐵 ≡ Δ𝑅PDFI + Δ𝐶𝑈CB + ∆GDG (Balance sheet of the central bank)
(2) Δ𝑅PDFI + Δ𝐿PDFI + Δ𝐵𝐻PDFI ≡ Δ𝐷PDFI + ∆EPDFI (Aggregate balance sheet of the banking
system)
3 This provides a simplified example since it takes into account only the relationship between the FED and the
banking system. As explained in the paper the institutions, such as money market funds, that held the majority of
assets purchased by the FED could not trade with the FED. As a result the banks acted as an intermediary between
those institutions and the FED. The inclusion of three accounting identities (FED, banks and say money market
funds) make the example more realistic without changing the basic messages of our simplified case. See, Standard
and Poor´s Ratings Services (2013).
0
2,000
4,000
6,000
8,000
10,000
12,000
14,000
2005 2006 2007 2008 2009 2010 2011 2012 2013 2014 2015 2016
Total deposits Loans

8
Where, the subscripts CB, PDFI and G, denote central bank, private depository
institutions and government respectively.
According to identity (1), for a given level of government deposits (that is assuming
∆GDLG=0), an increase in central bank assets (𝛥𝐴𝐶𝐵) must be reflected in an increase in reserves
(Δ𝑅PDFI). 4 This operation appears on the balance sheet of the financial system as a decline in
bond holdings that will be matched by an increase in its reserves at the central banks
(Δ−𝐵𝐻PDFI = ∆𝑅PDFI). As a result there is no reason to expect that an increase in the monetary
base of the central bank driven by the rise in reserves (Δ𝑅PDFI), as in the case of QE, be followed
by a concomitant increase in the deposits of the banking system (Δ𝐷LPD) and thus in the money
supply.
Also, using the same accounting logic, it can be shown that there is no reason for an
increase in the monetary base to translate into an expansion of loans. Loans are created out of the
thin air. When banks lend and increase their assets they create at the same time a concomitant
liability (a deposit) on their balance sheet. When banks are required to hold reserves these are
supplied by the central bank.5 The fact that loans create deposits and not the other way around
means that the amount of loans cannot exceed the amount of deposits. But the amount of
deposits can exceed that of loans (as shown in figure 3 above).
QE and its impact on global liquidity
QE not only had a direct impact on the creation of liquidity within the United States but also
at the world level. This is due to the fact that the financial institutions that acted as primary
dealers to the FED during the QE operations are global banks (also known as highly complex
financial institutions) and it is these global banks that drove the liquidity expansion that occurred
prior to the Global Financial Crisis (2007-2008).6
The available evidence for treasury bill auctions for QE2 show that the primary dealers
involved the global banks including, Goldman Sachs, Morgan Stanley, Barclays Capital, JP
Morgan, Credit Suisse, BNP Paribas, Royal Bank of Scotland, Deutsche Bank, Royal Bank of
Canada, Merrill Lynch, Citigroup, HSBC, UBS, Nomura, Mizuho, SG Americas, Daiwa
Securities Group, Cantor Fitzgerald, and Jefferies.7 The combined assets for this set of banks
reached US$ 13 trillion dollars in 2003 increasing to US$ 28 trillion by 2007. This represented
42% and 57% of the world´s money supply (Figure 3)
4 This example is based on the FED´s balance sheet. During the implementation of QE government deposits did not
vary significantly. The items that changed the most are reserves of depository institutions and Federal Reserve notes
in circulation. These increased from US$ 867 billion to 1.2 trillion between the end of 2008 and the beginning of
2014. 5 This is the Post Keynesian argument that money supply is endogenous. See for example Lavoie (2016). 6 This period has been termed by Shin (2016) as the first phase of global liquidity. 7 See Song and Zhou (2014).

9
Figure 4
Global broad money supply, assets of commercial banking primary dealers (US$ trillion dollars),
and share of primary dealers´ assets in global broad money supply (%) (2003-2012)
Source: On the basis of Bloomberg (2016) and Chung at al. (2014)
Table 2 shows that the combined deposits of these financial institutions increased in line
with the behavior of aggregate deposits. Moreover their combined deposits represented more
than 70% of the system´s total deposits in 2010 and 2011.
42.0
57.1
51.348.2
13
2926 27
30
5050
55
0.0
10.0
20.0
30.0
40.0
50.0
60.0
0.0
10.0
20.0
30.0
40.0
50.0
60.0
2003 2007 2010 2012
US$
tri
lion
Pe
rce
nta
ges
PDs share of global broadmoney (%)
Primary dealers (PD) (US$trillion)
Global Broad Money (US$trillion)

10
Table 2
United States. Comparison between total deposits of private depository institutions and deposits of primary dealers of Treasury
Securities (2008-2015)
Year
Total deposits of
private
depository
Institutions of
the US
US$ billions
Total
deposits of
primary
Dealers
US$ billions
Change in
total
deposits of
private
depository
Institutions
of the US
US$
billions
Change in total deposits
of primary dealers
US$ billions
Change in the deposits of
primary dealers as % of
the change total deposits
Deposits of primary dealers as % of
total deposits
2008 8,969.8 7,030.2 … … … 78.4
2009 9,423.1 7,103.5
453.3
73.3
16.2
75.4
2010 9,620.1 7,200.8
650.3
170.6
26.2
74.9
2011 10,380.8 7,638.9
1,411.0
608.7
43.1
73.6
2012 11,093.0 8,038.8
2,123.2
1,008.5
47.5
72.5
2013 11,695.1 8,336.8
2,725.3
1,306.6
47.9
71.3
2014 12,460.9 7,974.3
3,491.1
944.1
27.0
64.0
2015 12,963.8 7,691.3
3,994.0
661.0
16.6
59.3
Source: On the basis of the Financial Accounts of the United States. Federal Reserve Bank (2016) and Bloomberg (2016).

11
The impact of QE policies on global bank liquidity was reinforced by two other factors.
First, after the Global Financial Crisis, global banks followed a significant process of
deleveraging. This is illustrated in figure 4 and in the annex which show leverage for the major
global banks of the United States and Europe for the period 2000 to 2015 (see annex). whose
assets amount to US$ 70 trillion dollars.
Figure 5 shows that from 2000 to 2007 leverage in US banks increased on average from
15.73 to 20.84 decreasing to 10.53 by 2015. European banks follow a similar path. From 2000 to
2008, European banks increased their average leverage from 18.48 to 28.27 and then decreased
their average leverage to 16.95 in 2015.
Figure 5
Average leverage of global banks in USA and Europe for 2000, 2007 and 2015
Source: authors´ own on the basis of Bloomberg (2016)
Second, in line with FED policies, other major central banks in the world including the
European Central Bank (ECB) and the Bank of Japan (BOJ) also witnessed a significant increase
in banks´ reserves. Figure 6 shows the evolution of reserves of private depository institutions at
the Federal Reserve, the ECB and the Bank of Japan. In all three cases the stock of reserves
increased after the start of quantitative easing (QE) in the United States.
15.73
18.48
20.84
28.27
10.53
16.95
0
5
10
15
20
25
30
USA Europe
2000 2007 2015

12
Figure 6
Reserves at the Federal Reserve, European Central Bank and Bank of Japan (January 2000-January 2016, monthly data, seasonally adjusted in billions of US$, Euro$ and Yen$)
Source: On the basis of Federal Reserve, European Central Bank and Bank of Japan Data.
The increased stock of reserves coupled with the deleveraging by global banks produced
a decline in bank lending throughout the world. The available data shows that between 2001-
2008 and 2010-2015, the rate of growth of cross-border bank lending declined from an average
of 14.6%, 16.7%, 16.0% to 7.5%, -1.0%, and 4.8%, for the United States, Euro Zone and Japan
(Figure 7).
Figure 7
Rate of growth of bank lending for the United States, Euro Zone and Japan
2001-2008, 2008-2009 and 2010-2015 (In percentages)
Source: On the basis of BIS (2016a)
0
50
100
150
200
250
300
350
0
20,000
40,000
60,000
80,000
100,000
120,000
140,000
160,000
20
00
-01
-01
20
01
-03
-01
20
02
-05
-01
20
03
-07
-01
20
04
-09
-01
20
05
-11
-01
20
07
-01
-01
20
08
-03
-01
20
09
-05
-01
20
10
-07
-01
20
11
-09
-01
20
12
-11
-01
20
14
-01
-01
20
15
-03
-01
20
16
-05
-01
US
$,
Eu
ro b
illi
on
s
Yen
$ b
illi
on
s
Japan (Yen$ billions)
USA (US$ billions)
Europe (EU$ billions)
14.6
-3.3
7.5
16.7
-8.4
-1.0
16.0
-17.5
4.8
-20
-15
-10
-5
0
5
10
15
20
2001-2008 2008-2009 2010-2015
Rat
e o
f var
iati
on (
%)
United States Euro Zone Japan
Start of QE in the US

13
QE and portfolio rebalancing effects
QE policies not only affected the levels of global liquidity but also its composition
through the portfolio rebalancing channel. Portfolio rebalancing refers to a decline in the risk
premium (the difference between the expected return on an asset and the risk free rate of interest)
of an asset produced by changes in its net supply.
In the case of treasury bonds the risk premium is mainly explained by the term premium,
i.e., the excess return that investors require to bear the interest rate risk of holding long-term
bonds instead of a series of short-term bonds. Long-term bond prices have a higher sensitivity to
interest rate changes than short-term bonds.
The fall in the term premium is reflected in the decline in the long-term yields of treasury
bills and also, eventually, in the yields on other assets thus bidding up their prices. In this way
the portfolio rebalancing effect leads to decline in interest rates throughout a broad range of
assets (including corporate bonds and equities) easing financial conditions in the economy and
aggregate spending through increased long-term borrowing and wealth and balance sheet effects
(Beckworth and Hendrickson, 2011; Bernanke, 2013).
The portfolio rebalancing effect is compatible with different theories and is associated
more recently with the preferred-habitat theory (Nelson, 2011). This theory holds that investors
are risk averse, markets are segmented and that assets are imperfect substitutes (investors have a
preference for assets with given maturities).8 Under these conditions a purchase program such as
that undertaken by the Federal Reserve for an asset with a long-duration such as a treasury bill or
fixed income security creates a shortage for the “local supply” of that asset with that given
maturity (´the market for that assets clears at a lower equilibrium quantity and higher price (i.e.,
lower yield”) D´Amico et al., 2012). In turn the resulting change in relative rates of return leads
investors to substitute low yielding assets with higher yields (Gagnon at al. 2011).
The evidence regarding the portfolio channel is mixed. Nonetheless a number of studies
show a negative relationship between LSAP and the treasury term premium and a positive
relation between LSAP and the return on other assets including bonds in general, corporate
bonds and, to some extent, also commodities. In fact the available evidence indicates that the
LSAP gave a boost to the bond market.
8 As put by Kohn (2009, p. 4): “…the degree to which assets of different types and maturities are imperfect
substitutes is central to understanding the large-scale asset purchase…of the Federal Reserve.”

14
Figure 8
Barclays and Merrill Lynch Bond Indices, S&P 500 total return index, Treasury Bill return
index, total return on commodities (January 2008-January 2016).
Source: FRED (2016)
Figure 8 above computes the evolution of indices for the returns on bonds (Barclays Capital and
Merrill Lynch), stock market (S&P 500), commodities and treasury bills for the period running
from January 2008 to January 2016 on a monthly basis and normalized at 100 in 2007. The data
show a declining trend in the Treasury bill index. The index fell by 51% between both data
points. At the same time both the Barclays and Merrill Lynch bond indices rose by 51%.
This finding is consistent with McKinsey and Company (2013) who find that between
2007 and 2012 the aggregate bond index increased, on average, by 37%, and 29% in the United
States, the United Kingdom and in the Euro Zone respectively. Also our data show that stock
market index expanded by 61%. Finally the commodity return index increased between the end
of 2008 and the middle of 2011 and thereafter declined.
The growing importance of the international bond market
Due in part to the mechanism describe above the slack in bank lending was filled by the
global bond market. Over the past decade, between 1995 and 2014, the global bond market has
quadrupled in importance increasing its outstanding volume from US$ 20 to $86 trillion dollars.
As a result, it has also widened its gap with the global stock market. In 1995 and 2014,
the outstanding volume in the global bond market out spaced, the capitalization of the global
0
20
40
60
80
100
120
140
160
180
Jan
-08
Jul-
08
Jan
-09
Jul-
09
Jan
-10
Jul-
10
Jan
-11
Jul-
11
Jan
-12
Jul-
12
Jan
-13
Jul-
13
Jan
-14
Jul-
14
Jan
-15
Jul-
15
Barclays Capital Bond
Composite Global Index
BofA Merrill Lynch US Corp
Master Total Return Index
Value
Total Return commodities
S&P 500 Total Return Index
Treasury Bill return Index

15
equity market by US$ 2 and $20 trillion respectively. Similarly bond markets are more dynamic
than equity and have become much more important to the real economy as a source of finance.
Available data show that between 2000 and 2014 the average daily trading volume in the United
States bond expanded from US $358 to $730 billion. Contrarily the average daily trading volume
for equities was US$ 129 and $126 billion in both years respectively.
The performance of the global bond market is reflected in its growing importance as a
source of finance. Available data for the period 2000-2015 for the United States, the Euro Zone
and Japan show that their combined lending to non-residents through their respective bond
markets increased from US$ 1.8 trillion in 2000 to US$ 3 trillion at the end of 2008 reaching
US$ 6 trillion by December 2015. Since the beginning of QE policies by the FED and the
accumulation of banks reserves by the FED, the European Central Bank and the Bank of Japan,
the share of international bond markets in total lending has risen steadily from 40% to 48% of
global credit to non-residents (Figure 9).
Figure 9
Global credit to non-residents, bank lending, debt securities and United States credit to Emerging
Market Economies
March 2000-December 2015. (Quarterly Data; US$ Billions of dollars)
Source: On the basis of BIS (2016a)
0
2
4
6
8
10
12
14
Mar
-00
Oct
-00
May
-01
De
c-0
1
Jul-
02
Feb
-03
Sep
-03
Ap
r-0
4
No
v-0
4
Jun
-05
Jan
-06
Au
g-0
6
Mar
-07
Oct
-07
May
-08
De
c-0
8
Jul-
09
Feb
-10
Sep
-10
Ap
r-1
1
No
v-1
1
Jun
-12
Jan
-13
Au
g-1
3
Mar
-14
Oct
-14
May
-15
De
c-1
5
US
$ b
illi
ons
Total credit to non-residents Total Bank lending Total debt securities To EMES

16
Figure 10
Share of United States, Euro Zone and Japan in global bank lending
March 2000-December 2015. (Quarterly Data; In percentages)
Source: On the basis of BIS (2016a)
The growth of the global bond market is a result of an increase in both the sovereign and
corporate segments. Available evidence shows that between 2000 and 2015, the market size of
the sovereign and corporate debt markets expanded from US$ 14 to $41 and $19 to 46$ trillion
dollars respectively. Developed economies account for the lion´s share of both bond markets.
Developed economies account for global bond market (99% and 97% of the total) and
from 92% of the global corporate bond market. However, within developed economies, the
global bond market has become less concentrated over time (i.e. it has become more ´truly´
global). In 1995, the United States held 80% of the volume outstanding in the global bond
market (followed by the United Kingdom with 8%). In 2014, the United States reduced its
participation to 57% and other developed economies such as the United Kingdom and especially
Japan increased their share of the global bond market (10% and 13% respectively for 2014).
Similarly the United States reduced its share of the global corporate bond market from 51% in
2004 to 44% in 2013. The disparity in the share of developed and developing economies bond
market narrows when the comparison excludes financial firms.
However, developing economies have increased their participation in total and
international debt securities. Between 2000 and 2014 emerging market economies increased their
stock of total and international from roughly 500 and 600 US$ billion to roughly US$ 7 and 4
30
35
40
45
50
55
60
Mar
-00
Oct
-00
May
-01
De
c-0
1
Jul-
02
Feb
-03
Sep
-03
Ap
r-0
4
No
v-0
4
Jun
-05
Jan
-06
Au
g-0
6
Mar
-07
Oct
-07
May
-08
De
c-0
8
Jul-
09
Feb
-10
Sep
-10
Ap
r-1
1
No
v-1
1
Jun
-12
Jan
-13
Au
g-1
3
Mar
-14
Oct
-14
May
-15
De
c-1
5
Per
centa
ges
United States Euro Zone Japan

17
trillion respectively. Nonetheless in terms of relative importance the share of developing
countries is much higher in the international than in the global debt market (13% and 16% of the
international bond market and 1.5% and 8.3% of the global bond market for 2000 and 2014.
An analysis of the available data by developing region shows that Asia and the Pacific,
and Latin America and the Caribbean, have the largest shares of outstanding international debt
issues followed by developing Europe (36%, 30% and 20% of the total respectively for 2014). A
more detailed analysis encapsulated in figure 11 shows that, consistently with the analysis
developed in the above sections, both regions increased significantly their stock of international
debt securities following the implementation of QE.
Figure 11
Stock of international debt issues of Asia and the Pacific and Latin America and the Caribbean
(December 2000-June 2015). In US$ billion dollars.
Source: On the basis of BIS (2016b)
At the country level the most important issuers of international debt include China,
Brazil, Russia, Mexico, South Korea, Turkey and India (16%, 12%, 9%, 7%, 7%, 4% and 3% of
the total).
The decomposition at the sector level also shows that there are clear common regional
trends, but also, significant differences among the different developing regions. In all cases, the
government sector has lost relative importance as an issuer of international securities. Between
2000 and 2014, the share of the stock of international securities held by the government declined
from 72%, 45%, 81.7% and 19.3% to 34.8%, 24.7%, 45.2% and 11.3% of the total for Latin
America, Africa and the Middle East, Europe and Asia and the Pacific respectively.
0
200
400
600
800
1,000
1,200
Dec
.00
Jun
.01
Dec
.01
Jun
.02
Dec
.02
Jun
.03
Dec
.03
Jun
.04
Dec
.04
Jun
.05
Dec
.05
Jun
.06
Dec
.06
Jun
.07
Dec
.07
Jun
.08
Dec
.08
Jun
.09
Dec
.09
Jun
.10
Dec
.10
Jun
.11
Dec
.11
Jun
.12
Dec
.12
Jun
.13
Dec
.13
Jun
.14
Dec
.14
Jun
.15
Asia & Pacific Latin America & Caribbean

18
Table 3
Average share of international debt issues by developing regional by sector
2000-2014 (In percentages)
2000 2005 2010 2012 2014
Latin America
Banks 6.2 5.4 10.2 14.8 14.3
Other Financial
Corporations 6.2 13.5 18.8 19.7 20.9
Non-financial corporations 15.2 12.6 21.6 26.5 30.0
Governments 72.4 68.6 49.4 39.0 34.8
Africa & Middle East
Banks 3.2 13.9 11.9 15.2 19.3
Other Financial
Corporations 19.7 33.1 37.8 36.5 34.6
Non-financial corporations 32.0 22.6 24.7 24.1 21.4
Governments 45.1 30.4 25.5 24.2 24.7
Europe
Banks 2.0 9.5 19.5 25.5 28.6
Other Financial
Corporations 15.5 17.6 20.4 16.3 14.7
Non-financial corporations 0.8 6.2 9.6 10.1 11.4
Governments 81.7 66.7 50.6 48.1 45.2
Asia & Pacific
Banks 25.9 25.8 30.6 32.3 35.0
Other Financial
Corporations 21.2 24.9 30.9 31.8 35.2
Non-financial corporations 33.6 30.0 22.4 20.9 18.6
Governments 19.3 19.2 16.0 15.0 11.3
Source: On the basis of BIS (2016b)
Contrarily the bank sector gained in importance. Between 2000 and 2014, the share of the
stock of international debt issues increased from 6.2%, 3.2%, 2.0% and 25.9% to 14.3%, 19.3%,
28.6% and 35.0% of the total for Latin America, Africa and the Middle East, Europe and Asia
and the Pacific respectively. The sector “other financial corporations” witnessed a similar
behavior.
The most notorious differences among regions arise when analyzing the evolution of the
non-financial corporate sector. Between 2000 and 2014 its share in the total stock of outstanding
securities increased for Latin America and Europe while it decreased for Africa and the Middle

19
East and Asia and the Pacific (15.2% and 30%; 32% and 21.4%; 0.8% and 11.4%; 33.6% and
18.6% respectively). Moreover in the case of Latin America, it has become the most important
issuer of securities after the government (30% and 34.8% respectively).
In the cases of the sectors that experienced the largest debt increase, the financial sector
and the non-corporate financial sector (for Latin America) debt issuances are in their large
majority high yield and investment grade which reflects, on the demand side, “increased risk
appetite and search for yield” by international investors (Teldulkar & Hancock, 2014). As argued
above, this appetite for risk was driven, to a great extent, by QE policies.
On the supply side, high commodity prices and favorable exchange rate levels were key
determinants of the increase in the external debt of the non-financial corporate sector in the case
of Latin America. In the case of Asia, the fact that banks did not experience the sharp drops in
profitability registered in the cases of the USA and Europe following the Global Financial Crisis
(see table 4 below), may have contributed to increased debt levels in that sector.
This is reflected in the fact that for the financial sector (banks and other financial
corporations) in the case of Asia (which is the region that saw the largest increase in the stock of
debt securities of this sector) and the non-financial corporate sector (in the case of Latin
America) the stock of debt issues expanded at much greater pace following the implementation
of QE. Between 2000 and 2008 and between 2009 and 2014 the stock of international debt issues
for both of the above sectors and both regions increased by US$ 84, 72, 8 and 247, 306, 209
billion dollars.
Figure 12
Stock of international debt issues of Asia and the Pacific and Latin America and the Caribbean
(December 2000-June 2015). In US$ billion dollars.
Source: Authors´ own on the basis of BIS (2016)
0
50
100
150
200
250
300
350
400
450
Dec
.00
Sep
.01
Jun
.02
Mar
.03
Dec
.03
Sep
.04
Jun
.05
Mar
.06
Dec
.06
Sep
.07
Jun
.08
Mar
.09
Dec
.09
Sep
.10
Jun
.11
Mar
.12
Dec
.12
Sep
.13
Jun
.14
Mar
.15
Asia & Pacific (Banks)
Asia & Pacific (Other financial
corporations)
Latin America (non-financial
corporations)

20
Changes in the global financial landscape and the potential for financial instability
The monetary policy response to the global financial crisis in combination with its impact
on global banks, have had four important impacts that can contribute to financial instability.
First, the deleveraging process witnessed by global banks and other large financial
institutions was accompanied by a significant decline in their profitability levels. Table 4 below
shows the median rate of return on assets and on equity (ROA and ROE) for a representative
sample of Latin American, United States, European and Asian banks classified by asset volume
for the periods 2000-2007 and 2010-2015.
As clearly demonstrated by the data, United States and European banks show a
systematic decline in profitability for all asset levels considered between both periods. On
average, between 2000-2007 and 2010-2015, ROA decreased for United States banks from 1.2 to
0.8 and ROE from 15.5 to 7.7 (representing roughly a 50% decline in profitability). For Europe,
ROA decreased, on average, from 0.6 to 0.2 and ROE from 14.4 to 4.9 (representing roughly a
66% decline in profitability).
Moreover, in the case of the United the largest decline in profitability and more
specifically in ROE occurred in the segment of the banks with the largest asset levels (more than
US$ 1 trillion in assets and those whose volume of assets are between US$ 100 billion and US$
1 trillion). For Europe the largest decline in ROE also occurs for the largest asset holders (above
US$ 1 trillion dollars).
This state of affairs has prompted banks, and more to the point the largest banks (i.e., the
global banks) to look for alternative strategies to increase their levels of profitability. According
to the available and limited evidence banks, and more precisely global banks, have changed their
business strategy. Currently global banks have reduced the number of countries in which they
operate, their number of offices and branches and the variety of the financial products they offer.
They have also chosen to concentrate their business on the wealthiest.
But at the same time some of these institutions have increased their holdings of riskier
financial instruments such as derivatives that were central to create the financial fragility that set
the basis for the Global Financial Crisis (2008-2009). As put by Onaran (2016)
“The transformation of Citigroup, and similar changes at HSBC Holdings Plc and other
global banks, isn´t just about cutting expenses. It´s also about looking for greater returns
by focusing on their richest customers high net-worth individuals, large corporations and
institutional investors….But in servings those clients, the bank (Citigroup) has bulked up
on trading, a business that helped get it into trouble before. It doubled the amount of
derivatives contracts it has underwritten since the crisis to $56 trillion The company
which used to make most of its profits from consumer banking, now gets the majority
from corporate and investment banking.”

21
Second the greater dependency of global banks on instruments such as derivatives and on
institutions such as corporate and investment banking means has strengthened their degree of
interconnectivity. Following the methodology of Shin (2010) preliminary indicator of
interconnectedness for a sample of selected United States and European banks was computed.
The indicator shows the percentage of funding that banks obtain from within the financial
system. The computations show that prior to the Global Crisis the percentage of funding intra-
financial system was 62% for the largest 20 banks (in terms of assets) and this figure increased to
roughly 70% in the aftermath of the crisis. A similar result is obtained for the 15 largest
European banks (intra bank funding represent 63% and 68% of the total).
Table 4
Median return on assets, return on equity, and leverage, of Latin American, American, European, and
Asian banks, grouped by size of total assets for the year 2015
Latin American banksc U.S. banksd
More
than 100
billion
Between
20 billion
and 100
billion
Less than
20
billions
Moreabove
than 1
trillion
Between
100
billion
and 1
trillion
Between
25 billion
and 100
billion
Less
than 25
billion
2000-
2007a
ROA 1.9 1.3 1.6 1.0 1.2 1.3 1.2
ROE 25.4 19.4 14.0 16.7 16.1 13.9 13.2
2010-
2015
ROA 1.5 1.8 1.7 0.5 0.8 0.8 1.0
ROE 17.3 19.6 14.9 6.8 8.5 7.2 8.2
European bankse Asian banksf
More
than 1
trillion
Between
300
billion
and 1
trillion
Less than
300
billion
More than
1 trillion
Between
300
billion
and 1
trillion
Between
100
billion
and 300
billion
Less
than 100
billion
2000-
2007b
ROA 0.7 0.6 0.5 0.6 0.9 1.1 0.9
ROE 16.3 13.7 13.2 13.7 17.1 14.4 12.5
2010-
2015
ROA 0.2 0.3 0.2 1.1 1.0 0.9 0.7
ROE 4.7 5.7 4.2 17.1 14.9 11.6 9.0
a 2006-2007 for Latin American banks with total assets over US$ 100 billion b 2004-2007 for Asian banks with total assets over US$ 1 trillion, and 2003-2007 for Asian banks with total assets under US$ 1
trillion c Number of banks with total assets over US$ 100 billion: 5; Number of banks with total assets between US$ 20 billion and US$ 100
billion: 12; Number of banks with total assets under than US$ 20 billion: 23 d Number of banks with total assets over US$ 1 trillion: 7; Number of banks with total assets between US$ 100 billion and US$ 1 trillion: 12; Number of banks with total assets between US$ 20 billion and US$ 100 billion: 15; Number of banks with total assets
under than US$ 20 billion: 24 e Number of banks with total assets over than US$ 1 trillion: 9; Number of banks with total assets between US$ 300 billion and US$ 1 trillion: 13; Number of banks with total assets under US$ 300 billion: 24 f Number of banks with total assets over than US$ 1 trillion: 8; Number of banks with total assets between US$ 300 billion and US$ 1 trillion: 13; Number of banks with total assets between US$ 100 billion and US$ 300 billion: 16; Number of banks with total assets
under US$ 100 billion: 39
Source: authors´ own on the basis of Bloomberg (2016)
Third, the increasing importance of the bond market has been accompanied by a rise in
the external debt of developing economies and in particular of Asia and Latin America.

22
Available data for Asia and Latin America shows that between 2008 and 2014, their international
debt securities stock increased from US$ 342 billion to 1 trillion dollars and from US$355 to 800
billion dollars respectively (BIS, 2016b).
As explained above, at the sector level, debt affects in particular the financial sector in
the case of Asia and the non-financial corporate sector in the case of Latin America. In this
region, the non-financial corporate sector faces significant challenges as a result of the recent
sharp declines in commodity prices which remain low in comparison to the levels prevailing
prior to the Global Financial Crisis, and also due to the depreciation of local currencies.
In a context of greater indebtedness, falls in the prices of commodities affect firms
specializing in these products by increasing their financing costs and reducing their ability to
meet their obligations. The situation may be compounded yet further if they have contracted
external debt obligations secured against the commodity produced and exported. Higher costs
and lower revenues reduce profitability, and when combined with a deteriorating asset situation
this can increase the risk of default. If the response to this situation involves production and
investment cutbacks in sectors with large ramifications across the rest of the production fabric,
harmful macroeconomic consequences may ensue.
Like commodity price changes, the depreciation of local currencies can affect firms’
financial situation. Depreciation not only raises debt service costs, and thence outgoings, but also
swells liabilities by increasing the local-currency value of outstanding debt. If the collateral for
the debt is likewise denominated in local currency, depreciation will also cause this asset to lose
value. This can give rise to a mismatch such that the firm has to purchase currency to balance its
accounts. Depending on its size and importance in the market and the number of firms behaving
in this way, currency purchases can create further pressure for devaluation of the nominal
exchange rate, ultimately increasing the external debt of the firms operating in the non-tradable
goods sector.
Fourth, the importance of the international bond market has added an additional layer of
complexity to the financial system in terms of institutions, behavior and the transition
mechanism from the financial to the real economy. This is related to the nature of the financial
industry and activity underpinning the bond market, the asset management industry.
Asset management is an agency activity which consists in managing assets on behalf of
institutional or retail end-investors. This contrasts with commercial banks which act as
principals. As an agency activity clients rather than the asset manager bears responsibility for
losses and gains. Banks accept deposits with a liability of redemption at par (OFR, 2013).
Yet asset manager activities are increasingly inter-wined with those of the rest of the
financial system. As put by OFR: “…some types of asset management activities are similar to
those provided by banks and other nonbank financial companies, and increasingly cut across the
financial system in a variety of ways. For example, asset managers may create funds that can be

23
close substitutes for the money-like liabilities created by banks; they engage in various forms of
liquidity transformation…and they provide liquidity to clients and to financial markets.”
The investment vehicles of the industry include mutual funds, exchange-traded funds,
money market funds, private equity funds and their management companies (IMF, 2015). Assets
under management are roughly estimated at more than US$ 90 trillion dollars which surpasses
world GDP (roughly US$ 78 trillion) and represents more than 30% of total global assets.
The asset management industry poses a number of important risks to financial stability.
These can be classified in three broad areas: concentration and interconnectedness, illiquidity,
and pro-cyclicality.
The asset management industry is as concentrated as that of the global banks. Data
available for 2012 show that, the top 10 companies have roughly US$ 20 trillion assets under
management. By comparison for the same year the assets of the top 10 global banks are
estimated at US$ 25 trillion (Haldane, 2014). Note however that the asset management industry
is not disconnected from the global banking industry. Indeed some of the major global banks are
also the most important asset management firms. 9
The illiquidity risk is reflected in the growth of alternative as opposed to traditional
investments on the asset side of asset management firms. Alternative investments include hedge
funds, real estate, infrastructure but also commodity funds which are important for developing
economies including those of Latin America. Alternative investments represented US$3.2 trillion
in 2005 and US$ 7.2 trillion in 2013 (8% and 12% of global assets under management). More
importantly alternative investments represent 25% of the asset management revenues. It is
expected that by 2020, this share will rise to 40% of the total (Baghai et al. 2015). Similarly
specialized mutual funds (including high yield bond and emerging market funds) have witnessed
significant growth since 2008 (40% annually which is above that experienced by the global
mutual fund industry) (Haldane, 2014). The increasing importance of alternative investment in
total assets and as a generator of revenue reflects in part greater appetite for risk and search for
yield.
Pro cyclicality occurs both at the investor and at the fund manager end levels. Investors
tend to rely on evaluation strategies (such as relative return benchmarking and index tracking) in
order to ensure that managers act on the interest of the investor (Rajan 2005). Also fund
managers salaries can be linked to benchmarking and tracking performance (IMF, 2015).
These are incentives to accentuate pro cyclicality. Indeed these can lead to excessive risk
taking; to investors readjusting the composition of their portfolios according to the relative
9 The major asset manager firms include, Blackrock, Alliance, Vanguard, State Street, Fidelity, AXA, JP Morgan
Chase, Bank of New York Mellon, BNP Paribas, Deutsche Bank. JP Morgan Chase, Bank of New York Mellon,
BNP Paribas, Deutsche Bank are also some of the major global banks.

24
performance of a given fund; and to portfolio managers mimicking the behavior of their peers.10
Unrestricted redemption rights or even restricted redemption rights provide an additional source
of pro cyclicality.
10 According to estimations by the IMF (2015, p. 108) for U.S.-domiciled “70 percent of the variance of funds´
flows into assets is attributable to manager´s decisions, with the remaining 30 percent attributable to end investors.”

25
Conclusion
QE policies are of monetarist inspiration. Ben Bernanke, following Milton Friedman and
of whom he was a student, was convinced that the Great Depression was caused by monetary
forces. More specifically, he held on to the monetarist view that the key factor that converted the
1930s recession into a depression was a sharp contraction in the money base. As a result, in order
to avoid a repetition of the same event in 2008 following the collapse of Lehman Brothers and to
boost aggregate demand and growth, the Federal Reserve expanded the monetary base and
relaxed the terms on which it made credit available to the economic system.
In contrast to this view, heterodox economists such as Minsky, view lender-of-last resort
interventions as contributing to the instability that characterizes capitalist economies. Minsky
argued that while lender-of-last resort interventions (jointly with government deficits) are
necessary to abort a severe crisis, these lead to inflation (Minsky, 1986).
But he also argued that the central banks interventions lead to the acceptance of new
ways of financing activity that can be a part of the disruptive elements of the subsequent boom
(Ibid, 252).
This paper follows and expands this latter line of thought. More specifically it argues that
QE, which followed lender-of-last resort interventions, led to significant changes in the financial
system and at the same time it reinforced the old ways of financing economic activity. These are
the channels through which QE has contributed to sow the seed of future instability.
On the one hand, QE promotes the accumulation of reserves which disconnects base
money from the money supply and deposits from loans. Jointly with the deleveraging process of
global banks, quantitative easing contributed to a large extent to restrain the supply of bank
credit growth throughout the world. However, this did not deter some of the global banks to
continue to expand their trading based on opaque instruments such as derivatives.
On the other hand, by altering the relative profitability of investing in different assets, QE
had a positive effect on the performance of the international bond market. This not only spilled
into emerging market economies expanding the debt of both the financial sector and the non-
financial corporate sector but also has reinforced the role of the asset management industry in
financial markets. Due to its concentration and interconnectedness, illiquidity, and pro-
cyclicality the asset management industry poses important risks to financial stability. It also
presents an important challenge for financial regulation.

26
References
Baghai, P; Erzan, O., and Kwek, Ju-Hon (2015) The $64 trillion question: Convergence in asset
management. McKinsey & Company. February, 2015.
http://www.mckinsey.com/industries/private-equity-and-principal-investors/our-insights/the-64-
trillion-question
Beckworth, D. & Hendrickson, J.R. (2010) The Portfolio balance Channel of Monetary Policy:
Evidence from the U.S. Financial Accounts.
Bernanke, B. (2013) The Federal Reserve and the Financial Crisis. New Jersey: Princeton
University Press.
Bernanke, B. (2002) On Milton Friedman's Ninetieth Birthday Remarks by Governor Ben S.
Bernanke At the Conference to Honor Milton Friedman, University of Chicago, Chicago,
Illinois, November 8, 2002
https://www.federalreserve.gov/boarddocs/speeches/2002/20021108/
BIS (2016a) Global Liquidity Indicators.
BIS (2106b) International Debt Security Statistics.
http://www.bis.org/statistics/secstats_to1509.htm
Bloomberg (2016). Bloomberg data.
Board of Governors of the Federal Reserve System (2016) Financial Accounts of the United
States. Historical Annual Tables 2005-2015.
Borio C. (2012) The financial cycle and macroeconomics: what have we learnt? BIS Working
Papers No 395. December 2012. http://www.bis.org/publ/work395.htm
Caballero, J.; Fernández, A. & Park, J. (2016) On Corporate Borrowing, Credit Spreads and
Economic Activity in Emerging Economies. An Empirical Investigation. IDB Working paper
Series No. IDB-WP-719. https://publications.iadb.org/bitstream/handle/11319/7793/On-Corporate-Borrowing-Credit-
Spreads-and-Economic-Activity-in-Emerging-Economies-An-Empirical-
Investigation.pdf?sequence=1
Caruana, J. (2014) Global liquidity: where its stands, and why it matters. IMFS Distinguished
Lecture at Goethe University. March.
Caruana, J. (2016) Credit, commodities and currencies. Lecture at the London School of
Economics and Political Science. London, 5 February. BIS.

27
Chen., J., Mancini-Griffoli, T. & Sahay, R. (2014) Spillovers from United States Monetary
Policy on Emerging Marekts: Different This Time? IMF WP/14/240.
Choulet, C. (2015) QE and bank balance sheets: the American experience. Conjuncture. July-
August. 3-17.
Chung,K., Lee J-E., , Loukoianova, E., Park, H. and Shin, H.S. Global Liquidity through the
Lens of Monetary Aggregates . IMF Working Paper WP/14/9.
D´Amico S., English, W., López-Salido, D., and Nelson Edward (2012) The Federal Reserve´s
Large-Scale Asset Purchse Programmes: Rationale and Effects. The Economic Journal. 122
November. 415-446.
Doh, T (2010) The Efficacy of Large-Scale Asset Purchases at the Zero Lower Bound. Economic
Review. Second Quarter 2010. Federal Reserve Bank of Kansas City. Pp.3-34.
Federal Reserve Economic Data (FRED) Economic Research. Federal Reserve Bank of St.
Louis. https://fred.stlouisfed.org/
Gagnon, J., Raskin, M., Remache., J., & Sack, B. (2010) Large-Scale Asset Purchases by the
Federal Reserve: Did TheyWork?. Federal Reserve Bank of New York Staff Report N. 441.
March.
Haldane, A.G. (2014) The age of asset management?. Speech given by Andrew G. Haldane,
Executive Director, Financial Stability and member of the Financial Policy Committee At the
London Business School, London. 4 April.
http://www.bankofengland.co.uk/publications/Documents/speeches/2014/speech723.pdf
Hannoun, H. (2014). The global financial cycle and how to tame it. International Symposium of
the Banque de France “Central Banking: the way forward?” Paris 7 November, 2014. BIS
IMF (2015). Financial Stability Report. Chapter 3. The Asset Management Industry and
Financial Stability. April 2015.
Kohn, D.L. (2009) Monetary Policy Research and the Financial Crisis: Strengths and
Shortcomings. Speech at the federal Reserve Conference on Key Developments in Monetary
Policy. Washington, D.C. October. 9.
https://www.federalreserve.gov/newsevents/speech/kohn20091009a.htm
Lavoie, M. (2015) Post Keynesian Economics. New Foundations. Northhampton: Edward Elgar.
Minsky, H. (1986) Stabilizing and Unstable Economy. Yale University Press: New Haven.
Nelson, E. (2011) Friedman´s Monetary Economics in Practice. Finance and Economics
Discussion Series. Divisions of Research & Statistics and Monetary Affairs. Federal Reserve
Board, Washington D.C.

28
Nuveen Asset Management (2016) Fixed Income Perspective; Global Bonds. May. http://www.nuveen.com/Home/Documents/Default.aspx?fileId=57533
Office of financial Research (OFR) (2013) Asset management and Financial Stability. Septemebr
2013. https://www.financialresearch.gov/reports/files/ofr_asset_management_and_financial_stability.p
df
Onaran, Y. (2016) Citigroup, HBSBC Jettison Customers as Era of Global Empires End. July 26.
https://www.bloomberg.com/graphics/2016-global-banks/
Rajan, RG. (2005) Has Financial Development Made the World Riskier? Paper presented at The
Greenspan Era: Lessons for the Future. Federal Reserve Bank of Kansas Symposium, Jackson
Hole, Wyoming.
Shin, H.S. (2010) Financial intermediation and the post-crisis financial system BIS Working
Papers No 304
Shin, H.S. (2016) Global liquidity and procyclicality. World Bank Conference, “The state of
economics, the state of the world” Washington DC, 8 June.
Song, Z. and Zhu, H. (2014) QE Auctions of Treasury Bonds. Finance and Economics
Discussion Series. Divisions of Research & Statistics and Monetary Affairs. Federal Reserve
Board, Washington D.C.
Standard & Poor´s Ratings Services (2013) RatingsDirect. Repeat After Me: Banks Cannot and
Do Not Lend Out Reserves. August 13.
https://www.kreditopferhilfe.net/docs/S_and_P__Repeat_After_Me_8_14_13.pdf
Tendulkar, R and Hancock, G. (2014) Corporate Bond Markets: A Global Perspective Volume 1
April. Staff Working Paper of the IOSCO Research Department
http://www.iosco.org/research/pdf/swp/SW4-Corporate-Bond-Markets-Vol-1-A-global-
perspective.pdf

29
Annex
Figure A1 : Leverage and ROE for Global Banks in the United States (2000-2015)11
11 The source for all the figures is Bloomberg (2016)
0.00
5.00
10.00
15.00
20.00
0.00
5.00
10.00
15.00
20.00JP Morgan
Leverage ROE
ROELeverage
0.00
5.00
10.00
15.00
20.00
25.00
0.00
5.00
10.00
15.00Wells Fargo
Leverage ROE
ROELeverage
-10.00
0.00
10.00
20.00
30.00
0.00
5.00
10.00
15.00
20.00Bank fo America
Leverage ROE
ROELeverage
-40.00
-20.00
0.00
20.00
40.00
0.00
5.00
10.00
15.00
20.00
25.00Citigroup
Leverage ROE
ROELeverage
0.00
5.00
10.00
15.00
20.00
0.00
10.00
20.00
30.00 HSBC
Leverage ROE
ROELeverage
0.00
10.00
20.00
30.00
40.00
0.00
5.00
10.00
15.00
20.00
25.00Goldman Sachs
Leverage ROE
ROELeverage

30
Figure A2: Leverage and ROE for Global Banks in the Euro Zone (2000-2015)
-10.00
0.00
10.00
20.00
30.00
40.00
0.00
10.00
20.00
30.00
40.00Morgan Stanley
Leverage ROE
ROELeverage
-10.00
0.00
10.00
20.00
30.00
0.00
10.00
20.00
30.00
40.00
50.00Barclays
Leverage ROE
ROELeverage
0.00
5.00
10.00
15.00
20.00
25.00
0.00
5.00
10.00
15.00
20.00
25.00
Average of all banks in USA
Leverage ROE
ROELeverage
0.00
10.00
20.00
0.00
15.00
30.00HSBC
Leverage ROE
ROELeverage
-50.00
0.00
50.00
0.00
40.00
80.00Deutsche Bank
Leverage ROE
ROELeverage
-60.00
-30.00
0.00
30.00
0.00
20.00
40.00Royal Bank of Scoltland
Leverage ROE
ROELeverage
-10.000.0010.0020.0030.0040.00
0.00
25.00
50.00Lloyds bank
Leverage ROE
ROELeverage
-10.00
0.00
10.00
20.00
0.00
20.00
40.00Paribas France
Leverage ROE
ROELeverage
-10.00
0.00
10.00
20.00
0.00
15.00
30.00Credit Agricole France
Leverage ROE
ROELeverage

31
0.005.0010.0015.0020.0025.00
0.00
20.00
40.00Societe Generale France
Leverage ROE
ROELeverage
0.00
10.00
20.00
0.00
10.00
20.00
Banco Santander Spain
Leverage ROE
ROELeverage
0.00
5.00
10.00
0.00
15.00
30.00Groupe BPCE
Leverage ROE
ROELeverage
-30.00
0.00
30.00
0.00
15.00
30.00UniCredit Italy
Leverage ROE
ROELeverage
-70.00
-35.00
0.00
35.00
70.00
0.00
30.00
60.00
20
00
20
02
20
04
20
06
20
08
20
10
20
12
20
14
UBSAG Switzerland
Leverage ROE
ROELeverage
-20.00
0.00
20.00
40.00
60.00
0.00
25.00
50.00ING Group Netherland
Leverage ROE
ROELeverage
-30.00
-15.00
0.00
15.00
30.00
0.00
10.00
20.00
30.00
40.00Credit Suisse
Leverage ROE
ROELeverage
0.00
10.00
20.00
30.00
0.00
10.00
20.00
30.00BBVA
Leverage ROE
ROELeverage
0.00
5.00
10.00
15.00
0.00
10.00
20.00
30.00Credit Mutuel
Leverage ROE
ROELeverage

32
-20.00
-10.00
0.00
10.00
20.00
0.00
5.00
10.00
15.00
20.00
25.00Intensa SanPaolo
Leverage ROE
ROELeverage
0.00
2.00
4.00
6.00
8.00
10.00
0.00
5.00
10.00
15.00
20.00
25.00Rabobank Group Netherland
Leverage ROE
ROE
-60.00
-40.00
-20.00
0.00
20.00
0.00
10.00
20.00
30.00
40.00
50.00Commerzbank Germany
Leverage ROE
ROELeverage
-10.00
0.00
10.00
20.00
30.00
0.00
5.00
10.00
15.00
20.00Standar Chartered UK
Leverage ROE
ROELeverage
0.00
10.00
20.00
30.00
0.00
10.00
20.00
30.00Nordea Bank Sweden
Leverage ROE
ROELeverage
-10.00
-5.00
0.00
5.00
10.00
15.00
20.00
0.00
10.00
20.00
30.00
Average of all banks in Europe
Leverage ROE
ROELeverage

33
Figure A3: Leverage and ROE for Global Banks in Asia (2000-2015)
-10.00
0.00
10.00
20.00
0.00
10.00
20.00
30.00
40.00Mitsubishi Japan
Leverage ROE
Leverage ROE
-40.00
-20.00
0.00
20.00
40.00
60.00
0.00
10.00
20.00
30.00
40.00Mizuho Japan
Leverage ROE
Leverage ROE
-40.00
-20.00
0.00
20.00
40.00
0.00
10.00
20.00
30.00
40.00Sumitomo Financial Japan
Leverage ROE
ROELeverage
-20.00
-10.00
0.00
10.00
20.00
0.00
5.00
10.00
15.00
20.00
25.00Sumitomo Trust Japan
Leverage ROE
ROELeverage
0.00
5.00
10.00
15.00
20.00
25.00
0.00
5.00
10.00
15.00
20.00
25.00
Commomwealth Bank Australia
Leverage ROE
ROELeverage
0.00
5.00
10.00
15.00
20.00
25.00
0.00
5.00
10.00
15.00
20.00
25.00
Westpac Banking Corp Australia
Leverage ROE
ROELeverage
0.00
5.00
10.00
15.00
20.00
0.00
5.00
10.00
15.00
20.00
25.00National Bank Of Australia
Leverage ROE
ROELeverage
0.00
5.00
10.00
15.00
20.00
25.00
0.00
5.00
10.00
15.00
20.00
Australia & New Zealand Banking
Leverage ROE
ROELeverage
0.00
5.00
10.00
15.00
20.00
25.00
0.00
5.00
10.00
15.00
20.00
25.00Average of all banks in Asia
Leverage ROE
ROELeverage