quantitative ct for detecting covid‑19 pneumonia in
TRANSCRIPT

Lu et al. BMC Infect Dis (2021) 21:836 https://doi.org/10.1186/s12879-021-06556-z
RESEARCH ARTICLE
Quantitative CT for detecting COVID-19 pneumonia in suspected casesWeiping Lu1,2, Jianguo Wei1,2, Tingting Xu2, Miao Ding2, Xiaoyan Li2, Mengxue He2, Kai Chen2, Xiaodan Yang2, Huiyuan She3* and Bingcang Huang2*
Abstract
Background: Corona Virus Disease 2019 (COVID-19) is currently a worldwide pandemic and has a huge impact on public health and socio-economic development. The purpose of this study is to explore the diagnostic value of the quantitative computed tomography (CT) method by using different threshold segmentation techniques to distin-guish between patients with or without COVID-19 pneumonia.
Methods: A total of 47 patients with suspected COVID-19 were retrospectively analyzed, including nine patients with positive real-time fluorescence reverse transcription polymerase chain reaction (RT-PCR) test (confirmed case group) and 38 patients with negative RT-PCR test (excluded case group). An improved 3D convolutional neural net-work (VB-Net) was used to automatically extract lung lesions. Eight different threshold segmentation methods were used to define the ground glass opacity (GGO) and consolidation. The receiver operating characteristic (ROC) curves were used to compare the performance of various parameters with different thresholds for diagnosing COVID-19 pneumonia.
Results: The volume of GGO (VOGGO) and GGO percentage in the whole lung (GGOPITWL) were the most effective values for diagnosing COVID-19 at a threshold of − 300 HU, with areas under the curve (AUCs) of 0.769 and 0.769, sensitivity of 66.67 and 66.67%, specificity of 94.74 and 86.84%. Compared with VOGGO or GGOPITWL at a threshold of − 300 Hounsfield units (HU), the consolidation percentage in the whole lung (CPITWL) with thresholds at − 400 HU, − 350 HU, and − 250 HU were statistically different. There were statistical differences in the infection volume and percentage of the whole lung, right lung, and lobes between the two groups. VOGGO, GGOPITWL, and volume of consolidation (VOC) were also statistically different at the threshold of − 300 HU.
Conclusions: Quantitative CT provides an image quantification method for the auxiliary diagnosis of COVID-19 and is expected to assist in confirming patients with COVID-19 pneumonia in suspected cases.
Keywords: COVID-19, Quantitative CT, Suspected cases, Artificial intelligence, Threshold segmentation
© The Author(s) 2021. Open Access This article is licensed under a Creative Commons Attribution 4.0 International License, which permits use, sharing, adaptation, distribution and reproduction in any medium or format, as long as you give appropriate credit to the original author(s) and the source, provide a link to the Creative Commons licence, and indicate if changes were made. The images or other third party material in this article are included in the article’s Creative Commons licence, unless indicated otherwise in a credit line to the material. If material is not included in the article’s Creative Commons licence and your intended use is not permitted by statutory regulation or exceeds the permitted use, you will need to obtain permission directly from the copyright holder. To view a copy of this licence, visit http:// creat iveco mmons. org/ licen ses/ by/4. 0/. The Creative Commons Public Domain Dedication waiver (http:// creat iveco mmons. org/ publi cdoma in/ zero/1. 0/) applies to the data made available in this article, unless otherwise stated in a credit line to the data.
BackgroundCorona Virus Disease 2019 (COVID-19) is caused by severe acute respiratory syndrome coronavirus (SARS-CoV-2) [1]. It is currently a worldwide pandemic and has a huge impact on public health and socio-economic development. Real-time fluorescence reverse transcrip-tion polymerase chain reaction (RT-PCR) detection has widely been used for the diagnosis of COVID-19, but it is time consuming and its false negative rate is high [2,
Open Access
*Correspondence: [email protected]; [email protected] Department of Radiology, Gongli Hospital, 219 Miaopu Road, Pudong New Area, Shanghai 200135, China3 Department of Infectious Diseases, Gongli Hospital, 219 Miaopu Road, Pudong New Area, Shanghai 200135, ChinaFull list of author information is available at the end of the article

Page 2 of 8Lu et al. BMC Infect Dis (2021) 21:836
3]. A lung computed tomography (CT), on the other hand, is easy to perform and has a high sensitivity when diagnosing patients suspected of having COVID-19 [4], especially patients with COVID-19 who initially result negative to RT-PCR [5]. Although some radiology profes-sional organizations and societies, including the Society of Thoracic Radiology (STR), the American College of Radiology (ACR), and the Radiological Society of North America (RSNA), have recommended against perform-ing routine CT for screening and preliminary diagnosis of COVID-19 [6], they play an important role in evalu-ating severe cases and monitoring disease progression [7–9]. Ground glass opacity (GGO) and consolidation are the most common CT signs of COVID-19 pneumonia [10–12].
In addition, the artificial intelligence (AI) diagnostic system and quantitative evaluation—which is based on CT images—can help doctors quickly come up with a preliminary and differential diagnosis, assess the sever-ity of the disease and predict clinical prognosis [13–19]. The previous study has shown that deep learning-based segmentation systems are highly accurate in automati-cally delineating lesion regions (a average dice similarity coefficient of 91.6% between automatic and manual seg-mentations) and lesion percentage metrics (a mean esti-mation error of 0.3–0.8% on the validation dataset) [20].
However, the definition of GGO and consolidation in conventional CT diagnosis is based on human visual assessment, which also serves as the gold standard for AI automatic delineation training [10–12, 17]. Human visual assessment is arbitrary and can change from per-son to person and between institutes. Even if some quan-titative analysis uses a single CT threshold to segment GGO and consolidation, there is no universal standard [16, 21]. The study of using different CT thresholds to distinguish GGO and consolidation has been completed in pulmonary subsolid nodules [22, 23], but has not yet been applied to COVID-19 pneumonia. The purpose of this study is to define GGO and consolidation based on the segmentation of different CT thresholds, and to apply a quantitative analysis to determine the best parameters for distinguishing between patients with or without COVID-19 pneumonia.
MethodsStudy design and subjectsData on patients suspected of having COVID-19 from January 2020 to March 2020 in Shanghai Pudong New Area Gongli Hospital was continuously collected. According to the “Diagnosis and Treatment Protocol for Novel Coronavirus Pneumonia (Trial Version 7)” by National Health Commission of China [2], suspected cases needed to take into account epidemiological
history and clinical manifestations (fever and/or respira-tory symptoms, normal or decreased white blood cell and lymphocyte count). Inclusion criteria: chest imaging characteristics, including GGO and consolidation; epide-miological history plus any one clinical manifestation, or all two clinical manifestations (if no clear epidemiologi-cal history). Image datasets affected by respiratory arti-facts in whom image processing and analysis could not be completed were excluded. If the RT-PCR detection resulted positive in coronavirus nucleic acid, it was con-sidered a confirmed case (COVID-19 group). If two con-secutive tests gave negative results (sampling time of at least 24 h apart) and the novel coronavirus-specific anti-bodies IgM and IgG were still negative after 7 days, the case was considered excluded (non-COVID-19 group).
Acquisition of CT imagesNon-contrast enhanced CT examinations were acquired using a multidetector CT scanner with 64 detector rows (LightSpeed VCT, GE Healthcare, USA). The patients were placed in a supine position with their head enter-ing the scanner first. They then inhaled and held their breath. Their lungs—from the entrance of the rib cage to the lower edges of the costal arches on both sides—were scanned all at once. Scanning parameters: tube voltage of 120 kV, tube current of automatic milliamp, collima-tion width of 40 mm, screw pitch of 0.984, tube rotation time of 0.6 s, layer thickness of 5 mm, layer spacing of 5 mm and matrix of 512 × 512. The high-resolution algo-rithm reconstructed lung window with 1.25 mm layer thickness, 1200 Hounsfield units (HU) window width and − 600 HU window level. The soft tissue algorithm recon-structed mediastinum window with 1.25 mm layer thick-ness, 350 HU window width and 40 HU window level.
Image processing and quantitative analysisThe automatic identification and quantitative analy-sis of infection lesions (GGO and consolidation) were performed by an AI imaging diagnosis system (uAI Discover-2019nCoV, Shanghai United Imaging Intelli-gence Co., Ltd, China). The software used an improved 3D convolutional neural network (VB-Net) to segment the lung CT images, and used the human-in-the-loop (HITL) strategy to iteratively update the model. Specifi-cally, the first segmentation network based on manually contoured CT data was used as an initial model, and then the initial model was applied to the next batch of infec-tion areas, followed by manual correction. In this way of human–machine interaction, the training dataset was iteratively increased, and the final VB-Net model was built [20]. Two expert radiologists in consensus, blinded to clinical information and RT-PCR results, performed artificial contouring and correction. The software finally

Page 3 of 8Lu et al. BMC Infect Dis (2021) 21:836
realised the automatic extraction of the lungs (five lung lobes and 18 lung segments) and the lesion area. It then calculated the parameters, such as the lung lobe seg-ment volume, the infection volume, and the percentage of the infection volume in the lung lobe segment (infec-tion percentage). The CT value distribution of infection lesions was divided into the following eight thresholds: – 500 HU, – 450 HU, – 400 HU, – 350 HU, – 300 HU, – 250 HU, – 200 HU and − 160 HU [22, 23]. The part below the threshold was defined as GGO, the part above the threshold was defined as consolidation. The volume of GGO (VOGGO), GGO percentage in the whole lung (GGOPITWL), volume of consolidation (VOC), con-solidation percentage in the whole lung (CPITWL) and GGO percentage in the total lesion (GGOPITTL) were calculated (Fig. 1).
Statistical methodsMeasurement data conforming to the normal distri-bution was described as Mean ± Standard Deviation (Mean ± SD); measurement data of the skew distribu-tion was described as Median (Md) [Interquartile Range (IQR)]; and counting data was described as composition ratio. Receiver operating characteristic (ROC) curves were performed to evaluate the performance of quan-titative parameters at different CT thresholds for diag-nosing COVID-19 pneumonia. Using the VOGGO and GGOPITWL at a threshold of – 300 HU as a reference, the DeLong test was used to compare the areas under the curve (AUCs). Baseline information, quantitative CT characteristics and quantitative parameters at a threshold of – 300 HU between COVID-19 and non-COVID-19
groups were analysed using a Mann–Whitney U test for differences. All of the data was statistically analysed using the MedCalc 19.2 (MedCalc Software Ltd, Ostend, Bel-gium; https:// www. medca lc. org) software. A two-tailed p value of less than 0.05 was considered statistically significant.
ResultsBaseline information of the patientsA total of 47 cases—23 males and 24 females—aged from 13 to 81 years, with a median age of 41 years were consid-ered. Among them, 38 cases were in the non-COVID-19 group with a median age of 39 (IQR 21.5) years, a female proportion of 50% and a median time of three (IQR 4.5) days from initial symptom onset to first CT scan. Nine cases were in the COVID-19 group with a median age of 67 (IQR 19) years, a female proportion of 55.56% and a median time of three (IQR 4) days from initial symp-tom onset to first CT scan. None of the patients had undergone any treatment until the first CT examina-tion. There were statistical differences in age between the two groups, and no statistical differences in gender and time from initial symptom onset to first CT scan. See Table 1 for details.
Quantitative CT featuresIn the COVID-19 group, the infection volume and per-centage of the whole lung, right lung, right upper lobe (RUL), right middle lobe (RML), right lower lobe (RLL) were 208.70 (IQR 347.50) cm3 and 6.40% (IQR 9.85%), 146.60 (IQR 208.25) cm3 and 5.10% (IQR 13.25%), 15.60 (IQR 94.35) cm3 and 2.10% (IQR 10.95%), 2.20 (IQR
Fig. 1 AI automatic lesion extraction and quantitative analysis. a 54-years-old man with COVID-19, VOGGO, VOC, GGOPTWL and CPITWL at the threshold of – 300 HU are 147.0 cm3, 71.5 cm3, 4.5%, 2.2%, respectively; b 47-year-old man with non-COVID-19, VOGGO, VOC, GGOPITWL and CPITWL at the threshold of – 300 HU are 118.9 cm3, 6.9 cm3, 1.9%, and 0.1%, respectively

Page 4 of 8Lu et al. BMC Infect Dis (2021) 21:836
16.20) cm3 and 0.50% (IQR 5.55%), 71.40 (IQR 149.30) cm3 and 9.70% (IQR 27.10%), respectively. In the non-COVID-19 group, the above parameter values were 46.20 (IQR 103.20) cm3 and 1.10% (IQR 1.90%), 6.85 (IQR 49.43) cm3 and 0.35% (IQR 1.58%), 0.20 (IQR 2.32) cm3 and 0.00% (IQR 0.00%), 0.20 (IQR 0.50) cm3 and 0.00% (IQR 0.00%), 2.75 (IQR 31.03) cm3 and 0.25% (IQR 2.15%), respectively. The differences between the two groups were statistically significant (p values were 0.017 and 0.016, 0.003 and 0.002, 0.022 and 0.005, 0.019 and 0.008, 0.005 and 0.004, respectively). However, there was no statistical difference in the infection volume and per-centage of the left lung, left upper lobe (LUL) and left lower lobe (LLL). See Table 1 for details.
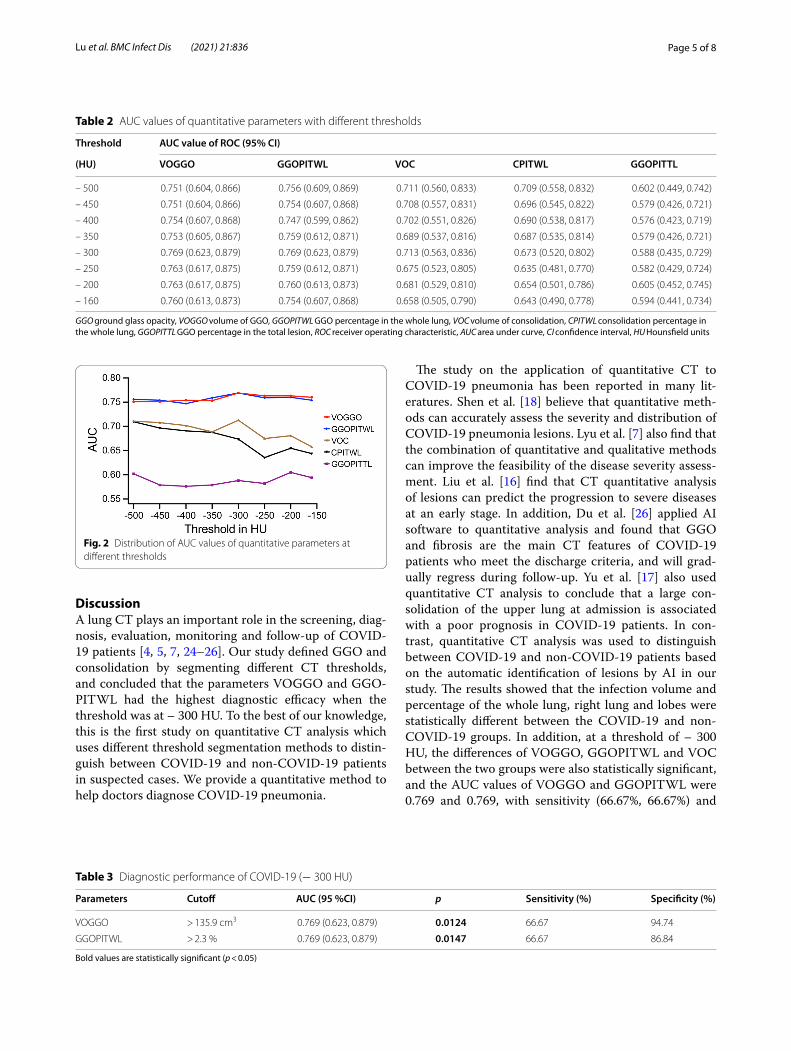
Quantitative parameter diagnostic efficacy analysisThe ROC curves of quantitative parameters VOGGO, GGOPITWL, VOC, CPITWL and GGOPITTL under eight different thresholds were drawn. An efficacy anal-ysis of the diagnosis of COVID-19 was performed and the respective AUC values were obtained (Table 2). The AUC values of VOGGO and GGOPITWL were higher than the other parameters, with the maximum value
being found at the threshold of − 300 HU (Fig. 2). The AUC value of VOGGO was 0.769 (p = 0.0124) with sen-sitivity of 66.67%, specificity of 94.74% and the best cut-off value of > 135.9 cm3; the AUC value of GGOPITWL was 0.769 (p = 0.0147) with sensitivity of 66.67%, speci-ficity of 86.84% and the best cutoff value of > 2.3% (Table 3; Fig. 3). The CPITWL at thresholds of − 400 HU, − 350 HU, and − 250 HU—compared to the AUC values of VOGGO or GGOPITWL at the threshold of − 300 HU—were statistically different, and there was no difference among others (Fig. 4).
Quantitative parameter difference analysis (threshold of – 300HU)At a threshold of – 300 HU, the differences of VOGGO (p = 0.013), GGOPITWL (p = 0.013) and VOC (p = 0.048) between the COVID-19 and non-COVID-19 group were statistically significant, while CPITWL (p = 0.096) and GGOPITTL (p = 0.417) had no statis-tical difference. See Table 4 for details and Additional file 1: Table S1 for other thresholds.
Table 1 Baseline information and quantitative CT characteristics
LUL left upper lobe, LLL left lower lobe, RUL right upper lobe, RML right middle lobe, RLL right lower lobe
Bold values are statistically significant (p < 0.05); *Indicate values of p < 0.01# Indicates Fisher’s Exact test; others indicate Mann–Whitney test
Characteristics COVID-19 (n = 9) Non-COVID-19 (n = 38) p
Age, years (Median [IQR]) 67.00 (19.00) 39.00 (21.50) < 0.001 *#Female, n (%) 5.00 (55.56) 19.00 (50.00) 1.000
Time from initial symptom onset to first CT scan, days (Median [IQR])
3.00 (4.00) 3.00 (4.50) 0.558
Infection volume (cm3), Median (IQR)
Whole lung 208.70 (347.50) 46.20 (103.20) 0.017 Left lung 29.50 (192.70) 15.75 (61.10) 0.417
LUL 8.30 (71.55) 0.85 (13.13) 0.138
LLL 21.60 (113.25) 3.95 (45.90) 0.329
Right lung 146.60 (208.25) 6.85 (49.43) 0.003*
RUL 15.60 (94.35) 0.20 (2.32) 0.022 RML 2.20 (16.20) 0.20 (0.50) 0.019 RLL 71.40 (149.30) 2.75 (31.03) 0.005*
Infection percentage (%), Median (IQR)
Whole lung 6.40 (9.85) 1.10 (1.90) 0.016 Left lung 1.80 (14.30) 0.75 (3.03) 0.283
LUL 0.80 (6.65) 0.10 (1.08) 0.085
LLL 4.00 (31.15) 0.40 (4.95) 0.167
Right lung 5.10 (13.25) 0.35 (1.58) 0.002*
RUL 2.10 (10.95) 0.00 (0.00) 0.005*
RML 0.50 (5.55) 0.00 (0.00) 0.008*
RLL 9.70 (27.10) 0.25 (2.15) 0.004*
Page 5 of 8Lu et al. BMC Infect Dis (2021) 21:836
DiscussionA lung CT plays an important role in the screening, diag-nosis, evaluation, monitoring and follow-up of COVID-19 patients [4, 5, 7, 24–26]. Our study defined GGO and consolidation by segmenting different CT thresholds, and concluded that the parameters VOGGO and GGO-PITWL had the highest diagnostic efficacy when the threshold was at – 300 HU. To the best of our knowledge, this is the first study on quantitative CT analysis which uses different threshold segmentation methods to distin-guish between COVID-19 and non-COVID-19 patients in suspected cases. We provide a quantitative method to help doctors diagnose COVID-19 pneumonia.
The study on the application of quantitative CT to COVID-19 pneumonia has been reported in many lit-eratures. Shen et al. [18] believe that quantitative meth-ods can accurately assess the severity and distribution of COVID-19 pneumonia lesions. Lyu et al. [7] also find that the combination of quantitative and qualitative methods can improve the feasibility of the disease severity assess-ment. Liu et al. [16] find that CT quantitative analysis of lesions can predict the progression to severe diseases at an early stage. In addition, Du et al. [26] applied AI software to quantitative analysis and found that GGO and fibrosis are the main CT features of COVID-19 patients who meet the discharge criteria, and will grad-ually regress during follow-up. Yu et al. [17] also used quantitative CT analysis to conclude that a large con-solidation of the upper lung at admission is associated with a poor prognosis in COVID-19 patients. In con-trast, quantitative CT analysis was used to distinguish between COVID-19 and non-COVID-19 patients based on the automatic identification of lesions by AI in our study. The results showed that the infection volume and percentage of the whole lung, right lung and lobes were statistically different between the COVID-19 and non-COVID-19 groups. In addition, at a threshold of – 300 HU, the differences of VOGGO, GGOPITWL and VOC between the two groups were also statistically significant, and the AUC values of VOGGO and GGOPITWL were 0.769 and 0.769, with sensitivity (66.67%, 66.67%) and
Table 2 AUC values of quantitative parameters with different thresholds
GGO ground glass opacity, VOGGO volume of GGO, GGOPITWL GGO percentage in the whole lung, VOC volume of consolidation, CPITWL consolidation percentage in the whole lung, GGOPITTL GGO percentage in the total lesion, ROC receiver operating characteristic, AUC area under curve, CI confidence interval, HU Hounsfield units
Threshold AUC value of ROC (95% CI)
(HU) VOGGO GGOPITWL VOC CPITWL GGOPITTL
– 500 0.751 (0.604, 0.866) 0.756 (0.609, 0.869) 0.711 (0.560, 0.833) 0.709 (0.558, 0.832) 0.602 (0.449, 0.742)
– 450 0.751 (0.604, 0.866) 0.754 (0.607, 0.868) 0.708 (0.557, 0.831) 0.696 (0.545, 0.822) 0.579 (0.426, 0.721)
– 400 0.754 (0.607, 0.868) 0.747 (0.599, 0.862) 0.702 (0.551, 0.826) 0.690 (0.538, 0.817) 0.576 (0.423, 0.719)
– 350 0.753 (0.605, 0.867) 0.759 (0.612, 0.871) 0.689 (0.537, 0.816) 0.687 (0.535, 0.814) 0.579 (0.426, 0.721)
– 300 0.769 (0.623, 0.879) 0.769 (0.623, 0.879) 0.713 (0.563, 0.836) 0.673 (0.520, 0.802) 0.588 (0.435, 0.729)
– 250 0.763 (0.617, 0.875) 0.759 (0.612, 0.871) 0.675 (0.523, 0.805) 0.635 (0.481, 0.770) 0.582 (0.429, 0.724)
– 200 0.763 (0.617, 0.875) 0.760 (0.613, 0.873) 0.681 (0.529, 0.810) 0.654 (0.501, 0.786) 0.605 (0.452, 0.745)
– 160 0.760 (0.613, 0.873) 0.754 (0.607, 0.868) 0.658 (0.505, 0.790) 0.643 (0.490, 0.778) 0.594 (0.441, 0.734)
Fig. 2 Distribution of AUC values of quantitative parameters at different thresholds
Table 3 Diagnostic performance of COVID-19 (− 300 HU)
Bold values are statistically significant (p < 0.05)
Parameters Cutoff AUC (95 %CI) p Sensitivity (%) Specificity (%)
VOGGO > 135.9 cm3 0.769 (0.623, 0.879) 0.0124 66.67 94.74
GGOPITWL > 2.3 % 0.769 (0.623, 0.879) 0.0147 66.67 86.84

Page 6 of 8Lu et al. BMC Infect Dis (2021) 21:836
specificity (94.74%, 86.84%) for diagnosing COVID-19 pneumonia.
There is currently no universal standard for defining CT thresholds for GGO and consolidation. Scholten et al. [22] find that, compared with manual measurements, the semi-automatic measurement of solid components in pulmonary subsolid nodules at a threshold of – 300 HU has very good sensitivity (90%) and specificity (88%). The study of Cohen et al. [23] shows that at a threshold of – 350 HU, the solid components of pulmonary sub-solid nodules that automatically segment have no obvi-ous difference from a pathology. The two most effective parameters (VOGGO and GGOPITWL) for diagnosing COVID-19 pneumonia in this study are at a threshold of
– 300 HU, which is the same as the segmentation thresh-old studied by Scholten et al.
This study has the following limitations: first, this is a small sample and single-center study, with age differences between COVID-19 and non-COVID-19 patients, which requires further proper validation in another large scale database; second, GGO and consolidation change with the progression of the disease course [8, 9], but this study fails to carry out a stratified analysis based on the disease development; third, all quantitative analysis is performed on the basis of AI segmentation of lung CT images and automatic extraction of lesions. Therefore, a larger data-set training is required to improve the accuracy of AI.
ConclusionsQuantitative CT is a promising tool for detecting COVID-19 pneumonia in suspected cases, especially when the CT threshold is at – 300 HU, the quantitative
Fig. 3 ROC curve analysis for performance of VOGGO and GGOPITWL in diagnosing COVID-19
Fig. 4 Comparison of AUC values. a Comparison between quantitative parameters at different thresholds with VOGGO at a threshold of – 300 HU; b Comparison between quantitative parameters at different thresholds with GGOPTWL at a threshold of – 300HU
Table 4 Comparison of quantitative parameters between COVID-19 and non-COVID-19 (− 300 HU)
All of data show Median (IQR)
Bold values are statistically significant (p < 0.05)# Indicates Mann–Whitney test
Parameters COVID-19 (n = 9) Non-COVID-19 (n = 38) p#
VOGGO (cm3) 156.80 (320.45) 37.90 (86.68) 0.013GGOPITWL (%) 4.20 (8.30) 0.90 (1.75) 0.013VOC (cm3) 23.60 (52.00) 4.85 (15.10) 0.048CPITWL (%) 0.60 (1.70) 0.10 (0.43) 0.096
GGOPITTL (%) 0.91 (0.16) 0.94 (0.17) 0.417

Page 7 of 8Lu et al. BMC Infect Dis (2021) 21:836
parameters VOGGO and GGOPITWL have a higher specificity in the diagnosis of COVID-19 pneumonia.
AbbreviationsCOVID-19: Corona Virus Disease 2019; SARS-CoV-2: Severe acute respira-tory syndrome coronavirus; RT-PCR: Reverse transcription polymerase chain reaction; CT: Computed tomography; AI: Artificial intelligence; GGO: Ground glass opacity; VOGGO: Volume of the GGO; GGOPITWL: Percentage of the GGO in the whole lung; VOC: Volume of consolidation; CPITWL: Consolida-tion percentages of the whole lung; GGOPITTL: GGO percentage in the total lesion; RUL: Right upper lobe; RML: Right middle lobe; RLL: Right lower lobe; LUL: Left upper lobe; LLL: Left lower lobe; HU: Hounsfield units; ROC: Receiver operating characteristic; AUC : Area under the curve.
Supplementary InformationThe online version contains supplementary material available at https:// doi. org/ 10. 1186/ s12879- 021- 06556-z.
Additional file 1: Table S1. Comparison of quantitative parameters with different thresholds between COVID-19 and non-COVID-19.
AcknowledgementsThe authors are grateful to Dr. YW for reviewing this paper and for her helpful suggestions.
Authors’ contributionsWL: Conceptualization, writing-original draft preparation. JW, TX, MD and XL: data analysis. MH, KC and XY: data collection. BH and HS: design, data interpretation, writing- reviewing and editing. All authors read and approved the final manuscript.
FundingThis work was supported by the Leading Talent Training Program of Pudong New Area Health and Family Planning Commission (No. PWRl2017-04), the Key Discipline Construction Project of Pudong New Area Health and Family Planning Commission (No. PWZxk2017-26) and the Science and Technology Development Fund of Pudong New Area (No. PKJ2017-Y23). The funders had no role in study design, data collection and analysis, decision to publish, or preparation of the manuscript.
Availability of data and materialsThe data and materials are available from the corresponding author on reasonable request.
Declarations
Ethics approval and consent to participateThe study complied with the declaration of Helsinki and was approved by the ethics committee of Gongli hospital. Committee’s Reference number: [2020] Pro-Trial No. (010); Informed consent was waived since the study had no risk and would not adversely affect the subjects’ rights or welfare.
Consent for publicationNot applicable.
Competing interestsThere is no conflict of interest among all the authors.
Author details1 Ningxia Medical University, Yinchuan 750004, Ningxia, China. 2 Depart-ment of Radiology, Gongli Hospital, 219 Miaopu Road, Pudong New Area, Shanghai 200135, China. 3 Department of Infectious Diseases, Gongli Hospital, 219 Miaopu Road, Pudong New Area, Shanghai 200135, China.
Received: 18 November 2020 Accepted: 10 August 2021
References 1. Guan WJ, Ni ZY, Hu Y, Liang WH, Ou CQ, He JX, Liu L, Shan H, Lei CL, Hui
DSC, et al. Clinical characteristics of Coronavirus Disease 2019 in China. N Engl J Med. 2020;382(18):1708–20.
2. Commission NH, Medicine NAoTC. Diagnosis and treatment protocol for novel coronavirus pneumonia (Trial Version 7). Chin Med J (Engl). 2020;133(9):1087–95.
3. Xie X, Zhong Z, Zhao W, Zheng C, Wang F, Liu J. Chest CT for typical coro-navirus disease 2019 (COVID-19) pneumonia: relationship to negative RT-PCR testing. Radiology. 2020;296(2):E41-5.
4. Ai T, Yang Z, Hou H, Zhan C, Chen C, Lv W, Tao Q, Sun Z, Xia L. Correlation of chest CT and RT-PCR testing for coronavirus disease 2019 (COVID-19) in China: a report of 1014 cases. Radiology. 2020;296(2):E32-40.
5. Chen D, Jiang X, Hong Y, Wen Z, Wei S, Peng G, Wei X. Can chest CT features distinguish patients with negative from those with positive initial RT-PCR results for coronavirus disease (COVID-19)? AJR Am J Roentgenol. 2021;216(1):66–70.
6. Simpson S, Kay FU, Abbara S, Bhalla S, Chung JH, Chung M, Henry TS, Kanne JP, Kligerman S, Ko JP, et al. Radiological Society of North America Expert consensus statement on reporting chest CT findings related to COVID-19. Endorsed by the Society of Thoracic Radiology, the American College of Radiology, and RSNA—Secondary Publication. J Thorac Imag-ing. 2020;35(4):219–27.
7. Lyu P, Liu X, Zhang R, Shi L, Gao J. The performance of chest CT in evaluat-ing the clinical severity of COVID-19 pneumonia: identifying critical cases based on CT characteristics. Invest Radiol. 2020;55(7):412–21.
8. Pan F, Ye T, Sun P, Gui S, Liang B, Li L, Zheng D, Wang J, Hesketh RL, Yang L, et al. Time course of lung changes at chest CT during recovery from Coronavirus Disease 2019 (COVID-19). Radiology. 2020;295(3):715–21.
9. Xiong Y, Sun D, Liu Y, Fan Y, Zhao L, Li X, Zhu W. Clinical and high-resolu-tion CT features of the COVID-19 infection: comparison of the initial and follow-up changes. Invest Radiol. 2020;55(6):332–9.
10. Chung M, Bernheim A, Mei X, Zhang N, Huang M, Zeng X, Cui J, Xu W, Yang Y, Fayad ZA, et al. CT imaging features of 2019 novel coronavirus (2019-nCoV). Radiology. 2020;295(1):202–7.
11. Shi H, Han X, Jiang N, Cao Y, Alwalid O, Gu J, Fan Y, Zheng C. Radiological findings from 81 patients with COVID-19 pneumonia in Wuhan, China: a descriptive study. Lancet Infect Dis. 2020;20(4):425–34.
12. Wu J, Pan J, Teng D, Xu X, Feng J, Chen YC. Interpretation of CT signs of 2019 novel coronavirus (COVID-19) pneumonia. Eur Radiol. 2020;30(10):5455–62.
13. Bai HX, Wang R, Xiong Z, Hsieh B, Chang K, Halsey K, Tran TML, Choi JW, Wang DC, Shi LB, et al. Artificial intelligence augmentation of radiologist performance in distinguishing COVID-19 from pneumonia of other origin at chest CT. Radiology. 2020;296(3):E156-65.
14. Li L, Qin L, Xu Z, Yin Y, Wang X, Kong B, Bai J, Lu Y, Fang Z, Song Q, et al. Using artificial intelligence to detect COVID-19 and community-acquired pneumonia based on pulmonary CT: evaluation of the diagnostic accu-racy. Radiology. 2020;296(2):E65-71.
15. Mei X, Lee HC, Diao KY, Huang M, Lin B, Liu C, Xie Z, Ma Y, Robson PM, Chung M, et al. Artificial intelligence-enabled rapid diagnosis of patients with COVID-19. Nat Med. 2020;26(8):1224–8.
16. Liu F, Zhang Q, Huang C, Shi C, Wang L, Shi N, Fang C, Shan F, Mei X, Shi J, et al. CT quantification of pneumonia lesions in early days predicts pro-gression to severe illness in a cohort of COVID-19 patients. Theranostics. 2020;10(12):5613–22.
17. Yu Q, Wang Y, Huang S, Liu S, Zhou Z, Zhang S, Zhao Z, Yu Y, Yang Y, Ju S. Multicenter cohort study demonstrates more consolidation in upper lungs on initial CT increases the risk of adverse clinical outcome in COVID-19 patients. Theranostics. 2020;10(12):5641–8.
18. Shen C, Yu N, Cai S, Zhou J, Sheng J, Liu K, Zhou H, Guo Y, Niu G. Quan-titative computed tomography analysis for stratifying the severity of Coronavirus Disease 2019. J Pharm Anal. 2020;10(2):123–9.
19. Zhang K, Liu X, Shen J, Li Z, Sang Y, Wu X, Zha Y, Liang W, Wang C, Wang K, et al. Clinically applicable AI system for accurate diagnosis, quantitative
Page 8 of 8Lu et al. BMC Infect Dis (2021) 21:836
• fast, convenient online submission
•
thorough peer review by experienced researchers in your field
• rapid publication on acceptance
• support for research data, including large and complex data types
•
gold Open Access which fosters wider collaboration and increased citations
maximum visibility for your research: over 100M website views per year •
At BMC, research is always in progress.
Learn more biomedcentral.com/submissions
Ready to submit your researchReady to submit your research ? Choose BMC and benefit from: ? Choose BMC and benefit from:
measurements, and prognosis of COVID-19 pneumonia using computed tomography. Cell. 2020;181(6):1423-33 e1411.
20. Shan F, Gao Y, Wang J, Shi W, Shi N, Han M, Xue Z, Shen D, Shi Y. Lung infection quantification of COVID-19 in CT images with deep learn-ing. arXiv e-prints. 2020. arXiv: 2003. 04655.
21. Pan F, Li L, Liu B, Ye T, Li L, Liu D, Ding Z, Chen G, Liang B, Yang L, et al. A novel deep learning-based quantification of serial chest com-puted tomography in Coronavirus Disease 2019 (COVID-19). Sci Rep. 2021;11(1):417.
22. Scholten ET, Jacobs C, van Ginneken B, van Riel S, Vliegenthart R, Oudkerk M, de Koning HJ, Horeweg N, Prokop M, Gietema HA, et al. Detection and quantification of the solid component in pulmonary subsolid nodules by semiautomatic segmentation. Eur Radiol. 2015;25(2):488–96.
23. Cohen JG, Goo JM, Yoo RE, Park CM, Lee CH, van Ginneken B, Chung DH, Kim YT. Software performance in segmenting ground-glass and solid components of subsolid nodules in pulmonary adenocarcinomas. Eur Radiol. 2016;26(12):4465–74.
24. Wang D, Hu B, Hu C, Zhu F, Liu X, Zhang J, Wang B, Xiang H, Cheng Z, Xiong Y, et al. Clinical characteristics of 138 hospitalized patients with 2019 novel coronavirus-infected pneumonia in Wuhan, China. JAMA. 2020;323(11):1061–9.
25. Bernheim A, Mei X, Huang M, Yang Y, Fayad ZA, Zhang N, Diao K, Lin B, Zhu X, Li K, et al. Chest CT findings in coronavirus disease-19 (COVID-19): relationship to duration of infection. Radiology. 2020;295(3):200463.
26. Du S, Gao S, Huang G, Li S, Chong W, Jia Z, Hou G, Wang YXJ, Zhang L. Chest lesion CT radiological features and quantitative analysis in RT-PCR turned negative and clinical symptoms resolved COVID-19 patients. Quant Imaging Med Surg. 2020;10(6):1307–17.
Publisher’s NoteSpringer Nature remains neutral with regard to jurisdictional claims in pub-lished maps and institutional affiliations.