quantitative assessment and statistical analysis of...
TRANSCRIPT

2176
ISSN 2286-4822
www.euacademic.org
EUROPEAN ACADEMIC RESEARCH
Vol. III, Issue 2/ May 2015
Impact Factor: 3.4546 (UIF)
DRJI Value: 5.9 (B+)
Quantitative Assessment and Statistical Analysis of
Hospital Waste: Comparative Study of hospitals of
Kolkata, India
Dr. SUSHMA SAHAI Assistant Professor
Department of Geography, Loreto College
Kolkata, West Bengal, India
Abstract:
A survey was conducted to assess the quantum of hospital
waste in eight government hospitals of Kolkata, West Bengal, India. A
Waste Audit was conducted wherein the different categories of hospital
waste generated was weighted. This not only provided a comprehensive
scenario of the quantum of waste but also highlighted the loopholes
within the waste management practice. There has been a paradigm
shift from curative to preventive medicine and thus research on waste
management is imperative. The problem of handling Hospital waste is
a gigantic environmental threat, which is of growing concern, unless
remedial steps are taken in right earnest and in time. Critical issues
like ignorance of the WHO guidelines on treating and disposal of
hospital waste, occupational hazards and illegal cycling of infectious
waste needs to be addressed in order to develop a rational and safe
waste management system.
Key words: Hospital waste, waste audit, occupational hazards,
illegal cycling
Introduction
The Hospital Waste management crisis is yet to receive its
much-needed attention. The danger though silent, looms over

Sushma Sahai- Quantitative Assessment and Statistical Analysis of Hospital
Waste: Comparative Study of hospitals of Kolkata, India
EUROPEAN ACADEMIC RESEARCH - Vol. III, Issue 2 / May 2015
2177
an institution which stands to treat life-threatening diseases,
which itself is metamorphosing as a vector of the same.
A large variety of infectious material is churned out in
hospitals. However, compared to the municipal waste the
quantity of Hospital waste is relatively low. Tracking of
hazardous, contaminated medical waste is often complicated by
a lack of available records on waste generation. This results
from hospital waste being mixed with non-infectious municipal
waste and from disposal of potentially hazardous waste into
sewers.
Though the Bio-medical Waste (Management and
Handling) Rules, 1998,has made it mandatory for all medical
institutions to segregate medical waste and adopt different
treatment options, the response has been lukewarm. A
significant characteristic of the modern hospital is that it has
been and will continue to be a rapidly changing institution. Not
only are the diagnostic and treatment facilities drastically
improving, but also they are witnessing an increase in the
quantum of Hospital waste generated. Today, hospitals are
facing fresh challenges in treating and disposing hospital
waste.
Location and Selection of Study Area
Once the greatest colonial city in the Orient, Kolkata was later
reviled as a cauldron of poverty, dirt, and disease. Today, it
ranks among the four major metropolis of India along with
Delhi, Mumbai, and Chennai. The largest metropolis in India,
Kolkata is a vibrant city on the move, volatile and
unpredictable. A city just about ready to burst at the seams,
Kolkata is home to more than 10 million people.

Sushma Sahai- Quantitative Assessment and Statistical Analysis of Hospital
Waste: Comparative Study of hospitals of Kolkata, India
EUROPEAN ACADEMIC RESEARCH - Vol. III, Issue 2 / May 2015
2178
Criteria for selecting Samples
Since the study area is confined to the Kolkata
Municipal Corporation (KMC) boundary, care was
taken to select hospitals from the KMC
The technique of Stratified Purposive Sampling was
used in order to categorize the hospitals into stratas
depending on their bed strength.
The stratas developed are as follows;
Table 1: Selected Hospitals and their Bed strength
NUMBER OF
BEDS
SELECTED HOSPITALS ACTUAL BED
STRENGTH
< 250 Bagha Jatin State General Hospital and
School of Tropical Medicine
100 & 150
251 – 500 Vidyasagar State General Hospital and Lady
Dufferin Victoria Hospital
256 & 274
501 – 750 Sambhunath Pandit Hospital and
M.R.Bangur State District Hospital
560 & 600
> 751 Calcutta Medical College and Hospital and
Nil Ratan Sarkar Medical College and
Hospital
1718 & 1890
Compiled by Author
All the selected hospitals are General Hospitals, which unlike
Special Hospitals generate all the different categories of
hospital waste. The chosen hospitals are located in wards,
which boast a substantial population density as and are
primarily in residential areas. This has aided the research to
study the impact of infectious hospital waste on public health.
Objectives:
The main objectives of the study are:
(1) To examine the nature of the problem of Hospital waste
(2) To undertake an inventory of the total quantum of
infectious waste generated
(3) To study the impact of patient days on the quantum of
hospital waste

Sushma Sahai- Quantitative Assessment and Statistical Analysis of Hospital
Waste: Comparative Study of hospitals of Kolkata, India
EUROPEAN ACADEMIC RESEARCH - Vol. III, Issue 2 / May 2015
2179
(4) To examine the health hazards associated with handling
of hospital waste
Hypotheses
A positive correlation exists between the patient
days (total number of patients at the last day of
each month) and the quantum of hospital waste
generated.
Methodology and Database:
Fundamentally the quality of research depends largely on a
systematic methodology, which has to be adopted in order to
achieve the stated objectives. The availability, authenticity and
the extent of primary data form the crucial base of research.
Survey Method, which is concerned with the present
scenario of waste management, was adopted in all the eight
hospitals. This process involved description, recording, analysis
and interpretation of the hospital waste management scenario
that currently exists. This constitutes the backbone of this
research, as it involved frequent visits to the hospitals,
treatment plants, disposal sites and slums in proximity to the
hospital. It also involved comparisons and attempts to discover
the cause and effect relationship.
The most integral part of the research comprises of the
primary data which was collected by frequent field visits,
interviews of experts, observation method, spot photographs,
which has made the work more authentic, novel and
contributory.
The selected hospitals were visited frequently in order to
observe, document and examine the generation, storage,
transportation, disposal and treatment of hospital waste.
Questionnaire survey was conducted in order to build a
requisite database which provided conclusive evidence, on
Sushma Sahai- Quantitative Assessment and Statistical Analysis of Hospital
Waste: Comparative Study of hospitals of Kolkata, India
EUROPEAN ACADEMIC RESEARCH - Vol. III, Issue 2 / May 2015
2180
various aspects of waste management, its treatment and
disposal methods, awareness among the target groups,
recycling of waste, etc. which in turn became a storehouse of
information.
The primary and secondary data cannot be treated in
watertight compartments, but have been seen as
complimentary to each other. They are required to be processed,
assimilated and analyzed. It has involved first treating
parameters individually but later correlating them with other
aspects whether quantitative or qualitative, which results in
adequate synthesis of the data.
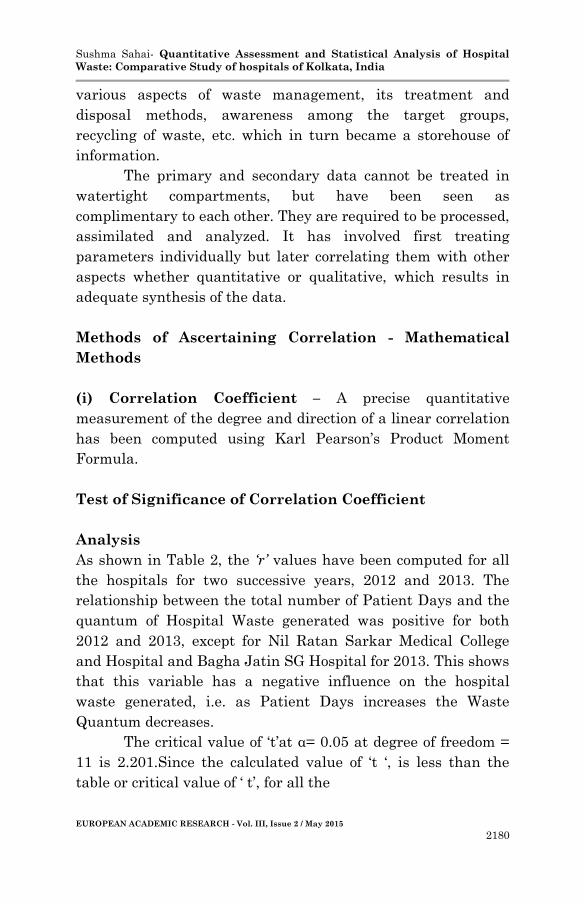
Methods of Ascertaining Correlation - Mathematical
Methods
(i) Correlation Coefficient – A precise quantitative
measurement of the degree and direction of a linear correlation
has been computed using Karl Pearson’s Product Moment
Formula.
Test of Significance of Correlation Coefficient
Analysis
As shown in Table 2, the ‘r’ values have been computed for all
the hospitals for two successive years, 2012 and 2013. The
relationship between the total number of Patient Days and the
quantum of Hospital Waste generated was positive for both
2012 and 2013, except for Nil Ratan Sarkar Medical College
and Hospital and Bagha Jatin SG Hospital for 2013. This shows
that this variable has a negative influence on the hospital
waste generated, i.e. as Patient Days increases the Waste
Quantum decreases.
The critical value of ‘t’at α= 0.05 at degree of freedom =
11 is 2.201.Since the calculated value of ‘t ‘, is less than the
table or critical value of ‘ t’, for all the

Sushma Sahai- Quantitative Assessment and Statistical Analysis of Hospital
Waste: Comparative Study of hospitals of Kolkata, India
EUROPEAN ACADEMIC RESEARCH - Vol. III, Issue 2 / May 2015
2181
hospitals, except the above mentioned two hospitals we accept
the Null hypothesis (Ho) partially. These are the only two
instances where Ho is rejected, thus committing a Type I error,
whereby though the quantum of hospital waste generated
increases with an increase in the patient days, the results for
two hospitals for one year so otherwise. The two most probable
reasons for explaining this feature would be:
1) The Daily Waste Output Register is not maintained
regularly; hence the data on total hospital waste generated
could be misleading.
2) Segregation is not carried out to its optimum level whereby
the infectious hospital waste is dumped into black bags
meant for general waste and hence not accounted for in the
total hospital waste stream. Siphoning of commercially
viable hospital waste items like syringes, surgical gloves,
dressings, etc.

Sushma Sahai- Quantitative Assessment and Statistical Analysis of Hospital
Waste: Comparative Study of hospitals of Kolkata, India
EUROPEAN ACADEMIC RESEARCH - Vol. III, Issue 2 / May 2015
2182
* 0.05 level of significance (Computed by author with aid of SPSS Version
13.0)
Table 2. Regression of the Patient Days on the Total Hospital Waste Generated
Objective: Establish a correlation between Patient Days and Hospital Waste. Regression is a means to find out how
much of the variation in the dependant variable - 'Y' can be explained as a function of the independent variable 'X
Null Hypothesis (H๐): The total Hospital Waste generated increases with an increase in the number of Patient
days.
Methodology: Coefficient of Correlation [Product Moment Formula by Karl Pearson]
Hospital Regression
Equation
Correlation
Coefficient
R² Test of
Significance
(t)
Relationship
Nil Ratan Sarkar
Medical College
and Hospital
2012 Y= 82.04+0.04*X R=. 157 R² =0.025 0.503 Positive
2013 Y= 3747.48+ -
0.05*X
R=. 412 R² =0.169 2.302 Negative
Calcutta Medical
College and Hospital
2012 Y=
1329.99+0.01*X
R=. 043 R² =0.002 0.550 Positive
2013 Y= 888.24+ 0.04*X R=. 465 R² =0.217 1.663 Positive
M.R.Bangur State
District Hospital
2012 Y= 380.38+0.06*X R=. 132 R² =0.017 0.202 Positive
2013 Y= 508.90+0.03*X R=. 067 R² =0.004 0.327 Positive
Sambhu Nath
Pandit Hospital
2012 Y= 28.63+0.05*X R=. 217 R² =0.047 0.703 Positive
2013 Y= 363.76+0.10*X R=. 457 R² =0.209 1.626 Positive
Lady Dufferin
Victoria Hospital
2012 Y= 537.83+0.19*X R=. 156 R² =0.024 0.354 Positive
2013 Y= 407.98+0.15*X R=. 760 R² =0.577 2.182 Positive
Vidyasagar State
General Hospital
2012 Y=
1959.34+0.56*X
R=. 960 R² =0.921 - 5.630 Positive
2013 Y= -
4043.28+0.92*X
R=. 874 R² =0.763 - 4.036 Positive
School Of
Tropical Medicine
2012 Y= -
3334.88+1.14*X
R=. 424 R² =0.180 1.482 Positive
2013 Y= -
5581.84+1.74*X
R=. 544 R² =0.295 2.051 Positive
Bagha Jatin
State General
Hospital
2012 Y= 88.70+0.34*X R=. 289 R² =0.083 0.126 Positive
2013 Y= 1415.53+ -
0.33*X
R=. 314 R² =0.098 2.339 Negative
Sushma Sahai- Quantitative Assessment and Statistical Analysis of Hospital
Waste: Comparative Study of hospitals of Kolkata, India
EUROPEAN ACADEMIC RESEARCH - Vol. III, Issue 2 / May 2015
2183
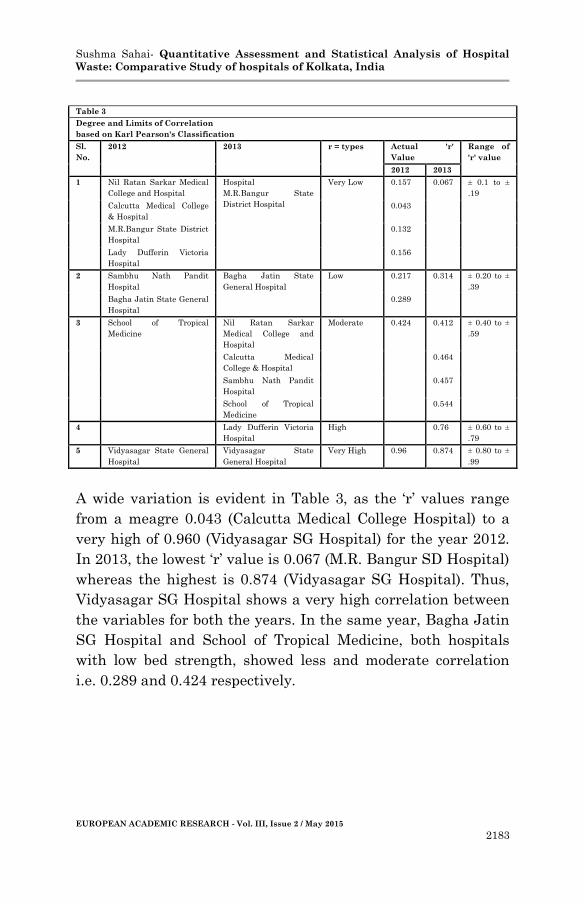
Table 3
Degree and Limits of Correlation
based on Karl Pearson's Classification
Sl.
No.
2012 2013 r = types Actual 'r'
Value
Range of
'r' value
2012 2013
1 Nil Ratan Sarkar Medical
College and Hospital
Hospital
M.R.Bangur State
District Hospital
Very Low 0.157 0.067 ± 0.1 to ±
.19
Calcutta Medical College
& Hospital
0.043
M.R.Bangur State District
Hospital
0.132
Lady Dufferin Victoria
Hospital
0.156
2 Sambhu Nath Pandit
Hospital
Bagha Jatin State
General Hospital
Low 0.217 0.314 ± 0.20 to ±
.39
Bagha Jatin State General
Hospital
0.289
3 School of Tropical
Medicine
Nil Ratan Sarkar
Medical College and
Hospital
Moderate 0.424 0.412 ± 0.40 to ±
.59
Calcutta Medical
College & Hospital
0.464
Sambhu Nath Pandit
Hospital
0.457
School of Tropical
Medicine
0.544
4 Lady Dufferin Victoria
Hospital
High 0.76 ± 0.60 to ±
.79
5 Vidyasagar State General
Hospital
Vidyasagar State
General Hospital
Very High 0.96 0.874 ± 0.80 to ±
.99
A wide variation is evident in Table 3, as the ‘r’ values range
from a meagre 0.043 (Calcutta Medical College Hospital) to a
very high of 0.960 (Vidyasagar SG Hospital) for the year 2012.
In 2013, the lowest ‘r’ value is 0.067 (M.R. Bangur SD Hospital)
whereas the highest is 0.874 (Vidyasagar SG Hospital). Thus,
Vidyasagar SG Hospital shows a very high correlation between
the variables for both the years. In the same year, Bagha Jatin
SG Hospital and School of Tropical Medicine, both hospitals
with low bed strength, showed less and moderate correlation
i.e. 0.289 and 0.424 respectively.
Sushma Sahai- Quantitative Assessment and Statistical Analysis of Hospital
Waste: Comparative Study of hospitals of Kolkata, India
EUROPEAN ACADEMIC RESEARCH - Vol. III, Issue 2 / May 2015
2184
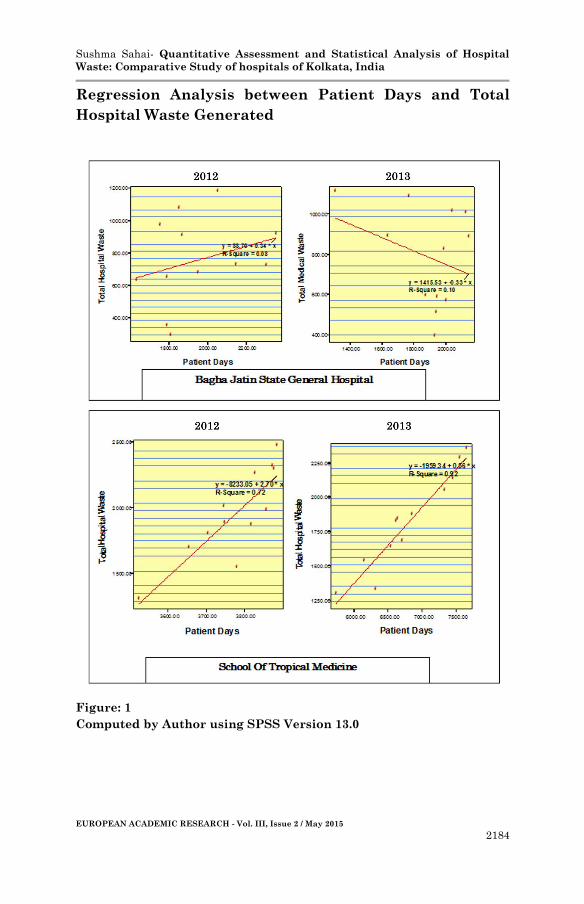
Regression Analysis between Patient Days and Total
Hospital Waste Generated
Figure: 1
Computed by Author using SPSS Version 13.0

Sushma Sahai- Quantitative Assessment and Statistical Analysis of Hospital
Waste: Comparative Study of hospitals of Kolkata, India
EUROPEAN ACADEMIC RESEARCH - Vol. III, Issue 2 / May 2015
2185
Regression Analysis between Patient Days and Total
Hospital Waste Generated
Figure: 2
Computed by Author using SPSS Version 13.0
Sushma Sahai- Quantitative Assessment and Statistical Analysis of Hospital
Waste: Comparative Study of hospitals of Kolkata, India
EUROPEAN ACADEMIC RESEARCH - Vol. III, Issue 2 / May 2015
2186
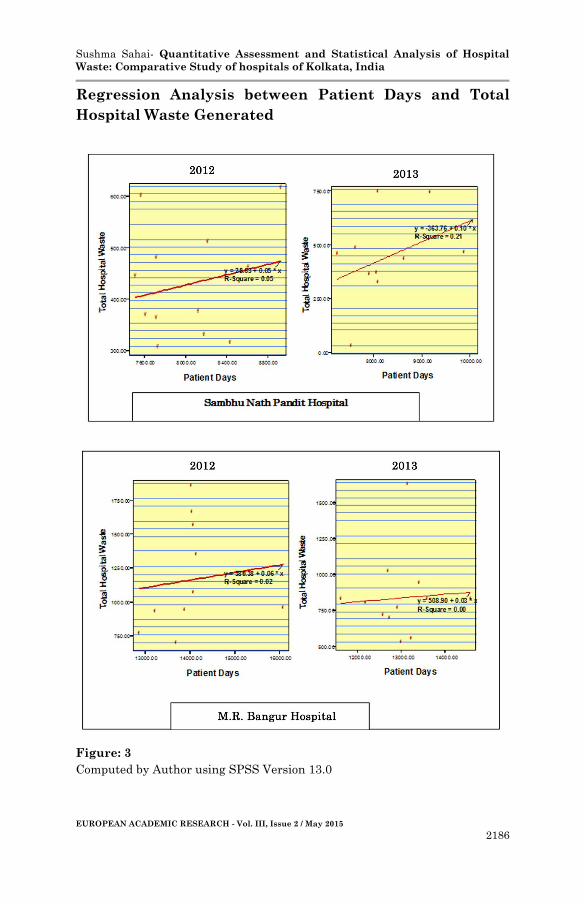
Regression Analysis between Patient Days and Total
Hospital Waste Generated
Figure: 3
Computed by Author using SPSS Version 13.0

Sushma Sahai- Quantitative Assessment and Statistical Analysis of Hospital
Waste: Comparative Study of hospitals of Kolkata, India
EUROPEAN ACADEMIC RESEARCH - Vol. III, Issue 2 / May 2015
2187
Regression Analysis between Patient Days and Total
Hospital Waste Generated
Figure: 4
Calculated by Author Using SPSS version.13.0

Sushma Sahai- Quantitative Assessment and Statistical Analysis of Hospital
Waste: Comparative Study of hospitals of Kolkata, India
EUROPEAN ACADEMIC RESEARCH - Vol. III, Issue 2 / May 2015
2188
(ii) The Coefficient of Determination – The Correlation
coefficient, ‘r’, can be interpreted in terms of r2 which is called
‘Coefficient of Determination’. This may be called as the
variance interpretation of r2. When multiplied by 100
(expressed in terms of percentage) the coefficient r2 gives us the
percentage of variance in Y, i.e. total Hospital Waste that is
associated with, determined by, or accounted for by variance in
X, i.e. Patient Days.
Table 4: Values of Coefficient of Determination & Coefficient of
Alienation for selected values of ‘r'
Computed by author
Analysis:
Table 4.6, illustrates a high range of Coefficient of
Determination of the selected eight hospitals. In Vidyasagar SG
Category Hospital Correlation
Coefficient
rxy
Coefficient of
Determination
(r²xy X 100)
Coefficient of
Non-
determination
k2=1-r²
Coefficient of
Alienation
k=√1-r²
YEAR 2012 2013 2012 2013 2012 2013 2012 2013
Small Bagha Jatin
State General
Hospital
0.289 0.314 8.35 9.86 0.917 0.902 0.958 0.95
School of
Tropical
Medicine
0.424 0.544 18 29.59 0.82 0.705 0.986 0.84
Medium Vidyasagar
State General
Hospital
0.96 0.874 92.16 76.39 0.079 0.237 0.281 0.487
Lady Dufferin
Victoria
Hospital
0.156 0.76 2.43 57.76 0.976 0.423 0.988 0.65
Big Sambhu Nath
Pandit Hospital
0.217 0.457 4.71 20.88 0.953 0.791 0.976 0.889
M.R. Bangur
State District
Hospital
0.132 0.067 1.74 0.45 0.983 0.996 0.991 0.998
Large Calcutta
Medical College
& Hospital
0.043 0.465 0.18 21.62 0.998 0.783 0.999 0.885
Nil Ratan
Sarkar Medical
College and
Hospital
0.157 0.412 2.5 16.97 0.975 0.831 0.987 0.912

Sushma Sahai- Quantitative Assessment and Statistical Analysis of Hospital
Waste: Comparative Study of hospitals of Kolkata, India
EUROPEAN ACADEMIC RESEARCH - Vol. III, Issue 2 / May 2015
2189
Hospital 92.16% of the variance in Hospital Waste quantum
has been accounted for by the variance in patient days (X
scores). The same holds true for 2013 where 76.39% of the
variance in Hospital Waste is associated with the variance in
Patient Days. On the other hand, M.R.Bangur SD Hospital
reveals that only 1.74% and 0.45% of the variance in Hospital
Waste for 2012 & 2013 respectively, is associated with Patient
Days and the remaining approximately 99% of the variations
are due to other independent variables yet to be located.
Inversely, this proportion of the variance in hospital
waste (Y) which is not associated or determined by the variance
in Patient Days (X) is expressed as K2, which is called ‘The
Coefficient of Non-Determination’. Hence the Coefficient of
Non Determination for M.R. Bangur SD Hospital is as high as
0.983 and 0.996 for 2012 & 2013 respectively. The situation is
just for hospital for Vidyasagar SG Hospital where k2 = 0.079
and 0.237 for 2012 & 2013 respectively.
Another Index derived from the same is the ‘Coefficient
of Alienation’, k,
k=√1-r2
while ‘r’ indicates the degree of relationship between two
variables, the coefficient of Alienation indicates the degree of
lack of relationship. Table 4.4 shows a high degree of
relationship between patient days and quantity of Hospital
Waste generated in 6 of the 8 hospitals under study. The
Coefficient of Alienation shows a similar tend with hospitals
like Calcutta Medical College and Hospital, Nil Ratan Sarkar
Medical College and Hospital, M.R.Bangur SD Hospital,
Sambhu Nath Pandit Hospital, Bagha Jatin SD Hospital and
School of Tropical Medicine posing very high values of
alienation for 2012 – 0.999, 0.987, 0.991, 0.976, 0.958 and 0.986
respectively. This indicates that the influence of patient days on
the quantity of Hospital Waste generated is not very strong.

Sushma Sahai- Quantitative Assessment and Statistical Analysis of Hospital
Waste: Comparative Study of hospitals of Kolkata, India
EUROPEAN ACADEMIC RESEARCH - Vol. III, Issue 2 / May 2015
2190
Discussion and Findings
Testing of Hypothesis
As per the Correlation Coefficient models the total quantity of
hospital waste generated increased with an increase in the
patient days. The hypothesis is accepted for all the hospitals
except two hospitals for two successive years. The exceptions
were N.R.S. Medical College and Hospital and Bagha Jatin
Hospital for 2013, where the quantity of hospital waste
generated decreased with an increase in the patient days,
indicated by a negatively sloping regression line. The reasons
for this exception were as follows:
Segregation was not carried out efficiently, whereby
infectious hospital waste was dumped in black bags
meant for general waste. Hence, this was not accounted
for in the total hospital waste stream, giving an
erroneous figure of waste generated by the hospital.
The Waste register was not maintained regularly and
hence there existed a vacuum in data inventory.
Commercially valuable hospital waste items like
syringes, gloves and plastic IV bottles were siphoned
from the hospital premises. Since these were illegally
scavenged before being taken for final treatment and
disposal, they were unaccounted for. The rag pickers
living in the slums adjoining the hospitals engaged in
collecting sharps, surgical gloves and dressings
discarded from the orthopaedic departments in
particular. These were then cleaned with naked hands

Sushma Sahai- Quantitative Assessment and Statistical Analysis of Hospital
Waste: Comparative Study of hospitals of Kolkata, India
EUROPEAN ACADEMIC RESEARCH - Vol. III, Issue 2 / May 2015
2191
in ordinary buckets with water and repacked in new
packets. In was evident from the questionnaire survey
that they were not aware of the health implications of
this illegal act. Due to constant handling of sharps their
limbs bore injury marks which in the long run could lead
to life threatening diseases like Hepatitis B and AIDS.
Percutaneous injuries were the most common and
frequent among health care workers, primarily from
needles and other sharps. Highest rates of occupational
injury were seen among the cleaning personnel, waste
transporters (from wards to vat), nurses and scavengers.
Two-thirds of the hospital waste was scavenged by rag
pickers who were ignorant of the adverse health
hazards. They showed visible signs of cuts and
punctures from discarded sharps.
Recommendations
A separate wing, called Hospital Waste Management
Cell, can be created in each of the hospitals, which would
maintain an inventory of waste generated ward wise and
the quantum sent for treatment and disposal.
An Infection Control Committee should be established
for imparting training. There is an urgent need to
advocate for fresh legislation, which would incorporate
occupational safety of health care workers. Their safety
is compromised as they are exposed to HIV and
Hepatitis due to irrational handling of hospital waste.
Though the use of Personal Protective Equipment (PPE)

Sushma Sahai- Quantitative Assessment and Statistical Analysis of Hospital
Waste: Comparative Study of hospitals of Kolkata, India
EUROPEAN ACADEMIC RESEARCH - Vol. III, Issue 2 / May 2015
2192
has been stressed on by WHO and the Waste Handling
and Management Act, most of the hospitals do not
practice it earnestly. Safety measures like preventive
vaccinations and health insurance should be made
mandatory in all medical institutions and form the
backbone of all policy formulations.
The civic authority should insist on proper hospital
waste management as a pre-requisite to licensing health
care set-ups (12-18 months). License should be renewed
at specific intervals of time after reviewing and
assessing the working of the system.
Train personnel from regulatory bodies along with
personal from the hospitals and clinics.
Develop health education materials both print and
electronic, like posters, books, booklets, films, videos,
slides etc. A multipronged strategy needs to be
developed and implemented regarding the optimum use
of all education material. Audio-video screening
sessions, field visits, situation analysis, problem solving,
informal interactions and module based training along
with self study should be incorporated in training
programme and Awareness campaign.
Train and certify operators to operate and maintain
equipment used for disposal.
Conclusion
Implementation of sustainable programmes for hospital waste
management would greatly depend on the degree of
responsibility, the stakeholders wish to assume in the above-
mentioned areas. It is therefore crucial that every stakeholder
including regulatory bodies, hospitals and other generators of
hospital waste and above all public recognize their role and
execute it with zeal in this crucial area of public health
protection.
Sushma Sahai- Quantitative Assessment and Statistical Analysis of Hospital
Waste: Comparative Study of hospitals of Kolkata, India
EUROPEAN ACADEMIC RESEARCH - Vol. III, Issue 2 / May 2015
2193
References:
1. Agarwal, B.L., (2001). Basic Statistics. New Age
International Private Ltd. Publishers, New Delhi, India.
2. Bisson,C.L., McRae,G., and Hollie Shaner, R.N.,(1993):
An Ounce of Prevention: Waste Reduction Strategies for
Health Care Facilities, American Hospital Association,
Chicago, USA.
3. Brown, S.L., Kjollesdal, D.E., and Lee, M.H., (1992).
Protecting Community Health: 3R’s Solutions to Health
Care Waste, Recycling Council of Ontario, Canada.
4. Maclean, R.W.,(1996). Environmental Audit- What it is
and how to organise it. Waste Audit and Pollution
Prevention Techniques. National Productivity Council,
Chicago, USA.
5. Pal, S.K.,(1998). Statistics for Geoscientists – Techniques
and Applications. Concept Publishing Company, New
Delhi, India.
6. Prasad, K.S.S.V.V.,(2000). Environmental audit- a tool
for solid waste management. Water Recycling and
Resource Management in the Developing World -
Ecological Engineering Approach. Ed. Jana.B.B.
Banerjee,R.D., Guterstam,B. and Heeb,J., India and
International Ecological Engineering Society, Wolfusen,
Switzerland.