quantitative amplicon sequencing for meta-dna analysis ... · quantitative amplicon sequencing for...
TRANSCRIPT
1
2
3
4
5
6
7
8
Quantitative Amplicon Sequencing for Meta-DNA Analysis Reveals Patterns in 9
Pollen Use by Bees 10
11
Running head: A new molecular tool for pollen analysis 12
13
AUBRIE R. M. JAMES1,2*†, MONICA A. GEBER1, and DAVID P. L. TOEWS1,3* 14
15
1 Department of Ecology and Evolutionary Biology, Cornell University, Ithaca, New York, USA 16
3Department of Biology, Pennsylvania State University, University Park, PA, USA 17
18
† Corresponding author [email protected] 19
*A.R.M. James and D.P.L. Toews contributed equally to this work 20
21
2Current Address: School of Biological Sciences, University of Queensland, St. Lucia, Queensland, Australia
.CC-BY-NC-ND 4.0 International licensewas not certified by peer review) is the author/funder. It is made available under aThe copyright holder for this preprint (whichthis version posted April 16, 2020. . https://doi.org/10.1101/2020.04.14.041814doi: bioRxiv preprint
1
ABSTRACT 22
An underdeveloped but potentially valuable molecular method in ecology is the ability to quantify 23
the frequency with which foraging pollinators carry different plant pollens. Thus far, DNA 24
metabarcoding has only reliably identified the presence/absence of a plant species in a pollen 25
sample, but not its relative abundance in a mixed sample. Here we use a system of four 26
congeneric, co-flowering plants in the genus Clarkia and their bee pollinators to (1) develop a 27
molecular method to quantify different Clarkia pollens found on foraging bees; and (2) determine 28
if bee pollinators carry Clarkia pollens in predictable ways, based on knowledge of their foraging 29
behaviors. We develop a molecular method we call quantitative amplicon sequencing 30
(qAMPseq) which varies cycling number (20, 25, 30, and 35 cycles) in polymerase chain 31
reaction (PCR), individually indexing the same samples in different cycle treatments, and 32
sequencing the resulting amplicons. These values are used to approximate an amplification 33
curve for each Clarkia species in each sample, similar to the approach of quantitative PCR, 34
which can then be used to estimate the relative abundance of the different Clarkia species in the 35
sample. Using this method, we determine that bee visitation behaviors are generally predictive 36
of the pollens that bees carry while foraging. We also show that some bees carry multiple 37
species of Clarkia at the same time, indicating that Clarkia likely compete via interspecific pollen 38
transfer. In addition to adding a ‘missing link’ between bee visitation behavior and actual pollen 39
transfer, we suggest qAMPseq as another molecular method to add to the developing molecular 40
ecology and pollination biology toolbox. 41
42
Keywords: pollination biology, bee foraging, DNA metabarcoding, molecular quantitation, 43
species interactions, pollen networks 44
45
.CC-BY-NC-ND 4.0 International licensewas not certified by peer review) is the author/funder. It is made available under aThe copyright holder for this preprint (whichthis version posted April 16, 2020. . https://doi.org/10.1101/2020.04.14.041814doi: bioRxiv preprint
2
INTRODUCTION 46
Discovering how the interactions of plants and pollinators play out is critical to understanding 47
how they mutually rely on each other, and molecular methods are an increasingly common 48
toolkit in this endeavor. In particular, identifying the source of DNA in mixed-DNA samples has 49
become increasingly popular with the development of a range of metabarcoding methods. 50
These approaches rely on single-locus PCR amplicons, leveraging the power of high-throughput 51
DNA sequencing to compare reads to a database of putative DNA sources. The applications of 52
metabarcoding are manifold, including analyses of microbiomes and diets (Sousa et al. 2019), 53
as well as environmental DNA analysis to quantify community composition (Deiner et al. 2017, 54
Sousa et al. 2019). Such molecular approaches have also recently been applied to plant 55
identification from the pollen found on bees to determine which species of flowers they have 56
visited (Wilson et al. 2010; Galimberti et al. 2014; Sickel et al. 2015; Bell et al. 2016, Bell et al. 57
2017). Historically, pollen has been identified using microscopic morphological differences to 58
distinguish different plant species (Martin and Harvey 2017). However, for some plant taxa, 59
morphological similarity of pollen between distinct species makes this method impossible. In 60
these situations, pollen grains taken from wild bees can be molecularly interrogated to identify 61
the species of plant they are from (Mitchell et al. 2009, Galliot et al. 2017, Lucas et al. 2018). 62
63
Molecular methods for identifying pollen origin have been generally restricted to making 64
inferences about the presence or absence of a source plant species from pollen (via 65
metabarcoding techniques; Bell et al. 2017). This is in part because previous methods have 66
been unable to reliably quantify relative abundance of mixed pollen samples for several 67
reasons, discussed in detail in Bell et al. (2019). One reason is that when using plastid DNA in 68
metabarcoding (e.g. Galimberti et al. 2014), it is unclear how the abundance of chloroplast DNA 69
(cpDNA) is related to overall pollen abundance; if the ratio of cpDNA and pollen grains is not 70
one-to-one, this could bias estimates of relative abundance (Richardson et al. 2015, Bell 2019). 71
.CC-BY-NC-ND 4.0 International licensewas not certified by peer review) is the author/funder. It is made available under aThe copyright holder for this preprint (whichthis version posted April 16, 2020. . https://doi.org/10.1101/2020.04.14.041814doi: bioRxiv preprint

3
Another bias of pollen metabarcoding approaches has to do with how polymerase chain 72
reaction (PCR) amplifies target markers (Bell et al. 2017). In PCR, the final concentration of 73
amplicon DNA after a full PCR protocol is not necessarily directly correlated to input DNA 74
concentration. This is because most PCR protocols will take the amplification process into the 75
“plateau phase”, usually after approximately 30 thermal cycles. At the plateau stage, amplicon 76
concentration may be a function of exhausted reaction reagents rather than original 77
concentration of input DNA - the desired information. Because of this, studies using the “plateau 78
abundance” of amplicons could be subject to PCR bias, especially in cases of low abundance 79
(rarity) in the sample. 80
81
Though the potential weakness of using PCR to quantify amplicons has been raised by previous 82
authors (e.g. Richardson et al. 2015; Bell et al 2017; Bell et al. 2019), it is still of interest to use 83
molecular methods to estimate the relative abundance of different pollen sources found in bees’ 84
scopae or corbiculae (that is, in their pollen-carrying morphological structures). This is in part 85
because understanding resource use among mutualists such as plants and pollinators is 86
fundamental to determining the extent to which they may rely on each other for population 87
persistence (Roulsten and Gooddell 2011), support ecosystem functioning (Lucas et al. 2018), 88
and mediate interspecific competition and coexistence (Johnson 2019). In fact, as Bell et al. 89
(2019) noted, the ability to molecularly determine species abundances in mixed-pollen samples 90
may be ‘groundbreaking’ for understanding plant-pollinator communities, because successful 91
pollen transport between plants determines plant seed production. 92
93
Plant-pollinator interactions can provide a predictive framework for how pollinators introduce 94
reproductive interference and/or fitness benefits to co-flowering plants (James 2020). The 95
effects of pollinator visitation on plant seed set are determined by the extent to which pollinators 96
(1) carry a mix of pollen on their bodies while foraging (constancy) and (2) carry rare versus 97
.CC-BY-NC-ND 4.0 International licensewas not certified by peer review) is the author/funder. It is made available under aThe copyright holder for this preprint (whichthis version posted April 16, 2020. . https://doi.org/10.1101/2020.04.14.041814doi: bioRxiv preprint

4
common species in their pollen balls (preference). During a single pollen collection bout, bees 98
can visit multiple flower species, a behavior known as inconstancy, or visit the same flower 99
species, known as constancy (Kunin and Iwasa 1996). Pollinator inconstancy exposes plants to 100
reproductive interference via heterospecific pollen transfer, which has been shown to drive 101
lower seed production and fitness in plants (Mitchell et al. 2009; Carvalheiro et al. 2014; Arceo-102
Gómez et al. 2019). Pollinator preference is a measure of flower choice by pollinators. If a 103
strongly competitive plant is preferred by pollinators, pollinator preference might exacerbate 104
competitive exclusion, but if a weakly competitive plant is preferred by pollinators, preference 105
could mitigate competitive exclusion. Though pollinator-mediated plant interactions are most 106
often understood through the lens of pollinator behavior, ample evidence suggests that linking 107
pollinator visitation to plant seed set is problematic: not all plant-pollinator contacts result in 108
pollen transfer (Mayfield 2001; Popic et al. 2013; Ballantyne et al. 2015, 2017; Barrios et al. 109
2016). Because of this, the relative abundances of pollen on bees could provide valuable 110
information about how pollinators mediate plant interactions. 111
112
Here, we develop and use a novel high throughput amplicon sequencing method to quantify the 113
relative abundance of different pollen sources on bee pollinators visiting a group of sympatric 114
winter annual plants in the genus Clarkia (Onagraceae). This group of plants – C. cylindrica ssp. 115
clavicarpa (Jeps.) Lewis & Lewis, C. speciosa ssp. polyantha Lewis & Lewis, C. unguiculata 116
Lindl., C. xantiana ssp. xantiana A. Gray — are sympatric in the woodland-chaparral areas of 117
the southern foothills of the Sierra Nevada mountain range (from here, we do not use their 118
subspecies epithets). The four species of Clarkia rely on a small group of bee pollinators 119
specialized on the genus Clarkia rather than any one species (MacSwain et al. 1973; Moeller 120
2005). Though these Clarkia have distinct adult phenotypes, their pollen grains are 121
morphologically indistinguishable. The Clarkia also co-occur with each other more often than 122
they occur alone in plant communities in their range of sympatry, and assemblages can contain 123
.CC-BY-NC-ND 4.0 International licensewas not certified by peer review) is the author/funder. It is made available under aThe copyright holder for this preprint (whichthis version posted April 16, 2020. . https://doi.org/10.1101/2020.04.14.041814doi: bioRxiv preprint

5
one to four species of Clarkia (Eisen and Geber 2018). Finally, Clarkia bloom much later in the 124
growing season than the vast majority of co-occurring flowering annual plants, and as such are 125
often the only flowering plants where they occur. 126
127
A previous study of the bee visitors to one of the four species of interest to this study, C. 128
xantiana, showed that though 49 species of bee visit C. xantiana, there were only 12 likely “core 129
pollinators” of the species, nine of which carry almost exclusively Clarkia pollen (Moeller 2005). 130
Studies including the other three species of Clarkia in their range of sympatry with C. xantiana 131
have found that there are three consistently common pollinator taxa in multi-species Clarkia 132
assemblages (Singh 2013, James 2020). The most common pollinator, Hesperapis regularis 133
(Melittidae) has been shown to preferentially visit C. xantiana. Preferences of bees in the 134
Lasioglossum genus (Halictidae), the second most common pollinator taxon, is unclear: they 135
have been shown to visit all Clarkia species at relatively the same rates (Singh 2014) or 136
preferentially visit C. xantiana and C. cylindrica (James, 2020). The unresolved nature of 137
Lasioglossum preferences are at least partially explained by the fact that it is difficult to identify 138
different Lasioglossum species when observing them on the wing, as in (James, 2020). Despite 139
preferences, Hesperapis regularis and Lasioglossum species visit C. cylindrica, C. unguiculata, 140
and C. xantiana regularly, and are inconstant when foraging in diverse arrays and thus likely to 141
transfer incompatible pollen between plants (James 2020). The final most-common bee 142
pollinator in the system, Diadasia angusticeps (Apidae), is behaviorally more specialized on one 143
Clarkia species, C. speciosa, and rarely visits the other species of Clarkia (Singh 2013, James 144
2020). 145
146
Critically, experimental evidence in this system has linked the behavioral inconstancy and 147
preference of pollinators with Clarkia seed production (James 2020). Clarkia speciosa exhibits 148
low pollen limitation to reproduction, which may be explained by the constancy and preference 149
.CC-BY-NC-ND 4.0 International licensewas not certified by peer review) is the author/funder. It is made available under aThe copyright holder for this preprint (whichthis version posted April 16, 2020. . https://doi.org/10.1101/2020.04.14.041814doi: bioRxiv preprint

6
behavior of Diadasia angusticeps. The other three species exhibit higher pollen limitation to 150
reproduction, which may be due to the inconstancy of Hesperapis regularis and Lasioglossum 151
sp. However, because pollinator visitation does not equate with pollen transfer, it remains 152
unknown if pollinator preference and constancy in the Clarkia system in fact determine plant 153
interactions. 154
155
The wealth of natural history knowledge and the morphological similarity of Clarkia pollens 156
make the Clarkia system ideal for developing a method that can both identify and quantify 157
different species in pollen samples. In this paper, we develop a method that we call “quantitative 158
amplicon sequencing” or “qAMPseq” to quantify the relative abundance of Clarkia pollen in 159
pollen balls from wild bees. Quantitative amplicon sequencing uses the amplification curve of 160
PCR as a backbone for quantification: it targets single nucleotide polymorphisms private to each 161
species, and then uses PCR to amplify these regions with the goal of post-amplification 162
sequencing, as in metabarcoding. Critically, PCR amplification is stopped before saturation at 163
four different times so one can estimate when each species’ amplification curve crosses a 164
critical threshold (as in quantitative PCR or qPCR; Figure 2). The estimate of when the curve 165
crosses the critical threshold point is then used to estimate the relative abundance of each 166
species in each sample. If previously-observed trends in bee behavior match what they carry in 167
their pollen balls (James 2020), then we predict the inconstant bees, Hesperapis regularis and 168
Lasioglossum sp., will carry multiple species of pollen at once. In addition, because these 169
particular bee taxa have an established behavioral preference for C. xantiana, we expect that 170
they will carry more C. xantiana than other Clarkia species. We also predict that the pollen on 171
Diadasia angusticeps will contain only C. speciosa pollen. Finally, because Hesperapis and 172
Lasioglossum sp. are the most common taxa in this region of Clarkia sympatry, we predict an 173
overall pollinator preference for C. xantiana pollen. 174
175
.CC-BY-NC-ND 4.0 International licensewas not certified by peer review) is the author/funder. It is made available under aThe copyright holder for this preprint (whichthis version posted April 16, 2020. . https://doi.org/10.1101/2020.04.14.041814doi: bioRxiv preprint

7
MATERIALS AND METHODS 176
Study Species and Field Sampling 177
The four species of Clarkia in this study are sympatric in the Kern River Canyon in Kern County, 178
California. To determine if pollinator foraging behaviors are reflected in the contents of their 179
pollen balls, we collected bees visiting Clarkia from May-June of 2014. We sampled bees in 14 180
Clarkia communities throughout the four species’ range of sympatry (Figure 1). Clarkia 181
communities varied in Clarkia species richness, and contained either one, two, or four species 182
of Clarkia (Table 1). In each community, we placed four, 20m transects through patches of 183
Clarkia. We sampled all transects in all communities between 15 May and 15 June. Each 184
community was sampled twice on different days: once in the morning (between 8AM and 12PM) 185
and once in the afternoon (between 1PM and 3:30PM). Sampling entailed walking along each 186
transect for 20 minutes and catching bees using a sweep net when they landed on Clarkia. 187
Bees were sacrificed using ammonium carbonate, and we noted the location, date, and Clarkia 188
species bees were visiting when we caught them. We stored, pinned, and identified bee 189
samples to species (or in the absence of species-level resolution, to genus) using Michener et 190
al. (1994). We then scraped the pollen contents off of all collected bees and stored each pollen 191
ball in 90% ethanol in centrifuge tubes at -20°C. 192
193
At the end of every netting period, we surveyed Clarkia floral abundance to estimate the relative 194
abundance of each species. To do so, we placed ½m2 quadrats every four meters on either side 195
of transects and counted all open flowers inside the quadrats. Relative abundance of each 196
species was calculated as the proportion of the number of flowers that were open, divided by 197
the total number of flowers we counted at the survey time. 198
199
In the summers of 2015 and 2016, we also collected pollen from each species of Clarkia for use 200
in testing our methodological design. To do so, we collected mature anthers from all four 201
.CC-BY-NC-ND 4.0 International licensewas not certified by peer review) is the author/funder. It is made available under aThe copyright holder for this preprint (whichthis version posted April 16, 2020. . https://doi.org/10.1101/2020.04.14.041814doi: bioRxiv preprint
8
species of Clarkia in various communities throughout their range of overlap. We removed pollen 202
from the anthers and stored them in the same manner that we stored pollen ball samples. 203
204
Transcriptome sequencing from greenhouse plants 205
To identify genetic markers that could distinguish the four Clarkia species, we performed 206
transcriptome sequencing from tissue obtained from Clarkia plants we grew in the greenhouse 207
(five individuals per species; n = 20). We chose to use transcriptome sequencing because it 208
was a reduced-representation genomic approach that produced long, contiguous sequences—209
as compared to ddRAD sequencing—that was necessary for us to develop subsequent 210
amplicon probes. To grow plants in the greenhouse, we first cold-stratified and germinated 211
seeds of each species of Clarkia in February 2016 in Ithaca, NY. Germinated seedlings were 212
transferred into D40L conetainers (Stuewe & Sons, Tangent, 208 Oregon, USA) with a mix of 213
50% potting soil and 50% perlite. Once in the conetainers, seedlings were bottom-watered and 214
grown in common conditions in a greenhouse for two months. We harvested seedlings for RNA 215
extraction when seedlings had more than four true leaves, but before they had started flowering 216
(March-April 2016). 217
218
The leaf tissue of seedlings was harvested and flash frozen in liquid nitrogen. To extract total 219
RNA, we first mechanically homogenized approximately 100mg of leaf tissue with a nitrogen-220
chilled mortar and pestle. We then mixed the homogenized tissue with 1mL of TRIzol and 200uL 221
chloroform, following the manufacturers guidelines for RNA isolation. We then used 200uL of 222
the isolation to a RNeasy Mini Elute silica column (Qiagen). We added 5 ul of DNAase (NEB) to 223
the final 45 uL of the final elution, and aliquoted 20 uL of NEBNext Oligo d(t)25 beads to isolate 224
mRNA from the total RNA pool. We then followed the protocol for NEBNext Ultra Directional 225
RNA Library prep kit (NEB #E7429L). Due to low mRNA yield, we modified the protocol such 226
.CC-BY-NC-ND 4.0 International licensewas not certified by peer review) is the author/funder. It is made available under aThe copyright holder for this preprint (whichthis version posted April 16, 2020. . https://doi.org/10.1101/2020.04.14.041814doi: bioRxiv preprint

9
that PCR enrichment included 30 cycles. We individually indexed the 20 samples and ran these 227
on a single lane of Illumina HighSeq, using single end 100 bp sequencing chemistry. 228
229
We combined data from the five C. speciosa individuals to generate a reference draft 230
transcriptome assembly using Trinity (Haas et al. 2013). We note here that many of our 231
sequence reads derived from likely chloroplast DNA (cpDNA). Our goal was to obtain DNA 232
markers within the nuclear genome as the presence and amount of choloroplast organelles 233
within each pollen grain is unknown. We note that future studies might instead sample non-leafy 234
tissue where possible, which will reduce the number of choloroplast reads. However, for the 235
present study, we removed these reads by initially aligning the total read pools from all 236
individuals to the chloroplast genome of a related species, Oenothera picensis (NCBI accession 237
number KX118607). From the pool of reads that did not align to the O. picensis cpDNA genome, 238
we aligned these reads from each individual to the draft C. speciosa transcriptome from above. 239
We then called SNPs using the GATK pipeline, using the same set of presets as in Toews et al. 240
(2016). We allowed for filtered out SNPs with more than 50% missing data and a minor allele 241
frequency of less than 5%. 242
243
Ideally, our goal was to identify a single genomic region that (1) we could PCR amplify and (2) 244
included derived, fixed SNPs for each species. To do this, we estimated Weir and Cockerham 245
per-SNP FST estimates from VCFTools (Danecek et al. 2011). We generated FST estimates for 246
one species compared to the other 15 individuals, and replicated this across all four species. 247
We then determined which transcriptome contig contained multiple SNPs that had FST = 1 for 248
each of the four species. We used BLAST to compare our top contig in our assembly to the 249
nucleotide database at NCBI Genbank. The top hit was a Clarkia unguiculata sequence (NCBI 250
accession number EF017402), and our contig aligned to a region that spans the 5.8S rRNA 251
gene, the internal transcribed spacer 2 gene, and the 26S rRNA gene. To amplify this region 252
.CC-BY-NC-ND 4.0 International licensewas not certified by peer review) is the author/funder. It is made available under aThe copyright holder for this preprint (whichthis version posted April 16, 2020. . https://doi.org/10.1101/2020.04.14.041814doi: bioRxiv preprint
10
across additional samples, we used the forward primer sequence 253
[TCGTCGGCAGCGTC]GTGCCTCGGAGATCATCTGT and reverse primer sequence 254
[GTCTCGTGGGCTCG]GCCGTGAACCATCGAGTCTTT, with the brackets indicating the 255
portion of the sequence (P5 and P7, respectively) that would align to our dual-indexed (i5 and 256
i7) adaptors. 257
258
A note on TaqMAN Probe Sensitivity 259
Our method of quantitative amplicon sequencing (below) applies the general theory of 260
quantitative PCR. Before introducing this method, a natural question regarding our approach is 261
why we did not use fluorescence-based quantitative PCR, such as TaqMan probes (Thermo 262
Fischer Scientific, Waltham MA, USA). We note here that we did develop and test TaqMan 263
probes for the small region that distinguished the four Clarkia species within the manufacturers 264
recommended design specifications. However, these probes, with 1-4 species-specific SNPs, 265
were not sensitive to fluoresce exclusively enough in the target species, and therefore did not 266
allow us to distinguish among any of the four Clarkia species. Thus, the TaqMan chemistry was 267
not sensitive enough to generate reliable relative abundance information. We are unaware of 268
other published reports discussing this sensitivity, which was also not clear to the manufacturer, 269
and thus raise this point here for researchers interested in applying fluorescent probes to 270
quantify relative abundance using a small number of SNPs. 271
272
Quantitative amplicon sequencing—An Overview 273
Given the lack of sensitivity of the attempted fluorescence-based method, we developed a 274
sequenced-based amplicon assay. We used two methods to quantify relative input DNA from 275
the four Clarkia. First, we used a common approach to quantify relative abundance of input 276
DNA, which simply uses the relative read abundance following the full PCR. We refer to the 277
traditional sequencing approach—using the relative read abundance of amplicons at-or-near the 278
.CC-BY-NC-ND 4.0 International licensewas not certified by peer review) is the author/funder. It is made available under aThe copyright holder for this preprint (whichthis version posted April 16, 2020. . https://doi.org/10.1101/2020.04.14.041814doi: bioRxiv preprint
11
PCR plateau phase—as “RRA-plateau” or “RRA”. Second, we used an approach that was 279
specifically designed as an attempt to control for some of the biases introduced by PCR. We 280
contrast the RRA method with our method that utilizes a PCR cycle treatment, which we refer to 281
as “quantitative amplicon sequencing” (qAMPseq). 282
283
The premise of qAMPseq applies the theory of quantitative PCR (qPCR, A.K.A. real-time PCR) 284
with the ability to individually index, multiplex, and sequence hundreds of metabarcoded 285
samples (Figure 2). Quantitative PCR analysis uses a pre-determined threshold when the PCR 286
reaction is in an exponential phase of amplification, because the PCR cycle where a reaction 287
product moves into the exponential phase is directly related to the starting DNA concentration, 288
unlike the plateau stage (Kubista, 2005). Realtime PCR uses fluorescence (e.g. TaqMan 289
chemistry) quantified throughout thermocycling to determine the ‘cycle number’ where the 290
product fluorescence is higher than a background level, as the product is in the exponential 291
amplification phase. The estimated number of PCR cycles when the product hits this threshold 292
is known as threshold cycle (Ct). This Ct value can then be compared across samples to 293
compare starting DNA concentrations. 294
295
In qAMPseq, we generate the same PCR amplicon in quadruplicate, with the same starting 296
conditions, but across different PCR cycling numbers (e.g. 20, 25, 30, and 35 cycles; Figure 297
2B). Subsequent cleanup and indexing steps preserve the relative DNA amounts in each of 298
these reactions, which are then individually indexed (i.e. each original sample has four unique 299
indexes, which correspond to the different cycle ‘treatments’) and then pooled and sequenced 300
with all other samples (Figure 2C). Samples can then be de-multiplexed (Figure 2D) and, within 301
each sample and treatment, reads are assigned to predicted taxonomic units (“OTUs”; in this 302
case, the four Clarkia species). The read abundance across each sample and OTU can then be 303
.CC-BY-NC-ND 4.0 International licensewas not certified by peer review) is the author/funder. It is made available under aThe copyright holder for this preprint (whichthis version posted April 16, 2020. . https://doi.org/10.1101/2020.04.14.041814doi: bioRxiv preprint

12
used to calculate Ct (Figure 2E), and a more robust value the relative contribution of input DNA 304
(Figure 2F). 305
306
Pollen DNA extraction and amplicon library preparation 307
Pollen DNA was extracted from sample pollen balls (2015) and anther pollen (2015 and 2016) 308
using a CTAB-Chloroform DNA preparation protocol (as in Agrawal et al. 2013), and stored at -309
20°C until amplification and quantification. We first quantified the DNA concentration in each 310
sample using a Qubit fluorometer, and diluted each DNA sample to ~2 ng/uL. We also created 311
standard dilutions from 1:10 to 1:10000 in triplicate from a single sample of known origin. We 312
assayed 152 unknown origin pollen ball DNA samples split between two sets. Each set included 313
pollen DNA from 76 unknown samples, as well as the same 8 DNA samples of known origin 314
(two from each species), and 12 samples from the standard dilution in triplicate. 315
316
Each set of 96 was then transferred to four identical 96-well plates, where we ran a PCR 317
amplification. We conducted 10uL reaction volumes, including: 6.4 uL of ddH20, 1 uL of MgCl2, 318
1 uL of dNTPs, 0.2 uL of each forward and reverse primers (above), 0.1 uL (0.25 units) of 319
JumpStart Taq (Sigma-Aldrich), and 1 uL of template (at 2 ng/uL). For each set of four plates, 320
we then used four identical thermal cyclers to run the following protocol simultaneously: 94oC for 321
3 minutes, and then for plates 1, 2, 3 and 4 we had 20, 25, 30, or 35 cycles of 94oC for 30 322
seconds, 55oC for 30 seconds, and 72oC for 1 minute, respectively. We then used a final 323
extension time of 5 minutes. 324
325
This resulted in eight 96-well plates—four for each set—representing the different cycle 326
treatments. We then cleaned up each reaction with 1.8X volume SeraPure beads: 10uL of 327
sample with 18uL of beads, and performed two 70% etOH washes. We eluted in 20 uL of 328
resuspension buffer (Illumina). 329
.CC-BY-NC-ND 4.0 International licensewas not certified by peer review) is the author/funder. It is made available under aThe copyright holder for this preprint (whichthis version posted April 16, 2020. . https://doi.org/10.1101/2020.04.14.041814doi: bioRxiv preprint
13
330
We then ran an individual indexing reaction for each sample within each set (i.e. 384 randomly 331
chosen, unique indexes for each set). The 20 uL indexing reaction included 4 uL of ddH20, 10 332
uL of HiFi Master Mix (KAPA Biosystems), 1 uL of each the forward and reverse i5 or i7 333
indexes, and 4 uL of template DNA from the amplification step. This was run with the following 334
thermal cycling conditions: 95oC for 3 minutes, 98oC for 30 seconds, followed by 8 cycles of 335
98oC for 30 seconds, 63oC for 30 seconds, and 72oC for 30 seconds. We had a final extension 336
time of 3 minutes. 337
338
Within each sample set, we pooled 5uL of each indexed sample from across the four-cycle 339
treatments, resulting in one plate for each of the two sample sets. As before, we used a 1.8X 340
SeraPure bead cleanup for the 20uL pooled samples, and completed two 70% etOH washes. 341
We eluted samples into 20uL of resuspension buffer. An equal volume of each sample was then 342
pooled—within each set—into the final library. We sequenced each of the two final libraries 343
separately across two lanes of an Illumina MiSeq, with 2x150 paired end sequencing chemistry. 344
345
Bioinformatics and analysis 346
Demultiplexing resulted in 1,536 individual fastq files (192 samples across four cycle treatments 347
with forward and reverse reads). We used zgrep in bash to identify sequence motifs unique to 348
each of the four species, combining forward and reverse read counts (Supplemental 349
information). 350
351
We generated a standard curve by combining results from across the two sets (Figure S2). As 352
discussed, the critical number to determine relative abundance in qPCR is the Ct value. 353
Because qAMPseq data do not directly yield amplicon counts at the end of every cycle, we did 354
not have direct knowledge of the exact shape of the PCR curve – the important step in 355
.CC-BY-NC-ND 4.0 International licensewas not certified by peer review) is the author/funder. It is made available under aThe copyright holder for this preprint (whichthis version posted April 16, 2020. . https://doi.org/10.1101/2020.04.14.041814doi: bioRxiv preprint
14
determining relative abundance. To determine the cycle when samples crossed a Ct value 356
required using a different approach: first, we log-transformed read counts associated with each 357
of the four-cycle points for which we quantified amplicons. Log-transformation of a PCR 358
sinusoidal curve theoretically results in a linear relationship of cycle and amplicon number. We 359
took advantage of this by determining the slope of the amplification line, i.e. ∆ ��� ������� �� ���
∆ ����� � ����. 360
We set our Ct number as log(10,000 reads), and used it in a simple equation to determine the 361
cycle that corresponded to Ct for each amplification curve of each species in each sample. We 362
henceforth call this number the cycle count. If after 35 cycles a species in a sample had fewer 363
than 10,000 reads, it was assigned a cycle count value of zero. We calculated cycle numbers 364
and performed all of the following analyses in R version 3.5.2 (R Core Team, 2018). 365
366
Ecologically speaking, our goals were to quantify the amount of each Clarkia species’ pollen in 367
each pollen ball to determine if bees (1) were inconstant pollen foragers (2) exhibited preference 368
for certain species of Clarkia and (3) used Clarkia species pollen in ways that were not apparent 369
from observations of floral visitation. We also wanted to compare results yielded by the new 370
approach, qAMPseq, to the results from relative read abundance from the plateau phase of 371
PCR. 372
373
To determine if bees were inconstant while foraging for pollen, we asked which Clarkia species 374
were present or absent in pollen balls using both the qAMPseq method as well as the RRA 375
method. Inconstant pollinators will have more than one species in their pollen balls. In 376
qAMPseq, we determined presence/absence of Clarkia in our samples by asking simply if the 377
cycle values were nonzero (present) or zero (absent) for each species of Clarkia. In contrast, 378
RRA does not yield a cycle count but instead yields relative reads after full amplification (35 379
cycles). To determine presence/absence of Clarkia with RRA, we used three different sample 380
.CC-BY-NC-ND 4.0 International licensewas not certified by peer review) is the author/funder. It is made available under aThe copyright holder for this preprint (whichthis version posted April 16, 2020. . https://doi.org/10.1101/2020.04.14.041814doi: bioRxiv preprint

15
proportion cutoffs to determine the presence of a species in samples: 0%, where presence was 381
defined as any nonzero read count; and 5% and 10 % cutoffs, where presence was defined as 382
anything above 5% or 10%, respectively. We counted the proportion of pollen balls that had 383
more than one species of Clarkia using our four different metrics (raw relative read abundance 384
(RRA), and relative read abundance with 5% and 10% sample proportion cutoffs (RRA5 and 385
RRA10)). 386
387
To further understand constancy, we compared the number of species in bee pollen balls to the 388
number of flowering species where they were captured. When we sampled bees in Clarkia 389
communities, the communities contained one to four species of flowering Clarkia. If bees are 390
completely inconstant, then we expect their pollen balls to contain the same number of species 391
as the communities they were captured in. To test this, we tallied the number of bees caught in 392
communities with one, two, three, and four species of flowering, as well as the number of 393
Clarkia in each of their pollen balls. We ran a Pearson’s Chi-squared test to determine if the 394
proportion of samples containing one to four species of Clarkia pollen matched the proportion of 395
bees caught in communities with one to four species of flowering Clarkia. If bees are inconstant 396
when pollen foraging, these proportions would be the same, and the test would return a non-397
significant result. 398
399
Preference for different Clarkia species was estimated as the difference between the relative 400
amount of a species’ pollen in a sample and the relative amount of that species’ floral 401
abundance in a surveyed Clarkia community where the bee was captured (as in James 2020). 402
This measure of preference can only be calculated for communities with more than one Clarkia 403
species, because there is not an available ‘choice’ to make between plants in single-species 404
communities; as such, we only calculate preference using the pollinator visits/pollen balls from 405
communities with more than one Clarkia species. The calculation yields a value between -1 and 406
.CC-BY-NC-ND 4.0 International licensewas not certified by peer review) is the author/funder. It is made available under aThe copyright holder for this preprint (whichthis version posted April 16, 2020. . https://doi.org/10.1101/2020.04.14.041814doi: bioRxiv preprint

16
1 for each Clarkia species in each pollen ball. Negative values indicate avoidance, positive 407
values indicate preference, and values of zero indicate that bees do not preferentially forage for 408
any species. 409
410
We calculated preference using values generated by both RRA with a 0% sample proportion 411
cutoff and qAMPseq. To calculate preference using qAMPseq values, we used the cycle count 412
for a given species divided by the sum of cycle counts in a sample to estimate relative 413
abundance of each species in each sample. We used a paired t-test to determine if there was a 414
significant difference in estimates of preference using qAMPseq versus RRA. We then ran an 415
ANOVA, using Tukey’s honest significant difference test to determine if pollinator preference for 416
Clarkia species were significantly different, and t-tests to determine if pollinator preferences 417
were significantly different from zero. 418
419
For a complete picture of pollen use by pollinators, we also incorporated Clarkia abundance in 420
communities and in pollen balls into our analyses. First, we compared the average flowering 421
abundance of Clarkia species to compare the amount of floral resources the different Clarkia 422
provided to pollinators when flowering. To do so, we log-transformed all non-zero values of 423
flowering abundance and ran an ANOVA with Tukey’s honest significant difference test to 424
Clarkia species. There was one ‘zero’ value that we retained in the analysis: the four-Clarkia 425
community Kingsnake only had three flowering Clarkia species during one sampling period, and 426
as such, the species with no open flowers (C. xantiana) was assigned a zero. The second way 427
we incorporated abundance into our analyses was to use the data we generated with the 428
qAMPseq method. For each bee taxon X Clarkia species combination, we summed the number 429
of bees carrying pollen from that Clarkia species, weighted by the proportion the Clarkia species 430
was represented in the pollen ball. This weighted value tells us not only the presence/absence 431
.CC-BY-NC-ND 4.0 International licensewas not certified by peer review) is the author/funder. It is made available under aThe copyright holder for this preprint (whichthis version posted April 16, 2020. . https://doi.org/10.1101/2020.04.14.041814doi: bioRxiv preprint
17
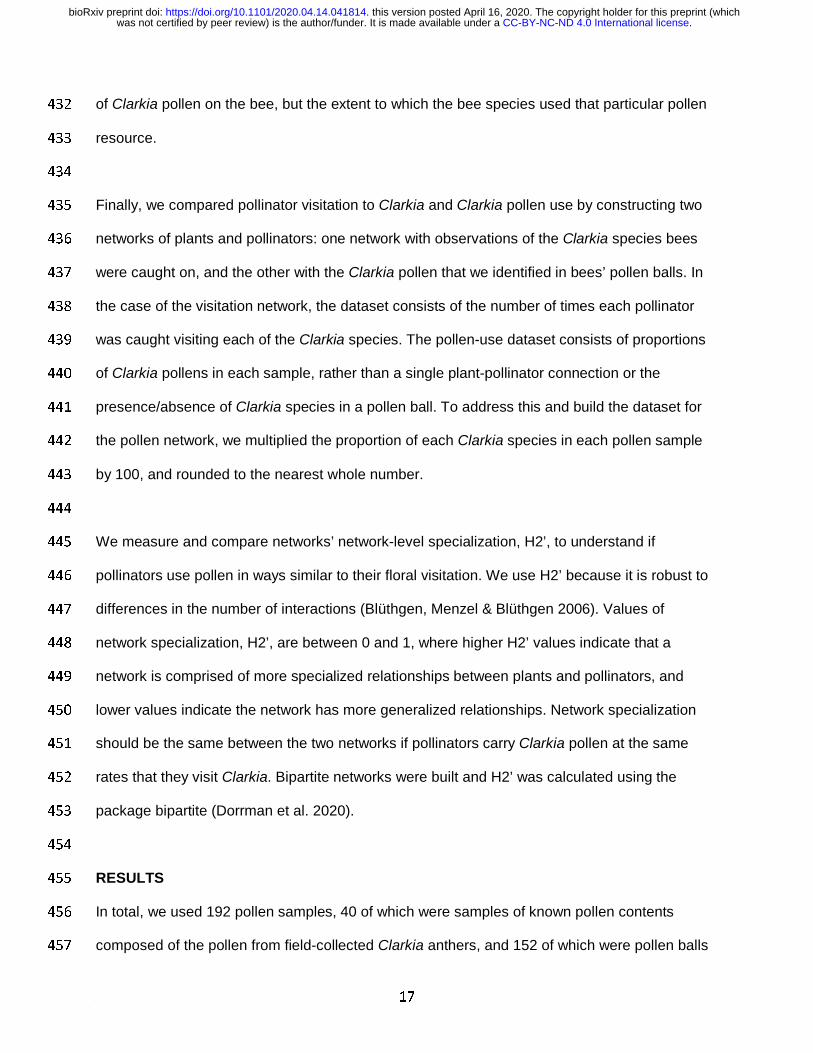
of Clarkia pollen on the bee, but the extent to which the bee species used that particular pollen 432
resource. 433
434
Finally, we compared pollinator visitation to Clarkia and Clarkia pollen use by constructing two 435
networks of plants and pollinators: one network with observations of the Clarkia species bees 436
were caught on, and the other with the Clarkia pollen that we identified in bees’ pollen balls. In 437
the case of the visitation network, the dataset consists of the number of times each pollinator 438
was caught visiting each of the Clarkia species. The pollen-use dataset consists of proportions 439
of Clarkia pollens in each sample, rather than a single plant-pollinator connection or the 440
presence/absence of Clarkia species in a pollen ball. To address this and build the dataset for 441
the pollen network, we multiplied the proportion of each Clarkia species in each pollen sample 442
by 100, and rounded to the nearest whole number. 443
444
We measure and compare networks’ network-level specialization, H2’, to understand if 445
pollinators use pollen in ways similar to their floral visitation. We use H2’ because it is robust to 446
differences in the number of interactions (Blüthgen, Menzel & Blüthgen 2006). Values of 447
network specialization, H2’, are between 0 and 1, where higher H2’ values indicate that a 448
network is comprised of more specialized relationships between plants and pollinators, and 449
lower values indicate the network has more generalized relationships. Network specialization 450
should be the same between the two networks if pollinators carry Clarkia pollen at the same 451
rates that they visit Clarkia. Bipartite networks were built and H2’ was calculated using the 452
package bipartite (Dorrman et al. 2020). 453
454
RESULTS 455
In total, we used 192 pollen samples, 40 of which were samples of known pollen contents 456
composed of the pollen from field-collected Clarkia anthers, and 152 of which were pollen balls 457
.CC-BY-NC-ND 4.0 International licensewas not certified by peer review) is the author/funder. It is made available under aThe copyright holder for this preprint (whichthis version posted April 16, 2020. . https://doi.org/10.1101/2020.04.14.041814doi: bioRxiv preprint

18
of unknown composition harvested from bees in 2014. Sequencing resulted in 45,847,334 458
reads, 94% of which aligned to one of the four Clarkia species reference sequences. All reads in 459
known samples post-amplification were consistent with the known composition of Clarkia in the 460
sample (Figure S1), barring one sample with a small number of reads. We attempted to analyze 461
the contents of all 152 pollen balls, but two contained pollen in such low amounts they were 462
excluded. 463
464
Constancy 465
Of the 150 pollen balls we analyzed, 21 out of 150 bees (14%) were caught on Clarkia flowers 466
that were different from the majority of the Clarkia pollen found in their pollen balls, indicating at 467
least some amount of pollinator inconstancy (Figure 3). The contents of the pollen balls, 468
however, indicate that pollinators were often constant. This includes a caveat: the final 469
measurement of RRA with no cutoff returned all four species of Clarkia in 100% of the samples, 470
indicating the unlikely result that all pollinators are not only inconstant, but visited all four Clarkia 471
species - even when collected in communities containing fewer than four Clarkia species. Not 472
only is this result unlikely based on the biology of the system, but it is exceedingly rare that any 473
quantitative analysis with relative read abundance would use raw read count in the analysis. As 474
such, the rest of our results will compare RRA with 5% (RRA5) and 10% (RRA10) cutoffs with 475
qAMPseq. 476
477
In the large majority of samples, pollen balls contained only one species of Clarkia pollen. 478
Estimates of single-species pollen balls varied among methods, with 66% (RRA5), 74% 479
(RRA10), or 76% (qAMPseq) of samples containing only one Clarkia species. This indicated a 480
striking level of constancy, emphasized by the fact that 70% of bees we sampled were captured 481
in multi-species Clarkia communities. Furthermore, the Pearson’s Chi-squared test comparing 482
the number of bees from communities with one to four flowering Clarkia species versus the 483
.CC-BY-NC-ND 4.0 International licensewas not certified by peer review) is the author/funder. It is made available under aThe copyright holder for this preprint (whichthis version posted April 16, 2020. . https://doi.org/10.1101/2020.04.14.041814doi: bioRxiv preprint

19
number of pollen samples with one to four flowering Clarkia species was significant (X2 484
(3)=77.05, p<0.001), confirming that even in diverse Clarkia communities, bees were constant 485
(Figure 4, Panel B; Table 2). 486
487
Despite overall pollinator constancy, a quarter (qAMPseq, 24%; RRA10, 26%) to a third (RRA5, 488
33%) of the bees were inconstant, often carrying two species of Clarkia pollen. The most 489
common multi-species combination in pollen balls was C. cylindrica and C. unguiculata (Figure 490
3). No pollen balls contained all four species of Clarkia. Bees carrying C. speciosa pollen - the 491
most behaviorally specialized of the Clarkia (James 2020) - tended to only carry C. speciosa 492
pollen: when present, C. speciosa was the only species of pollen in the pollen ball in 12/14 493
cases. Bees carrying the other three species of Clarkia often carried mixtures of the three 494
(Figure 3). 495
496
Relative abundance measurements of Clarkia in pollen balls were largely the same between 497
qAMPseq, RRA5, and RRA10, and most similar between qAMPseq and RRA10 measurement 498
methods (Table 2 and Figure 4; Panel B). 499
500
Preference 501
The two methods we used to determine pollinator preference, RRA (with 0% cutoff) and 502
qAMPseq, did not differ in their estimates of preference (t(599)=-6.8e-10, p=1). Preferences for 503
Clarkia species were significantly different from each other (F(4, 596)=6.210, p<0.001). Bees 504
preferentially carried C. xantiana pollen (preference= 0.06±0.04 95% CI) and avoided C. 505
cylindrica pollen (preference = -0.09±0.04 95% CI). Bees carried C. speciosa and C. 506
unguiculata at roughly the same frequency these two species occurred in sampled communities, 507
indicating neither preference nor avoidance (C. speciosa t(596)=0.42, p=0.67; C. unguiculata 508
t(596)=0.74, p=0.45; Figure 4, Panel A). 509
.CC-BY-NC-ND 4.0 International licensewas not certified by peer review) is the author/funder. It is made available under aThe copyright holder for this preprint (whichthis version posted April 16, 2020. . https://doi.org/10.1101/2020.04.14.041814doi: bioRxiv preprint

20
510
Floral abundance of Clarkia species 511
Abundances of the four Clarkia species were different (F(3, 47)=6.16; p=0.001). Clarkia 512
cylindrica exhibited significantly higher floral abundances than C. speciosa and C. xantiana. 513
Clarkia unguiculata floral abundances were also slightly higher than those of C. speciosa and C. 514
xantiana, but were not statistically different from any other species. Finally, C. speciosa and C. 515
xantiana exhibited similar floral abundances (Figure S3). 516
517
Pollen use and network comparison 518
Weighted estimates of pollen use show that pollinator species as a whole carried markedly 519
different proportions of each Clarkia pollen. We were able to distinguish two different 520
Lasioglossum taxa in our study, and found that the two identifiable taxa of Lasioglossum 521
exhibited different rates of carrying each species of Clarkia. A putative Clarkia specialist, 522
Lasioglossum pullilabre, carried all four species but was most associated with C. cylindrica, 523
whereas L. (Dialictus) sp., a likely generalist, carried C. xantiana at higher rates (Figure 5). 524
Furthermore, the Clarkia specialist Hesperapis regularis carried the three most pollinator-525
sharing Clarkia species, C. cylindrica, C. unguiculata, and C. xantiana at almost equivalent 526
rates, while Diadasia angusticeps used C. speciosa almost to the exclusion of all other Clarkia 527
(Figure 5). 528
529
Pollinator Clarkia visitation and Clarkia pollen use networks were similar (Figure 6). Overall 530
network specialization, H2’, was 0.38 in the Clarkia visitation network, and 0.29 in the Clarkia 531
pollen-use network. Differences between networks were most apparent with the less-abundant 532
pollinators: Apis mellifera (Apidae), Bombus sp. (Apidae), and Megachile sp. (Megachilidae). 533
Each of these species were only captured on a subset of Clarkia, but carried multiple species of 534
Clarkia. The honeybee, Apis mellifera, was only caught on C. xantiana but carried both C. 535
.CC-BY-NC-ND 4.0 International licensewas not certified by peer review) is the author/funder. It is made available under aThe copyright holder for this preprint (whichthis version posted April 16, 2020. . https://doi.org/10.1101/2020.04.14.041814doi: bioRxiv preprint
21
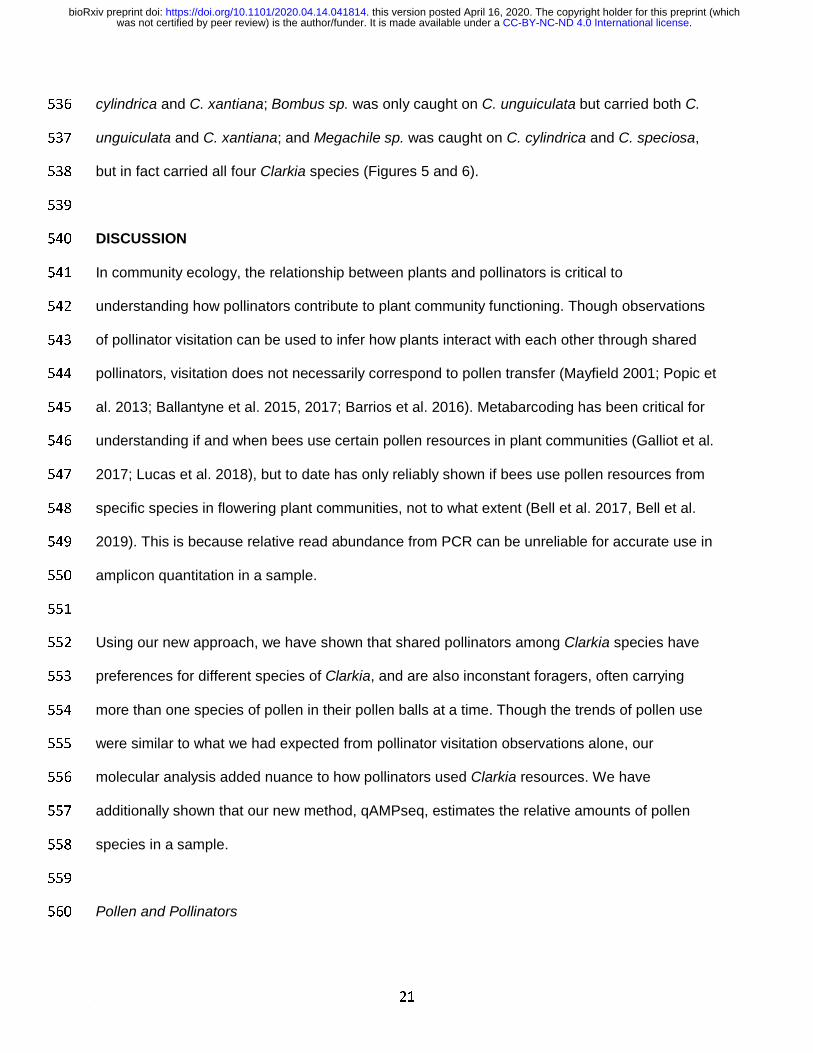
cylindrica and C. xantiana; Bombus sp. was only caught on C. unguiculata but carried both C. 536
unguiculata and C. xantiana; and Megachile sp. was caught on C. cylindrica and C. speciosa, 537
but in fact carried all four Clarkia species (Figures 5 and 6). 538
539
DISCUSSION 540
In community ecology, the relationship between plants and pollinators is critical to 541
understanding how pollinators contribute to plant community functioning. Though observations 542
of pollinator visitation can be used to infer how plants interact with each other through shared 543
pollinators, visitation does not necessarily correspond to pollen transfer (Mayfield 2001; Popic et 544
al. 2013; Ballantyne et al. 2015, 2017; Barrios et al. 2016). Metabarcoding has been critical for 545
understanding if and when bees use certain pollen resources in plant communities (Galliot et al. 546
2017; Lucas et al. 2018), but to date has only reliably shown if bees use pollen resources from 547
specific species in flowering plant communities, not to what extent (Bell et al. 2017, Bell et al. 548
2019). This is because relative read abundance from PCR can be unreliable for accurate use in 549
amplicon quantitation in a sample. 550
551
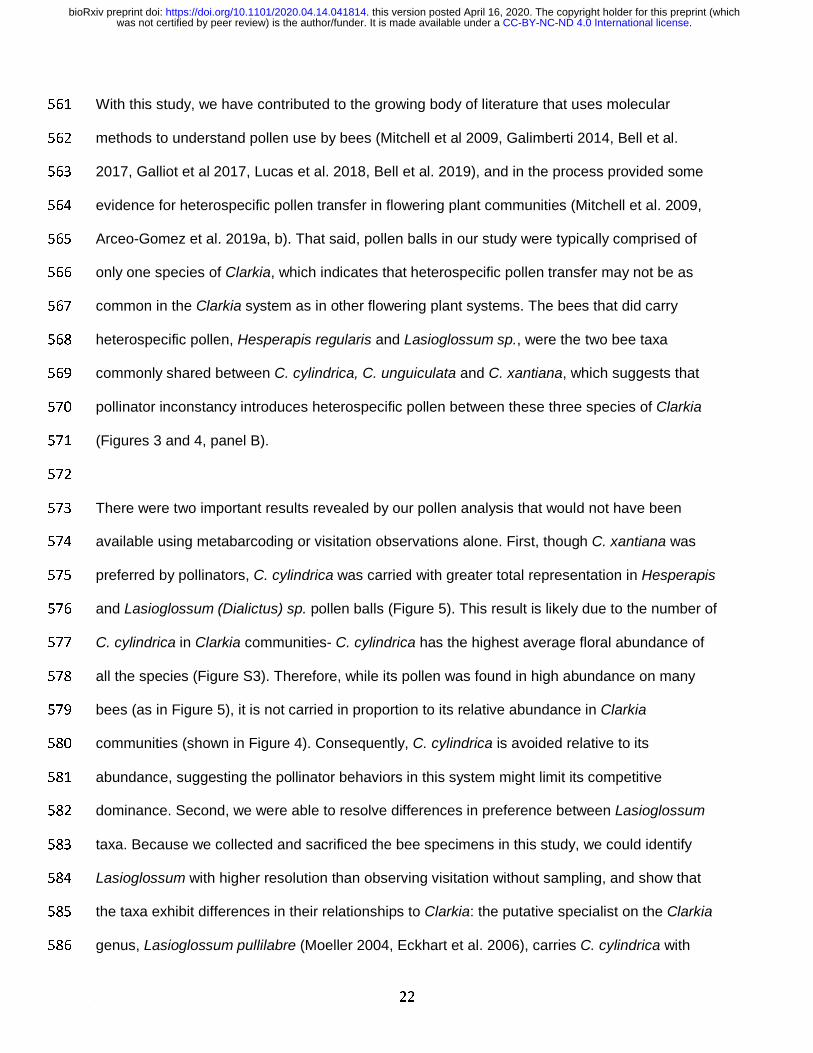
Using our new approach, we have shown that shared pollinators among Clarkia species have 552
preferences for different species of Clarkia, and are also inconstant foragers, often carrying 553
more than one species of pollen in their pollen balls at a time. Though the trends of pollen use 554
were similar to what we had expected from pollinator visitation observations alone, our 555
molecular analysis added nuance to how pollinators used Clarkia resources. We have 556
additionally shown that our new method, qAMPseq, estimates the relative amounts of pollen 557
species in a sample. 558
559
Pollen and Pollinators 560
.CC-BY-NC-ND 4.0 International licensewas not certified by peer review) is the author/funder. It is made available under aThe copyright holder for this preprint (whichthis version posted April 16, 2020. . https://doi.org/10.1101/2020.04.14.041814doi: bioRxiv preprint
22
With this study, we have contributed to the growing body of literature that uses molecular 561
methods to understand pollen use by bees (Mitchell et al 2009, Galimberti 2014, Bell et al. 562
2017, Galliot et al 2017, Lucas et al. 2018, Bell et al. 2019), and in the process provided some 563
evidence for heterospecific pollen transfer in flowering plant communities (Mitchell et al. 2009, 564
Arceo-Gomez et al. 2019a, b). That said, pollen balls in our study were typically comprised of 565
only one species of Clarkia, which indicates that heterospecific pollen transfer may not be as 566
common in the Clarkia system as in other flowering plant systems. The bees that did carry 567
heterospecific pollen, Hesperapis regularis and Lasioglossum sp., were the two bee taxa 568
commonly shared between C. cylindrica, C. unguiculata and C. xantiana, which suggests that 569
pollinator inconstancy introduces heterospecific pollen between these three species of Clarkia 570
(Figures 3 and 4, panel B). 571
572
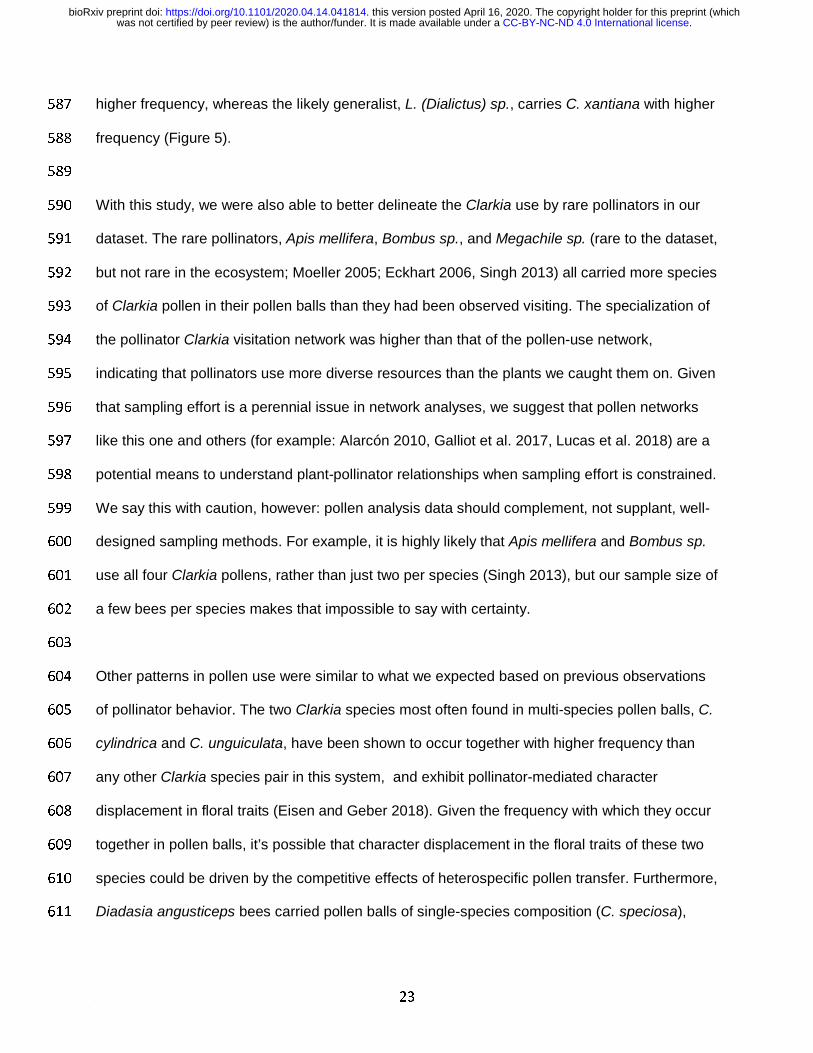
There were two important results revealed by our pollen analysis that would not have been 573
available using metabarcoding or visitation observations alone. First, though C. xantiana was 574
preferred by pollinators, C. cylindrica was carried with greater total representation in Hesperapis 575
and Lasioglossum (Dialictus) sp. pollen balls (Figure 5). This result is likely due to the number of 576
C. cylindrica in Clarkia communities- C. cylindrica has the highest average floral abundance of 577
all the species (Figure S3). Therefore, while its pollen was found in high abundance on many 578
bees (as in Figure 5), it is not carried in proportion to its relative abundance in Clarkia 579
communities (shown in Figure 4). Consequently, C. cylindrica is avoided relative to its 580
abundance, suggesting the pollinator behaviors in this system might limit its competitive 581
dominance. Second, we were able to resolve differences in preference between Lasioglossum 582
taxa. Because we collected and sacrificed the bee specimens in this study, we could identify 583
Lasioglossum with higher resolution than observing visitation without sampling, and show that 584
the taxa exhibit differences in their relationships to Clarkia: the putative specialist on the Clarkia 585
genus, Lasioglossum pullilabre (Moeller 2004, Eckhart et al. 2006), carries C. cylindrica with 586
.CC-BY-NC-ND 4.0 International licensewas not certified by peer review) is the author/funder. It is made available under aThe copyright holder for this preprint (whichthis version posted April 16, 2020. . https://doi.org/10.1101/2020.04.14.041814doi: bioRxiv preprint
23
higher frequency, whereas the likely generalist, L. (Dialictus) sp., carries C. xantiana with higher 587
frequency (Figure 5). 588
589
With this study, we were also able to better delineate the Clarkia use by rare pollinators in our 590
dataset. The rare pollinators, Apis mellifera, Bombus sp., and Megachile sp. (rare to the dataset, 591
but not rare in the ecosystem; Moeller 2005; Eckhart 2006, Singh 2013) all carried more species 592
of Clarkia pollen in their pollen balls than they had been observed visiting. The specialization of 593
the pollinator Clarkia visitation network was higher than that of the pollen-use network, 594
indicating that pollinators use more diverse resources than the plants we caught them on. Given 595
that sampling effort is a perennial issue in network analyses, we suggest that pollen networks 596
like this one and others (for example: Alarcón 2010, Galliot et al. 2017, Lucas et al. 2018) are a 597
potential means to understand plant-pollinator relationships when sampling effort is constrained. 598
We say this with caution, however: pollen analysis data should complement, not supplant, well-599
designed sampling methods. For example, it is highly likely that Apis mellifera and Bombus sp. 600
use all four Clarkia pollens, rather than just two per species (Singh 2013), but our sample size of 601
a few bees per species makes that impossible to say with certainty. 602
603
Other patterns in pollen use were similar to what we expected based on previous observations 604
of pollinator behavior. The two Clarkia species most often found in multi-species pollen balls, C. 605
cylindrica and C. unguiculata, have been shown to occur together with higher frequency than 606
any other Clarkia species pair in this system, and exhibit pollinator-mediated character 607
displacement in floral traits (Eisen and Geber 2018). Given the frequency with which they occur 608
together in pollen balls, it’s possible that character displacement in the floral traits of these two 609
species could be driven by the competitive effects of heterospecific pollen transfer. Furthermore, 610
Diadasia angusticeps bees carried pollen balls of single-species composition (C. speciosa), 611
.CC-BY-NC-ND 4.0 International licensewas not certified by peer review) is the author/funder. It is made available under aThe copyright holder for this preprint (whichthis version posted April 16, 2020. . https://doi.org/10.1101/2020.04.14.041814doi: bioRxiv preprint
24
which corresponds to previous observations that the species is behaviorally more specialized on 612
C. speciosa (Singh 2013, James 2020). 613
614
615
Quantitative Amplicon Sequencing 616
This study represents a new method of meta-DNA relative abundance analysis via sequencing. 617
Given the dramatic decline in sequencing costs as well as the sensitivity of current sequencing 618
methods to detecting SNPs, this method may represent a lower-cost alternative to florescence-619
based qPCR. We also note that qAMPseq offers a higher-accuracy alternative to relative read 620
abundance that is not subject to the issues that can arise when trying to quantify PCR products 621
from metabarcoding (Bell et al. 2019). That said, the protocol here could be streamlined. One 622
example is that it may be acceptable to perform fewer bead cleaning steps to reduce cost and 623
time at the bench. Our protocol also necessitated four thermocyclers, running simultaneously. 624
However, similar to how gradient thermocyclers vary annealing temperatures across reaction 625
wells, we can envision a modification of thermocycler heating blocks that might allow for 626
variation in the number of reaction cycles, and perhaps allow qAMPseq reactions to be run on 627
the same machine, also lowering costs (e.g. Schicke and Hofmann, 2007). 628
629
One important difference between our study and studies that use markers such as ITS2 and 630
rcbL is that we had specific target species we quantified in our samples. As such, we designed 631
primers to amplify regions where we knew there were SNPs that differentiated our target 632
species from each other, rather than relying on variation in ITS2 and rcbL to distinguish Clarkia 633
from each other. It is also important to note that, because we were using closely related species 634
within the Clarkia genus, our application of the meta-barcoding approach was likely not subject 635
to many of quantitative biases identified by Bell et al. (2019). These biases include copy number 636
variation of the amplified gene, differences in DNA isolation efficacy among samples, and 637
.CC-BY-NC-ND 4.0 International licensewas not certified by peer review) is the author/funder. It is made available under aThe copyright holder for this preprint (whichthis version posted April 16, 2020. . https://doi.org/10.1101/2020.04.14.041814doi: bioRxiv preprint
25
variation in primer amplification efficiency. If others are to use this method with primers that 638
target a broader range of possibly more divergent species, these additional biases need to be 639
carefully considered in experimental design. 640
641
Finally, the difference between estimates of relative abundance from qAMPseq versus relative 642
read abundance depended on the tolerance with which we filtered raw RRA values. In our 643
study, the 10% cutoff of RRA best matched the results from qAMPseq. A benefit to using 644
qAMPseq, rather than relative read abundance, is that it did not require an arbitrary cutoff for 645
the proportion of reads at the end of PCR that we needed to filter out. However, qAMPseq still 646
required that we define an arbitrary number of reads as a threshold for amplification; this value 647
is analogous to the critical Ct value in the qPCR method of quantitation. Importantly, it is likely 648
that the similarity in relative abundances between our qAMPseq approach and RRA was due to 649
the fact that our samples were diluted to a similar starting concentration of DNA (2 ng/uL). In 650
studies wishing to use RRA in lieu of qAMPseq or qPCR, it should be noted that RRA may not 651
yield accurate estimates of relative abundance if DNA concentrations are highly variable (Bell et 652
al. 2019). We also highlight that because all of our samples were diluted to the same initial 653
concentration, our analysis does not incorporate information about the size of the sampled 654
pollen ball, so we cannot draw conclusions about the amount of pollen that different pollinators 655
transport in their pollen balls. Irrespective of approach, care must be taken in determining the 656
concentration of pre-amplification samples with any particular primer/target combination, as well 657
the interpretation of the resulting data. 658
659
Conclusions 660
Our novel approach to molecular identification of bee pollen allowed us to determine the relative 661
abundance of different pollens from mixed samples taken from foraging bees, which is critically 662
important for more precise estimates of pollen use networks (Bell et al. 2017). Our method 663
.CC-BY-NC-ND 4.0 International licensewas not certified by peer review) is the author/funder. It is made available under aThe copyright holder for this preprint (whichthis version posted April 16, 2020. . https://doi.org/10.1101/2020.04.14.041814doi: bioRxiv preprint

26
allowed us to understand ecologically relevant and nuanced characteristics of plant-pollinator 664
interactions, such as how many species of Clarkia bees were interacting with in a given foraging 665
bout, and to what extent (Roslin et al. 2019). This, in turn, revealed how Clarkia interacted via 666
their pollinators, and provided insights into more general patterns of species interactions. As the 667
theories of plant species interactions continue to incorporate mutualistic, complex community 668
dynamics (Morales-Castilla et al. 2015; Vázquez et al. 2015), we believe these kinds of 669
molecular approaches can expand the broader toolkit of community ecologists and facilitate a 670
more robust understanding of species interactions. 671
672
.CC-BY-NC-ND 4.0 International licensewas not certified by peer review) is the author/funder. It is made available under aThe copyright holder for this preprint (whichthis version posted April 16, 2020. . https://doi.org/10.1101/2020.04.14.041814doi: bioRxiv preprint
27
Acknowledgements 673
The authors acknowledge Steve Bogdanowicz, the Cornell Evolutionary Genetics Core Facility, 674
the Cornell Lab of Ornithology, Bronwyn Butcher, and the Lovette Lab for help in method 675
development and for providing lab space and time. Dave Moeller and Indrani Singh helped with 676
bee identification and provided helpful natural history knowledge, and Amy Hastings helped in 677
DNA extraction methods. We thank Julia Brokaw, who was instrumental in the field collections 678
of bees and pollen, as well as Alyssa Anderson, who aided in data preparation. This work was 679
supported by the National Science Foundation Doctoral Dissertation Improvement Grant 680
program, grant number 1701675 awarded to ARMJ and MAG, and NSF DEB-1754299 awarded 681
to MAG. 682
683
.CC-BY-NC-ND 4.0 International licensewas not certified by peer review) is the author/funder. It is made available under aThe copyright holder for this preprint (whichthis version posted April 16, 2020. . https://doi.org/10.1101/2020.04.14.041814doi: bioRxiv preprint

28
REFERENCES 684
685
Agrawal, A. A., Johnson, M. T. J., Hastings, A. P.and Maron, J. L. 2013. A field experiment 686
demonstrating plant life-history evolution and its eco-evolutionary feedback to seed predator 687
populations. American Naturalist 181: S35-S45. 688
689
Arceo-Gómez, G., Kaczorowski, R. L., Patel, C., and Ashman, T. L. 2019a. Interactive effects 690
between donor and recipient species mediate fitness costs of heterospecific pollen receipt in a 691
co-flowering community. Oecologia 189: 1041-1047. 692
693
Arceo-Gómez, G., Schroeder, A., Albor, C., Ashman, T. L., Knight, T. M., Bennett, J. M., and 694
Suarez, B. et al. 2019b. Global geographic patterns of heterospecific pollen receipt help uncover 695
potential ecological and evolutionary impacts across plant communities worldwide. Scientific 696
Reports 9. 697
698
Alarcón, Ruben. 2010. Congruence between Visitation and Pollen-Transport Networks in a 699
California Plant-Pollinator Community. Oikos 119: 35–44. 700
701
Ballantyne, G., K. C. R. Baldock, L. Rendell, and P. G. Willmer. 2017. Pollinator importance 702
networks illustrate the crucial value of bees in a highly speciose plant community. Scientific 703
Reports. 704
705
Ballantyne, G., Baldock K. C. R., and Willmer, P. G. 2015. Constructing more informative plant-706
pollinator networks: Visitation and pollen deposition networks in a heathland plant community. 707
Proceedings of the Royal Society B: Biological Sciences. 708
709
Barrios, B., Pena, S. R., Salas, A. and Koptur, S. 2016. Butterflies visit more frequently, but 710
bees are better pollinators: The importance of mouthpart dimensions in effective pollen removal 711
and deposition. AoB PLANTS. 712
Bell, K. L., De Vere, N., Keller, A., Richardson, R.T., Annemarie Gous, Kevin S. Burgess, and 713
Berry J. Brosi. 2016. Pollen DNA Barcoding: Current Applications and Future Prospects. 714
Genome, 59:629–40. 715
Bell, Karen L., Fowler, J., Burgess, K.S., Dobbs, E.K., Gruenewald, D., Lawley, B., Morozumi, 716
C. and Brosi, B.J. 2017. Applying Pollen DNA Metabarcoding to the Study of Plant–Pollinator 717
Interactions. Applications in Plant Sciences 5. 718
Bell, K. L., Burgess, K.S., Botsch, J.C., Dobbs, E.K, Read, T.D., and Brosi, B.J. 2019. 719
Quantitative and Qualitative Assessment of Pollen DNA Metabarcoding Using Constructed 720
Species Mixtures. Molecular Ecology 28: 431–55. 721
Cane, J. H., and Sipes, S.S. 2006. Characterizing floral specialization by bees: Analytical 722
methods and a revised lexicon for oligolecty. Plant–pollinator interactions: From specialization to 723
generalization. 724
725
Carvalheiro, L. G., Biesmeijer, J. C., Benadi, G., Fründ, J., Stang, M., Bartomeus, I., Kaiser-726
Bunbury, C. N., et al. 2014. The potential for indirect effects between co-flowering plants via 727
shared pollinators depends on resource abundance, accessibility and relatedness. Ecology 728
Letters 17:1389–1399. 729
.CC-BY-NC-ND 4.0 International licensewas not certified by peer review) is the author/funder. It is made available under aThe copyright holder for this preprint (whichthis version posted April 16, 2020. . https://doi.org/10.1101/2020.04.14.041814doi: bioRxiv preprint

29
730
Danecek, P., Auton, A., Abecasis, G., Albers, C.A., Banks, E., DePristo, M.A., Handsaker, R.E., 731
Lunter, G., Marth, G.T., Sherry, S.T. and McVean, G., 2011. The variant call format and 732
VCFtools. Bioinformatics, 27: 2156-2158. 733
734
Danforth, B. N., Minckley, R. L., and Neff, J. L. 2019. The Solitary Bees. The Solitary Bees. 735
Princeton University Press, Princeton, New Jersey. 736
Deiner, K., Bik, H.M., Mächler, E., Seymour, M., Lacoursière�Roussel, A., Altermatt, F., Creer, 737
S., et al. 2017. “Environmental DNA Metabarcoding: Transforming How We Survey Animal and 738
Plant Communities.” Molecular Ecology 26 (21): 5872–95. 739
Eckhart, V.M., Rushing, N.S., Hart, G.M., and Hansen, J.D. 2006. Frequency-Dependent 740
Pollinator Foraging in Polymorphic Clarkia xantiana ssp. xantiana Populations: Implications for 741
Flower Colour Evolution and Pollinator Interactions. Oikos 112: 412–21. 742
Eisen, K. E., and Geber, M.A. 2018. Ecological sorting and character displacement contribute to 743
the structure of communities of Clarkia species. Journal of Evolutionary Biology. 744
Mitchell, R. J., Irwin, R. E., Flanagan, R. J., and Karron, J. D. 2009. Ecology and Evolution of 745
Plant-Pollinator Interactions.M Annals of Botany 103:1355-1363. 746
Galliot, J. N., Brunel, D., Bérard, A., Chauveau, A., Blanchetête, A., Lanore, L., and Farruggia, 747
A. 2017. Investigating a flower-insect forager network in a mountain grassland community using 748
pollen DNA barcoding. Journal of Insect Conservation 21:827–837. 749
750
Haas B.J., Papanicolaou A., Yassour M., Grabherr M., Blood P.D., Bowden J., Couger M.B., 751
Eccles D., Li B., Lieber M., Macmanes M.D., Ott M., Orvis J., Pochet N., Strozzi F., Weeks N., 752
Westerman R., William T., Dewey C.N., Henschel R., Leduc R.D., Friedman N., Regev A. De 753
novo transcript sequence reconstruction from RNA-seq using the Trinity platform for reference 754
generation and analysis. 2013. Nature Protocols. 8:1494-512. 755
756
James, A.R.M. 2020. Pollinator Sharing and Spatial Partitioning Affect Flowering Plant 757
Coexistence. Cornell University. 758
759
James, A.R.M., Geber, M.A, and Toews, D.P.L. 2020. Quantitative amplicon sequencing for 760
meta-DNA analysis reveals patterns in pollen use by bees, Dryad, 761
Dataset, https://doi.org/10.5061/dryad.0p2ngf1x0 762
Johnson, C. A., and Bronstein, J.L. 2019. Coexistence and competitive exclusion in mutualism. 763
ecology 100:e02708. 764
Kubista, M., Andrade, J.M., Bengtsson, M., Forootan, A., Jonák, J., Lind, K., Sindelka, R., 765
Sjöback, R., Sjögreen, B., Strömbom, L., Ståhlberg, A., Zoric, N. 20016. The real-time 766
polymerase chain reaction. Molecular Aspects of Medicine 27: 95-125. 767
Lucas, A., Bodger, O., Brosi, B. J., Ford, C. R., Forman, D. W., Greig, C., Hegarty, M., et al. 768
2018. Generalisation and specialisation in hoverfly (Syrphidae) grassland pollen transport 769
networks revealed by DNA metabarcoding. Journal of Animal Ecology 87:1008-1021. 770
771
.CC-BY-NC-ND 4.0 International licensewas not certified by peer review) is the author/funder. It is made available under aThe copyright holder for this preprint (whichthis version posted April 16, 2020. . https://doi.org/10.1101/2020.04.14.041814doi: bioRxiv preprint

30
MacSwain, J. W., Raven, P. H., and Thorp, R. W. 1973. Comparative behavior of bees and 772
Onagraceae. IV. Clarkia bees of the Western United States. University of California Publications 773
in Entomology 70:1–80. 774
775
Martin, A. C., and Harvey, W. J. 2017. The Global Pollen Project: a new tool for pollen 776
identification and the dissemination of physical reference collections. Methods in Ecology and 777
Evolution 8:892–897. 778
779
Mayfield, M. M., Waser, N. M., and Price, M. V. 2001. Exploring the “most effective pollinator 780
principle” with complex flowers: Bumblebees and Ipomopsis aggregata. Annals of Botany 88: 781
591-596. 782
783
Mitchell, R. J., Irwin, R. E., Flanagan, R. J., and Karron, J. D. 2009. Ecology and evolution of 784
plant-pollinator interactions. Annals of Botany 103: 1355-1363. 785
Michener, C. D., McGinley, R. J., and Danforth, B. N. 1994. The Bee Genera of North and 786
Central America. Edited by Rosemary Sheffield. Washington: Smithsonian Institution Press. 787
Moeller, D. A. 2005. Pollinator community structure and sources of spatial variation in plant-788
pollinator interactions in Clarkia xantiana ssp. xantiana. Oecologia 142: 28-37. 789
790
Morales-Castilla, I., Matias, M. G., Gravel, D. and Araújo, M. B. 2015. Inferring biotic 791
interactions from proxies. Trends in Ecology and Evolution 30: 347–356. 792
793
Popic, T. J., Wardle, G. M., and Davila, Y. C. 2013. Flower-visitor networks only partially predict 794
the function of pollen transport by bees. Austral Ecology 38: 76-86. 795
Richardson, D. M., Allsopp, N., D’antonio, C. M., Milton, S. J., and Rejmánek, M. 2000. Plant 796
Invasions — the Role of Mutualisms. Biological Reviews 75: 65–93. 797
Roslin, T., Traugott, M., Jonsson, M., Stone, G. N., Creer, S., and Symondson, W.O.C. 2019. 798
Introduction: Special Issue on Species Interactions, Ecological Networks and Community 799
Dynamics – Untangling the Entangled Bank Using Molecular Techniques. Molecular Ecology 800
28: 157–64. 801
Sickel, W., Ankenbrand, M. J., Grimmer, G., Holzschuh, A., Härtel, S., Lanzen, J., Keller, A. et 802
al. 2015. Increased efficiency in identifying mixed pollen samples by meta�barcoding with a 803
dual�indexing approach. BMC Ecology 15: 20. 804
805
Singh, I. 2013. Master’s Thesis. Cornell University. 806
807
Schicke, K. and Hofmann, C. 2007. Thermocycler with a temperature control block driven in 808
cycle. US Patent number US 2007/0212774 A1. 809
Sousa, L.L., Silva, S. M., and Xavier, R. 2019. DNA Metabarcoding in Diet Studies: Unveiling 810
Ecological Aspects in Aquatic and Terrestrial Ecosystems.” Environmental DNA 1: 199–214. 811
Vázquez, D. P., Ramos-Jiliberto, R., Urbani, P., and Valdovinos, F. S. 2015. A conceptual 812
framework for studying the strength of plant -- animal mutualistic interactions. Ecology Letters 813
18: 385-400. 814
.CC-BY-NC-ND 4.0 International licensewas not certified by peer review) is the author/funder. It is made available under aThe copyright holder for this preprint (whichthis version posted April 16, 2020. . https://doi.org/10.1101/2020.04.14.041814doi: bioRxiv preprint

31
815
816
.CC-BY-NC-ND 4.0 International licensewas not certified by peer review) is the author/funder. It is made available under aThe copyright holder for this preprint (whichthis version posted April 16, 2020. . https://doi.org/10.1101/2020.04.14.041814doi: bioRxiv preprint
32
Data Accessibility 817
Pollen sample composition data will be archived in the Dryad digital repository. 818
819
Author Contributions 820
ARMJ, MAG, and DPLT designed the study. ARMJ and DPLT performed research, analyzed 821
data, and wrote the paper. All authors contributed to editing and revising the manuscript. 822
823
.CC-BY-NC-ND 4.0 International licensewas not certified by peer review) is the author/funder. It is made available under aThe copyright holder for this preprint (whichthis version posted April 16, 2020. . https://doi.org/10.1101/2020.04.14.041814doi: bioRxiv preprint
33
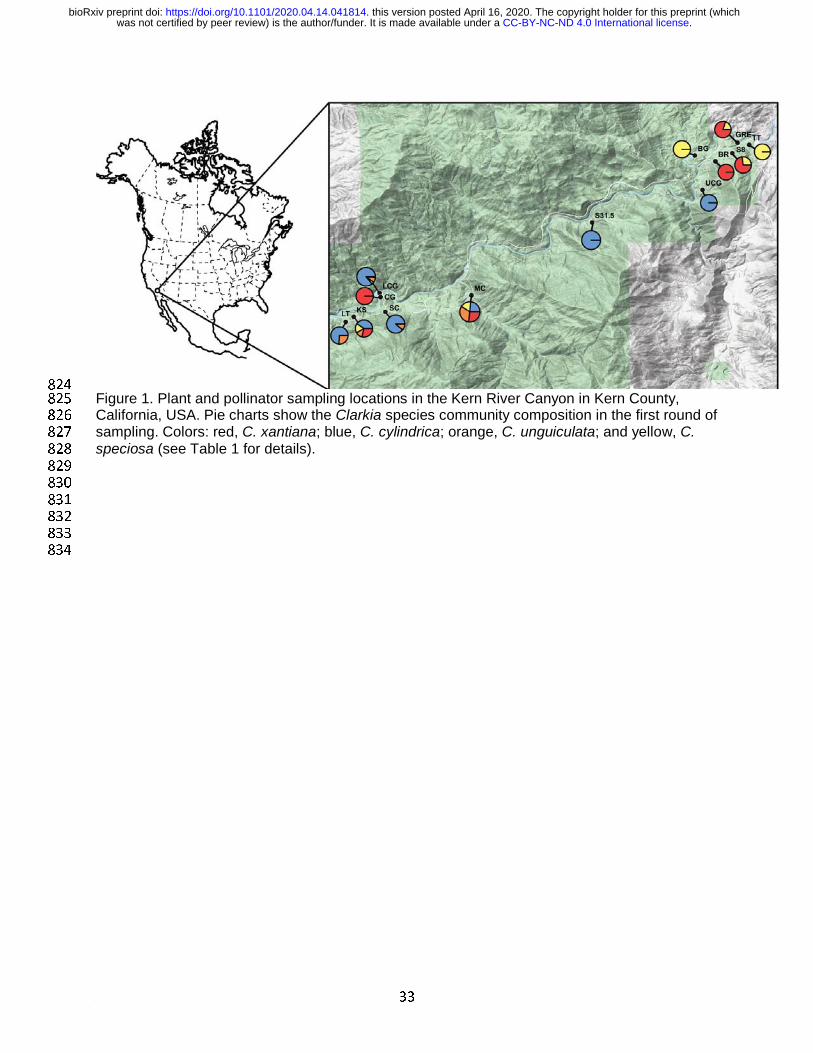
824
Figure 1. Plant and pollinator sampling locations in the Kern River Canyon in Kern County, 825
California, USA. Pie charts show the Clarkia species community composition in the first round of 826
sampling. Colors: red, C. xantiana; blue, C. cylindrica; orange, C. unguiculata; and yellow, C. 827
speciosa (see Table 1 for details). 828
829
830
831
832
833
834
.CC-BY-NC-ND 4.0 International licensewas not certified by peer review) is the author/funder. It is made available under aThe copyright holder for this preprint (whichthis version posted April 16, 2020. . https://doi.org/10.1101/2020.04.14.041814doi: bioRxiv preprint

34
835
836
Figure 2. Quantitative amplicon sequencing schematic. A A mixed-composition sample. Each circle represents a single pollen grain 837
from four different species, in this example, indicated by the four colors. The numbers of each pollen grain in the mixed sample are 838
.C
C-B
Y-N
C-N
D 4.0 International license
was not certified by peer review
) is the author/funder. It is made available under a
The copyright holder for this preprint (w
hichthis version posted A
pril 16, 2020. .
https://doi.org/10.1101/2020.04.14.041814doi:
bioRxiv preprint

35
shown below (i.e. mixed sample #1 had 11 grains from red, 7 grains from yellow, etc.). B This mixed sample is amplified via PCR 839
across four different thermal cyclers, each with different cycle number “treatments”. C Each of these samples are then uniquely 840
indexed to keep track of sample identify and PCR cycle treatment. All samples are pooled, post-PCR, and run on a single Illumina 841
MiSeq lane, where they are sequenced. D After sequencing, samples are de-multiplexed. E Read abundance for each species in 842
each sample is used to calculate the Ct value from a simplified read abundance ‘curve’. F These Ct values are used to calculate the 843
proportion of each species in each sample (i.e. mixed sample #1 had more red pollen grains, a lower Ct, and subsequently a higher 844
relative proportion in the sample).845
.C
C-B
Y-N
C-N
D 4.0 International license
was not certified by peer review
) is the author/funder. It is made available under a
The copyright holder for this preprint (w
hichthis version posted A
pril 16, 2020. .
https://doi.org/10.1101/2020.04.14.041814doi:
bioRxiv preprint
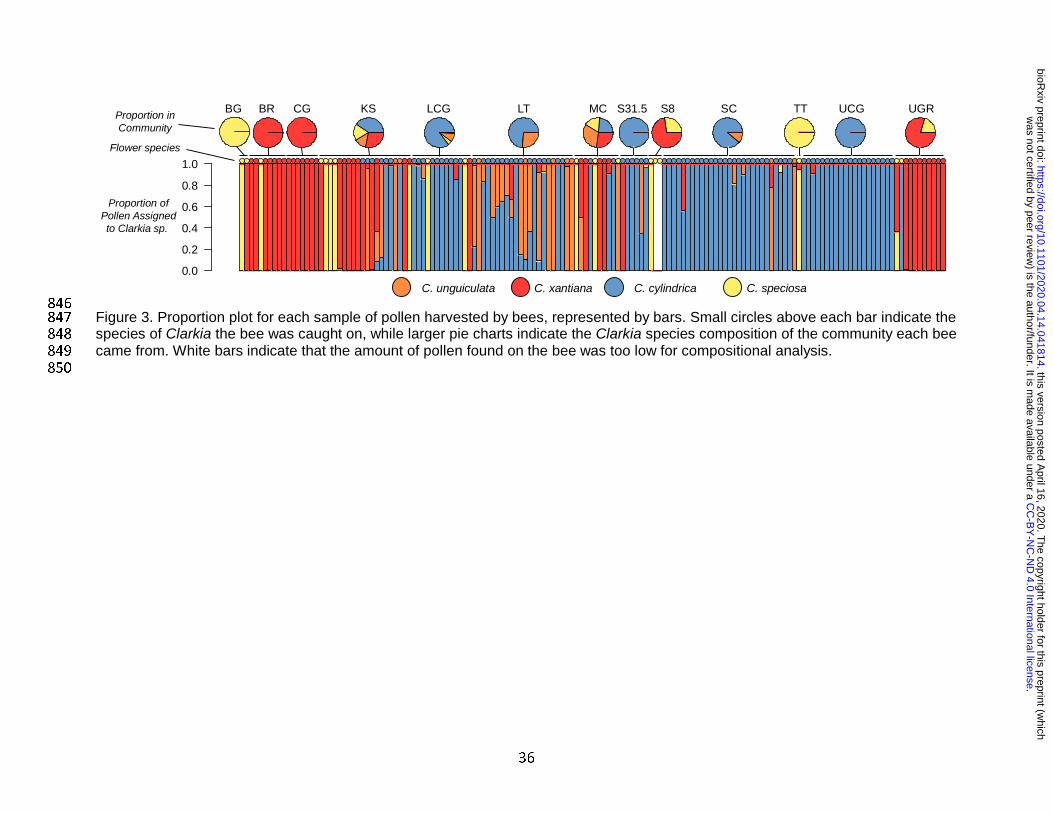
36
846
Figure 3. Proportion plot for each sample of pollen harvested by bees, represented by bars. Small circles above each bar indicate the 847
species of Clarkia the bee was caught on, while larger pie charts indicate the Clarkia species composition of the community each bee 848
came from. White bars indicate that the amount of pollen found on the bee was too low for compositional analysis. 849
850
0.0
0.2
0.4
0.6
0.8
1.0
C. unguiculata C. xantiana C. cylindrica C. speciosa
Proportion ofPollen Assignedto Clarkia sp.
Proportion inCommunity
Flower species
BG BR CG KS LCG LT MC S31.5 S8 SC TT UCG UGR
.C
C-B
Y-N
C-N
D 4.0 International license
was not certified by peer review
) is the author/funder. It is made available under a
The copyright holder for this preprint (w
hichthis version posted A
pril 16, 2020. .
https://doi.org/10.1101/2020.04.14.041814doi:
bioRxiv preprint
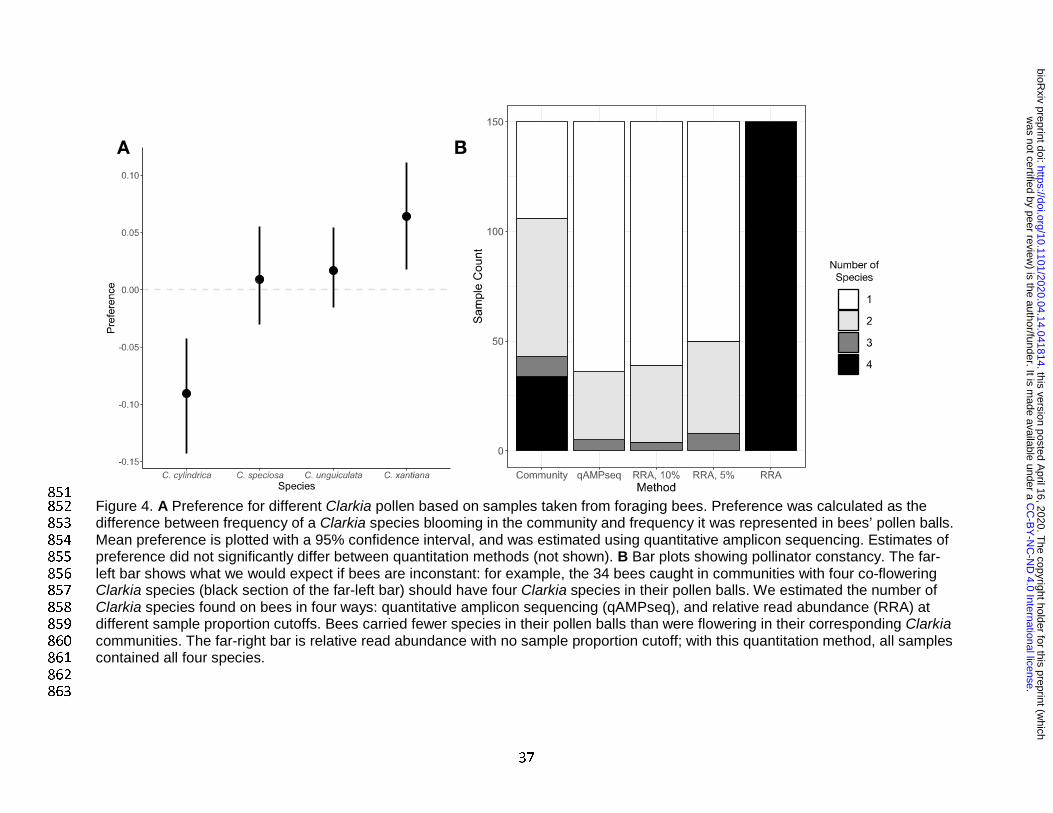
37
851
Figure 4. A Preference for different Clarkia pollen based on samples taken from foraging bees. Preference was calculated as the 852
difference between frequency of a Clarkia species blooming in the community and frequency it was represented in bees’ pollen balls. 853
Mean preference is plotted with a 95% confidence interval, and was estimated using quantitative amplicon sequencing. Estimates of 854
preference did not significantly differ between quantitation methods (not shown). B Bar plots showing pollinator constancy. The far-855
left bar shows what we would expect if bees are inconstant: for example, the 34 bees caught in communities with four co-flowering 856
Clarkia species (black section of the far-left bar) should have four Clarkia species in their pollen balls. We estimated the number of 857
Clarkia species found on bees in four ways: quantitative amplicon sequencing (qAMPseq), and relative read abundance (RRA) at 858
different sample proportion cutoffs. Bees carried fewer species in their pollen balls than were flowering in their corresponding Clarkia 859
communities. The far-right bar is relative read abundance with no sample proportion cutoff; with this quantitation method, all samples 860
contained all four species. 861
862
863
.C
C-B
Y-N
C-N
D 4.0 International license
was not certified by peer review
) is the author/funder. It is made available under a
The copyright holder for this preprint (w
hichthis version posted A
pril 16, 2020. .
https://doi.org/10.1101/2020.04.14.041814doi:
bioRxiv preprint
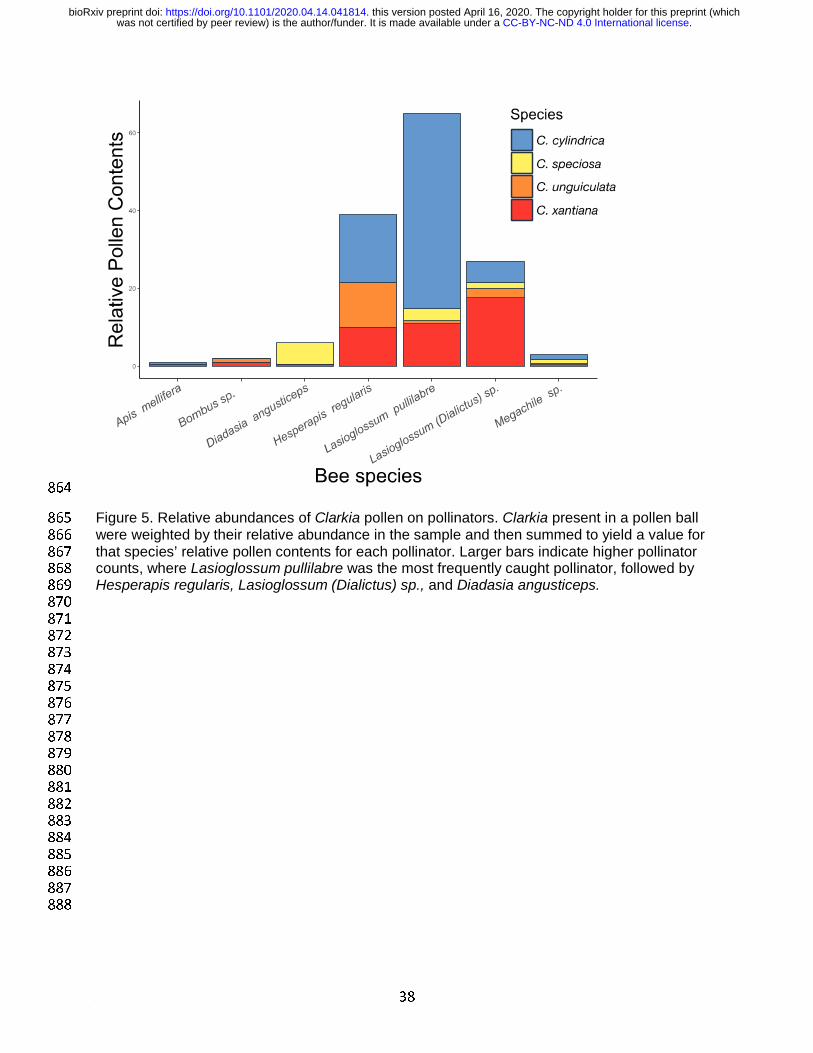
38
864
Figure 5. Relative abundances of Clarkia pollen on pollinators. Clarkia present in a pollen ball 865
were weighted by their relative abundance in the sample and then summed to yield a value for 866
that species’ relative pollen contents for each pollinator. Larger bars indicate higher pollinator 867
counts, where Lasioglossum pullilabre was the most frequently caught pollinator, followed by 868
Hesperapis regularis, Lasioglossum (Dialictus) sp., and Diadasia angusticeps. 869
870
871
872
873
874
875
876
877
878
879
880
881
882
883
884
885
886
887
888
.CC-BY-NC-ND 4.0 International licensewas not certified by peer review) is the author/funder. It is made available under aThe copyright holder for this preprint (whichthis version posted April 16, 2020. . https://doi.org/10.1101/2020.04.14.041814doi: bioRxiv preprint

39
889
890
Figure 6. Bipartite networks of plants and pollinators from surveying done in 2014. The network on the left shows the relationships of 891
pollinator taxa (bottom row) and the plant species they were captured on (top row; C, Clarkia cylindrica; S, C. speciosa; U, C. 892
unguiculata; X, C. xantiana). The network on the right shows the relationships of pollinator taxa and the plant species in their pollen 893
balls as identified and quantified using the qAMPseq method. The size of the purple bars in the top and bottom rows are proportional 894
to the number of bees/plants in the data, and the size of the blue, connecting bars are proportional to the number of times a 895
plant/pollinator combination occurred. 896
897 .C
C-B
Y-N
C-N
D 4.0 International license
was not certified by peer review
) is the author/funder. It is made available under a
The copyright holder for this preprint (w
hichthis version posted A
pril 16, 2020. .
https://doi.org/10.1101/2020.04.14.041814doi:
bioRxiv preprint

40
Table 1. Sites sampled in the study and the sampling schedule. 898
Species composition Site name Dates
sampled (2014) Degree Decimal
Latitude / Longitude
C. cylindrica
C. unguiculata
Little Tree (LT) 15 May
19 May 35.527197
-118.66324
Summer Camp
(SC)
17 May
21 May 35.531156 -118.64774
Site 31.5 (S31.5)
24 May 35.566167 -118.56695
C. speciosa
C. xantiana
Green Rock East
(GRE)
23 May
29 May 35.597436 -118.51016
Site 8 (S8) 24 May
30 May 35.593325 -118.51219
Black Gulch (BG) 29 May
30 May 35.592425 -118.52681
C. cylindrica
C. unguiculata
C. speciosa
C. xantiana
Lower China
Gardens (LCG)
16 May
26 May 35.538564 -118.64998
Kingsnake (KS) 16 May
26 May 35.529239 -118.6601
Mill Creek (MC) 17 May
23 May 35.537633 -118.61411
C. xantiana
Borel (BR) 28 May
30 May 35.590131 -118.5188
Upper China
Gardens (UCG)
18 May
31 May 35.578939 -118.52383
.CC-BY-NC-ND 4.0 International licensewas not certified by peer review) is the author/funder. It is made available under aThe copyright holder for this preprint (whichthis version posted April 16, 2020. . https://doi.org/10.1101/2020.04.14.041814doi: bioRxiv preprint

41
C. cylindrica Coyote Gulch
(CG)
24 May
25 May
35.536933 -118.64963
C. speciosa Tip Top (TT)
29 May
31 May 35.596622 -118.50561
899
900
901
902
903
904
905
.CC-BY-NC-ND 4.0 International licensewas not certified by peer review) is the author/funder. It is made available under aThe copyright holder for this preprint (whichthis version posted April 16, 2020. . https://doi.org/10.1101/2020.04.14.041814doi: bioRxiv preprint
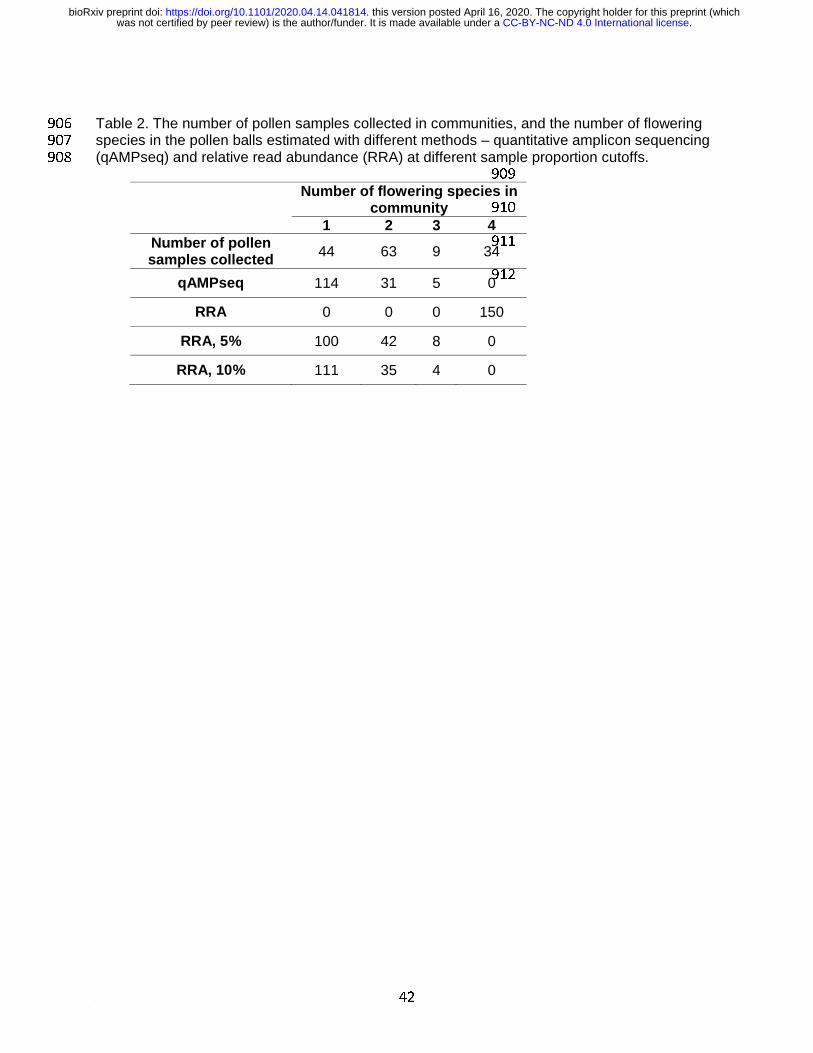
42
Table 2. The number of pollen samples collected in communities, and the number of flowering 906
species in the pollen balls estimated with different methods – quantitative amplicon sequencing 907
(qAMPseq) and relative read abundance (RRA) at different sample proportion cutoffs. 908
909
910
911
912
Number of flowering species in community
1 2 3 4 Number of pollen samples collected 44 63 9 34
qAMPseq 114 31 5 0
RRA 0 0 0 150
RRA, 5% 100 42 8 0
RRA, 10% 111 35 4 0
.CC-BY-NC-ND 4.0 International licensewas not certified by peer review) is the author/funder. It is made available under aThe copyright holder for this preprint (whichthis version posted April 16, 2020. . https://doi.org/10.1101/2020.04.14.041814doi: bioRxiv preprint