quantitation of recombinant protein in whole cells and ... · quantitation of recombinant protein...
TRANSCRIPT
Quantitation of Recombinant Protein in Whole Cells and Cell Extractsvia Solid-State NMR SpectroscopyErica P. Vogel and David P. Weliky*
Department of Chemistry, Michigan State University, East Lansing, Michigan 48824, United States
*S Supporting Information
ABSTRACT: Recombinant proteins (RPs) are commonlyexpressed in bacteria followed by solubilization andchromatography. Purified RP yield can be diminished bylosses at any step with very different changes in methodsthat can improve the yield. Time and labor can thereforebe saved by first identifying the specific reason for the lowyield. This study describes a new solid-state nuclearmagnetic resonance approach to RP quantitation in wholecells or cell extracts without solubilization or purification.The method is straightforward and inexpensive andrequires only ∼50 mL culture and a low-field spectrom-eter.
A common approach to producing recombinant protein(RP) begins with incorporation of recombinant DNA
(rDNA) into bacteria followed by cell growth, expression andlysis, and finally chromatography to obtain pure RP. Theassessment of RP quantity and purity after the expression,solubilization, and/or chromatography steps is typically doneusing sodium dodecyl sulfate−polyacrylamide gel electro-phoresis (SDS−PAGE) that separates proteins by molecularweight (MW). For several different RPs in our laboratory, the RPgel band was not clearly observed after expression orsolubilization and the final RP purified yield was unacceptablylow, e.g., 0.1 mg of RP/L of culture.1 One hypothesis to explainthis result is low RP expression followed by high-yieldsolubilization and chromatography. A second distinct hypothesisis high RP expression followed by poor solubilization and high-yield chromatography. A third hypothesis is high RP expressionand solubilization followed by chromatographic loss of RP.Distinguishing among these hypotheses is important because (1)the corrective changes to the experimental protocol to improveRP yield are very different for each hypothesis and (2)implementing these changes is often time- and labor-intensive.For example, low protein expression might be improved bycodon changes in the rDNA or by varying induction time,whereas low solubilization might be improved by comprehensivescreening of lysis buffers that differ in terms of additives such asdenaturants and detergents.This study focuses on distinguishing between the first low
expression and the second low solubilization hypotheses. Thethird chromatographic loss hypothesis is typically straightfor-wardly tested by comparing the relative RP gel band intensities ofwashes versus elutions from the chromatographic column. RPexpression is typically examined by first boiling an aliquot of cellsin buffer containing SDS buffer with subsequent SDS−PAGE of
solubilized protein. The RP quantity is estimated by comparisonof the intensity of the RP band to the intensities of bands ofnative bacterial proteins. There are a few reports of more accuratequantitation.2 This approach relies on a RP MW that isfortuitously different from the MWs of any of the abundantbacterial proteins. Alternatively, the quantity of the solubilizedRP could be much higher than the quantities of any of thesenative proteins, i.e., high RP expression and high solubility.An assumption of the approach is that most of the RP is
solubilized by boiling. However, the largest RP fraction in cells istypically solid inclusion body (IB) aggregates that can be difficultto solubilize. It is therefore important to develop alternativeapproaches for RP quantitation in either whole cells or cellextracts enriched with IB solids. One potential method is IRspectroscopy of IBs and is based on the hypothesis of anincreased fraction of β-sheet for the RP in IBs relative to thenative structure, perhaps because of partial amyloid structure inthe IB.3 However, the fractional increase in β-sheet structure islikely highly variable among RPs in IBs with one RP in IBsshowing retention of a large fraction of native helical structure.4
This study describes an alternate solid-state nuclear magneticresonance (SSNMR) approach to quantifying RP in wholebacterial cells and cell extracts enriched with IBs. The approachdoes not depend on the structure(s) of the RPs in IBs. We notethat there have been earlier applications of SSNMR to wholebacterial cells and cell extracts with a typical goal of elucidation ofdetails of atomic-resolution structure.5−8 The new method hasbeen tested with five different RPs whose amino acid sequencesare given in the Supporting Information. The generality of theapproach is supported by use of different plasmid and Escherichiacoli strain types.One RP is human proinsulin (HPI), which is the precursor to
the hormone insulin.9 Folded HPI is a monomer with an α-helical core.10 Three RPs (Hairpin, Fgp41, and Fgp41+) aredifferent ectodomain segments of the HIV gp41 protein.1,11,12
gp41 is an integral HIV membrane protein, and the ∼175 N-terminal residues of gp41 make up the ectodomain that liesoutside the virus. The ectodomain is subdivided into the ∼20 N-terminal fusion peptide (FP) residues that bind to membranesand the larger C-terminal region that folds as a helical hairpinwith a 180° turn.13 There is further assembly of three hairpins toform a molecular trimer with a six-helix bundle (SHB) structurethat is hyperthermostable. Hairpin, Fgp41, and Fgp41+ likely allform SHB structure with sequence differences among constructsas well as a lack of FP and most of the loop in Hairpin. The fifth
Received: June 4, 2013Published: June 6, 2013
Rapid Report
pubs.acs.org/biochemistry
© 2013 American Chemical Society 4285 dx.doi.org/10.1021/bi4007034 | Biochemistry 2013, 52, 4285−4287

RP, FHA2, is the full ectodomain of the HA2 subunit of thehemagglutinin protein of the influenza virus.14−16 HA2 has atopology and membrane fusion function similar to those of gp41,but there is little sequence homology between HA2 and gp41.17
Membrane-associated FHA2 has folded SHB structure. Previousefforts to solubilize each of these RPs from bacteria wereconsistent with a large fraction of RP in IBs.We present “HC” and “HCN” SSNMR approaches to RP
quantitation that require double-resonance 1H, 13C and triple-resonance 1H, 13C, 15N SSNMR spectrometers and probes,respectively. For the HC approach, two samples are preparedthat are denoted “RP+lab” and “RP−lab”, and the bacteria have aplasmid with and without the RP rDNA insert, respectively. Thepreparation of either sample includes the addition of a 13CO-labeled amino acid to the expression medium. For this study, thisis [13CO]Leu. The SSNMR (RP+lab − RP−lab)
13CO differenceintensity should therefore be the signal of the labeled (lab) 13COnuclei of the RP. Comparison with a standard curve of 13COintensity versus moles of 13CO allows for conversion to the massof RP per liter of bacterial culture, which is a common metric ofRP expression. The variation in cell mass between the RP+lab andRP−lab samples is accounted for by matching the intensities of thetwo samples in the 0−90 ppm aliphatic region. This aliphatic 13Csignal serves as an internal standard because it is due to naturalabundance (na) nuclei whose numbers should be comparable ina RP+ cell and a RP− cell.The second HCN approach applies rotational-echo double-
resonance (REDOR) SSNMR to one RP+lab sample labeled witheither a 13CO- and 15N-labeled amino acid or a 13CO-labeledamino acid and a 15N-labeled amino acid.18 Separate S0 and S1REDOR data are acquired with 1 ms dephasing. All 13C signalsare detected in S0, whereas there is specific attenuation in S1 ofsignals of directly bonded 13CO−15N spin pairs because of the∼1 kHz dipolar coupling. The ΔS = S0 − S1
13CO spectrum istherefore dominated by these pairs.19 The ΔS 13CO signalintensity is converted to the mass of RP per liter of culture using amethod analogous to that of the HC approach. Relative to HC,the HCN RP quantitation has the advantage of one rather thantwo samples. The HC variant has the advantage of requiring adouble- rather than a triple-resonance SSNMR spectrometer andprobe. Triple-resonance SSNMR instruments are less commonand can have a lower 13C sensitivity.The Supporting Information provides detailed protocols for
sample preparation and SSNMR. The ∼2 day experiment ismostly unattended. The approach is inexpensive with a culture
volume of only ∼50 mL and ∼10 mg of labeled amino acid.There is also a protocol for suppressing scrambling of the 13COand/or 15N labels to other amino acid types.20 A “whole cell”(WC) sample is the centrifugation pellet of the bacterial culture.Cell lysis is conducted prior to centrifugation for the “insolublecell pellet” (ICP) sample. The RP+lab ICP is therefore enriched inIB RP. The 9.4 T magnetic field, 8 kHzMAS frequency, and∼50kHz radiofrequency fields are moderate and accessible for manyNMR facilities, including those with an SSNMR probe (cost ofabout $100000) on an otherwise liquid-state NMR instrument.Figure 1 displays results from HC RP quantitation. Panel a
displays 13C spectra of the [13CO]Leu RP−lab and RP
+lab samples.
Although there are differences in plasmid and E. coli strain typesamong the samples, the corresponding spectra have similaraliphatic 13C signal intensities in the 0−90 ppm region. Theisotropic 13CO signals of the spectra are near 175 ppmwith muchweaker spinning sideband 13CO signals near 95 and 255 ppm.Relative to those of RP−
lab, there are much larger13CO signals in
the RP+lab spectra, which support significant expression of all theRPs. There are also differences among the 13CO intensities of thedifferent RP+
lab samples, which support RP-dependent variationin expression. Panel b displays the expression levels in milligramsof RP per liter of culture as determined from (1) measurementsof IAl− and ICO−, the integrated aliphatic and isotropic 13COintensities of the RP−lab spectrum, respectively; (2) measure-ments of the corresponding IAl+ and ICO+ of the RP+
lab spectrum;and (3) calculation of the 13CO intensity from [13CO]Leusamples in the RP using IAl0(ICO+/IAl+− ICO−/IAl−), where IAl0 is thevalue for a typical sample and IAl0(ICO+/IAl+) and IAl0(ICO−/IAl−) are13CO intensities normalized to NMR sample mass. Theexpression level is calculated using (3) and (i) an experimentallydetermined mole 13CO/ICO conversion factor; (ii) MWRP/NLeu,where NLeu is the number of Leu residues in the RP sequence;and (iii) the NMR sample is from cells in a culture volume of∼25mL.The SSNMR-determined expression levels (panel b) are 100−
450 mg of RP/L of culture. These levels are very high relative tothe reported ∼5 mg/L purified yields for Fgp41, FHA2, andHPI.1,9,15 The most common current approach to assessing RPexpression is SDS−PAGE. Panel c displays SDS−PAGE resultsfor boiled ICPs. Relative to the background, there are clear bandsfor HPI and Hairpin and much fainter and more ambiguousbands for FHA2 and Fgp41. The variation of the RP bandintensities in the SDS−PAGE gel is more reflective of differencesin RP IB solubilization than differences in expression levels.
Figure 1. HC variant of RP quantitation. Panel a displays 13C SSNMR spectra of [13CO]Leu ICP samples. Panel b displays the RP expression levelscalculated from the RP+lab−RP−lab difference intensities of the
13CO (∼175 ppm) region. The differences between the ordering of spectral intensities inpanel a and the ordering of expression levels in panel b are largely due to differentNLeu/Ntot ratios in the RP sequences. Panel c displays an SDS−PAGEgel of most of the samples, and the marked bands may correspond to the RPs.
Biochemistry Rapid Report
dx.doi.org/10.1021/bi4007034 | Biochemistry 2013, 52, 4285−42874286

FHA2 and Fgp41 aremembrane proteins, while HPI andHairpinare not; therefore, the membrane RP IBs appear to be less well-solubilized. The SSNMR approach has the important advantageof being independent of IB solubilization.The HCN approach is based on the ΔS = S0 − S1
13COREDOR difference spectrum of the RP+lab ICP sample. Thisspectrum is dominated by directly bonded lab 13CO−15N spinpairs in the IB RP. For Figure 2a, RP ≡ Fgp41, lab ≡[13CO,15N]Leu, and the ΔS spectrum is mostly due to the N-terminal Leu residues of the six LL dipeptides in the Fgp41sequence. One control is the RP−lab ΔS spectrum that isdominated by LL dipeptides of proteins other than Fgp41produced during expression. However, there is no ΔS(RP−lab)signal (Supporting Information), or equivalently, Figure 2bshows a ΔS(RP+lab) − ΔS(RP−lab) spectrum very similar to theΔS(RP+lab) spectrum that must therefore be dominated by the IBFpg41 signals. Another control is the ΔS(RP+na) spectrum of asample prepared with unlabeled Leu and reflecting signals of na13CO−15N spin pairs. However, there is littleΔS(RP+na) signal asreflected in Figure 2c, where the ΔS(RP+lab) − ΔS(RP+na)spectrum is similar to the ΔS(RP+lab) spectrum.The HCN approach to quantitation of RP expression is
detailed in the Supporting Information. For a particular RP+labsample, the HC andHCN expression levels typically agree withina factor of 2. Quantitative labeling of the RP is assumed for bothapproaches, so the levels are likely lower limits of expression butprobably within a factor of ∼2. Incomplete labeling will have alarger effect on HCN quantitation because the ΔS signal is onlyobserved for dipeptides with both residues labeled.Most of folded Fgp41 is a thermostable six-helix bundle that
includes the six LL dipeptides.13 The ΔS spectrum waspreviously obtained for [13CO,15N]Leu Fgp41 that had beenpurified, refolded, and reconstituted in membranes.1 There was asingle peak with a 178 ppm shift and a 3 ppm width that isconsistent with folded helical structure. The ΔS(RP+
lab)spectrum of Fgp41 in IBs (Figure 2) is very similar and supportsformation of folded Fgp41 structure in the IBs. For other RPs inIBs, theΔS spectral widths are sometimes much broader, e.g.,∼7ppm for HPI (Supporting Information). This breadth isconsistent with unfolded RP structure in the IBs. SSNMRquantitation of RP expression by either the HC or HCNapproaches is independent of the degree of RP folding in the IBs.For all the RPs of this study, the SSNMR spectra demonstrated
high expression, i.e., ≥100 mg of IB RP/L of culture, so the mainobstacle to purified RP is solubilization of the IBs. For other RPsthat are produced at much lower levels, SSNMR could also be
applied to optimize RP production. [13CO]RP+lab samples wouldbe prepared with different growth and/or expression parametersand expression levels determined from the 13CO intensities. Insummary, this paper describes general, inexpensive, rapid, andstraightforward SSNMR approaches to RP quantitation in wholecells and cell extracts without purification.
■ ASSOCIATED CONTENT*S Supporting InformationAdditional NMR spectra, cell growth and labeling, samplepreparation, plasmids and protein sequences, NMR methods,and analysis. This material is available free of charge via theInternet at http://pubs.acs.org.
■ AUTHOR INFORMATIONCorresponding Author*E-mail: [email protected]. Phone: (517) 355-9715.FundingSupported by National Institutes of Health Grant AI047153.NotesThe authors declare no competing financial interests.
■ ACKNOWLEDGMENTSDrs. R. Mackin, Y.-K. Shin, and K. Sackett provided plasmids.
■ REFERENCES(1) Vogel, E. P., Curtis-Fisk, J., Young, K. M., andWeliky, D. P. (2011)Biochemistry 50, 10013−10026.(2) Miles, A. P., and Saul, A. (2009) in Protein Protocols Handbook, 3rded., pp 487−496, Humana, Totowa, NJ.(3) Gross-Selbeck, S., Margreiter, G., Obinger, C., and Bayer, K.(2007) Biotechnol. Prog. 23, 762−766.(4) Curtis-Fisk, J., Spencer, R. M., and Weliky, D. P. (2008) J. Am.Chem. Soc. 130, 12568−12569.(5) Wang, J., Balazs, Y. S., and Thompson,, L. K. (1997) Biochemistry36, 1699−1703.(6) Kim, S. J., Cegelski, L., Stueber, D., Singh, M., Dietrich, E., Tanaka,K. S. E., Parr, T. R., Far, A. R., and Schaefer, J. (2008) J. Mol. Biol. 377,281−293.(7) Reckel, S., Lopez, J. J., Lohr, F., Glaubitz, C., and Dotsch, V. (2012)ChemBioChem 13, 534−537.(8) Zhou, X. X., and Cegelski, L. (2012) Biochemistry 51, 8143−8153.(9) Mackin, R. B., and Choquette, M. H. (2003) Protein ExpressionPurif. 27, 210−219.(10) Yang, Y. W., Hua, Q. X., Liu, J., Shimizu, E. H., Choquette, M. H.,Mackin, R. B., and Weiss, M. A. (2010) J. Biol. Chem. 285, 7847−7851.(11) Sackett, K., Nethercott, M. J., Shai, Y., and Weliky, D. P. (2009)Biochemistry 48, 2714−2722.(12) Sackett, K., Nethercott, M. J., Epand, R. F., Epand, R. M., Kindra,D. R., Shai, Y., and Weliky, D. P. (2010) J. Mol. Biol. 397, 301−315.(13) Yang, Z. N., Mueser, T. C., Kaufman, J., Stahl, S. J., Wingfield, P.T., and Hyde, C. C. (1999) J. Struct. Biol. 126, 131−144.(14) Curtis-Fisk, J., Preston, C., Zheng, Z. X., Worden, R. M., andWeliky, D. P. (2007) J. Am. Chem. Soc. 129, 11320−11321.(15) Curtis-Fisk, J., Spencer, R. M., and Weliky, D. P. (2008) ProteinExpression Purif. 61, 212−219.(16) Kim, C. S., Epand, R. F., Leikina, E., Epand, R. M., andChernomordik, L. V. (2011) J. Biol. Chem. 286, 13226−13234.(17) Chen, J., Skehel, J. J., andWiley, D. C. (1999) Proc. Natl. Acad. Sci.U.S.A. 96, 8967−8972.(18) Guillion, T., and Schaefer, J. (1989) J. Magn. Reson. 81, 196−200.(19) Yang, J., Parkanzky, P. D., Bodner, M. L., Duskin, C. G., andWeliky, D. P. (2002) J. Magn. Reson. 159, 101−110.(20) Tong, K. I., Yamamoto,M., and Tanaka, T. (2008) J. Biomol. NMR42, 59−67.
Figure 2. 13CO ΔS spectra based on the S0 and S1 spectra of threedifferent ICP samples. The RP+lab and RP−lab plasmids had and lackedthe Fgp41 insert, respectively. The lab and na expression mediacontained [13CO,15N]Leu and unlabeled Leu, respectively. (a) TheΔS(RP+lab) = S0 − S1 signal represents directly bonded
13CO−15N spinpairs of the RP+lab sample. (b) The ΔS = ΔS(RP+
lab) − ΔS(RP−lab)signal is from spin pairs of IB Fgp41. (c) The ΔS = ΔS(RP+
lab) −ΔS(RP+na) signal is from lab spin pairs of the RP+lab sample.
Biochemistry Rapid Report
dx.doi.org/10.1021/bi4007034 | Biochemistry 2013, 52, 4285−42874287

Supporting Information for “Quantitation of Recombinant Protein in Whole Cells and Cell Extracts by Solid‐State NMR Spectroscopy” by E. P. Vogel and D. P Weliky
A. RP plasmid and cell types Table SI1. RP plasmids and E. coli cell types
Sample type Recombinant protein (RP) Plasmid type Cell type
RP– None pET24a+ Rosetta2
RP+ Fgp41 pET24a+ Rosetta2
RP+ Fgp41+ pET24a+ Rosetta2
RP+ FHA2 pET24a+ Rosetta2
RP+ Hairpin pGEMT BL21(DE3)
RP+ Human Proinsulin (HPI) pQE‐31 BL21(DE3) Table SI2. RP amino acid sequencesa
Fgp41 A V G L G A V F L G F L G A A G S T TT M G A A S M T L T V Q A R Q L L S G I V Q Q Q S N L L K A I E A Q Q H L L K L T V W G I K Q L Q A R V L A V E R Y L Q D Q Q L L G I W G A S G K L I A T S F V P W N N S W S N K T Y N E I W D N M T W L Q W D K E I S N Y T D T I Y R L L E D S Q N Q Q E K N E Q D L L A L D K L E H H H H H H
Fgp41+ A V G L G A V F L G F L G A A G S T TT M G A A S M T L T V Q A R Q L L S G I V H Q Q S N L L K A I E A Q Q H L L K L T V W G I K Q L Q A R V L A V E R Y L Q D Q Q L L G I W G A S G K L I A T S F V P W N N S W S N K T Y N E I W D N M T W L Q W D K E I S N Y T D T I Y R L L E D S Q N Q Q E K N E Q D L L A L D K W A N L W N W F S I T N W L W Y I K L E H H H H H H
FHA2 G L F G A I A G F I E N G W E G M I D G W Y G F R H Q N S E G T G Q A A D L K S T Q A A I D Q I N G K L N R V I E K T N E K F H Q I E K E F S E V E G R I Q D L E K Y V E D T K I D L W S Y N A E L L V A L E N Q H T I D L T D S E M N K L F E K T R R Q L R E N A E E M G N G S F K I Y H K A D N A A I E S I R N G T Y D H D V Y R D E A L N N R F Q I K G V E L K S G Y K D W V E H H H H H H
Hairpin
C T L T V Q A R Q L L S G I V Q Q Q N N L L R A I E A Q Q H L L Q L T V W G I K Q L Q A R I L S G G R G G W M E W D R E I N N Y T S L I H S L I E E S Q N Q Q E K N E Q E L L E L D K W
Human Proinsulin (HPI) G S S H H H H H H S S G L D P V L M F V N Q H L C G S H L V E A L Y L V C G E R G F F Y T P K T R R E A E D L Q V G Q V E L G G G P G A G S L Q P L A L E G S L Q K R G I V E Q C C T S I C S L Y Q L E N Y C N a Underlined regions contain non‐native residues that were inserted into the sequence.
1

B. Materials The Fgp41 plasmid included an insert corresponding to the 154 N‐terminal residues of the gp41 protein of HIV‐1 (Q45D5 primary isolate). The human proinsulin (HPI) plasmid was obtained from Dr. Robert B. Mackin at Creighton University and contained an insert corresponding to the 87 residues of human proinsulin. The FHA2 plasmid was obtained from Dr. Yeon‐Kyun Shin at Iowa State University and contained an insert corresponding to the 185 N‐terminal residues of the HA2 subunit of the hemagglutinin protein of the influenza virus (X31 strain). The Hairpin plasmid was obtained from Dr. Kelly Sackett at Michigan State University and contained an insert corresponding to residues 23‐70 and 117‐145 of the gp41 protein of HIV‐1 (HXB2 laboratory strain). The insert also included a SGGRGG linker between the two gp41 regions. Each plasmid was transformed into either BL21(DE3) or BL21(DE3) Rosetta2 chemically competent E. coli cells (Novagen, Gibbstown, NJ). Other reagents and their sources include: Luria‐Bertani Broth (LB) medium (Acumedia, Lansing, MI); isopropyl‐β‐D‐thiogalactopyranoside (IPTG) (Anatrace, Maumee, OH); isotopically labeled amino acids (Cambridge Isotope Laboratories, Andover, MA). Other materials were obtained from Sigma‐Aldrich (St. Louis, MO). C. Sample preparation One 250 mL flask containing 100 mL of LB and the proper antibiotic was inoculated with 0.5 mL of a glycerol stock of E. coli cells that contained a specific plasmid. The flask was placed in an incubator shaker with shaking at 180 rpm and a temperature of 37 °C. After 16 hours, the OD600 was ~4 and the cells were harvested by centrifugation at 10,000g at 4°C for 10 minutes. The cells were then resuspended into a 250 mL baffled flask containing 50 mL of M9 minimal medium, antibiotic, 100 μL of 1.0 M MgSO4, and 250 μL of 50% v/v glycerol. After about one hour of shaking at 180 rpm at 37 °C, log(OD600) vs time was linear and the E. coli cells were induced by addition of IPTG to a concentration of 2.0 mM. Induction continued for 3 hours with shaking at 37 °C. For many growths, a dry mixture was prepared that contained 10 mg of each of the 20 common amino acids. One or two of the amino acids typically also contained 13CO and/or α‐15N isotopic labeling. This mixture was added to the medium just before addition of IPTG and an equivalent mixture was added after one hour of induction. After three hours of expression, the cells were harvested by centrifugation at 10,000 g at 4°C for 10 minutes. The cell pellet (~0.5 g wet mass) was stored at ‐20 °C. “Whole cell” (WC) NMR samples were lyophilized cell pellets. “Insoluble cell pellet” (ICP) samples were prepared by first suspending ~0.5 g whole cell pellet in ~40 mL PBS (pH 7.3) followed by placement on ice. Lysis of the E. coli cells was achieved by sonication with a tip sonifier (4 one minute cycles, 80% amplitude, 0.8 seconds on, 0.2 seconds off). After sonication, the suspension was centrifuged at 50,000g at 4°C for 20 minutes. The supernatant (containing soluble proteins) was discarded and the ICP with inclusion body (IB) RP was not lyophilized. D. SDS‐PAGE 10 mg of ICP was suspended in 100 μL of SDS‐containing sample buffer. Each suspension was vortexed, boiled for 5 minutes, and then centrifuged for one minute. The supernatant was diluted 5X with SDS‐containing sample buffer and 15 μL of this solution was added to a well in the electrophoretic apparatus.
2

E. Solid‐state NMR (SSNMR) The sample (either WC or ICP) was packed into a 4 mm diameter solid‐state NMR magic angle spinning (MAS) rotor. The active sample volume of the rotor was ~40 μL. Data were obtained with a 9.4 T instrument (Agilent Infinity Plus) and a triple‐resonance MAS probe whose rotor was cooled with nitrogen gas at –20 °C. Experimental parameters included: (1) 8.0 kHz MAS frequency; (2) 5 μs 1H π/2 pulse and 2 ms cross‐polarization time with 50 kHz 1H field and 70‐80 kHz ramped 13C field; (3) 1 ms rotational‐echo double‐resonance (REDOR) dephasing time with a 9 μs 13C π pulse at the end of each rotor period except the last period and for the S1 acquisition, a 12 μs 15N π pulse at the center of each rotor period; and (4) 13C detection with 90 kHz two‐pulse phase modulation 1H decoupling (which was also on during the dephasing time); and (5) 0.8 sec pulse delay. Data were acquired without (S0) and with (S1)
15N π pulses during the dephasing time and respectively represented the full 13C signal and the signal of 13Cs not directly bonded to 15N nuclei.1,2 Spectra were externally referenced to the methylene carbon of adamantane at 40.5 ppm so that the 13CO shifts could be directly compared to those of soluble proteins.3 F. Suppression of scrambling of isotopic labels Experimental design of the HCN variant of the method included targeting a specific dipeptide sequence in the RP through addition to the expression medium of either: (1) one 13CO‐labeled amino acid and one 15N‐labeled amino acid; or (2) one single 13CO,15N‐labeled amino acid. Glycerol was the only other carbon source and NH4Cl was the only other nitrogen source in the expression medium. A negative control “RP+lab” whole cell (WC) sample was prepared with this protocol using cells that contained the FHA2 plasmid and with 13CO‐Ala and 15N‐Val in the expression medium. As shown in Fig. SI1a, some ΔS signal was observed even though there are no AV dipeptides in the FHA2 sequence. This signal may be due to AV dipeptides in other proteins produced during the expression period. Alternatively, there could be metabolic scrambling in the bacteria of the 13CO label into other “X” amino acids and/or scrambling of the 15N label into other “Y” amino acids with consequent ΔS signal from AY, XV, or XY dipeptides in the FHA2 sequence. The protocol was modified to suppress scrambling by first preparing a solid mixture containing 10 mg each of: (1) 13CO‐Ala; (2) 15N‐Val; and (3) each of the 18 other amino acids (unlabeled). This mixture was added to the culture just prior to induction and an equivalent mixture was added after one hour of induction. Scrambling was greatly reduced with the modified protocol as evidenced by a ΔS signal (Fig. SI1b) that was ~3‐times smaller than the signal of the sample prepared with the initial protocol (Fig. SI1a). The suppression of scrambling was likely through product feedback inhibitory loops of the bacterial amino acid metabolic pathways.4
3
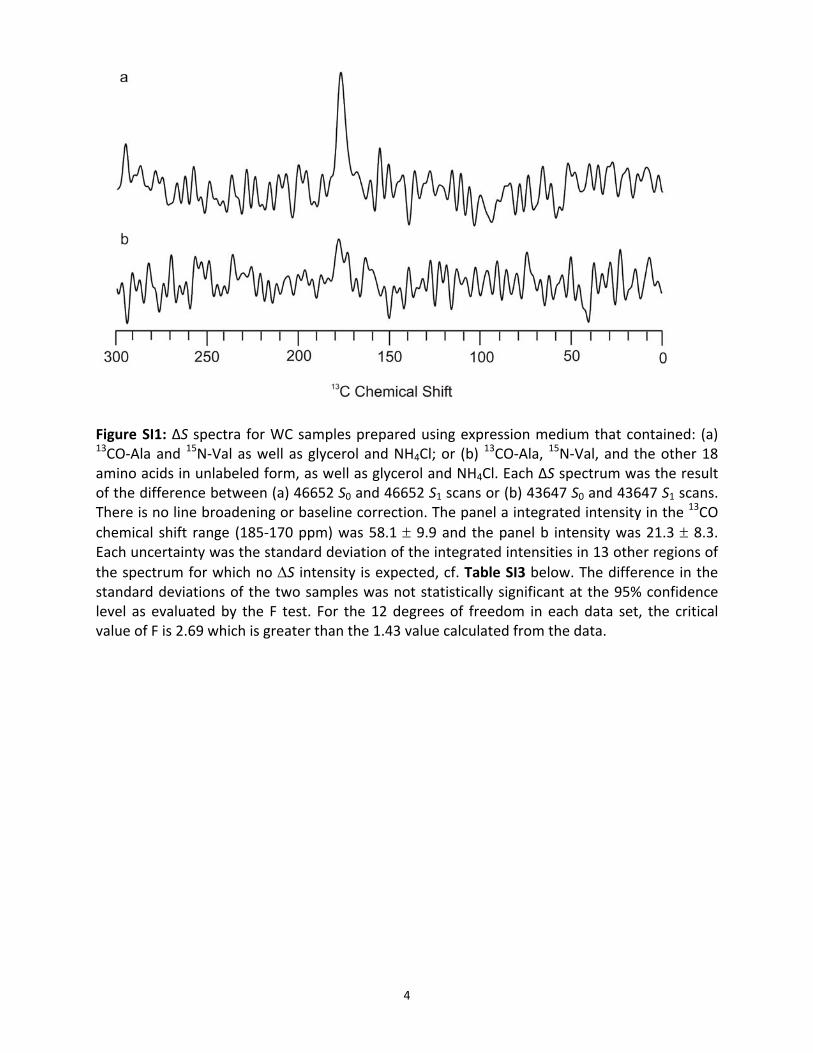
Figure SI1: ΔS spectra for WC samples prepared using expression medium that contained: (a) 13CO‐Ala and 15N‐Val as well as glycerol and NH4Cl; or (b)
13CO‐Ala, 15N‐Val, and the other 18 amino acids in unlabeled form, as well as glycerol and NH4Cl. Each ΔS spectrum was the result of the difference between (a) 46652 S0 and 46652 S1 scans or (b) 43647 S0 and 43647 S1 scans. There is no line broadening or baseline correction. The panel a integrated intensity in the 13CO chemical shift range (185‐170 ppm) was 58.1 ± 9.9 and the panel b intensity was 21.3 ± 8.3. Each uncertainty was the standard deviation of the integrated intensities in 13 other regions of the spectrum for which no ΔS intensity is expected, cf. Table SI3 below. The difference in the standard deviations of the two samples was not statistically significant at the 95% confidence level as evaluated by the F test. For the 12 degrees of freedom in each data set, the critical value of F is 2.69 which is greater than the 1.43 value calculated from the data.
4
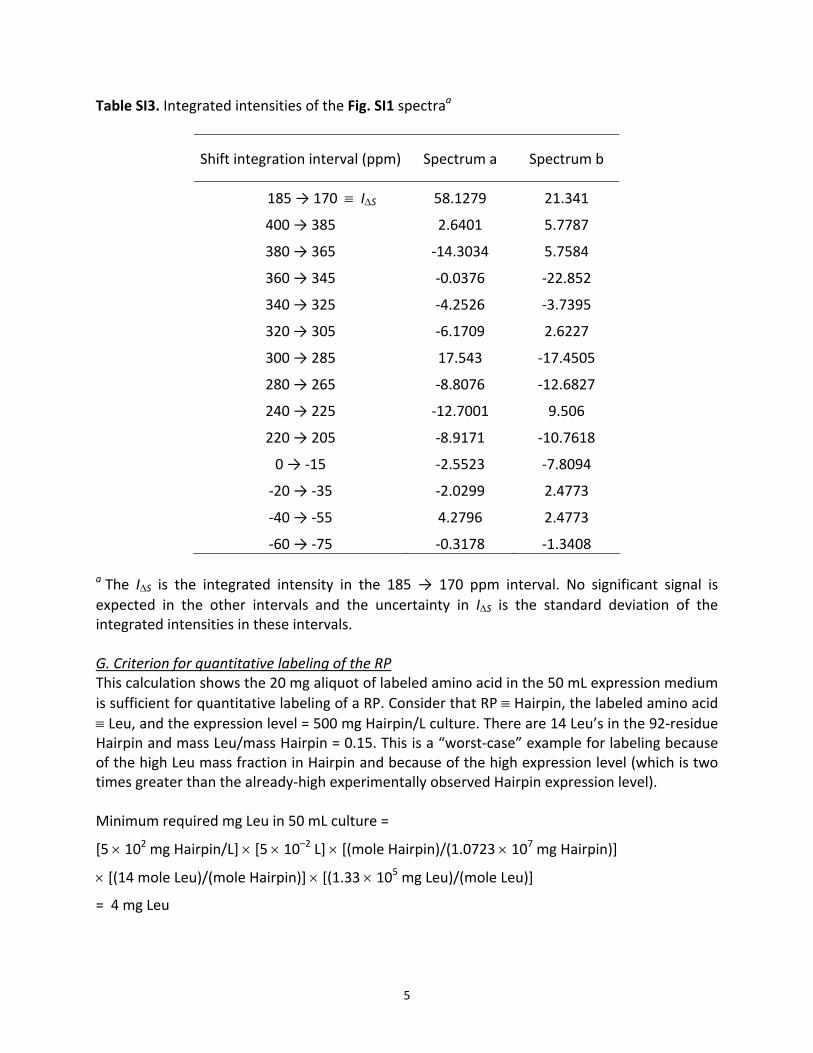
Table SI3. Integrated intensities of the Fig. SI1 spectraa
Shift integration interval (ppm) Spectrum a Spectrum b
185 → 170 ≡ IΔS 58.1279 21.341
400 → 385 2.6401 5.7787
380 → 365 ‐14.3034 5.7584
360 → 345 ‐0.0376 ‐22.852
340 → 325 ‐4.2526 ‐3.7395
320 → 305 ‐6.1709 2.6227
300 → 285 17.543 ‐17.4505
280 → 265 ‐8.8076 ‐12.6827
240 → 225 ‐12.7001 9.506
220 → 205 ‐8.9171 ‐10.7618
0 → ‐15 ‐2.5523 ‐7.8094
‐20 → ‐35 ‐2.0299 2.4773
‐40 → ‐55 4.2796 2.4773
‐60 → ‐75 ‐0.3178 ‐1.3408 a The IΔS is the integrated intensity in the 185 → 170 ppm interval. No significant signal is expected in the other intervals and the uncertainty in IΔS is the standard deviation of the integrated intensities in these intervals. G. Criterion for quantitative labeling of the RP This calculation shows the 20 mg aliquot of labeled amino acid in the 50 mL expression medium is sufficient for quantitative labeling of a RP. Consider that RP ≡ Hairpin, the labeled amino acid ≡ Leu, and the expression level = 500 mg Hairpin/L culture. There are 14 Leu’s in the 92‐residue Hairpin and mass Leu/mass Hairpin = 0.15. This is a “worst‐case” example for labeling because of the high Leu mass fraction in Hairpin and because of the high expression level (which is two times greater than the already‐high experimentally observed Hairpin expression level). Minimum required mg Leu in 50 mL culture =
[5 × 10² mg Hairpin/L] × [5 × 10⁻² L] × [(mole Hairpin)/(1.0723 × 107 mg Hairpin)]
× [(14 mole Leu)/(mole Hairpin)] × [(1.33 × 10⁵ mg Leu)/(mole Leu)]
= 4 mg Leu
5

H. Standard Curve Experiments
Three samples were prepared. For the first sample, 25 mg 13CO,15N‐Leu was massed and then manually mixed with sufficient talc to fill the ~40 μL volume of the rotor. The second sample was similarly prepared but with 5 mg 13CO,15N‐Leu. For the third sample, 1 mg of 13CO,15N‐Leu was manually mixed with sufficient talc to fill two rotor volumes and half of this mixture was used for the experiment. Fig. SI2 displays the 13CO spectra of these three samples, Table SI4 displays the ICO values determined from the spectral intensities, and Fig. SI3 displays a plot of the ICO vs mole 13CO as well as best‐fit line.
Figure SI2. 13C spectra of samples containing 13CO,
15N‐Leu mixed with talc. The samples for the
green, pink, and blue spectra respectively contained 0.5, 5, and 25 mg of 13CO,
15N‐Leu. The
relative scaling factors of the green, pink and blue spectra are 50, 5, and 1 and were chosen to facilitate assessment of the degree of linearity of intensity vs mass 13CO,15N‐Leu. Each REDOR S0 spectrum was acquired with 1 ms dephasing time and is the sum of 50,000 scans. Each
spectrum was processed with 200 Hz Gaussian line broadening and 5th order polynomial
baseline correction.
6

Table SI4. ICO values for the
13CO,15N‐Leu/talc samples
13CO,
15N‐Leu (mg)
13CO,
15N‐Leu (moles) ICO
a
0.5 3.75 × 10 ‐6 1432 (12)
5 3.75 × 10 ‐5 11666 (12)
25 1.88 × 10 ‐4 40603 (12)
a The uncertainty was calculated based on the spectral noise of the sample containing 0.5 mg 13CO,15N‐Leu. This spectrum was chosen because it had the smallest fluctuations arising from truncation of the free‐induction data. The intrinsic (non‐truncation) noise should be the same for all spectra because each was the sum of the same number of scans on the same spectrometer.
Figure SI3. ICO vs mole 13CO for three different samples prepared with 13CO,15N‐Leu manually mixed with talc to fill the 4 mm rotor volume. The best y = mx linear fit to the data is ICO =
2.12(13) × 108 mole 13CO. The best‐fit R2 = 0.9852.
7

I. HC determination of RP expression Fig. 1a displays the HC variant 13C spectra of the RP–lab and most RP+lab ICP samples and Fig. SI4 displays additional 13C spectra of the HPI samples.
Figure SI4. 13C REDOR S0 spectra with 1 ms dephasing time for three different ICP RP+lab samples
all with RP = HPI and 13CO‐Leu labeling. The 15N labeling differed among the samples but 15N
nuclei do not affect the S0 spectrum. Each spectrum is the sum of 50,000 scans and was processed with 100 Hz Gaussian line broadening and a 5th order baseline correction. Minor scaling of the intensities was done to have more equal aliphatic (0‐90 ppm) intensities among the three spectra.
8
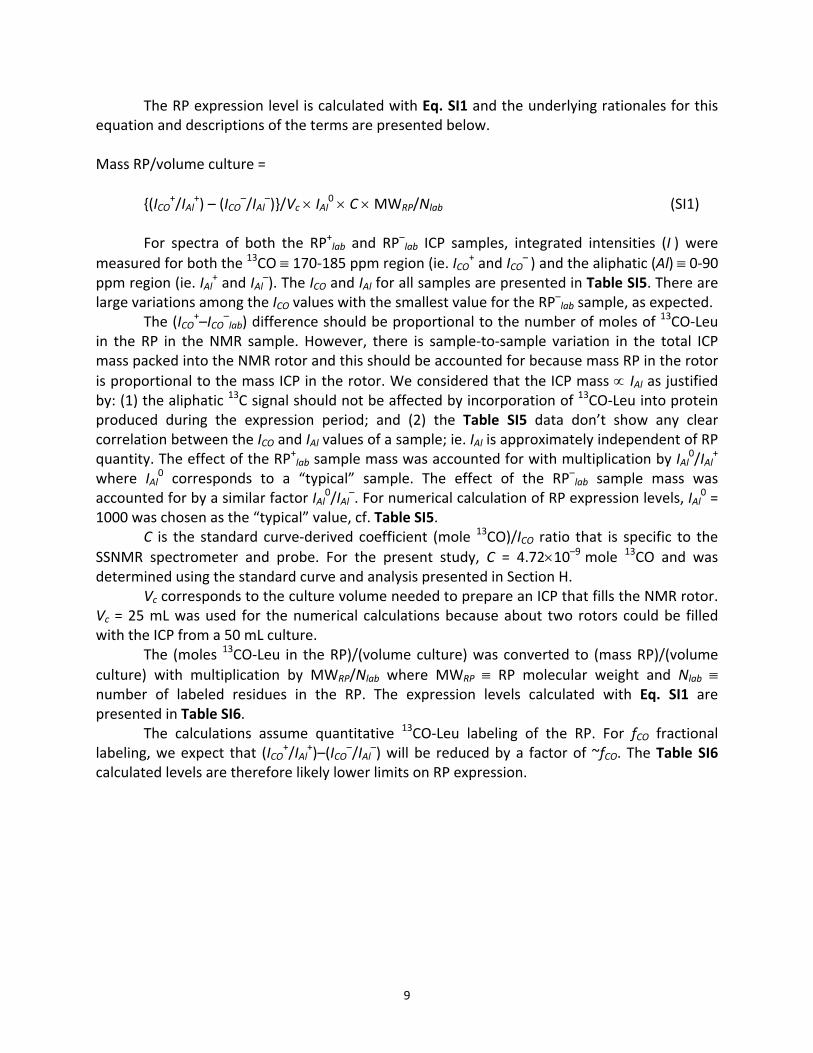
The RP expression level is calculated with Eq. SI1 and the underlying rationales for this equation and descriptions of the terms are presented below. Mass RP/volume culture =
{(ICO+/IAl
+) – (ICO–/IAl
–)}/Vc × IAl0 × C × MWRP/Nlab (SI1)
For spectra of both the RP+lab and RP–lab ICP samples, integrated intensities (I ) were
measured for both the 13CO ≡ 170‐185 ppm region (ie. ICO+ and ICO
– ) and the aliphatic (Al) ≡ 0‐90 ppm region (ie. IAl
+ and IAl–). The ICO and IAl for all samples are presented in Table SI5. There are
large variations among the ICO values with the smallest value for the RP–lab sample, as expected. The (ICO
+–ICO–lab) difference should be proportional to the number of moles of 13CO‐Leu
in the RP in the NMR sample. However, there is sample‐to‐sample variation in the total ICP mass packed into the NMR rotor and this should be accounted for because mass RP in the rotor is proportional to the mass ICP in the rotor. We considered that the ICP mass ∝ IAl as justified by: (1) the aliphatic 13C signal should not be affected by incorporation of 13CO‐Leu into protein produced during the expression period; and (2) the Table SI5 data don’t show any clear correlation between the ICO and IAl values of a sample; ie. IAl is approximately independent of RP quantity. The effect of the RP+lab sample mass was accounted for with multiplication by IAl
0/IAl+
where IAl0 corresponds to a “typical” sample. The effect of the RP–lab sample mass was
accounted for by a similar factor IAl0/IAl
–. For numerical calculation of RP expression levels, IAl0 =
1000 was chosen as the “typical” value, cf. Table SI5. C is the standard curve‐derived coefficient (mole 13CO)/ICO ratio that is specific to the
SSNMR spectrometer and probe. For the present study, C = 4.72×10⁻⁹ mole 13CO and was determined using the standard curve and analysis presented in Section H.
Vc corresponds to the culture volume needed to prepare an ICP that fills the NMR rotor. Vc = 25 mL was used for the numerical calculations because about two rotors could be filled with the ICP from a 50 mL culture.
The (moles 13CO‐Leu in the RP)/(volume culture) was converted to (mass RP)/(volume culture) with multiplication by MWRP/Nlab where MWRP ≡ RP molecular weight and Nlab ≡ number of labeled residues in the RP. The expression levels calculated with Eq. SI1 are presented in Table SI6.
The calculations assume quantitative 13CO‐Leu labeling of the RP. For fCO fractional labeling, we expect that (ICO
+/IAl+)–(ICO
–/IAl–) will be reduced by a factor of ~fCO. The Table SI6
calculated levels are therefore likely lower limits on RP expression.
9
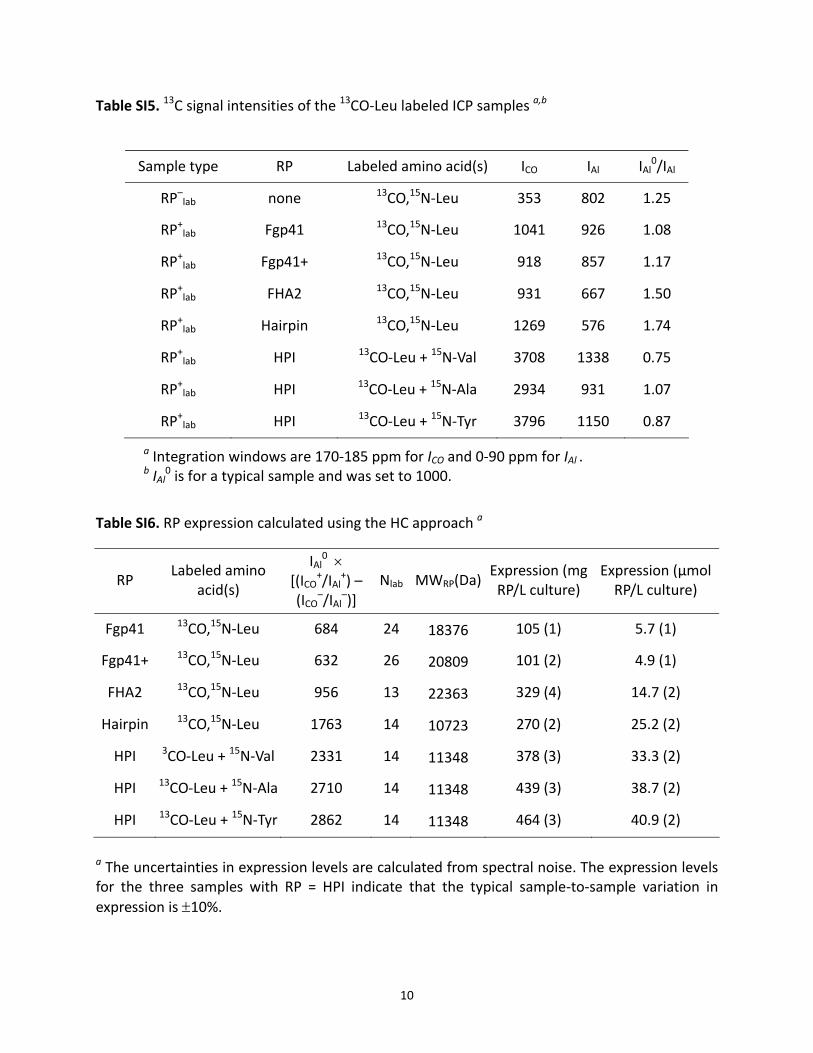
Table SI5. 13C signal intensities of the 13CO‐Leu labeled ICP samples a,b
Sample type RP Labeled amino acid(s) ICO IAl IAl0/IAl
RP–lab none 13CO,15N‐Leu 353 802 1.25
RP+lab Fgp41 13CO,15N‐Leu 1041 926 1.08
RP+lab Fgp41+ 13CO,15N‐Leu 918 857 1.17
RP+lab FHA2 13CO,15N‐Leu 931 667 1.50
RP+lab Hairpin 13CO,15N‐Leu 1269 576 1.74
RP+lab HPI 13CO‐Leu + 15N‐Val 3708 1338 0.75
RP+lab HPI 13CO‐Leu + 15N‐Ala 2934 931 1.07
RP+lab HPI 13CO‐Leu + 15N‐Tyr 3796 1150 0.87
a Integration windows are 170‐185 ppm for ICO and 0‐90 ppm for IAl . b IAl
0 is for a typical sample and was set to 1000.
Table SI6. RP expression calculated using the HC approach a
RP Labeled amino
acid(s)
IAl0 ×
[(ICO+/IAl
+) – (ICO
–/IAl–)]
Nlab MWRP(Da)Expression (mg RP/L culture)
Expression (μmol RP/L culture)
Fgp41 13CO,15N‐Leu 684 24 18376 105 (1) 5.7 (1)
Fgp41+ 13CO,15N‐Leu 632 26 20809 101 (2) 4.9 (1)
FHA2 13CO,15N‐Leu 956 13 22363 329 (4) 14.7 (2)
Hairpin 13CO,15N‐Leu 1763 14 10723 270 (2) 25.2 (2)
HPI 3CO‐Leu + 15N‐Val 2331 14 11348 378 (3) 33.3 (2)
HPI 13CO‐Leu + 15N‐Ala 2710 14 11348 439 (3) 38.7 (2)
HPI 13CO‐Leu + 15N‐Tyr 2862 14 11348 464 (3) 40.9 (2)
a The uncertainties in expression levels are calculated from spectral noise. The expression levels for the three samples with RP = HPI indicate that the typical sample‐to‐sample variation in expression is ±10%.
10
J. HCN determination of RP expression
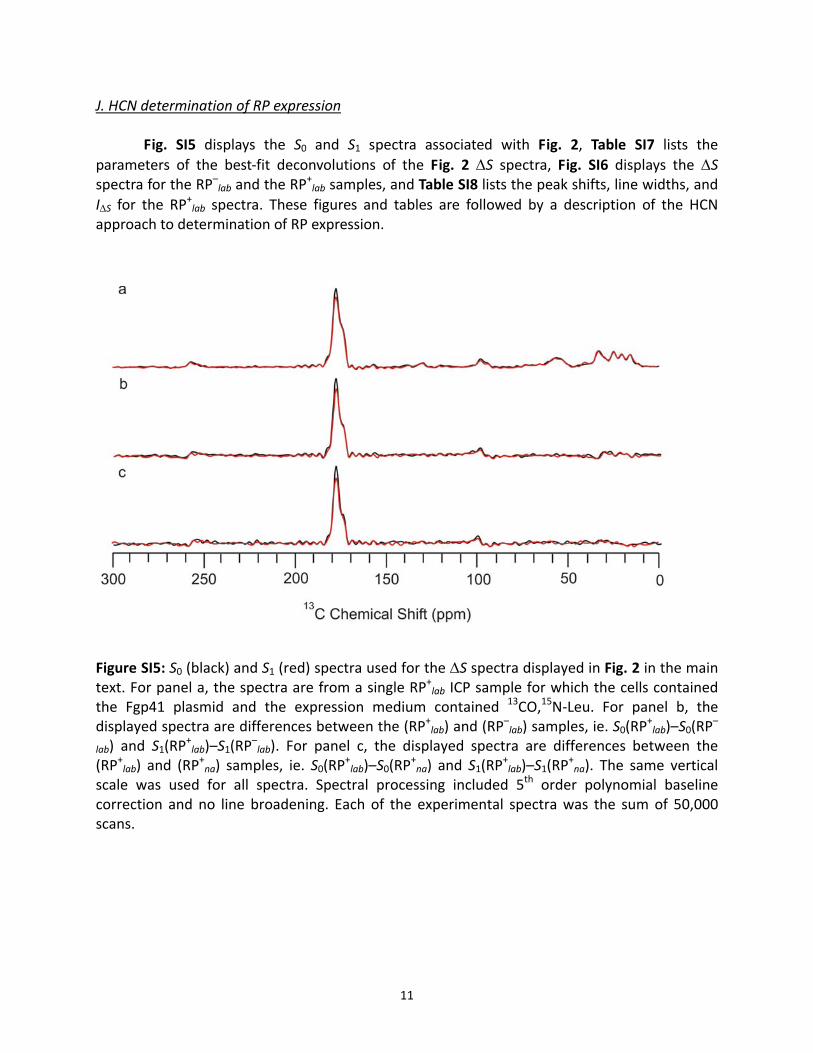
Fig. SI5 displays the S0 and S1 spectra associated with Fig. 2, Table SI7 lists the parameters of the best‐fit deconvolutions of the Fig. 2 ΔS spectra, Fig. SI6 displays the ΔS spectra for the RP–lab and the RP
+lab samples, and Table SI8 lists the peak shifts, line widths, and
IΔS for the RP+lab spectra. These figures and tables are followed by a description of the HCN
approach to determination of RP expression.
Figure SI5: S0 (black) and S1 (red) spectra used for the ΔS spectra displayed in Fig. 2 in the main text. For panel a, the spectra are from a single RP+lab ICP sample for which the cells contained the Fgp41 plasmid and the expression medium contained 13CO,15N‐Leu. For panel b, the displayed spectra are differences between the (RP+lab) and (RP
–lab) samples, ie. S0(RP
+lab)–S0(RP
–
lab) and S1(RP+lab)–S1(RP
–lab). For panel c, the displayed spectra are differences between the
(RP+lab) and (RP+na) samples, ie. S0(RP
+lab)–S0(RP
+na) and S1(RP
+lab)–S1(RP
+na). The same vertical
scale was used for all spectra. Spectral processing included 5th order polynomial baseline correction and no line broadening. Each of the experimental spectra was the sum of 50,000 scans.
11

Table SI7. Best‐fit deconvolutions of Fig. 2 ΔS spectra a
Fig. 2 spectrum Peak 13C shift (ppm) Linewidth (ppm) Integrated intensity
a 178.4 3.0 61 (7)
b 178.4 3.1 57 (6)
c 178.4 2.8 53 (5)
a The parameters are for the best‐fit Gaussian lineshape of the dominant 13CO spectral peak including full‐width at half‐maximum linewidth. The uncertainty in integrated intensity is the RMSD spectral noise in a 5 ppm region.
Figure SI6. ΔS spectra of the 13CO region of the RP–lab and RP+lab ICP samples with the indicated
13CO and 15N labeling and RP. Each ΔS spectrum was the difference between 50,000 S0 and 50,000 S1 scans and was processed without line broadening and with 5
th order polynomial baseline correction. The spectra are displayed with the same vertical scale.
12
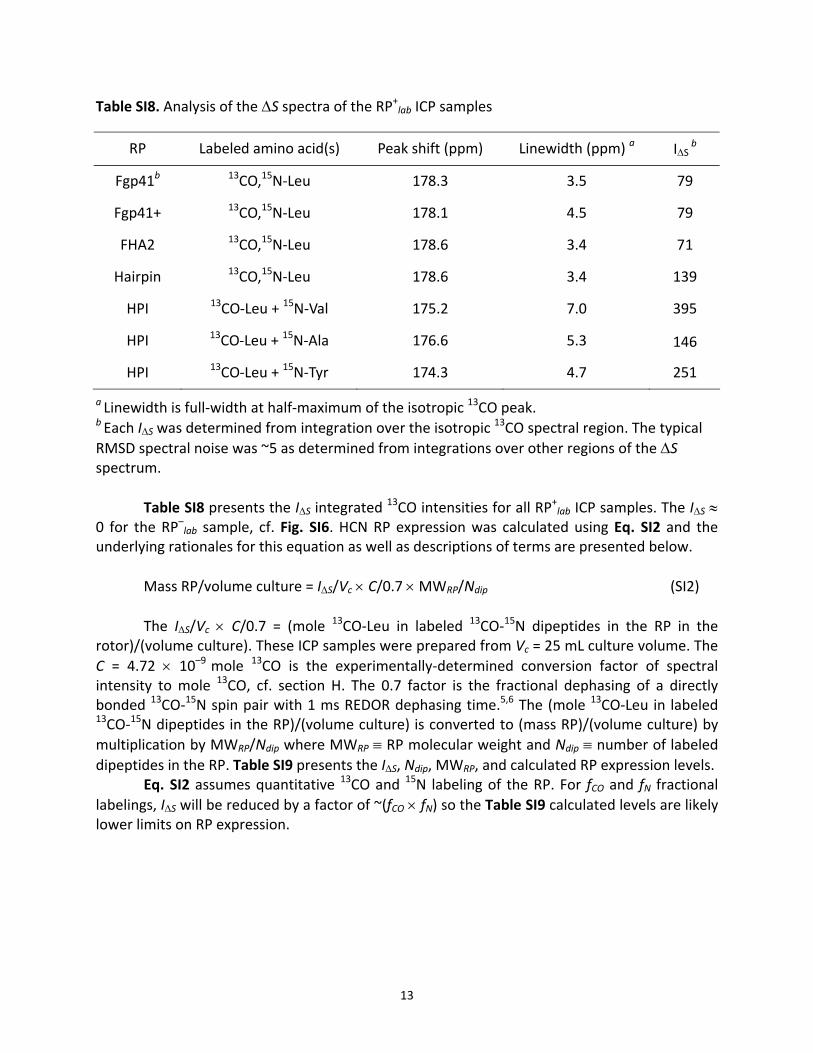
Table SI8. Analysis of the ΔS spectra of the RP+lab ICP samples
RP Labeled amino acid(s) Peak shift (ppm) Linewidth (ppm) a IΔS b
Fgp41b 13CO,15N‐Leu 178.3 3.5 79
Fgp41+ 13CO,15N‐Leu 178.1 4.5 79
FHA2 13CO,15N‐Leu 178.6 3.4 71
Hairpin 13CO,15N‐Leu 178.6 3.4 139
HPI 13CO‐Leu + 15N‐Val 175.2 7.0 395
HPI 13CO‐Leu + 15N‐Ala 176.6 5.3 146
HPI 13CO‐Leu + 15N‐Tyr 174.3 4.7 251
a Linewidth is full‐width at half‐maximum of the isotropic 13CO peak. b Each IΔS was determined from integration over the isotropic 13CO spectral region. The typical RMSD spectral noise was ~5 as determined from integrations over other regions of the ΔS spectrum.
Table SI8 presents the IΔS integrated 13CO intensities for all RP+lab ICP samples. The IΔS ≈
0 for the RP–lab sample, cf. Fig. SI6. HCN RP expression was calculated using Eq. SI2 and the underlying rationales for this equation as well as descriptions of terms are presented below.
Mass RP/volume culture = IΔS/Vc × C/0.7 × MWRP/Ndip (SI2) The IΔS/Vc × C/0.7 = (mole 13CO‐Leu in labeled 13CO‐15N dipeptides in the RP in the
rotor)/(volume culture). These ICP samples were prepared from Vc = 25 mL culture volume. The C = 4.72 × 10⁻⁹ mole 13CO is the experimentally‐determined conversion factor of spectral intensity to mole 13CO, cf. section H. The 0.7 factor is the fractional dephasing of a directly bonded 13CO‐15N spin pair with 1 ms REDOR dephasing time.5,6 The (mole 13CO‐Leu in labeled 13CO‐15N dipeptides in the RP)/(volume culture) is converted to (mass RP)/(volume culture) by multiplication by MWRP/Ndip where MWRP ≡ RP molecular weight and Ndip ≡ number of labeled dipeptides in the RP. Table SI9 presents the IΔS, Ndip, MWRP, and calculated RP expression levels.
Eq. SI2 assumes quantitative 13CO and 15N labeling of the RP. For fCO and fN fractional labelings, IΔS will be reduced by a factor of ~(fCO × fN) so the Table SI9 calculated levels are likely lower limits on RP expression.
13

Table SI9. HCN determination of RP expression a
RP Labeled amino acid(s) IΔS Ndip MWRP (Da)Expression (mg RP/L culture)
Expression (μmol RP/L culture)
Fgp41 13CO,15N‐Leu 78.6 6 18376 65 (4) 3.5 (2)
Fgp41+ 13CO,15N‐Leu 78.9 6 20809 74 (4) 3.5 (2)
FHA2 13CO,15N‐Leu 71.1 1 22363 429 (23) 19.2 (1.0)
Hairpin 13CO,15N‐Leu 138.6 4 10723 100 (4) 9.3 (4)
HPI 13CO‐Leu + 15N‐Val 394.6 2 11348 603 (7) 53.2 (6)
HPI 13CO‐Leu + 15N‐Ala 146.3 1 11348 447 (17) 39.4 (1.5)
HPI 13CO‐Leu + 15N‐Tyr 250.8 2 11348 384 (4) 33.8 (4)
a Uncertainties in expression levels are based on spectral noise.
Unlike the HC approach, determination of RP expression with the HCN approach did not take into account the ICP mass that was packed into the NMR rotor. This reflects the possibility that the HCN approach could be applied to a single RP+lab sample. For this case, it would be difficult to assess the “typical” value IAl
0 and the IAl0/IAl
+ scaling factor. For the present study, we have IAl values from several RP+lab and RP
–lab samples and have estimated IAl
0 = 1000. Inclusion of the IAl
0/IAl scaling factor in the HCN analysis improves agreement between the expression levels calculated with the HC and HCN approaches. In particular, the HCN expression level for Hairpin increases from 100 to 175 mg/L and becomes much closer to the 270 mg/L level calculated with the HC approach. References (1) Bodner, M. L.; Gabrys, C. M.; Parkanzky, P. D.; Yang, J.; Duskin, C. A.; Weliky, D. P. Magn. Reson. Chem. 2004, 42, 187. (2) Zheng, Z.; Yang, R.; Bodner, M. L.; Weliky, D. P. Biochemistry 2006, 45, 12960. (3) Morcombe, C. R.; Zilm, K. W. J. Magn. Reson. 2003, 162, 479. (4) Tong, K. I.; Yamamoto, M.; Tanaka, T. J. Biomol. NMR 2008, 42, 59. (5) Gullion, T. Concepts Magn. Reson. 1998, 10, 277. (6) Yang, J. Ph. D. Thesis, Michigan State University, East Lansing, MI, 2003.
14