quantifying the distribution and mechanisms accommodating
TRANSCRIPT

University of Nebraska - LincolnDigitalCommons@University of Nebraska - LincolnDissertations & Theses in Earth and AtmosphericSciences Earth and Atmospheric Sciences, Department of
Summer 7-27-2018
Quantifying the distribution and mechanismsaccommodating penetrative strain along thewestern margin of the Laramide Denver-JulesburgBasinMarques HatfieldUniversity of Nebraska - Lincoln, [email protected]
Follow this and additional works at: http://digitalcommons.unl.edu/geoscidiss
Part of the Earth Sciences Commons, and the Oceanography and Atmospheric Sciences andMeteorology Commons
This Article is brought to you for free and open access by the Earth and Atmospheric Sciences, Department of at DigitalCommons@University ofNebraska - Lincoln. It has been accepted for inclusion in Dissertations & Theses in Earth and Atmospheric Sciences by an authorized administrator ofDigitalCommons@University of Nebraska - Lincoln.
Hatfield, Marques, "Quantifying the distribution and mechanisms accommodating penetrative strain along the western margin of theLaramide Denver-Julesburg Basin" (2018). Dissertations & Theses in Earth and Atmospheric Sciences. 105.http://digitalcommons.unl.edu/geoscidiss/105

Quantifying the distribution and mechanisms accommodating penetrative strain along
the western margin of the Laramide Denver-Julesburg Basin
By
Marques Hatfield
A THESIS
Presented to the Faculty of
The Graduate College at the University of Nebraska
In Partial Fulfillment of Requirements
For the Degree of Master of Science
Major: Earth and Atmospheric Sciences
Under the Supervision of Professor Caroline M. Burberry
Lincoln, Nebraska
July, 2018

Quantifying the distribution and mechanisms accommodating penetrative strain along the
western margin of the Laramide Denver-Julesburg Basin
Marques Hatfield, M.S.
University of Nebraska, 2018
Advisor: Caroline M. Burberry
Grain-scale volume loss is an important process in the deformation of a fold-
thrust belt. Prior to activation of slip on fault surfaces, and initiation of layer buckling in
folds, instability is recorded by thickening of parallel bedding surfaces, grain boundary
migration, and stress-induced solution transfer of mineral grains. Volume loss recorded
by these mechanisms is significant but is an afterthought in any type of cross-section
restoration.
This research has three main objectives. Firstly, to estimate the amount of
penetrative strain (PS) accommodated in weakly deformed sandstones along four E-W
transects, from the thick-skinned Colorado Front Range into the Denver-Julesburg Basin.
The methods employed to accomplish this were petrographic analysis, analog modeling,
and cross-section restoration. Next, the distribution and mechanisms by which PS is
accommodated in thick-skinned versus thin-skinned deformation belts were compared.
Analog models simulating Laramide deformation helped to gain insight into strain
partitioning by mimicking the change in crustal architecture from the Sevier belt into
Laramide foreland basins. Finally, the study measured how changes in PS correlate with

changes in physical parameters such as porosity and rebound strength. Additional
factors, such as distance from major fault structures, were considered.
Results from samples within the Denver-Julesburg Basin record PS between 8%
and 12%. An early hypothesis suggested PS would correlate strongly with porosity and
rebound strength and would decay with increasing distance from faults. This research
indicates a weak correlation between these parameters when all samples are
incorporated into the analysis. A robust correlation is noted when values for these
parameters are averaged by formation or transect.
PS values are limited by saturation of pressure solution shortening from grain
impingement alone, while porosity values fluctuate with surface weathering. Analog
models record decreased PS with increasing depth in the sedimentary section due to the
presence of a rigid basement. Finally, cross-section restorations along Horsetooth
Reservoir, the northernmost transect in the field area, and Rt. 34, near Loveland, record
tectonic shortening values of 10% and 12.2%. Integration of tectonic shortening values,
and PS values derived from analog models, estimate 0.79 and 0.36 km of PS related
volume loss across the transects.

i
Acknowledgements
I would like to thank the following people and organizations that made this
research possible. First and foremost, I want to thank my amazing wife for her constant
support and willingness to go on this adventure with me. Her kindness, humor, and
consistent faith in my ability is the only thing that kept me sane during the toughest
moments. I want to thank my advisor, Dr. Caroline Burberry, for her patience, guidance,
and periodic discussions, which helped alleviate concerns when I lost faith in my project
direction. I want to thank Dr. Chris Fielding for being on my committee, but also for
being a terrific teacher who taught me so much and helped me learn to appreciate
sedimentary rocks. Dr. Irina Filina, for being on my committee, and being kind and
supportive whenever I came to her for help or advice, which was often. I want to
acknowledge Dr. Jeffrey Murphy, at the University of Alberta, who wrote a script for an
ImageJ macro for this project. This was a kind gesture that saved me a lot of time and
effort in my thin section analysis. Dr. Tracy Frank, for allowing me access to her
petrography lab; Mingyu Yang for helping me with CL imaging and producing full thin
section scans; and Jimmy Lowe, for re-running two analog models for my research.
I would like to thank the department of Earth and Atmospheric Science for
providing funding support and a teaching assistantship that allowed me to have this
wonderful opportunity. Without this, I would not have had the chance to engage with
students at UNL and realize I actually enjoy teaching. I want to thank the Geological
Society of America for providing me with a research grant that helped me turn this

ii
project into something I am proud of. I also want to thank Midland Valley for the
academic license on their MOVE software.
I want to extend a special thank you to Shamar Chin for patiently answering
every annoying logistical question I had about graduate school, and generally being a
positive voice in my academic pursuits. Finally, I want to thank Gosia Mahoney, Ryan
Mustacato, Aaron Hess, Mei Liu, and Ted Matheson for being awesome people that I am
glad I got the opportunity to know during my time at UNL.

iii
Table of Contents 1. Introduction ................................................................................................................................. 1
1.1 Sevier deformation belt ......................................................................................................... 1
1.2 Laramide deformation belt .................................................................................................... 4
1.2.1 Plate convergence ........................................................................................................... 9
1.2.2 Shallowing subduction .................................................................................................. 10
1.3 Penetrative strain overview ................................................................................................. 12
1.4 Study location and motivation ............................................................................................. 16
2. Lithologic and structural relationships ...................................................................................... 18
3. Methods ..................................................................................................................................... 23
3.1 Pressure solution shortening ............................................................................................... 23
3.2 Porosity measurements ....................................................................................................... 26
3.3 Analog modeling .................................................................................................................. 28
3.3.2 Model setup .................................................................................................................. 30
3.4 Cross-section restoration ..................................................................................................... 32
3.5 Mechanical stratigraphy ...................................................................................................... 34
4. Results: Unit Descriptions .......................................................................................................... 35
4.1 Fountain Formation ............................................................................................................. 35
4.2 Satanka (Owl Canyon) Formation ........................................................................................ 38
4.4 Lykins Formation .................................................................................................................. 42
4.5 Sundance Formation ............................................................................................................ 42
4.6 Morrison Formation ............................................................................................................. 43
4.7 Dakota Group ....................................................................................................................... 45
4.8 Niobrara Formation ............................................................................................................. 47
4.9 Pierre Shale .......................................................................................................................... 48
4.10 Fox Hills Sandstone ............................................................................................................ 49
4.11 Laramie Formation ............................................................................................................. 51
5. Results: Thin Section Analysis for Penetrative Strain ................................................................ 53
5.1 Pressure solution shortening ............................................................................................... 53
5.2 Layer parallel shortening (LPS) vs. compaction ................................................................... 54
6. Porosity measurements ............................................................................................................. 57
7. Results: Rebound measurements .............................................................................................. 60

iv
8. Results: Analog modeling results ............................................................................................... 63
9. Results: Cross-section restoration ............................................................................................. 67
10. Results Summary...................................................................................................................... 70
11. Discussion................................................................................................................................. 71
11.1 Physical and mechanical properties .................................................................................. 71
12. Conclusions .............................................................................................................................. 81
13. Future research directions ....................................................................................................... 83
References ..................................................................................................................................... 85
Appendix A. .................................................................................................................................... 95
Appendix B. .................................................................................................................................. 100
Appendix C. .................................................................................................................................. 101

v
LIST OF FIGURES
FIGURE 1 .......................................................................................................................................................... 2
FIGURE 2 .......................................................................................................................................................... 4
FIGURE 3 .......................................................................................................................................................... 6
FIGURE 4 .......................................................................................................................................................... 8
FIGURE 5 ........................................................................................................................................................ 11
FIGURE 6 ........................................................................................................................................................ 13
FIGURE 7.. ...................................................................................................................................................... 15
FIGURE 8 ........................................................................................................................................................ 17
FIGURE 9 ........................................................................................................................................................ 19
FIGURE 10 ...................................................................................................................................................... 20
FIGURE 11 ...................................................................................................................................................... 21
FIGURE 12 ...................................................................................................................................................... 24
FIGURE 13 ...................................................................................................................................................... 26
FIGURE 14 ...................................................................................................................................................... 27
FIGURE 15 ...................................................................................................................................................... 28
FIGURE 16 ...................................................................................................................................................... 30
FIGURE 17 ...................................................................................................................................................... 31
FIGURE 18 ...................................................................................................................................................... 33
FIGURE 19 ...................................................................................................................................................... 37
FIGURE 20 ...................................................................................................................................................... 40
FIGURE 21 ...................................................................................................................................................... 47
FIGURE 22 ...................................................................................................................................................... 54
FIGURE 23 ...................................................................................................................................................... 55
FIGURE 24 ...................................................................................................................................................... 59
FIGURE 25 ...................................................................................................................................................... 59
FIGURE 26 ...................................................................................................................................................... 60
FIGURE 27 ...................................................................................................................................................... 61
FIGURE 28 ...................................................................................................................................................... 63
FIGURE 29 ………………………………………………………………………………………………………………………………………………65
FIGURE 30 ………………………………………………………………………………………………………………………………………………67
FIGURE 31 ………………………………………………………………………………………………………………………………………………69
FIGURE 32 ………………………………………………………………………………………………………………………………………………72

1
1. Introduction
The Sevier and Laramide orogenies are overlapping large-magnitude
deformation events which affected the North American Cordillera from the Late Jurassic
through the Eocene (DeCelles, 2004). Although these events overlap temporally and are
products of the same far field deformation source, each has a distinct deformation style
which makes them recognizable in the rock record. The Sevier deformation (~140 –50
Ma) belt is characterized by thin-skinned thrusting, high-angle subduction, a large
magmatic arc east of the accretionary prism, and a highly extended post Eocene Basin
and Range province (Weil and Yonkee, 2015). The Laramide Province (~70-35 Ma) is
distinct for basement involved thrusting, a change to low-angle subduction, and a
significant magmatic gap across the Sierra Nevada and Mojave regions, similar to what is
seen in the modern-day Andes (Coney and Reynolds, 1977; Allmendinger et al., 1997).
The driving forces responsible for tectonic shortening in these regions are NE-SW
directed, horizontal compressive stresses forming regional-scale folds and thrusts
(Coney, 1976). Previous studies place estimates on Sevier shortening in the Wyoming-
Idaho thrust belt close to 50%, while Laramide estimates fall between 10% and 15%
(Erslev, 1993). However, not all deformation may be quantified from tectonic shortening
alone, as deformation is distributed not only among macroscale features, but also on
the microscale (Mitra, 1994).
1.1 Sevier deformation belt
The Sevier belt is characterized by thin-skinned deformation of an upper crustal

2
Figure 1. Schematic cross-section illustrating examples of thin-skinned and thick-skinned tectonics. (Priffner, 2017).
sedimentary sequence (Figure 1; Pfiffner, 2006; Pfiffner, 2017). This cover sequence
encompasses multiple pulses of sedimentation, including deposition of the
Mesoproterozoic Belt basin strata in the intermountain west region of Idaho, Montana,
and British Columbia, Neoproterozoic to late Devonian siliciclastic and volcanic rocks
deposited during regional rifting events, carbonate-rich Cambrian to Devonian rocks
deposited along the passive margin of North America, prior to the protracted Antler and
Sonoma orogenies, and mixed siliciclastic and carbonate rocks deposited during the
Mississippian to Jurassic from formation of magmatic arcs and associated basins along
the developing continental margin (Hoffman, 1989; Dickinson, 2004; Gehrels and Pecha,
2014). The largest of these sequences is The Belt Supergroup, a ~15-20 km thick
sedimentary sequence deposited between ~1.47 – 1.40 Ga, although termination of
sedimentation could have been as late as ~1.37 Ga (Lydon, 2007). By volume, the largest
deposit within the Belt Supergroup is the Prichard formation, a 12 km thick turbidite

3
succession characterized by fine-grained pelites with quartzite and sandstone lenses
(Lydon, 2008).
The Sevier belt trends broadly along a curved, N-S axis. The signature arcuate
shape of the belt developed from wide spaced thrusting of thick passive margin strata
(Weil and Yonkee, 2015). Eastward progression of the thrust front created multiple
stacked thrust sheets and signified a change in the type of deformation as loading on
the wedge increased (DeCelles and Giles, 1996). Deeper crustal layers evolved from
brittle to plastic deformation and saw weakening of less competent basal detachments
as loading continued during the Cretaceous (Weil and Yonkee, 2015). This correlated
with increased internal deformation of the thrust wedge. The archetype location for
stacked Sevier style thrust sheets is along the Wyoming overthrust belt (Pfiffner, 2006).
This area provides the best example of thin-sheet thrusting, as it lies to the west of
basement cored Laramide deformation and to the east of the highly extended and
faulted Basin and Range terrain, where it has been exempt from both post-Eocene
magmatism and gravitational collapse of the western Cordillera (Weil and Yonkee,
2015). These thrust sheets display characteristic ramp and flat geometries associated
with fault-bend, fault propagation, and detachment fold structures (Weil and Yonkee,
2015). The more competent rocks, such as the thick-bedded carbonates and sandstones,
form the ramps, while the less well indurated shales and evaporates form the flats along
which the thrust sheets slid (Weil and Yonkee, 2015). Previous studies suggest internal
deformation occurs more readily in sedimentary rocks which lie above a weak basal

4
detachment, such as a shale or evaporite, as those rocks more readily allow strain
partitioning across their surfaces (Lathrop and Burberry, 2016).
1.2 Laramide deformation belt
The Colorado Front Range (CFR) marks the easternmost extent of the North
American Rocky Mountains (Figure 2). The CFR has undergone multiple cycles of
deformation related to repeated uplift of its Precambrian core (Kellogg et al., 2004). As
basement cored arches have formed structural highs within the CFR, piggyback basins,
such as the Denver-Julesburg (D-J) basin, have developed ahead of the regional
deformation front (Barkmann et al., 2015). The D-J Basin is a large, asymmetrical
foreland basin which stretches from eastern Colorado into southwest Nebraska,
southeast Wyoming and western Kansas (Higley and Cox, 2007).
The Laramide belt is characterized by thick-skinned, or basement involved,
thrusting, which differentiates it from the Sevier belt, where deformation is localized to
Figure 2. Inset map of the field area in the Colorado Front Range and Denver Basin. The study area is in the red rectangle. Sample locations are marked in blue. Image on the right is taken from Google Earth.
5
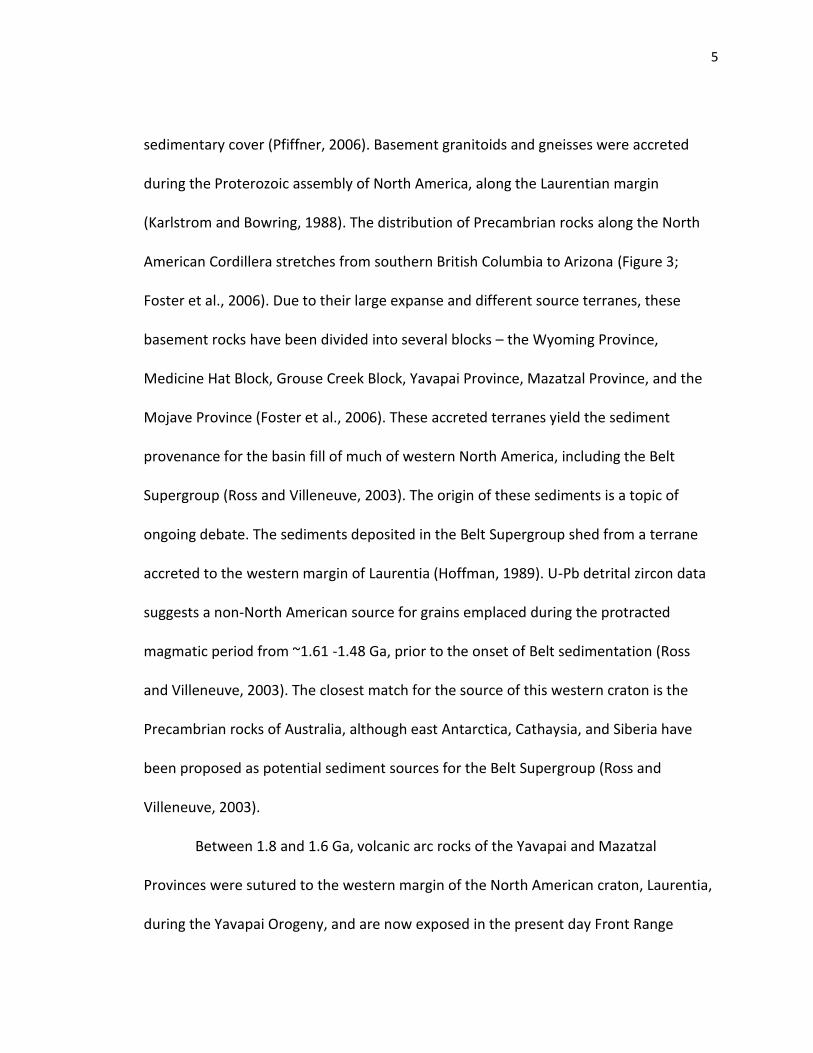
sedimentary cover (Pfiffner, 2006). Basement granitoids and gneisses were accreted
during the Proterozoic assembly of North America, along the Laurentian margin
(Karlstrom and Bowring, 1988). The distribution of Precambrian rocks along the North
American Cordillera stretches from southern British Columbia to Arizona (Figure 3;
Foster et al., 2006). Due to their large expanse and different source terranes, these
basement rocks have been divided into several blocks – the Wyoming Province,
Medicine Hat Block, Grouse Creek Block, Yavapai Province, Mazatzal Province, and the
Mojave Province (Foster et al., 2006). These accreted terranes yield the sediment
provenance for the basin fill of much of western North America, including the Belt
Supergroup (Ross and Villeneuve, 2003). The origin of these sediments is a topic of
ongoing debate. The sediments deposited in the Belt Supergroup shed from a terrane
accreted to the western margin of Laurentia (Hoffman, 1989). U-Pb detrital zircon data
suggests a non-North American source for grains emplaced during the protracted
magmatic period from ~1.61 -1.48 Ga, prior to the onset of Belt sedimentation (Ross
and Villeneuve, 2003). The closest match for the source of this western craton is the
Precambrian rocks of Australia, although east Antarctica, Cathaysia, and Siberia have
been proposed as potential sediment sources for the Belt Supergroup (Ross and
Villeneuve, 2003).
Between 1.8 and 1.6 Ga, volcanic arc rocks of the Yavapai and Mazatzal
Provinces were sutured to the western margin of the North American craton, Laurentia,
during the Yavapai Orogeny, and are now exposed in the present day Front Range

6
Figure 3. Distribution of Precambrian basement rocks throughout western North America.
(Karlstrom and Bowring, 1988). These rocks were intruded by 1.5 to 1.3 Ga granitic
plutons during intracontinental rifting related to far field stresses of the Berthoud
Orogeny (Karlstrom and Bowring, 1988). Along with the Grenville Orogeny (1.1 Ga), and
the breakup of the supercontinent Rodinia (0.9 – 0.6 Ga), these three rifting events
created anisotropies in the crust which would be important for later reactivation of
Archean-Proterozoic basement lineaments (Marshak et al., 2001).
Despite these rifting events, the time between the late Proterozoic and the

7
Pennsylvanian was a period of relative tectonic quiescence (Oldow et al., 1989). Periodic
rises and falls in sea level dominated this period, but evidence of marine and terrestrial
sedimentation has largely been eroded away, marked by several large unconformities
across western North America (Sloss, 1963). These regional unconformities represent
boundaries of deposition by epeiric seas during marine transgressive cycles, such as the
Sauk, Tippecanoe, and Kaskaskia cratonic sequences, and their subsequent regressions
(Sloss, 1963). Previous work has suggested that during the Pennsylvanian, intracratonic
block uplifts formed in the present-day Front Range from northwest-directed stresses
associated with the collision of North America with South America-Africa (Kluth and
Coney, 1981). This deformation occurred from suturing of tectonic plates during the
assembly of Pangea in the Ouachita-Marathon orogeny (Kluth and Coney, 1981). By the
middle of the Pennsylvanian, foreland deformation reached its maximum extent within
the craton in what is now Colorado and western Utah (Kluth and Coney, 1981). This
mobilized pre-existing basement faults along reactivation surfaces weakened during
Proterozoic rifting and culminated in the regional uplift event of the Ancestral Rocky
Mountains (ARM) (Kluth and Coney, 1981). Recent studies have debated this
interpretation and suggested multiple syn-deformational collisional events occurring
along the Nevada and Sonoma margins at the same time creating a three-sided orogen
that more accurately explains the stress field responsible for ARM related structures
(Figure 4; Leary et al., 2017). Despite the vast, intraplate nature of the deformation,
enough uplift was generated for substantial erosion to occur during the Pennsylvanian
and Permian, with sediment accumulating in the adjacent Denver Basin. By the end of

8
Figure 4. Map from Leary (2017) illustrating the the major provinces, stress fields, and depositional processes of the 3-sided orogen that produced the Ancestral Rocky Mountains uplift.

9
the Permian, denudation of the landscape returned the topography of the ARM to its
original state (Soreghan et al., 2012).
In the late Jurassic, thin-skinned deformation of the Sevier Orogeny developed to
the west of the CFR as the Farallon and Kula plates subducted beneath the North
American plate (DeCelles, 2004). Over the ensuing 100 million years, contractional
deformation propagated roughly 1000 kilometers eastward resulting in the formation of
the Laramide Rocky Mountain ranges (DeCelles, 2004). From the late Albian to
Maastrichtian, sedimentation within the D-J Basin changed from terrigenous to shallow
marine. Western North America was divided by an epicontinental seaway as sea level
rose during a global marine transgression. During inundation, thick deposits of organic-
rich source rocks were laid down within the basin, as well as oil and gas-bearing
reservoir rocks, such as the Dakota Group sandstones (Higley and Cox, 2007).
Eventually, the seaway regressed, and the progressing deformation front transitioned
from thin-skinned Sevier to thick-skinned Laramide style (Weil and Yonkee, 2015).
1.2.1 Plate convergence
The Laramide orogeny is characterized by shallowing slab subduction of the Farallon
Plate beneath the North American plate (Figure 5; Kent and Irving, 2010). Rates of
absolute plate motion yield the dominant controls on the shallowing angle of the
downgoing slab, as increasing convergence rates led to subduction of hotter, more
buoyant oceanic crust (Heuret and Lallemand, 2005). Elevated convergence rates
coincided with the opening of the North Atlantic Ocean (DeCelles, 2004). Spreading
rates along the Mid-Atlantic Ridge increased to nearly 30 mm/yr during the Late

10
Cretaceous (DeCelles, 2004). Without the driving force of slab pull from the negative
buoyancy of older oceanic crust, a decoupling of the overriding and subducting plate
occurred (Weil and Yonkee, 2015). This led to a decrease in trench rollback, as well as
migration and thickening of the trench away from the margin (Heuret and Lallemand,
2005). Estimates of plate motion history place convergence rates in the late Jurassic to
early Cretaceous between 30-60 mm/yr (Weil and Yonkee, 2015). By the late Cretaceous
and Paleogene, these plates were converging at 80-120 mm/yr, more than double the
rate of the late Jurassic (Humphreys, 1995). The direction of the relative plate motion of
the Farallon and North American plates was not directly orthogonal to the plate margin
(Dickinson and Lawton, 2001). Oblique convergence along the margin meant
accommodation of stress was transferred to a partial shear stress, which was
manifested in the formation of strike-slip faults, as well as transtensional shear zones,
such as the Idaho-Ralston shear zone, a Proterozoic mylonite zone reactivated during
the Laramide Orogeny (Dickinson and Lawton, 2001; Shaw et al., 2002).
1.2.2 Shallowing subduction
Shallowing subduction allowed for deformation to occur far inland of the plate
margin (Coney and Reynolds, 1977). Tomographic images of the slab segment show that
parts of the Farallon plate were deeper and thinner in present day Wyoming than on the
Colorado Plateau (Liu et al., 2011). This corresponds with increased subsidence rates,
from south to north, and northeastward migration of the plate around 80 Ma (Liu et al.,
2011). This is attributed to subduction of normal oceanic crust beneath Wyoming while
underneath Utah and Colorado there was a thickened oceanic plateau (Liu et al., 2011).

11
Figure 5. A series of diagrams outlining the evolution of the western North American plate margin from the late Jurassic through the Eocene as the subducting Farallon plate continuously shallows (Weil and Yonkee, 2015).
Analysis of shortening strains preserved in twinned calcite fabrics of Cambrian-
Cretaceous carbonates suggest that deformation occurred >2000 km inboard of the
plate margin, deep into the cratonic interior, and paleostresses indicate a rotation of the
dominant stress field from E-W directed Sevier shortening to NNE-SSW directed
Laramide shortening (Craddock and van der Pluijm, 1999). Faults from the ARM uplifts,
as well as Proterozoic rifts, were once again reactivated, and overprinted fabrics during
this orogeny (Barbeau, 2003). These faults developed on the margins of the Denver-
Julesburg Basin and are responsible for thrusting Precambrian basement rock over the

12
sedimentary cover sequence. Due to the significant thrust-related uplift and the
continuing shedding of sediment along the CFR, the D-J Basin deepened and developed
its signature asymmetric nature (Higley and Cox, 2007). The basin fill is now 4 km thick
at its maximum depth, and the progressive burial of sediment has allowed for the
thermal maturation of source rocks within the oil generation window (Higley and Cox,
2007).
1.3 Penetrative strain overview
Penetrative strain is broadly characterized as the total amount of shortening that
is not accommodated by the formation of macroscale structures such as folds and
thrusts (Burberry, 2015). Shortening of a thrust sheet in the early stage of compression
is dominated by internal deformation of the layers (Mitra, 1997). This type of
deformation is characterized as layer parallel shortening (LPS), or more broadly as
penetrative deformation (Mitra, 1997). LPS is expressed in area and volume changes
which precede fault slip or fold buckling (Mitra, 1997). Once frictional effects and the
angle of the basal slippage surface are conducive to movement as stress is applied, a
wedge develops allowing shortening to occur from back to front (DeCelles and Mitra,
1995). The amount of LPS continuously evolves as internal strain intensifies and
eventually manifests itself through the accommodation of displacement along slip
surfaces and buckling of thickened layers (Burberry, 2015). The amount of LPS
calculated at any moment is dependent on where the measurement occurs temporally
in the buildup of strain.
13
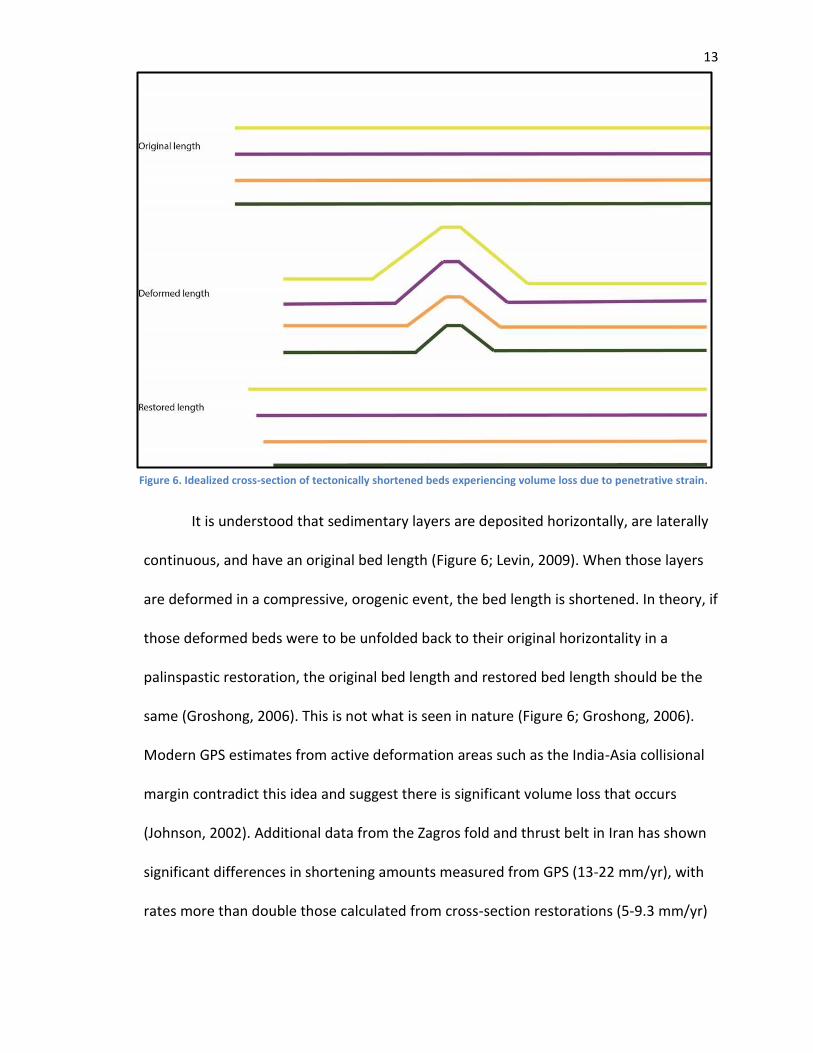
It is understood that sedimentary layers are deposited horizontally, are laterally
continuous, and have an original bed length (Figure 6; Levin, 2009). When those layers
are deformed in a compressive, orogenic event, the bed length is shortened. In theory, if
those deformed beds were to be unfolded back to their original horizontality in a
palinspastic restoration, the original bed length and restored bed length should be the
same (Groshong, 2006). This is not what is seen in nature (Figure 6; Groshong, 2006).
Modern GPS estimates from active deformation areas such as the India-Asia collisional
margin contradict this idea and suggest there is significant volume loss that occurs
(Johnson, 2002). Additional data from the Zagros fold and thrust belt in Iran has shown
significant differences in shortening amounts measured from GPS (13-22 mm/yr), with
rates more than double those calculated from cross-section restorations (5-9.3 mm/yr)
Figure 6. Idealized cross-section of tectonically shortened beds experiencing volume loss due to penetrative strain.

14
(McQuarrie, 2004; Agard et al., 2005; Lathrop and Burberry, 2017). This discrepancy
between the bed lengths can be attributed to volume loss related to the formation of
microscale structures, such as pressure solution, calcite twinning, grain impingement,
grain rotation, pore-scale compaction, and undulatory extinction, as well as sub-seismic
scale brittle structures that record layer-parallel shortening like cleavage, minor faults
and fold, and fractures (Whitaker and Bartholomew, 1999; Koyi, 2003; Burberry, 2015;
Lathrop and Burberry, 2016). Penetrative strain deformation is typically not
incorporated into regional cross-sections, therefore any restoration which incorporates
tectonic shortening alone is fundamentally flawed (Woodward et al., 1986; Burberry,
2015). In order to accurately predict subsurface deformation and associated fluid flow,
more accurate estimates on microstructural strain are required. Without attempting to
incorporate penetrative strain deformation, a holistic interpretation of fluid flow
pathways, porosity, permeability, and general reservoir quality cannot be reached.
Geologic models constructed from this information, including those focusing on
infrastructure, water resources, natural resource extraction, and city planning, are
incomplete. The lack of integration of grain-scale deformation may also provide
inaccurate information about the amount of slip occurring on major fault surfaces. Since
volume loss is not accounted for in regional shortening estimates, it can be assumed
that total slip distance and slip rates are being overestimated.
Previous studies have utilized different methods, such as pressure solution,
calcite twinning, cleavage development, magnetic susceptibility, and deformed fossils to
quantify the amount of volume loss during orogenesis. Values for penetrative strain

15
range from 2% to 23% in these studies (Figure 7; Engelder and Engelder, 1977;
Engelder, 1979; Wilschko et al., 1985; Craddock and Van de Pluijm, 1989; Whitaker and
Bartholomew, 1999; Sans et al., 2003; Koyi, 2004; Weil and Yonkee, 2009). This study
differs from previous research in two key ways. Previous studies have mostly
incorporated only one method for measuring penetrative strain, while this study has
assimilated three different mechanisms. Second, previous work has focused on areas of
substantial shortening of brittle upper crustal rocks. This research focuses on an area
Figure 7. Penetrative strain estimates from previous studies which analyzed a variety of microstructural and outcrop-scale deformation mechanisms.

16
where the regional deformation pattern is predicated on how lower crustal basement
rocks deform and transfer strain into the cover.
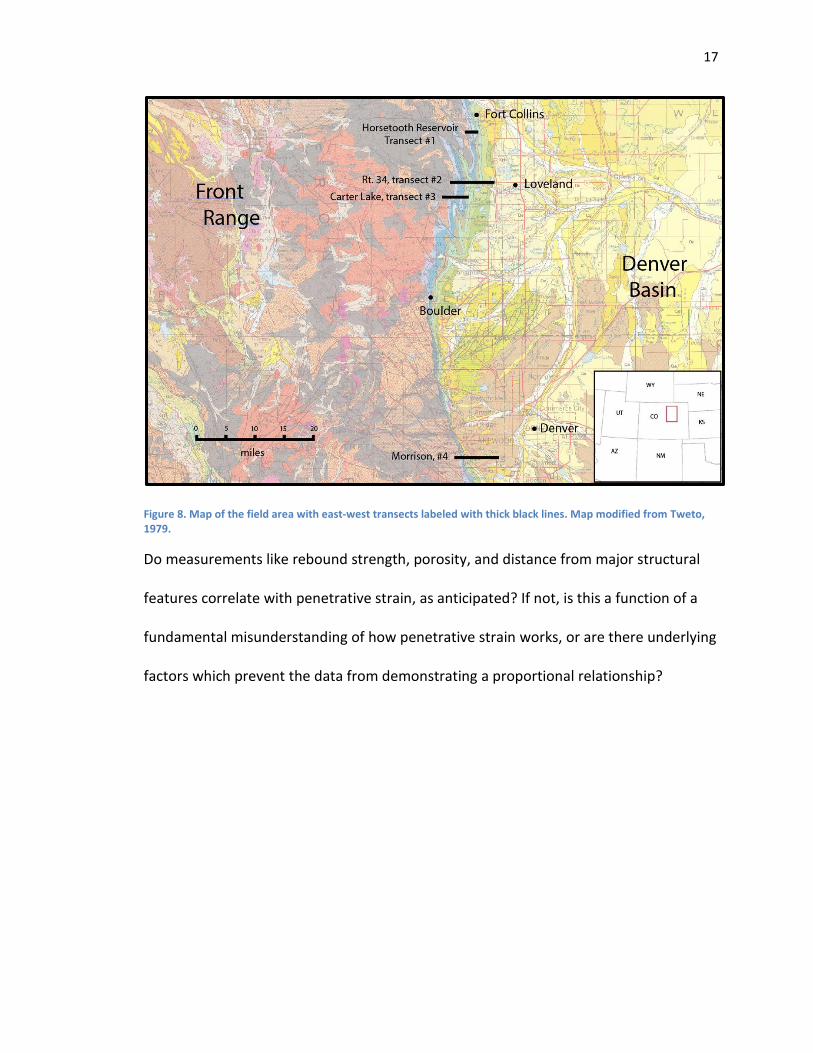
1.4 Study location and motivation
Data for this study were collected across four east-west transects along the I-25
corridor between Denver and Fort Collins, Colorado (Figure 8). Samples were taken from
the Pennsylvanian-Cretaceous sedimentary section, exposed near the foothills of the
Colorado Front Range, on the western margin of the Denver-Julesburg Basin. This area
contains primarily weakly deformed sandstones deposited during erosion of the
Ancestral Rocky Mountains and later encroachment of the Cretaceous Western Interior
Seaway (Barkmann et al., 2015).
The main purpose of this study is to quantify the amount of deformation due to
penetrative strain occurring during the Laramide Orogeny using petrographic analysis,
analog modeling, and regional cross-section restorations. In particular, this study aims
to interpret how penetrative strain is distributed differently in thick-skinned orogenic
events, as seen in Laramide foreland basins, versus deformation in a thin-skinned upper
crustal sedimentary cover sequence, as seen in previous studies of Sevier-age fold and
thrust belts to the west. How does penetrative strain manifest itself both on the
outcrop-scale and on the grain-scale in brittle versus ductile detachments, and what can
that tell us about Laramide tectonics? A secondary goal of this study attempts to
correlate the amount of penetrative strain found in Laramide-age deformation with
certain physical parameters of reservoir units within the Denver-Julesburg Basin.
17
Figure 8. Map of the field area with east-west transects labeled with thick black lines. Map modified from Tweto, 1979.
Do measurements like rebound strength, porosity, and distance from major structural
features correlate with penetrative strain, as anticipated? If not, is this a function of a
fundamental misunderstanding of how penetrative strain works, or are there underlying
factors which prevent the data from demonstrating a proportional relationship?

18
2. Lithologic and structural relationships
The Denver-Julesburg Basin is an asymmetrical foreland-style basin with a fill up
to 4,000 m (Higley and Cox, 2007). Formation of the basin began from shedding of
sediment from the nascent Rocky Mountains during the ARM uplift approximately 300
Mya and deepened extensively with uplift of the modern Rockies during the Laramide
Orogeny (Nesse, 2006). As tectonic processes evolved, depositional patterns changed
from proximal coarse-grained alluvial fan deposition, to sediment dispersal by rivers,
and eventually to distal mature sediments of barrier islands, beaches, and shallow
marine coastal deposition along the Western Interior Seaway (DeCelles and Giles, 1996;
DeCelles, 2004; Rulemann, 2011).
The field area for this project is spread across 80 miles from Denver to Fort
Collins (Figure 8). As a result, there is significant variation in formation thickness across
the region. The Lyons Formation is approximately 150’ thick near Morrison and lies
directly above the basal Fountain Formation. The Lyons thins northward and interfingers
with the Satanka Formation (also known as the Owl Canyon) along Carter Lake (transect
2) in Loveland, and then eventually pinches out near the Colorado/Wyoming border
(Hoyt, 1962; Hoyt, 1963). The Sundance and Jelm formations are exposed in the
northern half of the field area, but thin and eventually pinch out near Boulder. The Fox
Hills and Laramie formations are only exposed along transect 4 and do not appear in
cross-sections of the northern half of the field area. Due to this variation, the sampling
strategy across the field area was not to take samples of the same formation for every
19
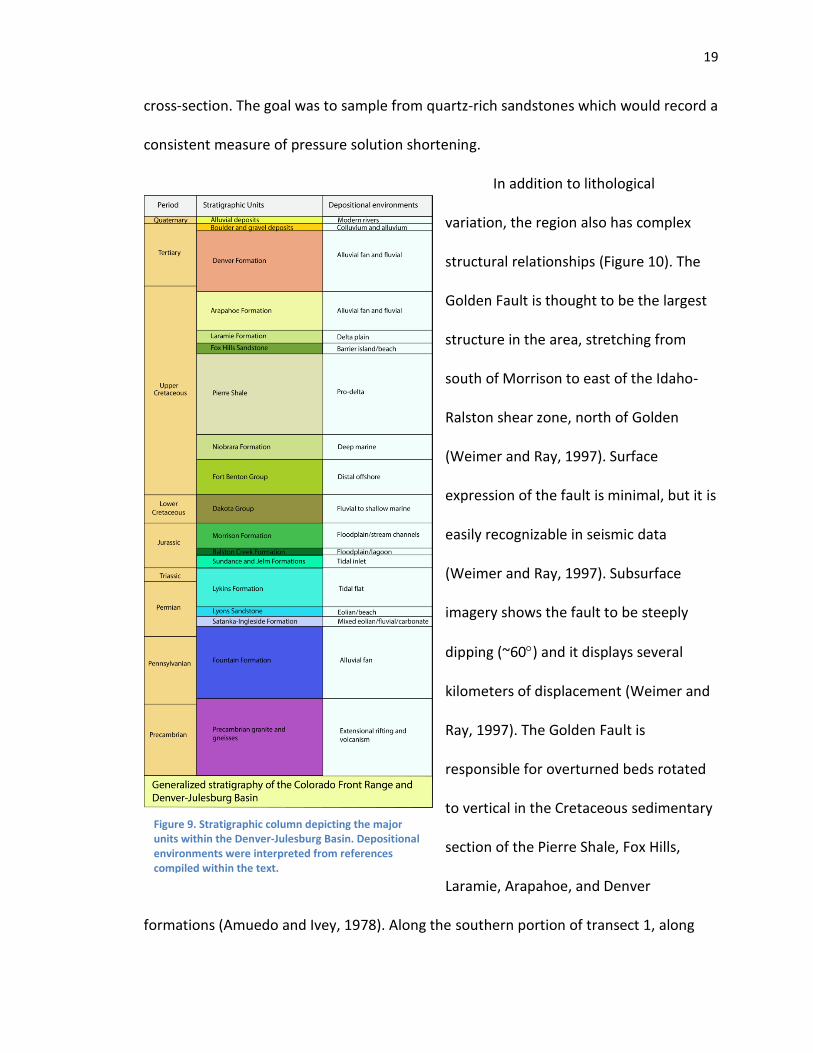
cross-section. The goal was to sample from quartz-rich sandstones which would record a
consistent measure of pressure solution shortening.
In addition to lithological
variation, the region also has complex
structural relationships (Figure 10). The
Golden Fault is thought to be the largest
structure in the area, stretching from
south of Morrison to east of the Idaho-
Ralston shear zone, north of Golden
(Weimer and Ray, 1997). Surface
expression of the fault is minimal, but it is
easily recognizable in seismic data
(Weimer and Ray, 1997). Subsurface
imagery shows the fault to be steeply
dipping (~60) and it displays several
kilometers of displacement (Weimer and
Ray, 1997). The Golden Fault is
responsible for overturned beds rotated
to vertical in the Cretaceous sedimentary
section of the Pierre Shale, Fox Hills,
Laramie, Arapahoe, and Denver
formations (Amuedo and Ivey, 1978). Along the southern portion of transect 1, along
Figure 9. Stratigraphic column depicting the major units within the Denver-Julesburg Basin. Depositional environments were interpreted from references compiled within the text.
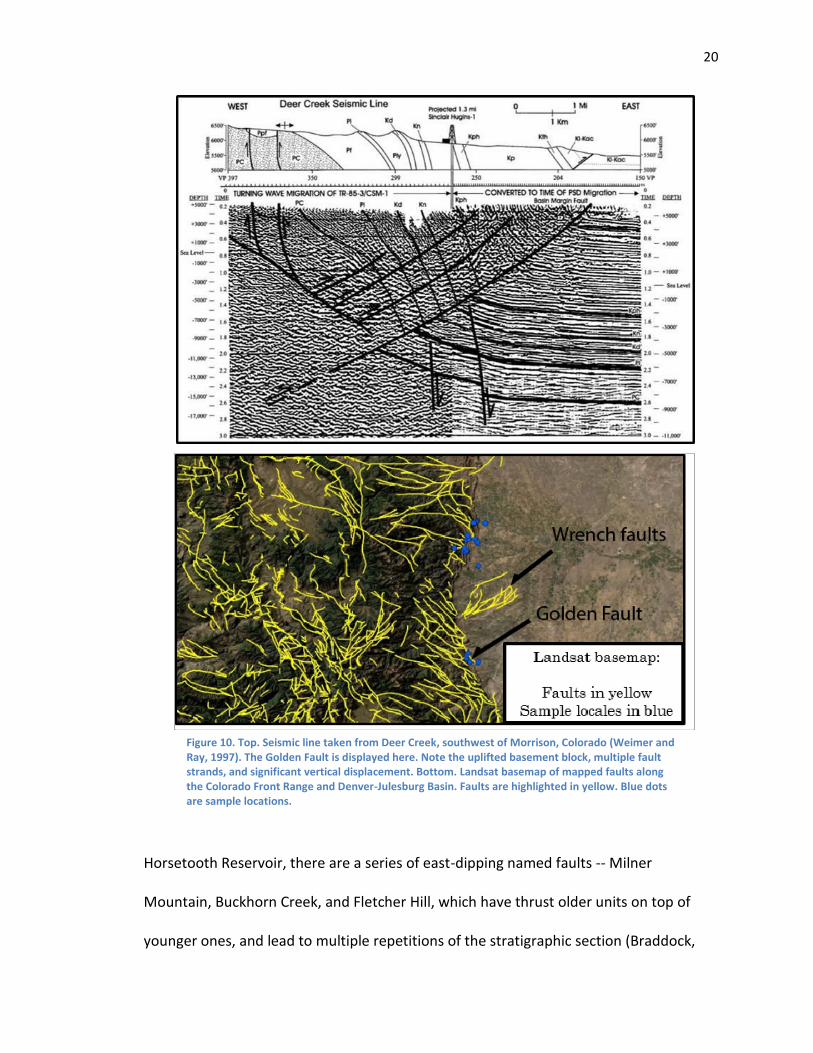
20
Horsetooth Reservoir, there are a series of east-dipping named faults -- Milner
Mountain, Buckhorn Creek, and Fletcher Hill, which have thrust older units on top of
younger ones, and lead to multiple repetitions of the stratigraphic section (Braddock,
Figure 10. Top. Seismic line taken from Deer Creek, southwest of Morrison, Colorado (Weimer and Ray, 1997). The Golden Fault is displayed here. Note the uplifted basement block, multiple fault strands, and significant vertical displacement. Bottom. Landsat basemap of mapped faults along the Colorado Front Range and Denver-Julesburg Basin. Faults are highlighted in yellow. Blue dots are sample locations.

21
1989). Across transect 2, there is also a repeating stratigraphic sequence as the result of
thrust faulting along the Big Thompson and Green Ridge faults and then a second
repetition from folding of the Big Thompson anticline near Devil’s Backbone (Braddock
et al., 1970). The Carter Lake anticline is another example of a large-scale geologic
Figure 11. Tectonostratigraphic column of the sedimentary units exposed in the Horsetooth Reservoir quadrangle.

22
structure which is accommodating regional strain. This is exposed near Carter Lake and
is a southward dipping, plunging anticline that is asymmetric and has a thicker east limb
than west limb (Braddock, 1988). Each of these structures is significant because they
accommodate strain on the macroscale.

23
3. Methods
3.1 Pressure solution shortening
Forty-three samples were collected from the western margin of the Denver-
Julesburg Basin. Thirty-eight samples were measured for pressure solution shortening,
while the remaining samples were taken for future analysis. Seven samples were taken
from the Fountain Formation, eleven from the Satanka Formation, seven from the Lyons
Sandstone, three from sandstone interbeds of the Morrison formation, six from the
Dakota Group sandstones, two from the Fox Hills Sandstone, and two from the Laramie
Formation.
Samples were taken from sandstone units and interbeds within the stratigraphic
section (Figure 9), from the basal Fountain Formation to the Upper Cretaceous Laramie
Formation, depending on property access. Strike and dip measurements were recorded
at each location. Each hand sample was cut parallel to dip direction during billet
preparation. Thin sections were cut specifically for sandstone samples, although
limestone samples were collected for future analysis, where the calcite strain gauge
technique will be employed for penetrative strain measurements (Groshong, 1972).
Intergranular deformation patterns were analyzed for each thin section collected within
the basin. Representative photomicrographs were taken in plane- and cross-polarized
light, as well as with the gypsum plate, at scales from 4x to 10x magnification. Best fit
ellipses were applied to compressed, rotated sand grains altered by low-temperature
deformation using the strain analysis software EllipseFit (Figure 12; Vollmer, 2010).

24
Sutured grain
boundaries were
determined by examining
the sharpness of grain
contacts. The overlap
distance between two
deformed grains was
measured along a line
orthogonal to the grain
boundary (Onasch, 1993).
The total distance of the
two deformed grains
perpendicular to the
compromised grain
boundary was measured
and used to determine
pressure solution shortening by entering the values for overlap distance and total grain
distance into equation 1 (Onasch, 1993). In order to expedite this process, a script was
written using an ImageJ macro to automatically calculate ellipse intersections and the
total overlap distance between grain contacts (Figure 13; Murphy, 2018). Grain
orientations were automatically given from digitization within the EllipseFit software
(Vollmer, 2010). A minimum of 75 grains were digitized per thin section. The grains in
Figure 12. Photomicrographs of a quartz-rich Dakota Group sandstone with best ellipses applied to grain boundaries.
25
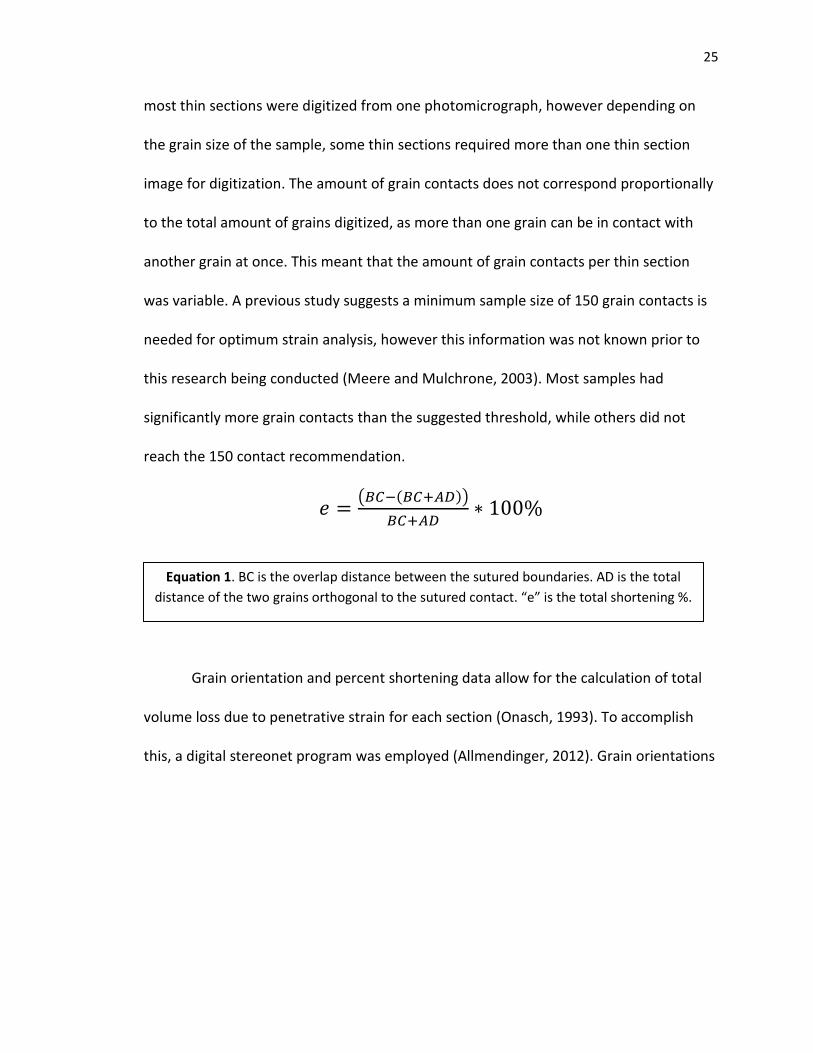
most thin sections were digitized from one photomicrograph, however depending on
the grain size of the sample, some thin sections required more than one thin section
image for digitization. The amount of grain contacts does not correspond proportionally
to the total amount of grains digitized, as more than one grain can be in contact with
another grain at once. This meant that the amount of grain contacts per thin section
was variable. A previous study suggests a minimum sample size of 150 grain contacts is
needed for optimum strain analysis, however this information was not known prior to
this research being conducted (Meere and Mulchrone, 2003). Most samples had
significantly more grain contacts than the suggested threshold, while others did not
reach the 150 contact recommendation.
𝑒 =(𝐵𝐶−(𝐵𝐶+𝐴𝐷))
𝐵𝐶+𝐴𝐷∗ 100%
Grain orientation and percent shortening data allow for the calculation of total
volume loss due to penetrative strain for each section (Onasch, 1993). To accomplish
this, a digital stereonet program was employed (Allmendinger, 2012). Grain orientations
Equation 1. BC is the overlap distance between the sutured boundaries. AD is the total
distance of the two grains orthogonal to the sutured contact. “e” is the total shortening %.

26
Figure 13. Algorithm for an ImageJ macro that recognizes ellipse intersections and digitally calculates the pressure solution shortening percentage (Murphy, 2018).
were plotted as a trend line on the stereonet orthogonal to the percent shortening
value (e). A best fit circle was applied to the data to determine the amount of
shortening due to burial and compaction related diagenesis versus the amount due to
layer parallel shortening in each thin section (Onasch, 1993).
3.2 Porosity measurements
Full thin section scans were made for each sample at 4x magnification in the
Sedimentary Petrography Laboratory at UNL. During preparation, all thin sections were

27
Figure 14. Top. Full thin section scan in plane-polarized light illustrating the cross-laminated Satanka Formation (sample 022). Bottom. A magnified image of the thin section with porosity captured. The only porosity comes from a through-going fracture.
impregnated with a blue dye allowing for easy visual identification of pore space.
Images were imported into JMicrovision software to estimate porosity (Figure 14 and
15). The color threshold tool was utilized to capture pore space in the thin sections.
Background extraction of the void space was accomplished by adjusting the IHS
(intensity, hue, saturation) channel setting. The hue value was set to a maximum of 165
to capture a majority of the light blue background color. The intensity value was
changed to fit the peak of the color histogram, and the saturation slider was adjusted

28
until the maximum amount of pore space was captured without unintentionally
grabbing additional colors. These measurements are not exact, but they do provide
reliable initial estimates on potential reservoir quality.
3.3 Analog modeling
Experimental modeling
has been used for more than a
century to gain insights into the
evolution of compressive
orogenic systems (Schreurs et
al., 2006). Models are variable,
and the development of fold-
thrust belts in sandbox models
can change significantly
depending on the parameters
the modeler utilizes for their
experiment (Schreurs et al.,
2006). These parameters include model set-up, model dimensions, frame of reference
of observation, material properties, and human influence or error (Schreurs et al.,
2006).
Analog models display limitations when they attempt to simulate complex
geologic processes (Koyi, 1997). For example, grain compaction is the only microscale
Figure 15. Top. Full thin section scan of a Dakota Group sandstone (sample 008). Bottom. A magnified image of the thin section with pore space shown in red. Porosity has been captured by the color threshold tool in JMicrovision.

29
deformation process which can be captured by the model used in this study.
Additionally, chemical changes undergone by sediments after initial deposition cannot
be recorded by the analog (Koyi, 1997). Finally, all models are only as precise as the
input data. The behavior of rocks in nature is complex, even more when those rocks are
subjected to heat and pressure during deformation. In order to input parameters into
the model, these rocks need to be simplified to their basic mechanical properties, such
as brittle, plastic, ductile, and competent (Koyi, 1997). The need to categorize these
rocks broadly for the model creates error which cannot be dismissed by the modeler
(Koyi, 1997). These restrictions hinder the accuracy produced in the line length
calculations, although there is still much information that can be gleaned from these
simulations.
The sedimentary succession in the Denver-Julesburg basin is best simplified as a
series of sand layers, which have been shown to mimic the behavior of upper crustal
rocks (Graveleau et al., 2012). Rounded sand grains are preferred in analog studies
because they scale most closely to the cohesion and angle of internal friction of brittle
rocks in nature (Burberry, 2015). Studies show the coefficient of internal friction for
brittle rocks under normal stress is 0.85 (Byerlee, 1978). The frictional coefficient of the
fine sand used in the model was measured at 0.59 in a previous study (Lathrop and
Burberry, 2016). This equates to a scaling ratio of 0.69 for the model, which is within the
acceptable range. The angle of internal friction was measured at 30.5 (Lathrop and
Burberry, 2016). These values are similar to those incorporated in previous studies,
which illustrate that the behavior of sand imitates brittle rocks at normal stresses and

30
strains, and that the
sand pack is an
acceptable analog for
the sedimentary rocks
of this basin (Schellart,
2000).
Figure 16. Schematic diagram of the sandbox and related equipment at the UNL Deformation Laboratory.
3.3.2 Model setup
A series of models was constructed within a sandbox analog to simulate
Laramide deformation. The sandbox moves via a stepped motorized wall that shortens
incrementally from the back at a rate of 8 mm/hour (Figure 16; Burberry, 2015). Dry,
well-sorted, and fine-grained sand fractions were sieved in the UNL Deformation
Laboratory to ensure heterogeneity across the model layers. Individual layers were
scaled at 5 mm and then topped with a thin red marker bed to allow for visual
identification on the amount of deformation (Figure 17). Top view and cross-section
photographs were taken at regular intervals of 1% bulk shortening. A grid was imprinted
on the top of the surface marker bed to track strain through the foreland. The
dimensions of the sandbox are 480 mm (width) x 640 mm (length).

31
The model series was run with a styrofoam backstop to function as rigid block
support. Modeling clay was used to replicate the rigid crystalline basement which
underlies the Colorado Front Range (Figure 18). The fault surface was cut at 60
approximately 10 cm from the motorized wall for each model run. The surface was
lubricated with bicycle oil for the initial model suite. The 6% shortening model was later
re-run with WD-40 used as lubricant to promote slip on the fault. After completion, the
model was wet with water and dish soap, and slabbed with a knife. At intervals of 2-6
cm, photographs were taken of the cross-section. Initial cuts were made more than 10
cm from the glassed wall to avoid frictional edge effects
(Burberry, 2015).
3.3.3 Line length analysis for analog models
Photographs of the cross-section were imported into
Midland Valley’s 2014 MOVE software for line length analysis
and area balancing. Four individual marker beds were digitized
to quantify the amount of shortening which occurred during
deformation.
Each layer was then restored to horizontal using MOVE’s line
length unfolding feature. The difference between the original
line length and the restored length is characterized as the
amount of volume loss, or penetrative strain, in the system,
while the difference between the deformed length and the
Figure 17. Diagram of the setup of analog model layers. Marker beds are designated with either pink or black sand.

32
original length is the amount of tectonic shortening undergone during compression.
3.4 Cross-section restoration
Cross-sections of transects 1 and 2 were digitized and restored in MOVE. These
cross-sections were chosen for restoration because they had a complete structural data
set associated with them. The cross-sections were modified from published geologic
mapping of the Masonville and Horsetooth Reservoir quadrangles (Braddock, 1989;
Braddock, 1970). Surficial units and individual Precambrian basement units were not
separated and digitized on the cross-section.
The purpose of constructing the cross-section was three fold -- first, to
determine the total amount of tectonic shortening across two transects, and to
compare values with known estimates of shortening within Laramide basins. Next, the
goal was to confirm that the 60 fault angle used for the major thrust in the analog
model suite matched closely previous interpretations of Laramide structures and
provided reasonable shortening estimates in the field area. The final objective was to
estimate penetrative strain across these sections by integrating both the tectonic
shortening calculations and penetrative strain values derived from the analog models.
Several assumptions were made in order to adequately restore the cross-
sections. First, area conservation was assumed, i.e. the cross-sectional area of the bed
was the same in both the deformed and restored sections (Judge and Allmendinger,
2011). Next, there was an assumption that the length of the contact did not change
from balanced to restored sections (Judge and Allmendinger, 2011). Bed thicknesses

33
Figure 18. Top. Diagram of the model setup specific to simulation of Laramide deformation. Bottom. Top view photograph of the model setup. Potter's clay simulates rigid basement rock of the Colorado Front Range. Fault
surface was cut 60 to the vertical.
were consistent, and there was no thickening or thinning in fold hinges (Judge and
Allmendinger, 2011). Plane strain was assumed, implying that no material had moved in
or out of the plane of the cross section (Judge and Allmendinger, 2011). It was assumed
that the initial interpretations of the cross-sections were correct. Finally, kink-style

34
folding was not used in the cross-section digitization, therefore constantly changing dip
values are a potential concern (Judge and Allmendinger, 2011).
3.5 Mechanical stratigraphy
A Schmidt hammer was used in the field to measure the rebound strength of the
rock surface at each sample location. Rebound values are dependent on the hardness of
the material, smoothness of the surface, and the water saturation of the sample
(Haramy and DeMarco, 1985). Schmidt hammers must be held at right angles to the
surface during use. Readings may vary depending on the exact location of
measurements. Ten measurements were taken at each outcrop and averaged to
minimize error and better constrain the compressive strength of the material. Units are
reported in megapascals (MPa).

35
4. Results: Unit Descriptions
This section focuses on detailed descriptions of the physical properties at
outcrop scale and microscale of the formations sampled in this study. These descriptions
come specifically from observations made in the field and under a petrographic
microscrope in the laboratory. The scope of this project was directed specifically at
sandstone units, therefore descriptions for every formation in the field area are not
provided. Sandstones provide the most accurate methods for measuring penetrative
strain. Future work may focus on measuring penetrative strain in calcareous units using
the calcite strain gauge technique. Macroscale descriptions of regionally significant units
are given for stratigraphic context.
4.1 Fountain Formation
Macroscopic description
The Fountain Formation is a coarse-grained, locally conglomeratic, arkosic
sandstone (Figure 19A). Deposition of the Fountain Formation began during the
Pennsylvanian and continued into the Lower Permian (Barkmann, 2015). In the field
area, the formation is exposed at Red Rocks Park in Morrison (transect 4) Carter Lake
campground in Loveland (transect 3), along Rt. 34 adjacent to Sylvan Dale Ranch
(transect 2), and at Horsetooth Reservoir (transect 1) in Fort Collins. The contact
between the Fountain Formation and the underlying granite is non-conformable and
marks a gap in geologic time between the Proterozoic and Paleozoic. This transition
represents a period of non-deposition or erosion that is traceable throughout western

36
North America. At outcrop-scale, the unit is poorly-sorted, with grain sizes ranging from
fine-grained sands to much coarser pebbles and cobbles. The unit displays meter-scale
cross-bed sets, as well as small lenses of green shale which indicate periods of
reduction. The Fountain is not well-indurated, as is shown by its crumbly nature in hand
sample. The unit is rich in both quartz and plagioclase feldspar. The abundance of
feldspar, along with the unit’s poor sorting, show that the rock is both texturally and
mineralogically immature. The depositional environment’s close proximity to source is
illustrated by the lack of clays, as feldspars have not had enough time and exposure to
be broken down into finer components. This suggests alluvial fan deposition off the
growing Ancestral Rocky Mountains (Napp and Ethridge, 1985; Sweet and Soreghan,
2010). The unit also shows signs of weathering from running water as potholes are often
seen on the surface.
Microscopic description
The Fountain Formation is a poorly-sorted, locally conglomeratic, feldspathic
arenite characteristic of deposits with poor textural maturity. Dominant mono- and
sporadic polycrystalline quartz grains are sub-rounded to sub-angular and commonly
form about 65% of the total sand, 15% are feldspars, calcite grains and cement
constitute 10%, with the remaining 10% composed of muscovite, lithic fragments, chert
(Figure 20F), and a clay matrix. Samples contain a mixture of both equant and elongate
grain shapes, and a preferred shape orientation is not obvious. Grain size distribution
ranges from fine-to medium-grained sand to coarse-very coarse pebbles. The Fountain
Formation is a grain-supported sandstone cemented by calcite and hematite. Quartz

37
Figure 19. Outcrop photos in the field area of the A. Fountain, B. Satanka, C. Lyons, D. Morrison, E. Dakota Group, and F. Fox Hills formations. Note the clay rich intervals in the Satanka and the systematic fracturing of the Lyons.
grains are locally fractured, with some samples showing more defined fractured
patterns. The presence of undulatory extinction indicates that the grains have
undergone strain. Quartz overgrowths are present in small quantities, but do not
significantly alter grain boundaries. Isolated quartz grains with embayed rims (Figure

38
20B) indicate the presence of a detrital volcaniclastic source. Cementing minerals, such
as calcite and quartz, are also present in fluid inclusions within the quartz grains.
Feldspar varieties present are microcline and plagioclase, which are identified from the
presence of tartan and albite twinning. Sanidine and anorthoclase appear to be largely
absent. Feldspar grains exhibit sub-angular to angular grain shapes.
4.2 Satanka (Owl Canyon) Formation
Macroscale description
The Satanka Formation is a fine-grained, cross-bedded sandstone interbedded
with shale (Figure 19B). It was deposited during the Permian. North of the Carter Lake
area, this unit is known as the Owl Canyon Formation. These two names appear to be
interchangeable in the literature. This formation is often mapped in conjunction with
the Ingleside Formation. The Ingleside is separated into two end members -- one
containing a well-sorted, cross-bedded eolian sandstone, and a second carbonate-rich
limestone member. In the northern half of the field area, it overlies the Fountain
Formation and underlies the Lyons Formation, in each case with a conformable and
gradational contact. South of Boulder, the formation pinches out entirely. The Satanka
unit is soft, crumbly, poorly-indurated, and generally thinly-bedded. The unit is
characterized by abundant clay material. Weathered and fresh surfaces are deep red in
color. The Ingleside member is an orange to tan color on weathered surfaces, which is
more strongly indurated and displays thicker bedding. The depositional environment is a
mixed siliciclastic and carbonate system which transitioned from eolian deposition to
eventual fluvial and shallow marine deposits (Hoyt, 1962; Hoyt, 1963). Samples were

39
only taken from the Satanka Formation for this study.
Microscale description
The Satanka Formation is a poor to moderately-sorted, lithic arenite
characteristic of relatively immature deposits. Quartz grains are largely sub-rounded to
sub-angular and monocrystalline. Sand grain mineralogy consists of 75% quartz, 15%
chert, 5% calcite, and 5% muscovite. The unit consists of predominantly equant, but also
lesser oblate grain shapes, with no preferred shape orientation. Grain size distribution
varies widely from very-fine to medium-grained sands. The sandstones range from
weakly cemented, loosely packed grains, as in sample 025, to strongly cemented clays in
several additional samples. Quartz grains are not significantly fractured. Porosity is
occluded by pronounced detrital clay matrix. Grain contacts are sharp with clay cements
keeping the framework of the grains together. Grain boundary migration and pressure
solution contacts are less abundant. Quartz overgrowths are absent from the samples.
Fluid inclusions and embayments are sporadically present in the formation.
4.3 Lyons Formation
Macroscale description
The Lyons Sandstone is a fine-to-medium grained, quartz dominant sandstone
(Figure 19C). The Lyons was deposited during the Permian. In the field area, it overlies
and has a conformable, gradational contact with the Satanka Formation. The contact
with the overlying Lykins Formation is unconformable. The unit is well-indurated and
well-cemented by the presence of silica. It is one of the dominant ridge-forming units of
the Front Range region. It is white to tan to light orange on weathered surfaces. The

40
Figure 20. A. Calcite twinning within the Fountain Formation. B. A quartz embayment in the Fountain Formation; indicates a volcaniclastic detrital source. C and D. Muscovite and sanidine grains within the Laramie Formation. Note the Carlsbad twinning in the sanidine. E. Sutured grain boundaries in the Satanka Formation. F. Abundant chert in the Laramie Formation.
Lyons appears to be well-sorted in hand sample and has high textural maturity. The
presence of highly resistant quartz, and the absence of additional detrital grains,
indicates that the material travelled a significant distant from the source. The unit is

41
thickly-bedded, has meter scale cross-bedding and displays systematic, abundant
fracturing. Frosted quartz grains suggest an eolian origin for the formation (Morgan et
al, 2004; Barkmann, 2015). The outcrops examined in the field area did not appear to
have noticeable trace or body fossils. Deformation bands were present in the outcrop at
Matthew Winter Park near Morrison (Figure 21).
Microscale description
The Lyons Formation is a moderate- to well-sorted quartz arenite characteristic
of a deposit with intermediate to high textural maturity. Lyons samples are composed of
sub-rounded to rounded monocrystalline quartz grains. Quartz is overwhelmingly the
dominant mineralogy, constituting over 90% of the grains. Only limited additional
mineralogies are present, such as trace amounts of chert and feldspar. The sandstone is
well cemented with a strong framework of quartz grains. Clay matrix appears to be
largely absent, which indicates a direct correlation between the amount of pore space,
which is significant, and permeable fluid pathways. Grain size distribution is fine-to-
medium grained sands. The grains appear to display a preferred orientation. Originally
equant grains have been flattened slightly to create the appearance of a weakly
developed “foliation.” Grain fracturing is minimal and not well defined, while undulose
extinction shows that grains have undergone strain. Grain compaction is more
noticeable in these samples than in the Fountain Formation. This is manifested in the
increased presence of grain boundary migration and dissolution along sutured grains.
Quartz embayments and fluid inclusions are limited in the Lyons, which is consistent
with the increased textural maturity of the unit.

42
4.4 Lykins Formation
Macroscale description
The Lykins Formation is a fine-grained siltstone interbedded with sandstone and
limestone. The Lykins is Upper Permian to Triassic in age. It is red to brown in outcrop,
but it is not well exposed because of significant weathering. It tends to form valleys in
between the protruding hogbacks of the Dakota, Fountain, and Lyons Formations, which
makes sampling difficult. The limestone beds are characterized by wavy algal
laminations (Tieje, 1923). Fossils are otherwise largely absent, a possible result of the
Lykins marking the Permian-Triassic boundary, site of the largest extinction in geologic
history. Both the overlying and underlying contact with the Morrison and Lyons
formations are marked by a disconformity. The presence of algal mats and fine-grained
sediments suggest a depositional environment similar to a modern day tidal flat, where
both microbial and clastic sediments were bound and trapped by stromatolites
(Barkmann, 2015). This environment marks a change in sediment pattern from the
medium to coarse sands deposited during denudation of the Ancestral Rockies to a
shallow coastal marine environment (Tieje, 1923; Barkmann, 2015).
4.5 Sundance Formation
Macroscale description
The Sundance Formation is a lithologically diverse unit. The exposures seen in
the field area during this study are restricted to fine- to medium-grained muddy
sandstones. The age of the Sundance is Upper Jurassic. It has a disconformable contact
with both the underlying Lykins Formation and overlying Morrison Formation (Braddock,

43
1989). The disconformity between the Morrison and the Sundance is marked by basal
chert granules at Horsetooth Reservoir (Demko et al., 2004). It is relatively thick in the
north (~150 ‘-200’) near Horsetooth Reservoir (Braddock, 1989). The unit thickens
towards the Colorado/Wyoming border, but thins and pinches out south of Boulder. In
the field area, it is mapped together with the Jelm formation (Braddock, 1989). It is
locally cross-bedded with calcareous intervals. Weathered surfaces are light-grey to tan
within the Sundance, and reddish-orange to pink within the Jelm Formation. The
Sundance Formation was likely deposited in a shallow marine coastal environment.
Cross-bedded sands in the Jelm formation indicate a beach or eolian environment, while
previous work has suggested exposures in the Black Hills and northern Wyoming are
indicative of tidal inlet deposits (Uhlir et al., 1988).
4.6 Morrison Formation
Macroscale description
The Morrison Formation is a fine-grained interbedded sandstone, siltstone,
limestone and shale (Figure 19D). The Morrison was deposited during the Jurassic. The
unit is poor- to moderately-sorted. It is famously exposed on the Interstate 70 roadcut
near Morrison. The unit is thinly-bedded and it has a characteristic green, red, and
yellow color on weathered surfaces that make it easily recognizable in outcrop. This unit
is poorly indurated and is not a ridge-former. A diagnostic feature of this unit is its
typical shale and claystone interbeds which are valley-formers in the field area. In the
sandstone intervals, the unit displays cross-stratification. The unit is famous for its
dinosaur fossils, which have been excavated from many of the local outcrops.

44
Calcareous interbeds of limestone and shale are present in outcrop on the eastern side
of Carter Lake. The limestone section appears brown to gray in color, largely thin-
bedded, but with small intervals of thicker bedding, composed primarily of lime mud
with an absence of allochems. The limestone section would be classified as a micrite in
the Folk classification scheme. Brown, weathered paleosol intervals form the slopes
which enclose the limestone beds. The depositional environment for the Morrison
Formation is primarily a combination of rivers, alluvial plains, swamps, and lakes,
derived from western North American mountain sources, such as the Sierra Nevada,
with limited shallow marine deposition (Demko et al., 2004; Turner and Peterson, 2004).
Microscale description
Three samples were taken from the Morrison Formation for this study – 006,
021, and 036. These samples show a large variation in grain type, depending upon
where each sample was taken from. For example, 036 was taken from a sandstone
interval along transect 3. This sample is a moderately-sorted quartz arenite with fine- to
medium-grained sands. Mineralogical composition is approximately 85% quartz, 13%
chert, and less than 2% microcline, calcite and clay matrix. Typical grain contacts are
not well-defined due to grain dissolution. Grain fractures are abundant and can be
categorized in three distinct orientations. Samples 006, along transect 2, and 020, along
transect 1, are clay-rich, interbedded siltstones and sandstones. The quartz grains are
very fine- to fine-grained with shapes ranging from equant to platy. Mud rock laminae
limit porosity. The only porosity present is from large-scale fractures which cross-cut the

45
full thin section. Heavy minerals are also present in thin section but cannot be discerned
without a more powerful petrographic microscope or SEM analysis.
4.7 Dakota Group
Macroscopic description
The Dakota Group is a succession of fine- to coarse-grained, moderately
indurated sandstones that form a series of east-dipping ridges along the Colorado Front
Range, such as the Devils Backbone hogback exposed along transect 2 near Loveland
(Figure 19E). The Dakota Group was deposited during the Lower Cretaceous. Locally, the
Dakota Group is conglomeratic, such as in the Lytle Formation, which is interbedded
with sandstone on the west side of the hogback. This unit lies directly above the
Morrison Formation. This unit is a basal conglomerate with gravel clasts ranging from
granule to pebble sized (2–4 mm). The unit is moderately sorted in hand sample. At this
locale, the unit contains wood fragments and iron staining on weathered surfaces,
which are generally tan to brown in color. Fresh surfaces are light-grey to light-brown.
At Horsetooth Reservoir, along transect 1, the unit is faulted and has a large cataclastic
zone of fault gouge. The South Platte Formation is the other member of the Dakota
Group in the field area. This unit is fine- to medium-grained, and well-sorted in hand
sample. It lies below the Mowry Shale in the field area. The Dakota is exposed at
Dinosaur Ridge near Morrison, along transect 4, and ripple marks can be seen in
outcrop. Collectively, the Dakota Group sandstones represent a range of changing
depositional environments from fluvial to shoreline to floodplain settings, fluctuating
with changes in sea level (Ruleman, 2011; Barkmann, 2015). The basal pebble

46
conglomerate and presence of wood fragments in the Lytle Formation suggest a fluvial
environment (Haun, 1963). The South Platte Formation shows better sorting, ripple
marks, and finer-grained material suggesting a possible a shallow-marine beach
environment which developed as the seaway encroached further to the west (Haun,
1963).
Microscopic description
The Dakota Group sandstones are moderate to well-sorted quartz arenites of
intermediate textural maturity. The dominant grain types are silica-rich, with quartz and
chert making up greater than 90% of the total sand fraction. Accessory minerals such as
feldspar, calcite, and clays compose less than 5% of the total detrital fraction. Grain size
distribution is primarily medium- to coarse-grained sands, but samples are locally
conglomeratic in areas such as the Devil’s Backbone hogback near Loveland. In sample
008, taken from transect 1, quartz overgrowths are abundant, while they are also
present but less prevalent in the remaining samples. Quartz and calcite inclusions are
intermittent in the detrital grains, indicating the presence of hydrothermal fluids which
have cemented the sample. The grain framework appears to be well-cemented with
most grains in contact with one another. Many grain boundaries are not sharp as there
is pressure solution along the grain contacts. Grain fracturing is localized and scattered,
however the fractures appear to occur in two orientations. The samples are
characterized by intermediate pore space, but many fluid pathways are occluded by
grain boundary migration. Quartz embayments are again limited, as most grains fall
shape, preferred orientation, or developed fabric.
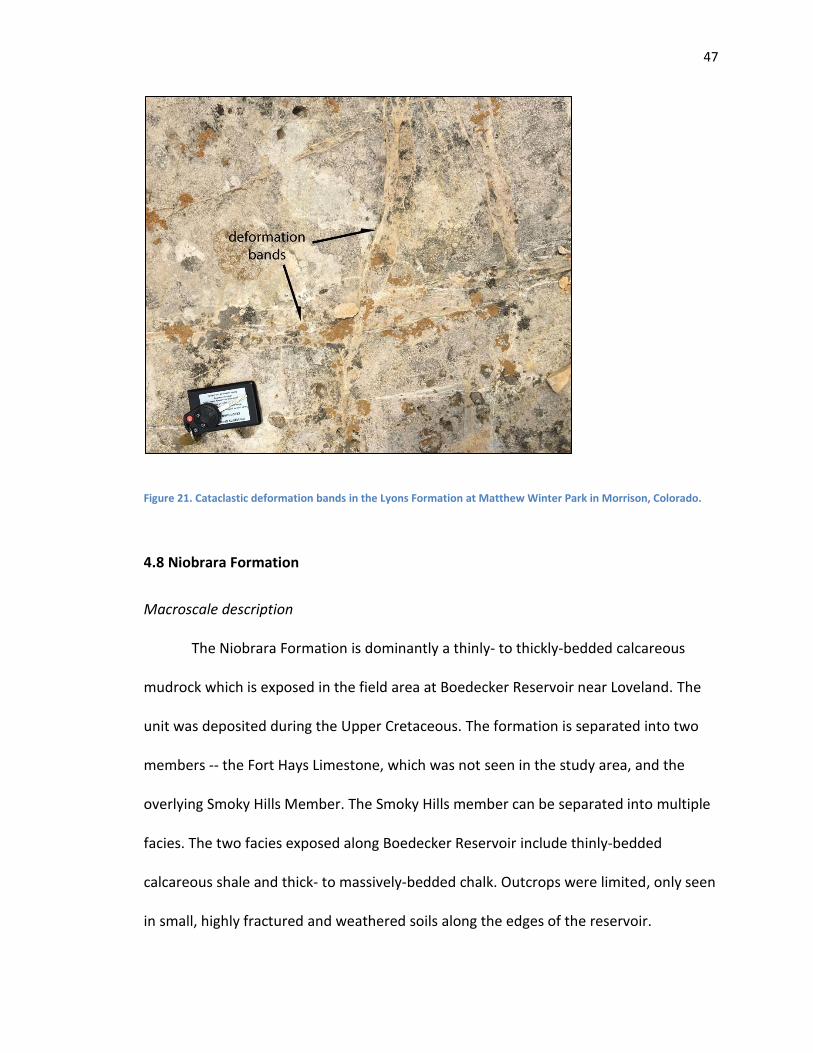
47
Figure 21. Cataclastic deformation bands in the Lyons Formation at Matthew Winter Park in Morrison, Colorado.
4.8 Niobrara Formation
Macroscale description
The Niobrara Formation is dominantly a thinly- to thickly-bedded calcareous
mudrock which is exposed in the field area at Boedecker Reservoir near Loveland. The
unit was deposited during the Upper Cretaceous. The formation is separated into two
members -- the Fort Hays Limestone, which was not seen in the study area, and the
overlying Smoky Hills Member. The Smoky Hills member can be separated into multiple
facies. The two facies exposed along Boedecker Reservoir include thinly-bedded
calcareous shale and thick- to massively-bedded chalk. Outcrops were limited, only seen
in small, highly fractured and weathered soils along the edges of the reservoir.

48
Weathered surfaces are yellowish-brown in color. Systematic fracturing was noted in
the unit. The Niobrara Formation has a conformable and sharp contact with the
overlying Pierre Shale and is disconformable with the underlying Dakota Group. The
Niobrara is primarily composed of fine-grained mudrock, but has undergone extensive
fracture stimulation and is one of the major oil and gas producing units in the basin
(Higley and Cox, 2007). Deposition for the Niobrara likely occurred in a poorly
oxygenated, deep marine environment (Barlow and Kauffman, 1985).
4.9 Pierre Shale
Macroscale description
The Pierre Shale is a very fine-grained, dark-brown to grey calcareous shale
interbedded locally with siltstone and sandstone intervals. The unit was deposited
during the Upper Cretaceous. This unit is approximately 600 meters thick in the
Horsetooth Reservoir quadrangle and is exposed further east into the basin than
sandstone units which primarily outcrop along hogbacks near the foothills of the Front
Range (Braddock, 1989). The Pierre Shale is organic-rich and one of the major source
rocks within the basin. The principal outcrop of the Pierre in the field area is along
Rooney Road near Morrison (transect 4). There, the unit displays overturned beds
rotated to near vertical during movement along the Golden Fault during the Laramide
Orogeny. This outcrop alternates between resistant layers of sandstone, with jagged
edges that jut out, and highly weathered shale layers where slopes have formed.
Ammonite fossils are present in outcrop, as well as calcareous concretions within the
sandstone beds. The depositional environment for the Pierre Shale is likely a pro-delta

49
where river velocity has slowed and finer sediments in suspension are dropping out
(Weimer, 1973; Nwangwu, 1977).
4.10 Fox Hills Sandstone
Macroscale description
The Fox Hills Sandstone is a fine- to medium-grained, poorly indurated
sandstone that is exposed in the field area at Rooney Road along transect 4 (Figure 19F).
It was deposited during the Upper Cretaceous. The unit lies conformably above the
Pierre Shale and below the Laramie Formation. The Fox Hills is primarily white to tan
colored on weathered surfaces, and its friable nature is diagnostic in outcrop. In
particular, the outcrop exposed at Rooney Road, sample 011, is crumbly in hand sample,
significantly weathered, and weakly cemented in the upper section of the unit. This unit
is quartz-rich, which contrasts with sample 012 taken in the lower section, which has
increasing clay content and stronger induration as it grades into the Pierre Shale.
Deformation bands are also present within the upper portion of the formation (Figure
19F). Sample 012 is also notable for the presence of overturned bedding, which is a
change from the gently eastward dipping beds found in sample 011 and many of the
formations of the sedimentary section. Finally, the unit appears to be well-sorted in
handle sample and is relatively mature. The depositional environment interpretation for
a quartz dominant, well-sorted sand in the late Cretaceous is likely a beach or barrier
island on the margins of the retreating Western Interior Seaway (Weimer and Tillman,
1980).

50
Microscale description
The two samples, 011 and 012 were taken from different intervals within the Fox
Hills Formation. Sample 011 was taken from the friable, porous sandstone interval,
while sample 012 was taken from one of the shale-rich interbeds. Generally, the Fox
Hills is a moderate- to well-sorted lithic arenite characteristic of deposits of
intermediate textural maturity. Quartz is the dominant mineralogy, although the sample
also contains abundant chert. In sample 011, quartz grains constitute 65% of the sand
grains, while chert makes up the remaining 35%. Additional grain types, such as
plagioclase feldspar, contribute less than 1% to the sample. In sample 012, the
mineralogy can be classified as 50% quartz, 30% chert and lithic fragments, 15% clay
minerals, and 5% or less calcite and micas. Quartz grains are sub-rounded to sub-
angular, while chert grains are sub-angular to angular. Neither set of grains display a
preferred orientation. In 011, the sandstone appears to be weakly cemented, as there is
not a strong framework of grains. This is manifested in the friable, crumbly nature of the
rock unit. The unit is porous with grain contacts isolated and not in direct contact with
other grains, as such pressure solution and grain boundary migration is limited. In 012,
the grains are strongly cemented and indurated from the presence of clay and calcite
cements. Sample 012 is significantly less porous than 011 due to the presence of these
cements and the framework of the mineralogy. Quartz grains are sporadically fractured
and do not display significant deformation from compressive stress. The formation lacks
obvious quartz overgrowth, which is consistent with the lack of compaction and burial
related stress seen in the grain contacts.

51
4.11 Laramie Formation
Macroscale description
The Laramie Formation is a poor- to moderately-sorted, fine-grained sandstone
interbedded with claystone, shale, and siltstone. It is exposed in the field area near
Mount Carbon in Bear Creek Lake Park. It is light-brown to grey in hand sample on its
heavily weathered surfaces. It is one of the more friable and poorly cemented units in
the field area. It is also the youngest unit, Upper Cretaceous in age, that was sampled
for this study. The Bear Creek Lake park area, where the unit is exposed, is notable for
its coal-bearing rocks, and this facies was once mined locally. The unit has a
conformable contact with the Fox Hills Formation below and the Arapahoe Formation
above. It interfingers with the Fox Hills Formation and crops out between Denver and
Golden, where it is also exposed. The unit has been uplifted by the Golden Fault during
early Laramide deformation. The depositional environment for the Laramie Formation is
likely a delta plain along the retreating Cretaceous Interior Seaway (Raynolds, 2002).
Peat accumulation in the back swamp areas lead to coal formation, while crevasses,
splays, and marshes accumulated the clays and sands needed for shale and sandstone
lithification (Raynolds, 2002).
Microscale description
The Laramie Formation is a poor to moderately-sorted lithic arenite with
significant amounts of chert. Grain size distribution is fine- to medium- grained sand.
Mineralogy distribution is approximately 70% quartz, 25% chert and silica cements, and
5% or less calcite, muscovite (Figure 20C), feldspar and some clays. Sanidine, which was

52
absent from earlier formations, is present in this sample (Figure 20D). Quartz grains are
dominantly monocrystalline with isolated polycrystalline grains. Grain shapes are
generally more platy than equant. Quartz grains are sub-angular to angular with jagged
edges. The samples are highly porous with a significant absence of grain-to-grain
contacts. Grain boundaries are sharp and well-defined owing to the absence of pressure
solution and grain boundary migration. Sample 015, taken from Bear Creek Lake Park
along transect 4 in Morrison, displays dark brown, opaque limonite or hematite
cemented rinds on the edges of quartz grains. These cements significantly occlude
permeability. Grain fracturing is frequent and most grains display as many as three
fracture orientations.

53
5. Results: Thin Section Analysis for Penetrative Strain
5.1 Pressure solution shortening
The Lyons Formation samples recorded an average pressure solution value of
10.6%, which was the maximum pressure solution shortening value from the formations
sampled. The Fox Hills Formation recorded the lowest value of any formation sampled
at 8.4%. The highest percentage of pressure solution shortening recorded for an
individual sample within the field area was 12.1%. It came from sample 038, taken from
the Lyons Formation along transect 3. The lowest shortening percentage recorded was
8.1%, taken from the Fox Hills Formation along transect 4. The standard deviation of
pressure solution shortening values for all samples was 0.8.
Average pressure solution shortening values were computed along each of the
four transects. The highest average shortening recorded was 10.4% along transect 3,
with 8 of the 11 samples having shortening percentages greater than 10%.The lowest
shortening percentage recorded was along transect 4 at 9.2%. Only one of the seven
samples recorded along this transect was greater than 10%. For complete pressure
solution values measured from all the formations sampled in this study, please see
Appendix A.
The graph in Figure 22 demonstrates the relationship between penetrative strain
and distance from the closest major thrust fault for all samples taken in this study. Fault
locations were taken from GIS data compiled by the Colorado Geological Survey, and
the distance between the sample and the fault was measured in ArcMap 10.5. Major

54
basin bounding faults, uplifting Archean-Proterozoic basement strata, were considered
as the structures with the closest proximity. Distance from cross-section scale folds was
not considered in this analysis. The samples did not record the relationship between
penetrative strain and fault distance which was anticipated. Correlations were also
attempted across individual transects and for specific formations, but no strong
relationship was noted. Interpretations are considered in the discussion section below.
Figure 22. Excel graph plotting penetrative strain and porosity vs. distance from major regional thrust faults for all samples taken in the basin. There is a weak correlation here. Sampling from cores in the central and eastern regions of the basin may yield a stronger spatial relationship.
5.2 Layer parallel shortening (LPS) vs. compaction
Layer parallel shortening can be separated from compaction and burial related
shortening by plotting grain orientations as a trend and pressure solution shortening
values as a plunge on a stereonet and drafting a best fit circle through the data (Figure

55
Figure 23. Stereonet plot for sample 015 (Laramie Formation) used to determine layer parallel shortening versus compaction related shortening. LPS value is recorded along the east-west axis, while the compaction value is displayed along the north-south axis. The black dots represent grain orientations plotted as a trend value, while pressure solution shortening values were plotted as a plunge. A best fit circle was then drafted to the data.
23). This was done for all samples measure via petrographic analysis. The Lyons
formation recorded an LPS of 12.9% and the highest average compaction percentage of
all the sandstones analyzed at 13.0%. The Fox Hills Sandstone recorded the largest
difference between LPS and compaction with an LPS of 13.3% and 7.6% compaction.
Finally, the Laramie Formation recorded the highest LPS at 14.5% with 11.9%
compaction. The highest LPS recorded from an individual sample came from 022, taken
from the Satanka formation, along transect 4. This sample recorded an LPS of 19.2%.

56
The lowest LPS % recorded in the sample suite came from sample 001C taken from the
Satanka formation along transect 3. This sample recorded an LPS of 9.5%. The highest
compaction % recorded came from the Lyons Formation along transect 3. This sample
recorded compaction at 15.9%. The lowest compaction % recorded came from sample
012 taken from the Fox Hills Sandstone along transect 4. This sample recorded
compaction at 6.3%. This sample also recorded the maximum difference between LPS
(15.3%) and compaction (6.3%) for an individual sample at 9.0%. The standard deviation
of LPS among all samples was 2.5, while for compaction it was 2.3.
LPS and compaction were also evaluated for each of the four transects. Eleven
samples taken along transect 1 recorded 13.7% LPS and 11.1% compaction. Nine
samples taken along transect 2 recorded 11.8% LPS and 11.4% compaction. Eleven
samples taken along transect 3 recorded 12.5% LPS and 11.6% compaction. Finally, eight
samples taken along transect 4 recorded 13.0 % LPS and 11.4% compaction. For
complete LPS and compaction results for all samples, see Appendix A.

57
6. Porosity measurements
Porosity values range from less than 1% in samples 004, 005a, 005b and 028 to
greater than 23% in sample 011. The mean porosity value recorded for samples of the
Fountain Formation was 3.4%. The mean porosity value recorded for samples within the
Satanka Formation was 2.4%. Three samples (004, 005A, 005B) taken from this
formation had average porosity values less than 1%. Samples 005A and 005B, collected
along Rt. 34 near Loveland, recorded the lowest porosity values of any samples
contained in this study. The Lyons Formation recorded mean porosity values of 6.3% for
all samples. Two Lyons samples taken from transect 1 recorded significantly higher
porosities, 15.1% and 11.7%, than those recorded along transects 2 and 3, perhaps as a
function of the gradational contact with the Satanka Formation at this sample locale.
Samples from the Morrison Formation recorded porosity values of 3.3%. Samples from
the Dakota Group sandstones recorded a mean porosity of 8.6%. Two samples were
taken of the Fox Hills Sandstone from different sections along a roadcut near Morrison,
Colorado. These samples produced a major discrepancy in porosity values. Sample 011
was taken from the upper section of the formation and recorded a porosity value of
23.3%, the maximum value of any sample. Sample 012 was taken from the lower section
of the formation and recorded a porosity value of 0.4%. The lower section of the Fox
Hills along the Rooney Road outcrop was gradational with the Pierre Shale. Two samples
were also collected from the Laramie Formation near Bear Creek Lake Park. These
samples recorded a mean porosity value of 19.9%, the highest of any formation. The
standard deviation for porosity in all samples was 6.1.

58
Porosity measurements were analyzed across each transect. The highest mean
porosity value was recorded from samples along transect 4 at 10.6%. The lowest mean
porosity value was recorded for samples along transect 3 at 3.3%. Samples along
transect 2 near Masonville recorded a mean porosity value of 3.8%. Finally, the mean
porosity value of samples taken along transect 1 was 6.3%.
Again, a strong correlation between penetrative strain and porosity values was
anticipated. The Excel graph in Figure 24 records an R2 value of approximately 0.13,
indicating a poor fit for a linear regression model. This suggests a weak relationship
between these physical parameters for the samples taken in this study. A second graph
was plotted which measured the average PS and porosity values across transects, and a
stronger correlation was noted (Figure 25). Due to the limited sample size of four
transects, the statistical significance of this correlation is debatable. Possible
explanations for the poor correlation among all samples is examined further in the
discussion section.
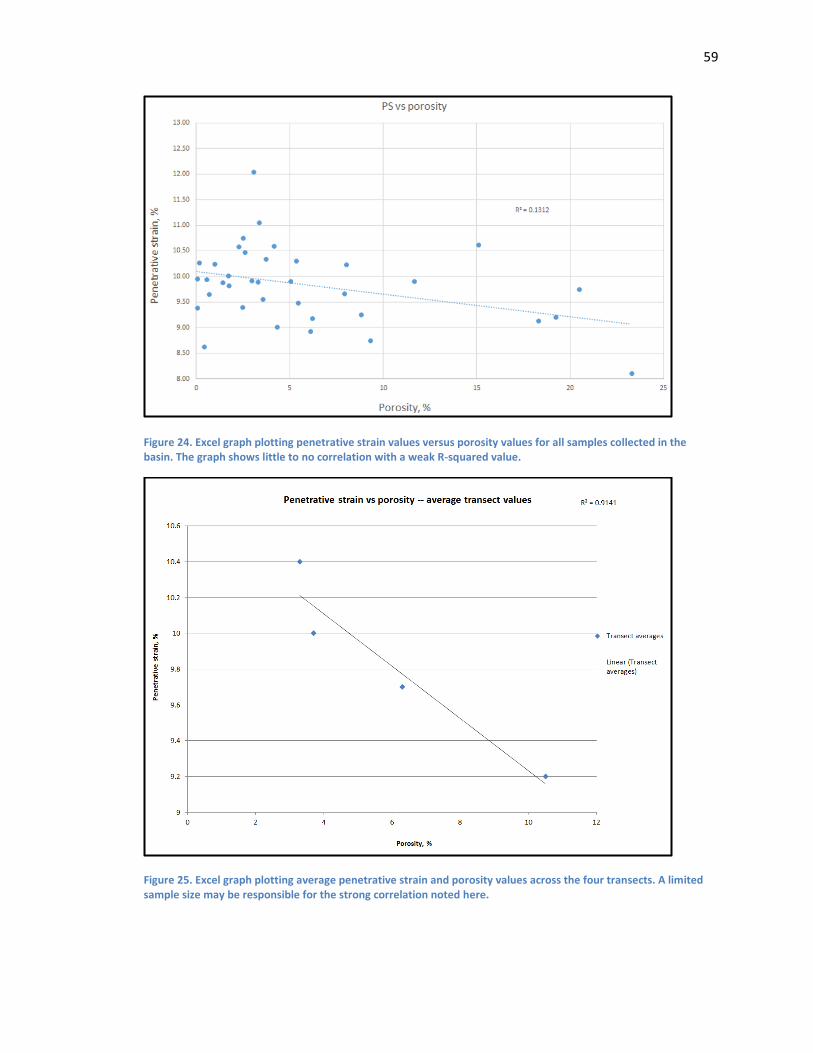
59
Figure 24. Excel graph plotting penetrative strain values versus porosity values for all samples collected in the basin. The graph shows little to no correlation with a weak R-squared value.
Figure 25. Excel graph plotting average penetrative strain and porosity values across the four transects. A limited sample size may be responsible for the strong correlation noted here.

60
7. Results: Rebound measurements
Rebound values were measured at most outcrops in the field area (Appendix A,
Table 2). Five sample locations were not measured due to equipment issues. Samples
from the Fox Hills Sandstone recorded the lowest rebound values at 24.0 MPa. Samples
from the Lyons Formation recorded the highest average compressive strength with a
rebound value of 54.0 MPa. . The maximum rebound value of 63.9 MPa was recorded in
sample 024, within the Lyons Formation outcrop along transect 1. The minimum
rebound value of 14.2 MPa was recorded in sample 022, within the Satanka Formation
along transect 1. The standard deviation for rebound strength in all samples was 15.6.
Figure 26. Excel graph showing recorded rebound strength values plotted again porosity and penetrative strain values. Again, there is not a strong correlation between these physical parameters for individual samples.
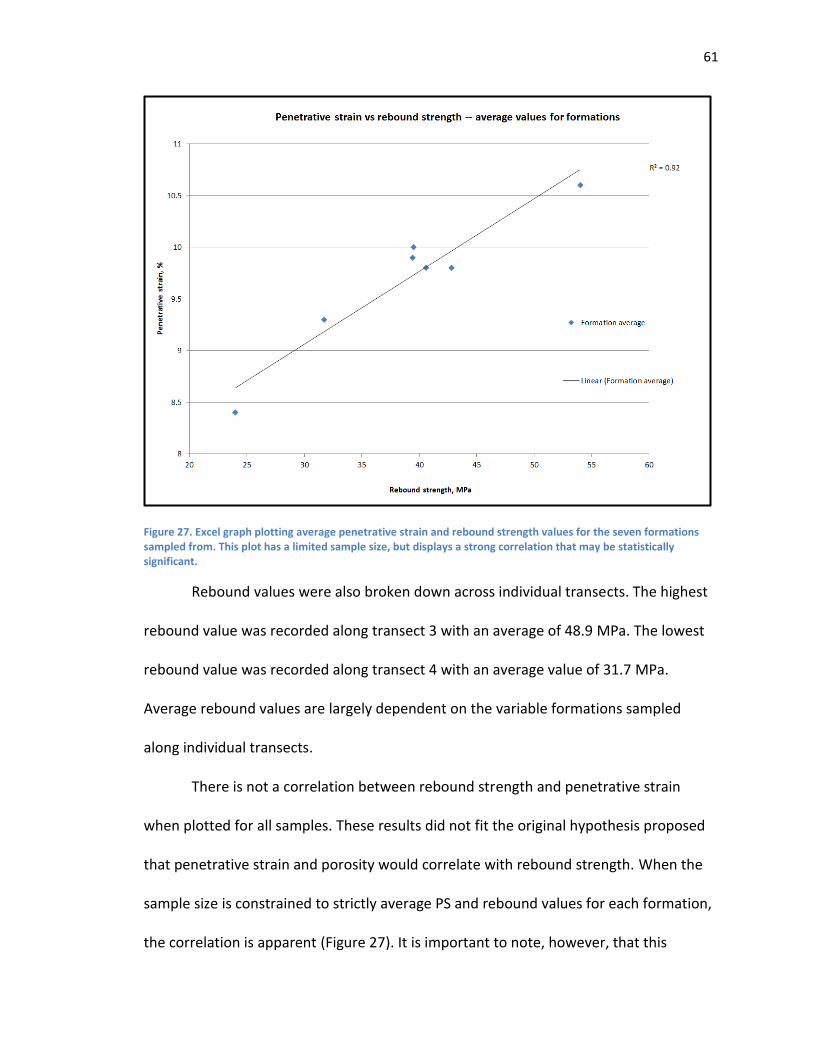
61
Figure 27. Excel graph plotting average penetrative strain and rebound strength values for the seven formations sampled from. This plot has a limited sample size, but displays a strong correlation that may be statistically significant.
Rebound values were also broken down across individual transects. The highest
rebound value was recorded along transect 3 with an average of 48.9 MPa. The lowest
rebound value was recorded along transect 4 with an average value of 31.7 MPa.
Average rebound values are largely dependent on the variable formations sampled
along individual transects.
There is not a correlation between rebound strength and penetrative strain
when plotted for all samples. These results did not fit the original hypothesis proposed
that penetrative strain and porosity would correlate with rebound strength. When the
sample size is constrained to strictly average PS and rebound values for each formation,
the correlation is apparent (Figure 27). It is important to note, however, that this

62
dataset includes a limited sample population of average values for seven formations.
For complete results, see Appendix A.

63
8. Results: Analog modeling results
Four sandbox models were constructed and shortened to 2%, 4%, 6% and 8%
bulk shortening. For the model recording 2% bulk shortening, a thrust fault develops
along the pre-existing surface of weakness, however the thrust does not break through
Figure 28. Sandbox model shortened to 2% total bulk shortening. Note that the rigid basement fault has already developed, but not broken through the sedimentary layers. Increasing PS in the upper layers of the model suggest an analog with Erslev’s trishear fault propagation model (1991). Table 1 below shows the total percentage of shortening which has been accommodated by penetrative strain.
Table 1. Sample calculation of shortening accommodated by PS in 2% model.
Line Original length,
mm x 10
Deformed length,
mm x 10
Restored length,
mm x 10
Difference, mm x 10
Total Shortening
%
Tectonic Shortening
% PS %
PS, as % of total shortening
1 2300 2250 2275.4 25.4 2 1.13 0.87 43.3
2 2300 2250 2279 29.0 2 1.29 0.71 28.7
3 2300 2250 2288.6 38.6 2 1.72 0.28 18.9
4 2300 2250 2289.3 39.3 2 1.75 0.25 11.1

64
and offset any of the layers in the model, only showing slippage along the basement
(Figure 28). The total tectonic shortening in horizon 1, the top layer, is 1.13% of the total
2% bulk shortening. This means penetrative strain is responsible for 0.87% of the 2%
bulk shortening, which equates to 43.3% of the total shortening percentage. Penetrative
strain values decrease linearly as we move towards the bottom layers of the model,
with values of 28.7% in horizon 2, 18.9% in horizon 3, and 11.1% in the bottom horizon
(Table 1).
The next model in the analog suite was shortened to 4% total bulk shortening
(Figure 29A). This model was ran twice due to material issues during the first run. In this
model, the thrust fault is clearly seen offsetting the basal horizon 4 in cross-section
view. The top three horizons in the model were not displaced by the fault. The
maximum penetrative strain value was measured in the upper layer of horizon 1 at
57.6% (Appendix B). Horizon 2 had a PS value of 25.7%. The PS value in horizon 3
dropped significantly to a minimum of 6.7%. Finally, the PS value of the basal horizon,
offset by the major thrust fault, was 27.2% of the total shortening percentage. Please
see Appendix B for full model calculations.
The third model in the series was ran to 6% total bulk shortening (Figure 29B).
This model was ran twice due to the integrity of the clay block disintegrating from
repeated use. For the second model run, a new clay block was purchased and WD-40
was applied, in place of bicycle oil, to promote slip on the fault. In this model, there was
extensive displacement along the thrust fault, which significantly offset all four horizons.
As a result, both the thrust fault and each horizon would need to be projected beyond

65
the model surface, to a point where they intersect, in order to estimate the total
amount of the restored length of each horizon. This projection was attempted in MOVE
and then a sample calculation was done, however the calculation resulted in a large
Figure 29. These models were shortened to 4%, 6%, and 8% total bulk shortening. Note that in the 4% and 8% models, only the bottom sedimentary marker bed is offset by the basement fault. The 6% model was ran twice and showed significantly more slip along the fault in the final run. This is likely a function of the 6% model being lubricated with WD-40. Previous models were lubricated with bicycle oil.

66
negative penetrative strain value. The model was unable to be re-ran due to time
constraints.
The final model in the series was deformed to 8% total bulk shortening (Figure
29C). In this model, despite having the most total shortening, only the basal horizon 4
displayed any fault displacement. Again, this model recorded a linear decrease in the
amount of penetrative strain across the model as you move from the top layers to the
bottom. Horizon 1 recorded a maximum PS value of 63.1% (Appendix B). Horizons 2 and
3 recorded PS values of 41.2% and 20.6%, respectively. The bottom horizon 4, which
displayed offset along the fault, recorded a PS value of 60.4%. More competent rocks
like the crystalline granites and gneisses of the Laramide deformation belt, do not allow
as much internal deformation at their basement-cover contacts. This is one
interpretation of why penetrative strain values are at a maximum in the lower layers of
brittle belts without the presence of a major detachment, and decrease with depth in
Laramide sedimentary sections with basement-cored arches. Another interpretation is
provided by the trishear model proposed by Erslev (1991). This model suggests that for
faulting in the basement displacement is decreased and accommodated by a diffuse,
triangular zone of shear radiating from the tip of the fault surface (Erslev, 1991). The
shear propagating outboard of the fault would explain why maximum PS values are
recorded in the top horizon of the models.

67
9. Results: Cross-section restoration
For this project, cross-sections were digitized across transects 1 and 2 (Figures 30
and 31). Transect 2 was more geologically complex than its counterpart, with both a
major regional anticline and a complex positive flower structure accommodating strain
(Braddock, 1970). Restoration of the cross-section consisted of a three-step process.
Figure 30. Digitized and restored cross-section of transect 2 in the Masonville quadrangle. Cross-section was modified from Braddock (1989). Equation 2 was used to calculate the total amount of tectonic shortening. Total shortening is estimated at 12.2%.
The first step was to reconnect stratigraphic layers displaced along multiple fault
strands in the flower structure. The next step was to project each individual layer of the
anticline above the eroded surface and connect the east and west limbs. The final step
was to unfold the attached lines and compare the original and deformed line lengths.
Minimum shortening values for transect 2 were calculated at 12.2% for the basal
Fountain Formation from equation 2. Layers closer to the surface were truncated by
topography and therefore an adequate line length could not be projected across the

68
section. Minimum shortening values for transect 1 were recorded at 10.0% in the
Fountain Formation (Figure 31). The basin bounding fault accommodated all of the
tectonic shortening in this area with no folding visible at this scale (Braddock, 1989).
The final goal of this research was to integrate penetrative strain estimates
derived from analog models with shortening values calculated from cross-section
restorations to estimate penetrative strain across an individual transect. The total
distance across transect 2 is ~7.5 km. As discussed above, the tectonic shortening across
transect 2 is 12.2%. This means that transect 2 records an estimated tectonic shortening
of 0.92 km.
Penetrative strain values were averaged for the 4 horizons across the model with
the highest shortening percentage (8%), in order to best simulate shortening across
transect 2. The average PS value for the model was 46.3%, which means the remaining
shortening was accommodated through 53.7% tectonic shortening. Using these values
and the estimated tectonic shortening amount listed above, a simple ratio was
implemented to estimate PS (equation 3). The total amount of penetrative strain related
volume loss across transect 2 is 0.79 km.
Equation 2. Percent shortening calculation for transects. e is the tectonic shortening,
l is the measured line length, lo is the original line length
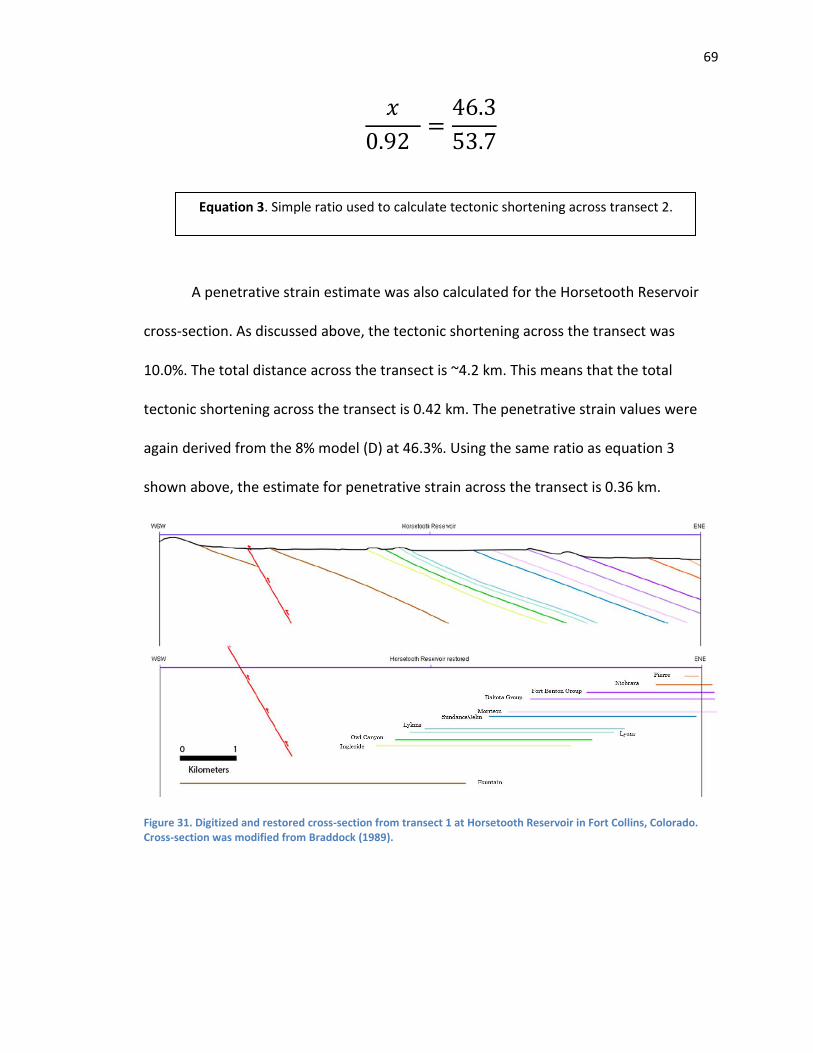
69
𝑥
0.92 =
46.3
53.7
A penetrative strain estimate was also calculated for the Horsetooth Reservoir
cross-section. As discussed above, the tectonic shortening across the transect was
10.0%. The total distance across the transect is ~4.2 km. This means that the total
tectonic shortening across the transect is 0.42 km. The penetrative strain values were
again derived from the 8% model (D) at 46.3%. Using the same ratio as equation 3
shown above, the estimate for penetrative strain across the transect is 0.36 km.
Figure 31. Digitized and restored cross-section from transect 1 at Horsetooth Reservoir in Fort Collins, Colorado. Cross-section was modified from Braddock (1989).
Equation 3. Simple ratio used to calculate tectonic shortening across transect 2.

70
10. Results Summary
Petrographic analysis of sandstones in the Pennsylvania-Cretaceous sedimentary
section of the Laramide foreland basin recorded a narrow range of penetrative strain
values between 8% and 12%, which does not correspond with physical properties such
as porosity and rebound strength when all samples are considered. There is a much
stronger correlation for formation and transect average values. There is only a weak
correlation present between fault proximity and pressure solution shortening. Porous
samples deeply buried during late Paleozoic sedimentation, such as the Fountain and
Lyons formations, record higher shortening rates related to burial and compaction than
samples deposited coeval with Laramide deformation, such as the Fox Hills Sandstone,
which exhibit greater amounts of layer parallel shortening. Additionally, the four analog
models presented in this study record maximum penetrative strain values in the upper
layers of the sand pack and see a proportional decrease with depth. When the lowest
part of the sand pack is faulted, PS values increase in the bottom layer. PS also records a
proportional increase with the amount of total shortening in a fold-thrust belt. Finally,
cross-section restorations transects 1 and 2 place tectonic shortening values at 10.0%
and 12.2%, amounts which are consistent with the limited surface expression of internal
deformation in the field area in comparison to studies of the intensely deformed Sevier
fold-thrust belt. PS estimates across transects 1 and 2 are 0.36 km and 0.92,
respectively.

71
11. Discussion
11.1 Physical and mechanical properties
Penetrative strain values do not show the strong correlation with porosity that
was anticipated from the thin section analysis (Figure 24). The expectation was that
porosity would decrease with increasing strain. Intuitively, it is understood that
increased strain should have a negative impact on porosity and permeability in target
units. This is consistent with sandbox model studies of the Pyrenees fold and thrust belt
that show layer parallel shortening is both a significant contributor to regional volume
loss and accommodates porosity reduction (Koyi et al., 2003). This is also seen in rocks
of the Appalachian overthrust belt where little porosity is preserved in rocks surpassing
strain threshold values of 1.5 (R) (Mitra, 1994). This study hypothesizes that penetrative
strain values reached a saturation point between 10% and 12%. This research suggests
this is the maximum penetrative strain that can be accommodated through grain
impingement alone, which is the only grain-scale strain mechanism measured in this
study. In order to see greater PS values, additional microstructural deformation
mechanisms, such as grain rotation, grain compaction, and undulatory extinction would
need to be incorporated into the analysis. It is important to note two examples of
stronger correlation of average formation and transect values for PS plotted versus
rebound strength and porosity. These values may be statistically significant, but the
limited sample size makes it difficult to draw inferences from the data.
Penetrative strain values in these samples converged around 10% on average.
One possible explanation for the clumped values in the petrographic analysis is the

72
presence of quartz overgrowths. While sutured grain boundaries often appear to be the
result of pressure solution, they can also be a product of quartz cementation (Sippel,
1968). Grain contacts can be broadly broken down into four types – tangential, long,
concavo-convex and sutured (Taylor, 1950). Cathodoluminescence (CL) imaging and
scanning electron microscopy (SEM) are two methods which are used to better
constrain the exact nature of a grain contact, and how much the shape of that contact is
related to diagenetic alteration. Samples in this study were looked at under CL imaging
to determine if the presence of quartz cement effected the PS values. Most of the
samples in the field area, did not appear to show significant quartz overgrowth.
However, some samples, such as 038 (Figure 32), taken from transect 3, show cement
rinds on the outer rims of quartz grains in plane and cross polarized light. The Lyons
Formation is not the most deeply buried unit in the field area, however it is the unit that
recorded the highest compaction percentage. High compaction rates are consistent with
samples that would be most likely to undergo diagenetic changes. The Lyons Formation
Figure 32. Left. Plane polarized light (PPL) photomicrograph of quartz cementation in the Lyons Sandstone sampled along transect 2 (sample 038). Right. Cross polarized light (XPL) photomicrograph with quartz (q) grains and overgrowths (o) labeled. Grain boundaries are outlined in blue.

73
likely had a high initial porosity, which would allow for both more compaction and the
presence of fluids in the intergranular pore space, both of which could significantly
contribute to quartz cementation. In comparison, the Fountain Formation is the unit
that is the most deeply buried, and yet it does not display the cement growth seen in
shallower samples, likely as a function of the absence of fluids and less initial
intergranular pore space to allow for compaction.
Another factor affecting the weak correlation between PS and porosity is
weathering and erosion of the samples. Surface porosities are often considered
unreliable measurements due to the infiltration of meteoric water and chemical
reactions which result in the rock matrix (Navarre-Sitchler et al., 2015). Unfortunately,
samples for this study had to be taken at outcrop, however future work will focus on
point counts in moderate- to well-sorted grains from sandstones in core.
This research also attempted to correlate PS with distance from the thrust front
(Figure 22). As discussed earlier, there are multiple thrusts, both east and westward
dipping, along the basin’s margin. The wide range of PS values within the first 3
kilometers of the thrust front illustrates the weak spatial relationship between these
parameters. This study suggests that the close proximity of the samples to the major
regional basement faults affected these values and did not allow for enough variation to
record a significant R2 value. No samples in the study were taken further than 7
kilometers into the basin, with the majority of the samples taken within the first 3
kilometers of the basin bounding fault. In order to see these values change significantly,
sampling needs to occur further into the basin from cores at greater depths.

74
Penetrative strain and internal deformation are comparable processes to the
initiation of fault movement. Prior to fault development, stress buildup in the rock
layers is at a maximum in the subsurface. When fault slip occurs, stress is released, and
the amount of pressure immediately decreases. Penetrative strain manifests itself in a
similar way, where PS is at a maximum prior to the accommodation of macroscale
structures. As faults and folds develop, PS is accommodated less with internal
deformation and more with slip along these surfaces. From this, it can be extrapolated
that the closer the proximity to a major structure, the less penetrative strain is found.
However, this interpretation is simplistic, because it is possible that the fault surface
ruptured early in the progressive deformation sequence, and post-kinematic strain on
the fault has been accommodated in the formation of microscale structures and PS may
still contribute to a large portion of the total deformation. It is important to note that
penetrative strain is an ongoing process and is not confined to the early stages of
deformation (Lathrop and Burberry, 2016). While penetrative strain decreases with the
initiation of a new fault, maximum stress buildup occurs in the fold-thrust belt prior to
the rupture of a new fault surface and then decreases proportionally into the foreland
(Lathrop and Burberry, 2016). These factors need to be accounted for when analyzing PS
in a deformed sedimentary sequence. In order to see PS values change significantly,
samples need to be taken from further out into the basin.
Rebound values were also analyzed to determine both the strength of the
different formations within the basin and whether these values correlated with
penetrative strain and porosity. An early hypothesis in this study was that rocks with

75
less compressive strength would have more void space between the grains, and
therefore increasing porosity and decreasing PS would correlate well with these values.
Previous work suggests that there is a correlation between increasing cement content
and increasing rebound strength, as well as porosity and uniaxial compressive strength,
and that mean grain size does not play a significant role in rebound strength as
previously thought (Palchik, 1999); Aal, 2016). Generally, the data suggests there was
not a strong correlation between the rebound strength and either PS or porosity when
comparing all samples (Figure 26). However, when looking at the average rebound
strength and PS of the formations and plotting those values, a more robust correlation is
noted.
One possible limitation of the study is that samples were taken specifically from
formations that were assumed to be suitable for analysis. The samples were taken from
sandstones, however they were occasionally interbedded with, or in close proximity to,
lenses of high clay content within the same formation. A better methodology for sample
collection may have incorporated sampling specifically from clean, quartz-rich facies
that would be less affected by the presence of outside variables. However, this strategy
may have proved difficult due to lack of access to outcrops that allow sampling in the
increasing urbanization of the Front Range corridor.
11.2 Penetrative strain accommodation
How does the difference between thin-skinned and thick-skinned Sevier and
Laramide deformation manifest itself in the accommodation of penetrative strain?
Strain is more efficiently partitioned throughout weaker, less competent layers

76
(Carreras et al., 2013). In the analog model suite, the closer the layer to the rigid
basement block, the less the layers were likely to internally deform. The opposite effect
is seen in models without a ductile or evaporite detachment, where only a brittle sand
pack is present (Burberry, 2015). Penetrative strain is at a maximum in the basal layers
and decreases toward the top (Burberry, 2015). This is recorded in the models with 2%,
4% and 8% bulk shortening, where there is a decrease in penetrative strain as the model
moves closer to the brittle basement, and then an increase is recorded if the basal layer
is faulted. This suggests greater internal deformation occurs at the base of Sevier style
thrust sheets that are associated with ductile detachments than in basement involved
Laramide thrusts, possibly as a function of the trishear deformation model proposed
above (Erslev, 1991; Erslev, 1993). It is also important to note that the only PS
mechanism that is captured by a sandbox model is grain compaction. Other mechanisms
like grain rotation, grain impingement and grain boundary sliding are not incorporated
into these models. This means that any PS percentage estimated from restored line
lengths is an underestimation of volume loss in the sequence.
In order to fully understand how penetrative strain is accommodated in the
Sevier and Laramide belts, it is necessary to examine the effects of changing crustal
architecture in these different tectonic settings. Moving eastward along the
deformation front, from the Wyoming overthrust belt into the Laramide foreland basins,
there is a change from a thick sedimentary cover overlying a thinner cratonic basement
to a thin sedimentary cover sequence overlying a strong and increasingly thicker
basement (Weil and Yonkee, 2012). As previously discussed, subduction of younger, and

77
by association, hotter and more buoyant oceanic crust were factors leading to the
shallowing subduction of the Farallon slab (Coney and Reynolds, 1977; Liu et al., 2011).
In response to the shallowing of the subduction angle, there was an increased coupling
between the down going plate and the overriding North American plate that enhanced
the amount of stress transferred between the two plates as basal friction along the
bottom of the overriding plate increased (Bird, 1984). This has possible implications for
internal deformation in two separate but contrasting ways. First, this suggests that the
stresses in the lithosphere were being accommodated within the lower crustal
basement rocks, where they would exacerbate fault slip along pre-existing basement
weaknesses, thus they were not transferred to the upper crustal sedimentary rocks
where they could partition strain throughout those layers. The opposite interpretation
assumes increased stress propagated slip on basement faults which broke through to
the surface and thrusted over the sedimentary section, thereby reducing penetrative
strain through the formation of a large-scale structure. Previous authors have suggested
that basement-cored Laramide arches form an anastomosing network of faults linked at
depth in the middle crust and then connected to a lower crustal master detachment
(Erslev, 1993). Major faults have uplifted basement cores which dip to the west, while
the east-dipping backthrusts plunge into the basins (Erslev, 1993). If the basement faults
are connected at depth in the middle crust, then the master detachment could act as
the primary conductor of stress within the crust, which would be manifested in a
minimal surface expression of penetrative strain (Erslev, 1993).

78
The presence of deformation bands in the field area is another indication of
penetrative strain found at the outcrop scale. These bands typically materialize in
deformed, porous sandstones, such as the Lyons and Fox Hills Formation (Fossen et al.,
2007). They are found in the field area in the Lyons Formation at Matthew Winter Park
and in the Fox Hills along the Rooney Road outcrop. They have also been seen on a
regional scale exposed in the Lyons Formation at Garden of the Gods in Colorado
Springs (Siddoway and Diaz, 2013). Regional thrusting is a common indicator of the
presence of these bands (Fossen et al., 2007). Previous papers have discussed whether
deformation bands in sandstones or minor slip along fault surfaces form as the first
indications of mesoscale rock failure (Fossen et al., 2007). Based on the classification
scheme of Fossen, which is predicated on percentage of phyllosilicates and burial depth,
bands found in the field area can be classified as cataclastic (Fossen et al., 2007).
Published work has suggested that the presence of cataclastic bands can reduce
porosity by as much as an order of magnitude through grain crushing and the
subsequent reordering of grains and grain sizes (Fossen et al., 2007). Surface expression
of the deformation bands may be an indicator fault linkage at depth (Fossen et al., 2007;
Siddoway and Diaz, 2013). Faults may nucleate originally as deformation bands in areas
of high compaction, then grow in length and connect, creating a large fault cored
damage zone (Fossen et al, 2007; Siddoway and Diaz, 2013). It is important to note
these bands were prominently exposed in the field area at Matthew Winter Park along
transect 4, which lies directly above the Golden Fault Zone. Fault displacements at the
sub-seismic scale, like those in individual deformation bands, can be considered part of

79
total volume loss due to penetrative strain. However, when faults link and form massive
structures, which can be mapped at cross-section scale, those features cannot be
incorporated into PS estimates.
Another important observation from the suite of analog models is that generally
the percentage of shortening accommodated by penetrative strain increases as the total
percentage of bulk shortening increases. This is particularly true for the upper layers in
the sedimentary sequence which are not faulted. As mentioned earlier, tectonic
shortening estimates for the Sevier fold and thrust belt have been calculated as high as
50%, while shortening estimates in the Laramide belts are between 10 and 15% (Erslev,
1993). Tectonic shortening estimates across both transects 1 and 2, which were line
length balanced, fall within this range. It would be interesting to see if this correlation
holds true with a greater sample size. For this study, transects 1 and 2 each record 9.7%
pressure solution shortening, but transect 2 records 2% greater total shortening. While
the data do not support the conclusion in this instance, perhaps there is not a strong
enough variation to draw any permanent inferences.
If the correlation between PS and bulk shortening from the models is correct,
then that suggests significantly greater penetrative deformation in the Wyoming
overthrust belt than in the field area, simply due to the amount of total shortening
which has occurred across each region. This would match field observations from
studies that show pressure solution cleavages are more common in Sevier style thrust
sheets than in Laramide thrusts (Erslev, 1993). Previous work has suggested that the
area of most intense penetrative deformation is in the hinterland of a fold and thrust

80
belt rather than the foreland basin (Van Der Pluijm and Marshak, 1997).
Another factor to consider when examining penetrative strain estimates is the
percentage of shortening accommodated through large-scale structural features. If
tectonic shortening estimates of 50% for Sevier fold and thrust belts are correct, then
this suggests that the majority of shortening may already be accommodated by
macroscale structures, thereby the reducing the potential for penetrative strain
accommodation in the region. Laramide deformation, however, is only accommodated
by 10-15% tectonic shortening, which leaves a much higher potential amount to be
determined through microstructural deformation analysis. However, a simpler
explanation is that there is a large discrepancy between the amounts of Sevier and
Laramide shortening due to the Sevier belts proximity to the area undergoing the most
intense deformation.

81
12. Conclusions
This research has provided several important talking points about the nature of
penetrative strain. The primary takeaway from this work is the importance of crustal
architecture in controlling physical parameters, such as rebound strength and porosity,
and the effect of basement faulting on the amount of strain transferred to rocks in both
the subsurface and at outcrop. The outcomes from this research have suggested the
following interpretations:
1) There is a saturation point between 10% and 12% for which penetrative
strain can be accommodated through grain impingement processes alone.
2) Penetrative strain values for grain impingement do not show variation within
close proximity (less than 5 km) of a thrust front.
3) There is only a weak correlation between penetrative strain and physical
parameters such as rebound strength and porosity when individual samples
are included in the analysis. A more robust correlation was noted when
average PS and average porosity and rebound strength values were plotted
together, although it is important to note the small sample size may limit the
statistical significance of the data.
4) For basement involved thrusting, PS is at a maximum in the upper layers of
the model. This is consistent with the results of the Lathrop and Burberry
(2016) paper where brittle layers were modeled above a ductile detachment.
However, the results from this study are less variable and show a consistent
decrease in PS with depth. This work and the Lathrop paper differ from the
Burberry (2015) paper which did not model a detachment in the upper
sequence and records the opposite result, a PS increase with depth in a
brittle sedimentary section.

82
5) Surface weathering, diagenetic processes, fracture density, and the presence
of clay mineralization all play an important role in penetrative strain and
porosity calculations.
6) The total amount of shortening across an orogenic belt has a proportional
effect on penetrative strain. When one increases, so does the other.
7) Microscale and mesoscale deformation processes mimic what happens at the
regional scale. Sevier fold and thrusts are more intensely deformed than
Laramide basins. This is recorded in fault slippage and folding, but also with
internal strain and penetrative deformation processes given in field
observations.
Sevier and Laramide deformation styles have produced significant variation in both
macroscale and microscale structures across the North American Cordillera, as well as
differences in the total amount of shortening experienced. These differences are a
result of pre-existing crustal weakness, changing angles of subduction, oscillating
convergence rates and relative plate motions, buoyancy of subducting crust, and
regional variations in thickness of sedimentary and basement strata. The Sevier and
Laramide represent two overlapping but distinctly different periods in the geologic
development of North America and provide a unique opportunity to recognize multiple
types of deformation from the same origin.

83
13. Future research directions
This research has posed several interesting questions which can direct future
research in the field of penetrative strain. First and foremost, the relationship between
penetrative strain and porosity must be examined. I think more targeted, specific
sampling from quartz-rich sandstone facies, rather than intervals with high clay content,
could help to clarify the data. From the samples in the field area, I think the clean quartz
sandstone of the Lyons Formation provided the most reliable data. Previous studies
indicate there should be a stronger correlation between these parameters than seen in
these samples. Whether that is a function of the limited expression of penetrative strain
in thick-skinned belts, or because of the finite mechanisms of grain-scale deformation
which were incorporated in this research, is a question that needs to be asked. In the
future, I think this could be addressed by looking at additional microscale deformation,
such as calcite twinning, using the strain gauge technique. This could be achieved
through targeted sampling of the Niobrara Formation or limestone intervals of the
Ingleside and Morrison formations. Additionally, surface porosities are notoriously
unreliable, and to combat this sampling from cores will be implemented in future
analysis. Another possible research avenue would be to look at internal deformation in
other basement involved thrust sheets, such as in the Andes.
Future work could focus on the relationship between penetrative strain and
distance from major regional structures. This proposed correlation is another area
where a hypothesis makes intuitive sense, but the data in this study does not bear out a
strong correlation. This research suggests that sampling came from an area too close to

84
the regional uplift to see variation in penetrative strain. Sampling needs to come from
further east into the Denver-Julesburg Basin and from sandstones at greater depths to
begin to see significant deviation. Again, I think having a specific sampling strategy
which identified the different major structures, and sampled as close as possible to
them would be beneficial. Then, sampling from the same unit in core 100 kilometers
into the basin could provide the separation needed. I also feel it is important to look at
the different types of structures in the basin. This research focused on the major thrusts
in the region, but future work could look specifically at the major NE-SW trending
wrench fault zones that accommodate transtensional stress and see how it affects
penetrative strain.
This work could move forward by looking at new and interesting methods to
measure rock strength, for example, incorporating triaxial compressive shear tests into
the analysis. Also, it would be interesting to cut new thin sections perpendicular to the
current samples to look at strain in three dimensions. However, I think the most
important direction this research could move involves diagenetic alteration. It is
important to take a deeper look at quartz cementation in Laramide basins and see how
penetrative strain has been affected by post-depositional changes in grain shape and
overgrowths. The incorporation of CL imaging, SEM analysis, and possible geochemical
analysis using isochron diagrams to look at the concentration of refractory elements
(titanium, zircon, aluminum) versus elements mobilized during pressure solution, could
add interesting dimensions to this work.

85
References
Abd El Aal, A., 2017, Assessment of physicomechanical parameters in the Lower Red Unit (LRU) of the Wajid Sandstone, Bir Askar, Najran, Saudi Arabia: Egyptian Journal of Petroleum, v. 26, p. 565–578, doi: 10.1016/j.ejpe.2016.08.004.
Agard, P., Omrani, J., Jolivet, L., and Mouthereau, F., 2005, Convergence history across Zagros (Iran): Constraints from collisional and earlier deformation: International Journal of Earth Sciences, v. 94, p. 401-419, doi:10.1007/s00531-005-0481-4.
Allmendinger, R. W., Cardozo, N., and Fisher, D., 2012, Structural geology algorithms: Vectors and tensors in structural geology: Cambridge University Press.
Allmendinger, R.W., and Jordan, T.E., 1984, Mesozoic structure of the Newfoundland Mountains, Utah; horizontal shortening and subsequent extension in the hinterland of the Sevier Belt: Geological Society of America Bulletin, v. 95, p. 1280–1292.
Allmendinger, R.W., Jordan, T.E., Kay, S.M., and Isacks, B.L., 1997, The evolution of the Altiplano-Puna Plateau of the Central Andes: Annual Review of Earth and Planetary Sciences, v. 25, p. 139–174.
Barbeau, D.L., 2003, A flexural model for the Paradox Basin: implications for the tectonics of the Ancestral Rocky Mountains: Basin Research, v. 15, p. 97–115, doi: 10.1046/j.1365-2117.2003.00194.x.
Barkmann, P.E., Fitzgerald, F.S., Sebol, L.A., Curtiss, W.M., Pike, J., Moore, A., and Taylor, B., 2015, Geology and Groundwater Resources of Douglas County: Colorado Geological Survey, Open File Report OF-15-10, p. 1-45. Bird, P., 1984, Laramide crustal thickening event in the Rocky Mountain foreland and
Great Plains: Tectonics, v. 3, p. 741–758, doi: 10.1029/TC003i007p00741.
Braddock, W. A., Calvert, R.H., Gawarecki, S.J., and Nutalaya, P. 1970, Geologic map of the Masonville quadrangle, Larimer County, Colorado: U.S. Geological Survey, scale 1:24,000.
Braddock, W. A., Nutalaya, P., and Colton, R. B., 1988, Geologic map of the Carter Lake Reservoir quadrangle, Boulder and Larimer counties, Colorado: U.S. Geological Survey, scale 1:24,000.
Braddock, W. A., Calvert, R.H., O’Connor, J.T., and Swann, G.A., 1989, Geologic map of the Horsetooth Reservoir quadrangle, Larimer County, Colorado. U.S. Geological Survey, scale 1:24,000.

86
Burberry, C.M., 2015, Spatial and temporal variation in penetrative strain during compression; insights from analog models: Lithosphere, v. 7, p. 611–624, doi: 10.1130/L454.1.
Burberry, C.M., 2016, Penetrative strain on the field scale: Detrimental to reservoir quality?: AAPG search and discovery article #51300.
Byerlee, J., 1978, Friction of rocks: Pure and Applied Geophysics, v. 116, p. 615–626.
Carreras, J., Cosgrove, J.W., and Druguet, E., 2013, Strain partitioning in banded and/or anisotropic rocks; implications for inferring tectonic regimes: Journal of Structural Geology, v. 50, p. 7–21, doi: 10.1016/j.jsg.2012.12.003.
Colorado Stratigraphy, 2016, Strat panels and measured sections: http://coloradostratigraphy.org/strat-panels---measured-sections.html, (accessed 2018).
Coney, J., 1976, Plate tectonics and the Laramide Orogeny: New Mexico Geological Society Special Publication, no. 6, p. 5-10.
Coney, J., and Reynolds, S.J., 1977, Flattening of the Farallon slab: Nature, v. 270, p. 403–406.
Craddock, J.P., and van der Pluijm, B.A., 1999, Sevier-Laramide deformation of the continental interior from calcite twinning analysis, west-central North America: Tectonophysics, v. 305, p. 275–286.
DeCelles, P.G., and Mitra, G., 1995, History of the Sevier orogenic wedge in terms of critical taper models, Northeast Utah and Southwest Wyoming: Geological Society of America Bulletin, v. 107, p. 454–462, doi: 10.1130/0016-7606(1995)107<0454:HOTSOW>2.3.CO;2.
DeCelles, P.G., and Giles, K.A., 1996, Foreland basin systems: Basin Research, v. 8, p. 105–123, doi: 10.1046/j.1365-2117.1996.01491.x.
DeCelles, P.G., 2004, Late Jurassic to Eocene evolution of the Cordilleran thrust belt and foreland basin system, western U.S.A.: American Journal of Science, v. 304, p. 105–168, doi: 10.2475/ajs.304.2.105.
Demko, T. M., Currie, B. S., and Nicoll, K. A., 2004, Regional paleoclimatic and stratigraphic implications of paleosols and fluvial/overbank architecture in the Morrison Formation (Upper Jurassic), Western Interior, USA.: Sedimentary Geology, v. 167, no. 3-4, p. 115-135.

87
Dickinson, W.R., 2004, Evolution of the North American Cordillera: Annual Review of Earth and Planetary Sciences, v. 32, p. 13–45, doi: 10.1146/annurev.earth.32.101802.120257.
Dickinson, W.R., and Lawton, T.F., 2001, Tectonic setting and sandstone petrofacies of the Bisbee basin(USA–Mexico): Journal of South American Earth Sciences, v. 14, p. 475–504, doi: 10.1016/S0895-9811(01)00046-3.
Dubey, A.K., 2014, Understanding an Orogenic Belt: Structural Evolution of the Himalaya: Springer, 405 p.
Engelder, T., and Engelder, R., 1977, Fossil distortion and decollement tectonics of the Appalachian Plateau: Geology [Boulder], v. 5, p. 457–460.
Engelder, T., 1979, The nature of deformation within the outer limits of the central Appalachian foreland fold and thrust belt in New York State: Tectonophysics, v. 55, p. 289–310.
Erslev, E.A., 1991, Trishear fault-propagation folding: Geology, v. 19, no. 6, p. 617-620.
Erslev, E.A., 1993, Thrusts, backthrusts and detachments of Rocky Mountain foreland arches, in Schmidt, C.J., Chase, R.B., Erslev, E.A., eds., Laramide Basement Deformation in the Rocky Mountain Foreland of the Western United States: Geological Society of America Special Paper 280, p. 339–358.
Fossen, H., Schultz, R.A., Shipton, Z.K., and Mair, K., 2007, Deformation bands in sandstone: a review: Journal of the Geological Society, v. 164, p. 755–769, doi: 10.1144/0016-76492006-036.
Foster, D.A., Mueller, P.A., Mogk, D.W., Wooden, J.L., and Vogl, J.J., 2006, Proterozoic evolution of the western margin of the Wyoming Craton; implications for the tectonic and magmatic evolution of the Northern Rocky Mountains: Canadian Journal of Earth Sciences = Revue Canadienne des Sciences de la Terre, v. 43, p. 1601–1619, doi: 10.1139/E06-052.
Gehrels, G.E., and Pecha, M., 2014, Detrital zircon U–Pb geochronology and Hf isotope geochemistry of Paleozoic and Triassic passive margin strata of western North America, Geosphere, v. 10, p. 49–65.
Graveleau, F., Malavieille, J., and Dominguez, S., 2012, Experimental modelling of orogenic wedges; a review: Tectonophysics, v. 538–540, p. 1–66, doi: 10.1016/j.tecto.2012.01.027.
Groshong, R.H., 2006, 3-D Structural Geology: A Practical Guide to Quantitative Surface and Subsurface Map Interpretation: Springer Science & Business Media, 411 p.
88
Groshong, R.H., Jr., 1972, Strain Calculated from Twinning in Calcite: Geological Society of America Bulletin, v. 83, p. 2025–2037, doi: 10.1130/0016-7606(1972)83[2025:SCFTIC]2.0.CO;2.
Haramy, K.Y., and DeMarco, M.J., 1985, Use of the Schmidt hammer for rock and coal testing: Proceedings - Symposium on Rock Mechanics, v. 26, p. 549–555.
Haun, J. D., 1963, Stratigraphy of Dakota Group and relationship to petroleum occurrence,
northern Denver basin, in Bolyard, D.W., and Katich, P.J., eds., Guidebook to the geology
of the northern Denver Basin and adjacent uplifts : fourteenth field conference,
Colorado, Wyoming, Nebraska, and South Dakota.
Heuret, A., and Lallemand, S., 2005, Plate motions, slab dynamics and back-arc deformation: Physics of the Earth and Planetary Interiors, v. 149, p. 31–51, doi: 10.1016/j.pepi. 2004.08.022.
Higley, D.K., and Cox, D.O., 2007, Oil and gas exploration and development along the front range in the Denver Basin of Colorado, Nebraska, and Wyoming: U. S. Geological Survey : Reston, VA, United States.
Hoffman, P.F., 1989, Precambrian geology and tectonic history of North America The geology of North America, in United States, Geol. Soc. Am. : Boulder, CO, United States, v. A, p. 447–512.
Hoyt, J.H., 1962, Pennsylvanian and Lower Permian of Northern Denver Basin, Colorado, Wyoming, and Nebraska: AAPG Bulletin, v. 46, no. 1, p. 46-59.
Hoyt, J.H., 1963, Permo-Pennsylvanian correlations and isopach studies in the northern Denver Basin, in Rocky Mountain Association of Geologists 14th Field Conference, Guidebook to the geology of the northern Denver Basin and adjacent uplifts, p. 68-83.
Humphreys, E.D., 1995, Post-Laramide removal of the Farallon Slab, Western United States: Geology [Boulder], v. 23, p. 987–990, doi: 10.1130/0091-7613(1995)023<0987: PLROTF>2.3.CO;2.
Hutsky, A.J. and Fielding, C.R., 2017, Tectonic controls on sediment dispersal in the middle to upper Turonian western Cordilleran foreland basin: Sedimentology, v. 64, issue 6, p. 1540-1571.
Johnson, M.R.W., 2002, Shortening budgets and the role of continental subduction during the India-Asia collision: Earth-Science Reviews, v. 59, p. 101–123, doi: 10.1016/S0012-8252(02)00071-5.
89
Karlstrom, K.E., and Bowring, S.A., 1988, Early Proterozoic assembly of tectonostratigraphic terranes in southwestern North America: Journal of Geology, v. 96, p. 561–576.
Kellogg, K.S., Bryant, B., and Reed, J.C., Jr., 2004, The Colorado Front Range; anatomy of a Laramide uplift: GSA Field Guide, v. 5, p. 89–108.
Kent, D.V., and Irving, E., 2010, Influence of inclination error in sedimentary rocks on the Triassic and Jurassic apparent pole wander path for North America and implications for Cordilleran tectonics: Journal of Geophysical Research, v. 115, p. p. 1-25, doi: 10.1029/2009JB007205.
Kluth, C.F., and Coney, P.J., 1981, Plate tectonics of the ancestral Rocky Mountains: Geology [Boulder], v. 9, p. 10–15.
Koyi, H.A., 1997, Analogue modeling: From a qualitative to a quantitative technique – A historical outline: Journal of Petroleum Geology, v. 20, no. 2, p. 223-238.
Koyi, H.A., Sans, M., Teixell, A., Cotton, J., and Zeyen, H., 2003, The significance of penetrative strain in contractional areas, in McClay, K.R., ed., Thrust Tectonics. American Association of Petroleum Geology Memoir 82, p. 208-222.
Koyi, H.A., Sans, M., Teixell, A., Cotton, J., and Zeyen, H., 2004, The significance of penetrative strain in the restoration of shortened layers; insights from sand models and the Spanish Pyrenees: AAPG Memoir, v. 82, p. 207–222.
Lathrop, B.A., and Burberry, C.M., 2016, Accommodation of penetrative strain during deformation above a ductile decollement: Lithosphere, v. 9, p. 46–57, doi: 10.1130/L558.1.
Leary R.J., Umhoefer, P., Smith, M.E., and Riggs, N., A three-sided orogen: A new tectonic model for Ancestral Rocky Mountain uplift and basin development, Geology, v. 45, no. 8, p. 735–738. doi: https://doi-org.libproxy.unl.edu/10.1130/G39041.1.
Levin, H.L., 2009, The Earth Through Time: John Wiley & Sons, 226 p.
Liu S., Nummedal, D., and Liu, L., 2011, Migration of dynamic subsidence across the Late Cretaceous United States Western Interior Basin in response to Farallon Plate subduction: Geology [Boulder], v. 39, p. 555–558, doi: 10.1130/G31692.1.
Lydon, J.W., 2007, Geology and metallogeny of the Belt-Purcell Basin: Special Publication - Geological Association of Canada. Mineral Deposits Division, v. 5, p. 581–608.

90
Marshak, S., Karlstrom, K.E., and Timmons, J.M., 2000, Inversion of Proterozoic extensional faults; an explanation for the pattern of Laramide and ancestral Rockies intracratonic deformation, United States: Geology [Boulder], v. 28, p. 735–738, doi: 10.1130/0091-7613(2000)028<0735:IOPEFA>2.3.CO;2.
Mazzoli, S. [editor], and Butler, R.W.H. [editor], 2006, Styles of continental contraction, in Special Paper - Geological Society of America, Geological Society of America (GSA) : Boulder, CO, United States, v. 414.
McQuarrie, N., 2004, Crustal scale geometry of the Zagros fold-thrust belt, Iran: Journal of Structural Geology, v. 26, p. 519-535, doi:10.1016/j.jsg.2003.08.009.
Meere, P.A., and Mulchrone, K.F., 2003, The effect of sample size on geological strain estimation from passively deformed clastic sedimentary rocks: Journal of Structural Geology, v. 25, p. 1587–1595, doi: 10.1016/S0191-8141(03)00007-5.
Mitra, G., 1994, Strain variation in thrust sheets across the Sevier fold-and-thrust belt (Idaho-Utah-Wyoming); implications for section restoration and wedge taper evolution: Journal of Structural Geology, v. 16, p. 585–602.
Mitra, G., 1997, Evolution of salients in a fold-and-thrust belt: the effects of sedimentary basin geometry, strain distribution and critical taper, in Sengupta, S., ed., Evolution of Geological Structures in micro- to macro-scales, Chapman and Hall, London, p. 59–90.
Morgan, M.L., Temple, J., Grizzell, M.T., and Barkmann, P.E., 2004, Geologic map of the Dawson Butte quadrangle, Douglas County, Colorado: Colorado Geological Survey Open-File Report OF04-07, scale 1:24,000.
Murphy, J., 2018, Onasch Grains, GitHub, http://github.com/MurphysLab/onasch_grains (accessed March 2018).
Myers, A.R., Lindvall, R.A., Hynes, J.L., and Ivey, J.B., 1978, Coal and clay mine hazard
study and estimated unmined coal resources, Jefferson County, Colorado:
Amuedo and Ivey, Consulting Geologists.
Napp, K. and Ethridge, F., 1985, Depositional systems of Fountain formation and its
basinal equivalents, northwestern Denver Basin, Colorado: AAPG Bulletin, v. 69,
no. 5, p. 857-858.
Navarre-Sitchler, A., Brantley, S.L., Rother, G., 2015, How porosity increases during
incipient weathering of crystalline silicate rocks: Reviews in mineralogy and
geochemistry, v. 80, no. 1, p. 331-354.

91
Nesse, W.D., 2006, Geometry and tectonics of the Laramide Front Range, Colorado: Rocky Mountain Association of Geologists, The Mountain Geologist, v. 43, no. 1, p. 25-44.
Nwangwu, U., 1977, Depositional environments, Upper Pierre Shale, Denver Basin,
Colorado in Veal, H.K., ed., Exploration Frontiers of the central and southern Rockies.
Oldow, J.S., Bally, A.W., Lallemant, H.G.A., and Leeman, W.P., 1989, Phanerozoic evolution of the North American Cordillera; United States and Canada The geology of North America, in United States, Geol. Soc. Am. : Boulder, CO, United States, v. A, p. 139–232.
Onasch, C.M., 1993, Determination of pressure solution shortening in sandstones: Tectonophysics, v. 227, p. 145–159.
Palchik, V., 1999, Influence of porosity and elastic modulus on uniaxial compressive strength in soft brittle porous sandstones: Rock Mechanics and Rock Engineering, v. 32, p. 303–309.
Pfiffner, O.A., 2006, Thick-skinned and thin-skinned styles of continental contraction: Special Paper - Geological Society of America, v. 414, p. 153–177, doi: 10.1130/2006.2414(09).
Pfiffner, 0.A., 2017, Thick-skinned and thin-skinned tectonics: A global perspective:
Geosciences, v. 7, issue 3, no. 71, doi:10.3390/geosciences7030071.
Pierson, N., 2014, Assessing layer parallel shortening in the eastern Colorado Front Range using thin section analysis and analog sandbox models [Masters thesis]: University of Nebraska-Lincoln, 38 p.
Raynolds, R.G., 2002, Upper Cretaceous and Tertiary stratigraphy of the Denver Basin, Colorado: Rocky Mountain Geology, v. 37, no. 2, p. 111-134
Ross, G.M., and Villeneuve, M., 2003, Provenance of the Mesoproterozoic (1.45 Ga) Belt
Basin (western North America); another piece in the pre-Rodinia paleogeographic puzzle: Geological Society of America Bulletin, v. 115, p. 1191–1217, doi: 10.1130/B25209.1.
Ruleman, C.A., Bohannon, R.G., Bryant, B., Shroba, R.R., and Premo, W.R., 2011, Geologic map of the Bailey 30’ x60’ quadrangle, North-Central Colorado, U.S. Geological Survey Scientific Investigations Map 3156, 1:100,000, booklet 38 p
Sans, M., Verges, J., Gomis, E., Pares, J.M., Schiattarella, M., Trave, A., Calvet, F.,
Santanach, P., and Doulcet, A., 2003, Layer parallel shortening in salt-detached

92
folds; constraint on cross-section restoration: Tectonophysics, v. 372, p. 85–104, doi: 10.1016/S0040-1951(03)00233-6.
Shaw, C.A., Karlstrom, K.E., McCoy, A. Williams, M.L., Jercinovic, M.J., and Dueker, K. 2002, Proterozoic shear zones in the Colorado Rocky Mountains: From continental assembly to intracontinental reactivation, in Lageson, D., ed., Science at the highest level, p. 101-116.
Schellart, W.P., 2000, Shear test results for cohesion and friction coefficients for
different granular materials: scaling implications for their usage in analogue modeling: Tectonophysics, v. 324, p. 1-16.
Schreurs, G., Buiter, S.J.H., Boutelier, D., Corti, G., Costa, E., Cruden, A.R., Daniel, J.-M., Hoth, S., Koyi, H.A., Kukowski, N., Lohrmann, J., Ravaglia, A., Schlische, R.W., Withjack, M.O., et al., 2006, Analogue benchmarks of shortening and extension experiments: Geological Society Special Publications, v. 253, p. 1–27.
Siddoway, C., Myrow, P., and Fitz-Diaz, E., 2013, Strata, structures, and enduring enigmas; a 125th anniversary appraisal of Colorado Springs geology: GSA Field Guide, v. 33, p. 331–356, doi: 10.1130/2013.0033(13).
Sippel, R.F., 1968, Sandstone petrology, evidence from luminescence petrography: Journal of Sedimentary Petrology, v. 38, p. 530–554, doi: 10.1306/74D719DD-2B21-11D7-8648000102C1865D.
Sloss, L.L., 1963, Sequences in the cratonic interior of North America: GSA Bulletin, v. 74, no. 2, p. 93-114.
Soreghan, G.S., Keller, R.G., Gilbert, C.M., Chase, C.G., and Sweet, D.E., 2012, Load-induced subsidence of the Ancestral Rocky Mountains recorded by preservation of Permian landscapes: Geosphere, v. 8, no. 3, p. 654-668.
Sweet, D. E., and Soreghan, G. S., 2010, Late Paleozoic tectonics and paleogeography of the ancestral Front Range: Structural, stratigraphic, and sedimentologic evidence from the Fountain Formation (Manitou Springs, Colorado): Bulletin, v. 122, no. 3-4, p. 575-594.
Taylor, J.M., 1950, Pore-space reduction in sandstones: Bulletin of the American
Association of Petroleum Geologists, v. 34, p. 701–716, doi: 10.1306/3D933F47-16B1-11D7-8645000102C1865D.
Tieje, A. J., 1923, The red beds of the Front Range in Colorado: A study in sedimentation: The Journal of Geology, v. 31, no. 3, 192-207.

93
Turner, C.E., and Peterson, F., 2004, Reconstruction of the Upper Jurassic Formation extinct ecosystem – a synthesis: Sedimentary Geology, v. 167, issues 3-4, p. 309-355.
Tweto, O., compiler, 1979, Geologic map of Colorado: U.S. Geological Survey of Colorado, scale 1:500,000, 2 sheets.
Uhlir, D.M., Akers, A., and Vondra, C.F., 1988, Tidal inlet sequence, Sundance Formation (Upper Jurassic), north-central Wyoming: Sedimentology, v. 35, p. 739–752.
Vollmer, F.W., 2010, A Comparison of Ellipse-Fitting Techniques for Two and Three-Dimensional Strain Analysis, and Their Implementation in an Integrated Computer Program Designed for Field-Based Studies: AGU Fall Meeting Abstracts, v. 21, p. T21B-2166.
Weil, A.B., and Yonkee, A., 2009, Anisotropy of magnetic susceptibility in weakly deformed red beds from the Wyoming Salient, Sevier thrust belt; relations to layer-parallel shortening and orogenic curvature: Lithosphere, v. 1, p. 235–256, doi: 10.1130/L42.1.
Weil, A.B., and Yonkee, W.A., 2012, Layer-parallel shortening across the Sevier fold-thrust belt and Laramide foreland of Wyoming: spatial and temporal evolution of a complex geodynamic system: Earth and Planetary Science Letters, v. 357–358, p. 405–420, doi: 10.1016/j.epsl.2012.09.021.
Weimer, R.J., 1973, A guide to uppermost Cretaceous stratigraphy, central Front Range,
Colorado: deltaic sedimentation, growth faulting and early Laramide crustal
movement: Mountain Geologist, v. 10, no. 3, p. 53-97.
Weimer, R.J., and Tillman, R.W., 1980, Tectonic influence on deltaic shoreline facies, Fox Hills Sandstone, west-central Denver Basin: Professional Contributions, Colorado School of Mines, no. 10, p. 1-42.
Weimer, R.J., and Ray, R.R., 1997, Laramide mountain flank deformation and the Golden fault zone, Jefferson County, Colorado, in United States, Rocky Mountain Association of Geologists : Denver, CO, United States, p. 49–64.
Whitaker, A.E., and Bartholomew, M.J., 1999, Layer parallel shortening; a mechanism for determining deformation timing at the junction of the Central and Southern Appalachians: American Journal of Science, v. 299, p. 238–254.
Wiltschko, D.V., Medwedeff, D.A., and Millson, H.E., 1985, Distribution and mechanisms of strain within rocks on the northwest ramp of Pine Mountain block, Southern Appalachian foreland; a field test of theory: Geological Society of America Bulletin, v. 96, p. 426–435.

94
Woodward, N.B., 1986, Thrust fault geometry of the Snake River Range, Idaho and Wyoming: Geological Society of America Bulletin, v. 97, p. 178–193.
Yonkee, W.A., and Weil, A.B., 2015, Tectonic evolution of the Sevier and Laramide belts within the North American Cordillera orogenic system: Earth-Science Reviews, v. 150, p. 531–593, doi: 10.1016/j.earscirev.2015.08.001.

95
Appendix A.
Table 1.
Sample Latitude Longitude Formation Transect Fault distance, m
001A 40.349 -105.226 Satanka 3 1158
001C 40.349 -105.226 Satanka 3 1158
002A 40.348 -105.225 Satanka 3 1189
002B 40.348 -105.225 Satanka 3 1189
003 40.419 -105.221 Fountain 2 785
004 40.411 -105.210 Satanka 2 458
005A 40.418 -105.192 Satanka 2 646
005B 40.418 -105.192 Satanka 2 646
005C 40.418 -105.192 Lyons 2 646
005D 40.418 -105.192 Lyons 2 646
006 40.416 -105.155 Morrison 2 3291
008 40.514 -105.091 Dakota 1 2696
009 39.672 -105.208 Fountain 4 1429
010 39.695 -105.205 Lyons 4 367
011 39.709 -105.196 Fox Hills 4 157
012 39.708 -105.196 Fox Hills 4 77
014 39.646 -105.137 Laramie 4 782
015 39.646 -105.137 Laramie 4 755
017 39.651 -105.185 Laramie 4 1836
019 40.528 -105.141 Dakota 1 1536

96
Sample Latitude Longitude Formation Transect Fault distance, m
021 40.526 -105.144 Morrison 1 1158
022 40.520 -105.148 Satanka 1 803
023 40.514 -105.158 Lyons 1 62
024 40.511 -105.157 Lyons 1 89
025 40.515 -105.159 Satanka 1 98
026 40.517 -105.164 Fountain 1 117
027 40.517 -105.164 Fountain 1 53
028 40.516 -105.165 Fountain 1 63
029 40.516 -105.162 Satanka 1 130
031 40.397 -105.140 Dakota 2 6765
032 40.438 -105.200 Dakota 2 2024
033 40.340 -105.226 Lyons 3 1982
034 40.359 -105.282 Fountain 3 864
036 40.332 -105.212 Morrison 3 2728
037 40.334 -105.212 Dakota 3 2362
038 40.344 -105.206 Lyons 3 1437
039 40.346 -105.207 Satanka 3 1197
040 40.360 -105.220 Fountain 3 166

97
Table 2.
Sample PS % LPS % Compaction % Porosity % Rebound
001A 10.6 10.7 14.7 2.3 X
001C 10.3 9.5 15.3 3.7 X
002A 9.9 12.2 10.4 3.0 X
002B 9.9 12.0 10.1 1.4 X
003 11.1 10.7 13.4 2.8 13.5
004 9.7 12.3 7.2 0.7 40.6
005A 10.0 11.9 10.7 0.0 49.2
005B 9.4 12.0 11.0 0.1 57
005C 11.1 12.6 13.1 3.4 58.1
005D 9.8 10.1 14.0 1.7 57.0
006 10.2 13.6 9.6 1.0 13.7
008 9.9 11.1 11.9 3.3 41.4
009 9.4 12.2 14.4 2.5 17.2
010 10.3 11.9 14.9 5.3 33.3
011 8.1 11.3 8.8 23.3 26.4
012 8.6 15.3 6.3 0.4 21.5
014 9.8 13.5 13.1 20.5 37.2
015 9.2 15.6 10.7 19.2 39.0
017 8.8 12.9 10.7 9.3 18.9
019 9.7 15.3 8.0 7.9 52.9
021 9.2 15.3 9.1 6.2 37.5
022 9.9 19.2 12.8 0.6 14.2

98
Sample PS % LPS % Compaction % Porosity % Rebound
023 9.9 14.1 11.6 11.7 48.6
024 10.6 14.2 10.7 15.1 63.9
025 9.3 11.0 11.0 8.8 22.5
002 9.5 15.6 11.0 5.4 55.5
027 8.9 10.1 10.7 6.1 20.8
028 10.3 11.9 14.3 0.2 45.6
029 9.0 13.8 10.5 4.3 44.0
031 9.1 11.1 9.7 18.3 48.7
032 9.9 11.6 13.4 5.1 35.6
033 10.6 15.2 10.7 4.2 58.1
034 9.6 12.9 10.7 3.6 26.4
036 10.5 12.8 9.7 2.6 41.5
037 10.2 14.7 10.2 8.0 51.4
038 12.1 11.9 15.9 3.1 58.8
039 10.0 11.9 9.2 1.7 57.0
040 10.8 13.1 11.3 2.5 X

99
Table 3. Mean values for physical properties of the formations sampled in this study.
Formation PS % LPS % Compaction % Porosity % Rebound, MPa
Fountain 9.9 12.4 12.3 3.4 39.4
Satanka 9.8 12.4 11.2 2.4 40.6
Lyons 10.6 12.9 13.0 6.3 54.0
Morrison 10.0 13.9 9.5 3.3 30.9
Dakota 9.6 12.8 10.6 8.6 39.4
Fox Hills 8.4 13.3 7.6 11.9 24.0
Laramie 9.5 14.5 11.9 19.9 38.1

100
Appendix B.
Table for 4% total shortening model.
Line Original length,
mm x 10
Deformed length,
mm x 10
Restored length,
mm x 10
Difference, mm x 10
Total Shortening
%
Tectonic Shortening
% PS %
PS, as % of total
shortening
1 2600 2485 2527.1 42.1 4 1.69 2.31 57.6
2 2600 2485 2558.9 73.9 4 2.97 1.03 25.7
3 2600 2485 2577.7 92.7 4 3.73 0.27 6.7
4 2600 2485 2557.4 72.4 4 2.91 1.09 27.2
Table for 8% total shortening model.
Line Original length,
mm x 10
Deformed length,
mm x 10
Restored length,
mm x 10
Difference, mm x 10
Total Shortening
%
Tectonic Shortening
% PS %
PS, as % of total
shortening
1 2600 2390 2460.5 70.5 8 2.95 5.05 63.1
2 2600 2390 2502.4 112.4 8 4.70 3.30 41.2
3 2600 2390 2541.8 151.8 8 6.35 1.65 20.6
4 2600 2390 2465.8 75.8 8 3.17 4.83 60.4

101
Appendix C.

102
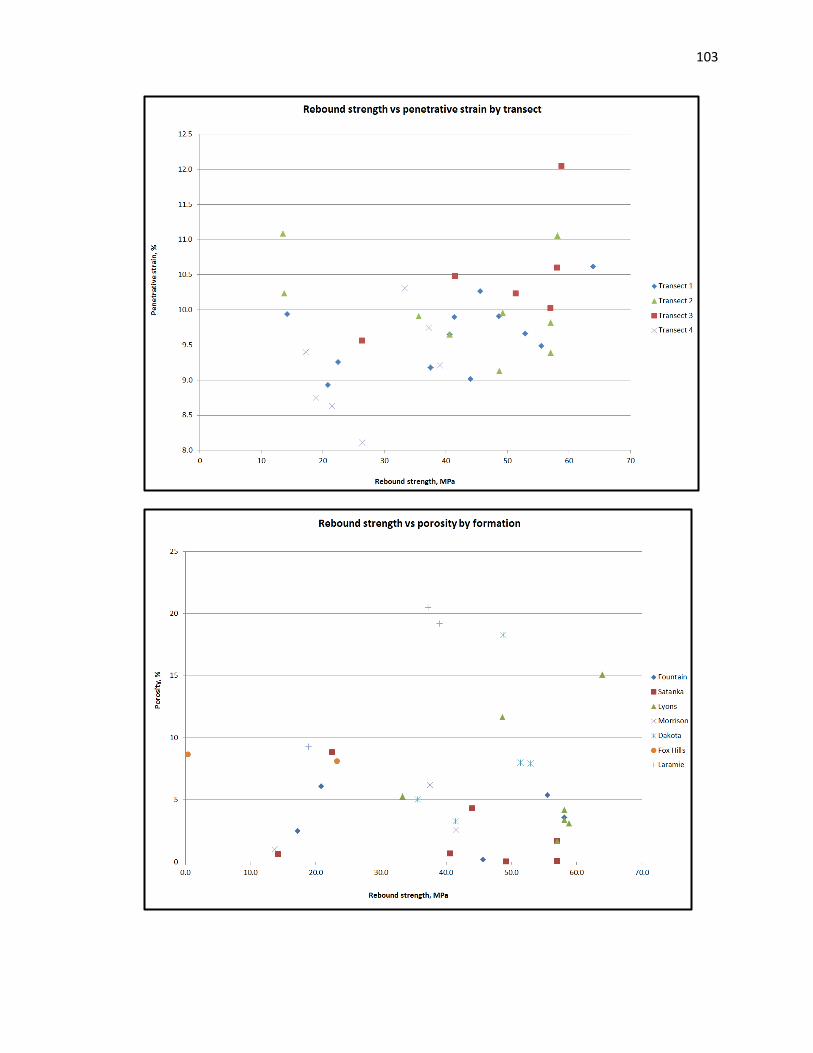
103

104

105