quantified assessment of afis contextual information on
TRANSCRIPT
The author(s) shown below used Federal funds provided by the U.S. Department of Justice and prepared the following final report: Document Title: Quantified Assessment of AFIS Contextual
Information on Accuracy and Reliability of Subsequent Examiner Conclusions
Author: Itiel Dror, Kasey Wertheim Document No.: 235288
Date Received: July 2011 Award Number: 2009-DN-BX-K224 This report has not been published by the U.S. Department of Justice. To provide better customer service, NCJRS has made this Federally-funded grant final report available electronically in addition to traditional paper copies.
Opinions or points of view expressed are those
of the author(s) and do not necessarily reflect the official position or policies of the U.S.
Department of Justice.

233 East Main Street Suite C
Bridgeport, WV 26330 (304) 933-3162 (304) 933-3162
Final Draft Technical ReportFinal Draft Technical Report
Quantified Assessment of AFIS Contextual Information on
Accuracy and Reliability of Subsequent Examiner Conclusions
DoJ/NIJ grant #2009-DN-BX-K224
Itiel Dror and Kasey Wertheim Abstract Experts play a critical role in forensic decision making, even when cognition is offloaded and distributed between human and machine. This is especially noticeable in pattern and impression evidence, when technologies such as Automated Fingerprint Identification Systems (AFIS) have introduced cognitive technology that creates such collaborative environments. In this paper we investigated the impact of using AFIS on human decision makers, specifically examining the potentially biasing effects of AFIS contextual information on human experts. We provided thousands of AFIS lists to 23 latent fingerprint examiners as part of their normal casework. We included the matching print in some of the lists, and manipulated the position of the matching candidate image in the AFIS list (placing it either at the very top, near the top, near the bottom, or at the very bottom), manipulated the scores (increasing or decreasing the ranges across prints), or combined both of these manipulations together. We observed if wrong decisions (false inconclusives or false exclusions) were a function of position or score in the list. The data showed that latent fingerprint examiners were affected by the position especially for lower comparison time, but they were unaffected by the scores of the matching prints. Furthermore, we observed if false identifications were a function of position. The data showed that such erroneous selections were more likely chosen from the top of the list, and that such errors occurred even when the correct match was present further down the list. Our findings show that AFIS affects human examiners, but in some ways more than others (e.g., the ranking affects them while the scores do not affect them as much). These effects need to be studied and considered carefully, so as to optimize human decision making when using technologies such as AFIS.
Contents
1. Abstract............................................................................................................................ 1
2. Introduction...................................................................................................................... 3
3. Method.............................................................................................................................11
4. Results..............................................................................................................................15
5. Conclusions......................................................................................................................44
6. References .......................................................................................................................51
7. Dissemination of Research Finding.................................................................................57
Page 2 out of 60

Introduction
The landscape in forensic science, as in other expert domains (e.g., medicine and policing), is
drastically changing. A main force in shaping these (and future) changes is technology.
Especially influential are new and advanced technologies, cognitive technologies, that can carry
out cognitive operations that were once the sole domain of humans (Dror, 2007a). The increased
use of and reliance upon technology has reached a level whereby humans and technology are
more and more intertwined and collaborating with one another, creating distributed cognition
(Baber, Smith, Cross, Hunter, & McMaster, 2008; Dror & Harnad, 2008a). In distributed
cognition, humans ‘offload’ some cognitive operations onto technology thereby increasing their
performance abilities and capacity (Dror & Harnad, 2008b). As human-technology cooperation
increases, as they become more intertwined and cognition is increasingly distributed, new
opportunities and capabilities arise, as well as new challenges. These have transformed a
technological evolution into a revolution of what is possible, affecting human cognition, and
altering how we go about our professional and personal lives (Dror, 2007b).
Distributed cognition may take different forms and generate a variety of modes of collaboration
and interaction between the human and technology. For instance, Dror & Mnookin (2010)
distinguished between three such modes: In some instances technology merely offers a gain in
efficiency, a quantitative change, rather than qualitatively transforming what is possible (for
example, using a computer to store information rather than memorizing it, or using a calculator
rather the doing the math; in these cases the human expert is using technology to save time and
cognitive resources). A higher level of distributed cognition and cooperation occurs when the
Page 3 out of 60

human and technology work side by side as partners. In this case the technology plays a role that
the human expert is incapable of doing (and vice versa: the human expert plays a role that cannot
be carried out by the technology). Such human-technology partnerships are based on critical and
unique contributions from both the human and the technology, that cannot be simply ‘offloaded’
to the other, and are not a mere matter of convenience and efficiency (for example, a clinical
diagnosis based on an interpretation of an x-ray). In higher levels of technological use, the
technology takes over the more significant and predominate role, leaving the human expert to
operate in its shadow (for example, in breath test detection for alcohol the technological
instrument is making the meaningful judgements to the extent that they basically produce a result
without significant human intervention). For more detail of this taxonomy, see Dror & Mnookin
(2010).
Understanding the potential and limitations of each mode is necessary in order to make optimal
use of both the technological and the human elements in the collaboration. In other words, the
success of human experts and technology working in such close collaborations depends on
correctly distributing the work among them, taking advantage of the relative strength each has to
offer, and avoiding their respective weakness and vulnerabilities (see, for example, in face
recognition, Dror & Shaikh, 2005a, 2005b).
In general, human expertise, by its very cognitive nature, encompasses a paradox: As experts
acquire the cognitive architecture that makes them more effective and efficient, they are also
more susceptible to error. This is a result, for example, of using schemas, selective attention,
chunking information, automaticity, and more reliance on top-down information, all of which
Page 4 out of 60

may make them susceptible to missing and ignoring information, and to suffer from tunnel vision
and bias (for details, see Dror, in press). This paradox is a result of how the brain processes
information, and characterizes experts in medicine, policing, aviation, as well as specifically in
the forensic domain (Busey & Dror, in press).
One of the vulnerabilities of experts, across domains, is that with their superior performance they
are also susceptible to bias and other contextual and emotional influences. This holds true across
expert domains, including forensic fingerprinting (Beatrice & Champod, 2007; Charlton, Fraser-
Mackenzie, & Dror, 2010; Dror, 2009, Dror & Charlton, 2006; Dror, Charlton, & Péron, 2006;
Dror, Peron, Hind, & Charlton, 2005; Dror & Rosenthal, 2008; Hall & Player, 2008;
Langenburg, Champod, & Wertheim, 2009). While interpretations of the research findings do
vary, the studies do clearly and consistently show that biasing effects exist, but may or may not
change decision outcomes depending on a variety of factors and circumstances. As stated in
Langenburg, Champod and Wertheim (2009), “There is strong evidence that some fingerprint
specialists can be biased by contextual information. The decision made by a specialist is not
necessarily based solely on the ridge detail when comparing images” (page 577, in Langenburg
et al., 2009).
It is important to recognize that finding a bias within a decision-making process does not
necessarily mean that the conclusions reached are incorrect, nor that they would necessarily have
been different in the absence of the biasing information or process. As stated in Dror (2009),
“Bias affects the decision making process, but not necessarily the decision outcome. Decision
making models clearly illustrate how bias can shift the objective 'evidentiary weights', but that
Page 5 out of 60

does not mean that every time this shift moves the overall decision outcome past the decision
threshold (for details, see Decision Field Theory (Busemeyer & Townsend, 1993), and
Sequential Sampling Models (Dror, Busemeyer, & Basola, 1999)). Bias may shift the decision in
the same direction as the objective 'evidentiary weights' which have already surpassed the
decision threshold. Furthermore, even when the bias is in the opposite direction of the actual
objective 'evidentiary weights', if this shift does not cause a movement past the decision
threshold, then it will not result in a change in decision outcome. Therefore, the existence of bias
does not necessarily mean that it affects the decision outcome every time it plays a role in the
decision making process” (page 19, in Dror, 2009). However, it is equally important to realize
that if a decision process is shown to be biased in some way, this generates the potential for that
bias to affect decision outcomes in some circumstances, depending on the extent of the bias and
the proximity to the decision threshold.
All the previous studies that have examined bias in forensic science have focused solely on
human examiners and general contextual influences. They have not at all studied or examined
the potential bias introduced by technology. Thus, they do not examine a critical contextual
influence that may affect human decision makers: that which is introduced by technology. The
growing use and role that technology is (and will be) playing in forensic science requires careful
attention and consideration (Dror & Mnookin, 2010). Our study aims to address this gap in the
scientific literature.
A relatively new feature of the latent print identification landscape is the increasing use of
Automated Fingerprint Identification Systems (AFIS). AFIS is a computerized system that
Page 6 out of 60

extracts and stores individual characteristics of digitized fingerprints and can be used to search
unknown fingerprints or partial latent marks against the stored known fingerprints in the
database. AFIS has the ability to store 10's of millions of known fingerprints and to perform an
automated search against that repository in seconds. In criminal cases, an AFIS is often used to
generate possible matches to a latent mark found at a crime scene. The AFIS presents the human
examiner with a set of candidate prints from those contained within the database that, as assessed
by the system’s algorithms, are similar to the latent mark in question. AFIS, with its ability to
find potential matches among millions of exemplars, is an extremely powerful forensic tool.
There has been significant discussion on AFIS’s management, performance and organizational
impact (e.g., Klug, Petersen & Stoney, 1992; Petersen, 1996), but there has been very little
discussion of the effects of AFIS systems on the decision-processes of human examiners (apart
from Dror & Mnookin, 2010). While it was widely recognized and understood that in the latent
fingerprint identification context, AFIS is a tool used by examiners rather than a technique for
making matches – that "Latent examiners make idents, not AFIS" (Komarinski, 2009) – the
examination of AFIS’s potential influences on those comparisons made by the human latent
examiners has been neglected.
It has been suggested that although AFIS is very powerful and has been effective in solving
crimes, it also has introduced potential problems that can lead (and have led) to erroneous
identification (see Dror et al., 2005, Dror, 2007; Dror & Mnookin, 2010). For example, a
contributing factor to the Madrid bomber erroneous identification was the remarkable similarity
of the two prints (Stacey, 2004, OIG, 2006), but the ability to locate these similar prints was a
Page 7 out of 60

direct result of the great power of the AFIS to search tens of millions of prints. One potential
problem is that with the introduction of this new powerful technology, fingerprint comparison by
humans may not have sufficiently changed to meet the technology. Specifically, examiners have
to intuitively use a new threshold for ‘sufficient similarity’ for determining a match when
considering the increased likelihood of seeing two prints from different sources with a high
degree of similarity as a result of searching a large AFIS database (see Dror & Mnookin, 2010).
Davis & Hufnagel (2007) seem to suggest that latent fingerprint analysts might have very
different views about the matches suggested by the AFIS, but not because of contextual biasing
information, which is the focus of this research.
Bias introduced by AFIS has not been studied. However, a study that examines bias on forensic
science notes that “With the growing use of technology in fingerprint identification, some claim
that such human biases and weakness will be reduced, if not eliminated altogether. Although
technology is an important ally in fingerprint matching, the issues addressed in this study [i.e.,
biases], as well as other psychological/cognitive issues, will continue to exist and even increase”
(page 807, in Dror et al., 2005). A theoretical paper on bias and technology in forensic science
makes the point that “the appropriate effects of AFIS on the process of latent fingerprint
identification warrant significant further inquiry and consideration. We believe that AFIS does
change in important ways the cognitive tasks in which latent fingerprint experts are engaged. Our
key point is that there has not yet been sufficient consideration of either the meaning or
consequences of the new distributed cognition that AFIS offers, either the new potentialities, or
the new risks for error. Such understanding will enable better deployment and utilization of this
Page 8 out of 60

technology” (page 8-9, in Dror & Mnookin, 2009). Until now, however, the potential bias
introduced by AFIS has not been empirically studied.
While AFIS makes the scrutiny of large fingerprint databases manageable, thereby offering
advances in both process and productivity, its current design also introduces metadata that may
impact the subsequent human expert comparison. These data are subject to being controlled by
process and workflow design. With the growing use of AFIS, it becomes important to understand
how AFIS may affect human fingerprint examiners. Our study scientifically and empirically
examines how contextual information provided by AFIS may affect the human examiner.
Specifically, AFIS systems presently return results to examiners in a ranked order. The primary
focus of this study is to examine whether there are decision effects or bias introduced by this
ranking. This paper takes a step toward the empirical investigation of the effects of distributing
cognition between the human and the AFIS within latent fingerprint examination.
The study reported here is specifically aimed at examining these issues scientifically and
empirically, and examining whether the data support any recommendations to minimize any
potential biases. This experimental study is designed to detect and quantify the potential
influence that the AFIS ranking and scoring has on the human experts’ perception and cognition
that may bias their decision making process. The conclusions from such empirical studies should
be used to develop suggestions for best practices and proper ways to use AFIS technology so as
to maintain its benefits while reducing any potential vulnerability that it may introduce. Our
experimental design entails changing the ranking and scoring provided by AFIS; that is, for
Page 9 out of 60

example, taking the ‘top candidate’ in the list, and placing it at the bottom of the list, then
observing if the print’s position in the list affected how it was judged by the human examiner.
Psychological and cognitive research have demonstrated a general bias towards the first choice,
even when the order of choices are random (Mantonakis, Rodero, Lesschaeve, & Hastie, 2009;
MacFie, Bratchell, Greenhoff, & Vallis 1989; Becker, 1954; Carney & Banaji, 2008; Miller &
Krosnick, 1998; Berg, Filipello, Hinreiner, & Sawyer, 1955; Coney, 1977; Dean, 1980; Sulmont-
Rosse, Chabanet, Issanchou, & Köster, 2008). AFIS’s ranking of potential matches, along with
the general already existing bias for the first choice, may work together to influence and affect
the perception and judgements of human examiners when they conduct a comparison generated
by AFIS.
In addition to the ranking, AFIS also provides numerical scores that are higher as the candidate is
considered more likely to be a match. As with the ranking, the score may influence and bias the
human decision making. Therefore, our study included three experiments:
Experiment 1: Manipulating the ranking of an AFIS list
Experiment 2: Manipulating the scores in an AFIS list
Experiment 3: Manipulating the ranking and the scroes in an AFIS list.
Methods Experiment 1:
Participants. We used only latent print experts, all of whom do casework as examiners in
forensic laboratories. The 23 examiners used in this study were all experienced examiners that
Page 10 out of 60

were qualified to do latent fingerprint comparison and to appear as experts in courts. Nearly half
of them (n= 11) were Certified Latent Print Examiners (CLPEs) by the International Association
for Identification (IAI). Fourteen were male and 9 were female.
Materials. Prints of high quality are less likely to create interpretive problems for examiners;
indeed, contextual influences and bias have more pronounced affect with degraded images (e.g.,
Dror et al., 2005). Therefore, we used only latent marks of medium and low quality. We used
160 latent marks and their corresponding prints that matched. We obtained an AFIS candidate
list by using the National Institute of Standards and Technology (NIST) dataset that contains
over 3,000 known tenprint files and NIST AFIS search algorithms. For half the latents we
generated a list of 10 candidates and for the other half a 20 candidate list. All fingerprint images
were captured in standard formats and resolutions; 500ppi wsq tenprints and 1000ppi .bmp latent
mark images.
We then inserted the correct matching print into some of the AFIS lists but not others. When we
inserted the match print into the list, we inserted it at or near the top of the list (either as
candidate number 1; or near but not at the top (number 2 in the 10 candidate list or number 3 in
the 20 candidate list); or at or near the bottom: (either as the last candidate; or low on the list, as
number 8 in 10-candidate list and number 15 in the 20-candidate list). We thereby produced five
different AFIS lists for each of the 160 latent marks:
1. With no matching print
2. Matching print at the very top of the list (candidate number 1).
Page 11 out of 60
3. Matching print high on the list (candidate number 2 or 3, for lists of 10 and 20
candidates, respectively).
4. Matching print low on the list (candidate number 8 or 15, for lists of 10 and 20
candidates, respectively).
5. Matching print at the very bottom of the list (candidate number 10 or 20, for lists of 10
and 20 candidates, respectively).
Procedure. Participants conducted comparisons in this study as part of their normal routine
work, not knowing they were taking part in a study. This is critically important, as participants’
awareness that they are taking part in a study affects their behaviour, especially in studies that
examine bias (Dror, 2009; Dror et al. 2006a, 2006b, 2008). All comparisons were conducted
using a Web-based Remote Examination (WebRex) software that allows the examiners to
remotely log in and securely conduct comparisons. This environment is especially suited for our
study, as it enables us to manipulate information sent to the practitioners within their normal
every day work, and without their knowledge. It is critical to test examiners in their day to day
routine work rather than using a contrived experimental setup. This experimental design means
that we can draw conclusions about real casework, as the examiners participating in the study are
engaging in what they believe to be casework. This is especially essential for studies that
examine the effects of context; if the participants know they are taking part in a study, then they
do not actually believe the context and therefore its effect is diminished (if not eliminated
altogether).
Page 12 out of 60

Participants randomly were assigned different lists associated to the same latent mark. That is,
for each of the 160 latent marks, some examiners received an AFIS list that contained the
matching print as the first print (number 1) on the AFIS list, other examiners received an AFIS
list in which the matching print was second in the list (number 2 or 3, depending on the length of
the list), other examiners got an AFIS list in which it was located just before the very bottom of
the list (number 8 or 15, depending on the length of the list), and for other examiners it was
located at the very bottom of the list (number 10 or 20, again, depending on the length of the
list). Finally, most examiners got an AFIS list that did not contain the correct matching print
anywhere on the list (to maintain ecological validity we needed to make sure most lists did not
have a match, as examiners searching AFIS in real casework do not find matches most of the
time). The AFIS lists were distributed and counterbalanced across examiners.
This experimental design enabled us to collect data regarding how latent print experts examine
AFIS lists. We could examine if the position of the print in the list affected their decision
making, and if so, in what ways. Our data permitted us to compare differences in performance, if
any, on the same latent mark when it was presented at different positions on the AFIS list. We
were interested both in the effect of position on the decision making process, if any, as reflected
by the time it took examiners to reach a conclusion, as well as the decision outcome itself, as
reflected by their actual conclusion (see the Introduction and Dror (2009) for important cognitive
distinction between effects on the decision process and effects on ultimate conclusion). For each
of the AFIS lists, the examiners were required to make comparisons on each and every print in
the list, and for each one to reach a conclusion of identification, exclusion, or inconclusive.
Page 13 out of 60

Each examiner conducted 2,400 separate comparisons: 160 latents, each with an AFIS list (half
of which were 10-candidate lists and half were 20-candidate lists). Overall, this study includes
data from 55,200 separate comparisons across the 23 latent fingerprint examiners that took part
in the study.
Experiment 2:
Experiment 2 follows the design of Experiment 1. Therefore, to save repetition, we only specify
here the differences from experiment 1.
Experiment 2 used a new set of prints, both latents and new AFIS list, but the format and design
was identical to Experiment 1.
Once the AFIS list were generated, rather than changing the order of the prints on the AFIS list
(as we did in Experiment 1), in Experiment 2 we changed the original scores provided by AFIS.
We either made the original range of scores larger or smaller, thereby enableing us to examine if
the scores affected the human examiners. If they did not, then regardless of the scores (large
range vs. smaller range) the human examiners would conduct their examination the same.
However, if the scores did affect the human examiners, then we would observe these effects and
see that they are stronger in the large range condition.
Experiment 3:
In Experiments 1 and 2 we manipulated and tested a single variable, either the ranking
(Experiment 1) or the scores (Experiment 2). This allowed us to isolate and separately
Page 14 out of 60

understand these factors. In Experiment 3 we examine their combined effects and possible
interactions.
The experimental design of Experiments 1 and 2 was maintained in Experiment 3, except that a
new set of prints and AFIS lists were used. The experimental manipulations were a combination
of those implied in Experiment 1 and 2 (see above for details).
Results
Experiment 1:
The data we obtained in this study is rich in information, and we subjected it systematically to
statistical analysis based on the research questions and experimental designed we employed. Our
analysis had to distinguish between AFIS lists that did not contain the matching print and those
which did, as our experimental design and manipulation included placing the correct matching
print at different positions in the AFIS lists for those lists that included the matched print. On the
correct print, an error of false positive was not possible; either the examiner would reach the
correct conclusion, or might erroneously judge the print inconclusive or a false exclusion. On
non-matching prints, judgements could either be correct exclusions, or incorrect determinations
of a match (or inconclusive). Our analysis examined not only the response but also the response
time - how long the examiner took to reach a conclusion. Response times (comparison time)
were analyzed to gain insight into the decision making process, whereas Errors were analyzed to
examine the outcome of the decision making process.
Page 15 out of 60
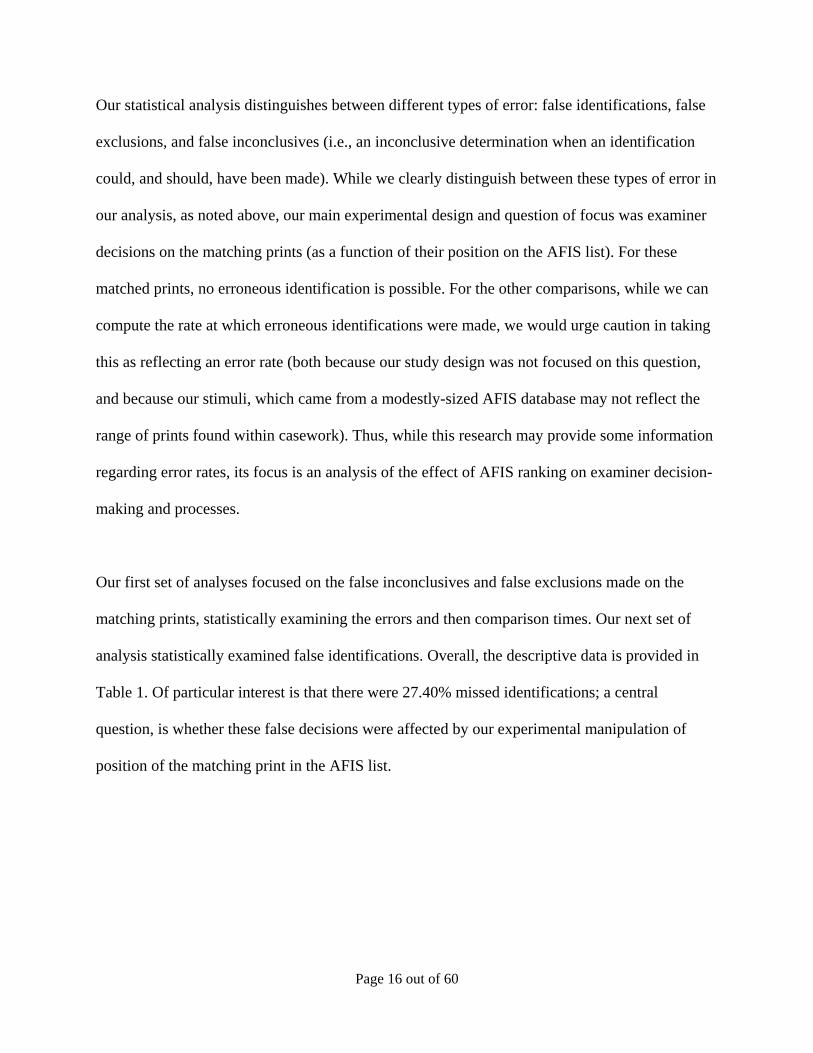
Our statistical analysis distinguishes between different types of error: false identifications, false
exclusions, and false inconclusives (i.e., an inconclusive determination when an identification
could, and should, have been made). While we clearly distinguish between these types of error in
our analysis, as noted above, our main experimental design and question of focus was examiner
decisions on the matching prints (as a function of their position on the AFIS list). For these
matched prints, no erroneous identification is possible. For the other comparisons, while we can
compute the rate at which erroneous identifications were made, we would urge caution in taking
this as reflecting an error rate (both because our study design was not focused on this question,
and because our stimuli, which came from a modestly-sized AFIS database may not reflect the
range of prints found within casework). Thus, while this research may provide some information
regarding error rates, its focus is an analysis of the effect of AFIS ranking on examiner decision-
making and processes.
Our first set of analyses focused on the false inconclusives and false exclusions made on the
matching prints, statistically examining the errors and then comparison times. Our next set of
analysis statistically examined false identifications. Overall, the descriptive data is provided in
Table 1. Of particular interest is that there were 27.40% missed identifications; a central
question, is whether these false decisions were affected by our experimental manipulation of
position of the matching print in the AFIS list.
Page 16 out of 60
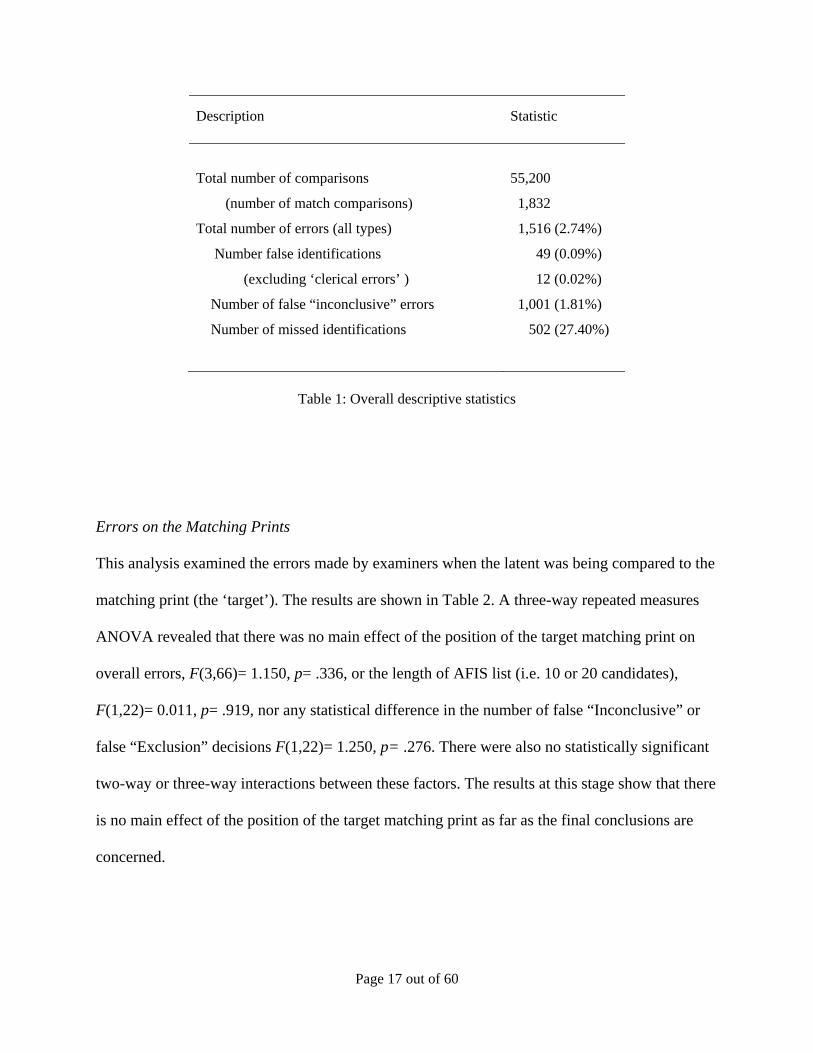
Description Statistic
Total number of comparisons
55,200
(number of match comparisons) 1,832
Total number of errors (all types) 1,516 (2.74%)
Number false identifications 49 (0.09%)
(excluding ‘clerical errors’ ) 12 (0.02%)
Number of false “inconclusive” errors 1,001 (1.81%)
Number of missed identifications 502 (27.40%)
Table 1: Overall descriptive statistics
Errors on the Matching Prints
This analysis examined the errors made by examiners when the latent was being compared to the
matching print (the ‘target’). The results are shown in Table 2. A three-way repeated measures
ANOVA revealed that there was no main effect of the position of the target matching print on
overall errors, F(3,66)= 1.150, p= .336, or the length of AFIS list (i.e. 10 or 20 candidates),
F(1,22)= 0.011, p= .919, nor any statistical difference in the number of false “Inconclusive” or
false “Exclusion” decisions F(1,22)= 1.250, p= .276. There were also no statistically significant
two-way or three-way interactions between these factors. The results at this stage show that there
is no main effect of the position of the target matching print as far as the final conclusions are
concerned.
Page 17 out of 60

Candidate Position of the Matching Target Print
Set size Error Bottom Low High Top
10 False “Inconclusive” 9.87% 14.47% 13.82% 10.48%
10 False “Exclusion” 13.82% 15.79% 17.11% 15.28%
20 False “Inconclusive” 12.50% 16.45% 10.53% 13.64%
20 False “Exclusion” 16.45% 15.79% 15.13% 12.99%
All Total Errors 26.32% 31.25% 28.30% 26.20%
Table 2: Errors as a function of the position of the matching print
Response Times on the Matching Prints
Response time is a critical measure for examining cognitive processing. It is more sensitive and
provides more cognitive insights than overall error. We started off with an analysis to examine if
the time spent on a comparison determined the likelihood of error. Specifically, we statistically
examined if a longer time spent by a given examiner comparing the latent mark to a matching
print reduces the likelihood of making an error. A logistic regression showed that the log1 of the
comparison time significantly predicted the likelihood of making an error X2(1, N = 1832)=
101.28, p< .001. The analysis provides a significantly negative coefficient (logRT= -0.477, Std.
Error=.049, z= -9.69, p< .001), meaning that as the (log of) the comparison time decreased, the
likelihood of an error is increased. This reflects a speed-accuracy trade-off. While it is not
necessarily true that spending extra time than usual would reduce errors, if an individual makes a
quicker decision than they need to perform at their optimum, extra errors may occur. Of course,
our data simply shows a correlation between comparison time and error rates, and we cannot
confidently conclude causality without further research.
1 The log of the comparison time was used to reduce the skewed distribution of the RT data, normalizing the data.
Page 18 out of 60

The second analysis of the comparison times was to determine whether the position of the target
matching print (which was the main manipulation in this study) influenced the length of the
comparison. If position did affect the examiners expectations and biased their comparison, then
that will be reflected in the data as a statistically different decision time as a function of the
position of the print in the AFIS list (i.e. Top, High, Low, or Bottom of the list).
A two-way repeated-measures ANOVA of the position of the target matching print (Top, High,
Low, or Bottom) and AFIS list length (10 or 20 candidates) was performed on the log of the time
spent on each comparison (see Figure 1). The response times for the Bottom position was
artificially higher than it should have been if it only included the comparison time, because
examiners at the end had to press additional buttons to finalize and submit the batch. The study
design did not permit us to distinguish ‘examination’ time from this finalization time, so the
response time for the Bottom position is inclusive of both. Nevertheless, even with this artificial
confound, the results showed that there was a significant statistical effect of target position on the
comparison time of the target matching print, F(3,63)= 18.59, p< .001.
Page 19 out of 60

Figure 1: The effect of the position of the target matching print on average comparison times for the 10- and 20-length AFIS lists. The times for the Bottom position were artificially higher, as examiners had to finalize the batch.
As illustrated in Figure 1, the top position comparison times is much greater than the comparison
times of all the other positions. Indeed, Bonferroni t-tests revealed this to be true and that when
the target was present in the top position (i.e. number 1) examiners spent significantly longer
comparing the print than when it appeared lower in the list (p< .001 for the Top vs. High
comparison, p< .001 for the Top vs. Low comparison, and p< .05 for the Top vs. Bottom
comparison which included the additional artificial time, which made the Bottom vs. Low
comparison significant p< .05). Furthermore, there was a significant effect of length of list on
decision times, F(1,16) = 14.81, p= 0.001, reflecting that examiners took on average, per
comparison, more time to consider the target matching candidates when the AFIS list length was
10 compared to when it was 20. There was no interaction between the list length and the
candidate position on comparison times F(3,66)= 0.291, p= .832.
Page 20 out of 60
The results of this analysis are important in light of the data linking comparison time and error
rates. Although the result of the analysis of the position of the target matching print candidate on
error rates was not significant, the comparison time showed an effect. Accordingly, it is
necessary to consider whether the effects of the position on error rate may depend on the time
spent on the comparison.
In order to test for this potential effect, a logistic regression was performed on the comparison
with the target matching print. This calculated the likelihood of an error being made as a function
of the matching print candidate position and the time spent on the comparison. Because the main
effect of position on comparison time (Figure 1) was the top position (number 1) we collapsed
the data into two groups; Top (the target was in position “Top”) and Lower (the target was in
position “High”, “Low”, or “Bottom”).
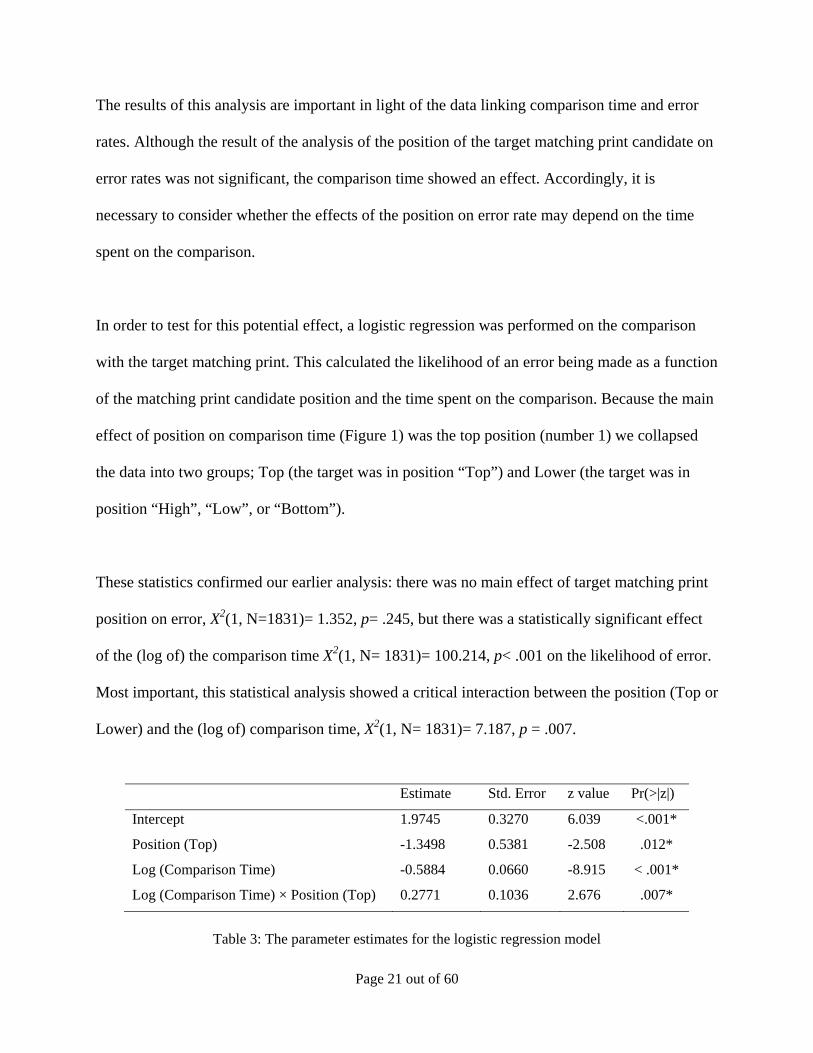
These statistics confirmed our earlier analysis: there was no main effect of target matching print
position on error, X2(1, N=1831)= 1.352, p= .245, but there was a statistically significant effect
of the (log of) the comparison time X2(1, N= 1831)= 100.214, p< .001 on the likelihood of error.
Most important, this statistical analysis showed a critical interaction between the position (Top or
Lower) and the (log of) comparison time, X2(1, N= 1831)= 7.187, p = .007.
Estimate Std. Error z value Pr(>|z|)
Intercept 1.9745 0.3270 6.039 <.001*
Position (Top) -1.3498 0.5381 -2.508 .012*
Log (Comparison Time) -0.5884 0.0660 -8.915 < .001*
Log (Comparison Time) × Position (Top) 0.2771 0.1036 2.676 .007*
Table 3: The parameter estimates for the logistic regression model
Page 21 out of 60

This is very crucial because it means that the interaction parameter estimates from the model
(Table 3) indicate that as comparison time decreases there is a stronger effect of position on error
rates. Specifically, when the target is in a position other than the top position, the examiners were
more likely to make an error if they have decreased their comparison time. By contrast, when the
examiners took a longer time for the comparison, the effect of the position of the candidate had
less of an effect on error rates. In the Discussion section we consider whether such shorter
comparison times reflect reduced effort and motivation in the decision making process, or reflect
the use of different cognitive mechanisms and processes of attention (Carney & Banaji, 2008;
Miller & Krosnick, 1998; Sulmont-Rosse, Chabanet, Issanchou, & Köster, 2008).
Figure 2 shows the results of the logistic regression analysis by plotting the model predictions of
the log of the comparison time for trials in which the target matching print is at the top of the list
compared to when it is elsewhere in the list of candidates.
Figure 2: The logistic regression model estimates of the effect of comparison times on error probabilities when the target appears at the top of the list vs. at lower positions.
Page 22 out of 60
As illustrated in Figure 2, the greatest effect of the position of the target is found when the
examiner takes a short time for the comparison. When the examiner takes a longer time to do a
comparison, the effect of the position is diminished. Accordingly, in contrast to the preliminary
analyses regarding error rates and target position, these results demonstrate that the position of
the target does influence error rates but that this effect is dependent on the comparison time.
Specifically, the regression estimates that the strongest effect is when the comparison time is
quicker.
False Identifications
Erroneous identifications are very much a function of the relative similarity between the latent
mark and the compared non-matching print; the greater the similarity between two, the more
they are ‘look alike’, the greater the chances of an erroneous identification. We obtained the non-
matching prints from a relatively very small database of just over 3,000 tenprints, and hence
there may have been a very small number of ‘look alike’ non-matching prints in our study.
Furthermore, when examining a number of prints off a list provided by AFIS (on average, 15
comparisons per latent, in our study), the potential rate of erroneous identifications is drastically
reduced, because the maximum number of identifications per list is 1 (that was used as a
criterion for excluding some of the erroneous identifications as ‘clerical errors’ --see below). If
an examiner made an erroneous identification on every single list, that would give a maximum,
false identification rate of 6.7% (1 out of each 15 comparisons). We elaborate on these issues in
the Discussion section, but remind the reader that the research questions and experimental design
of this study was to examine the contextual biasing effect of the ranking that the AFIS
Page 23 out of 60
technology provides, and our analysis (below) on false identification maintains this research
focus.
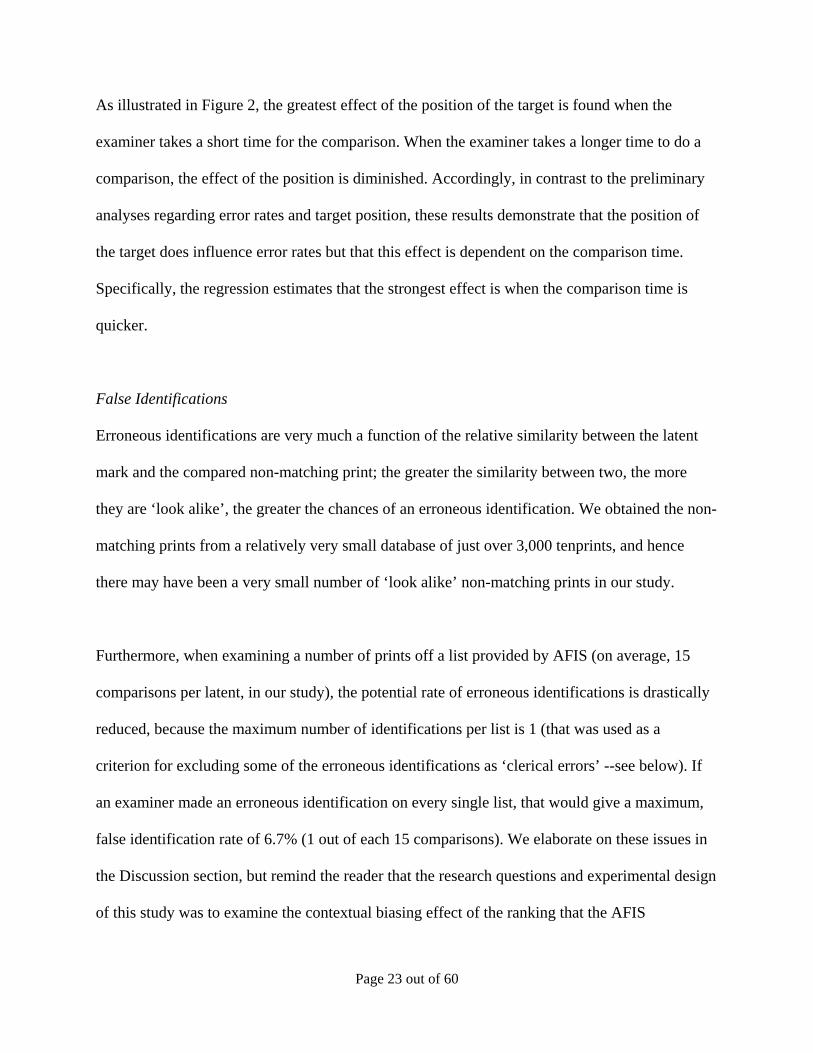
Figure 3: False Identifications, as a function of position in the AFIS list, for both ‘match present’ and ‘match absent’ lists, in AFIS lists with 10 and 20 candidate prints.
As illustrated in Figure 3, the distributions of false identifications are centered on the upper
positions of the AFIS list (numbers 1 & 2). Indeed, logistic regression analyses revealed that
candidate position was significantly predictive of whether a choice was a false identification or
not for both length of AFIS lists; for 10 candidate lists, X2(1, N = 18380)=35.41, p< .001, and for
20 candidate lists, X2(1, N = 36840)= 44.17, p< .001.
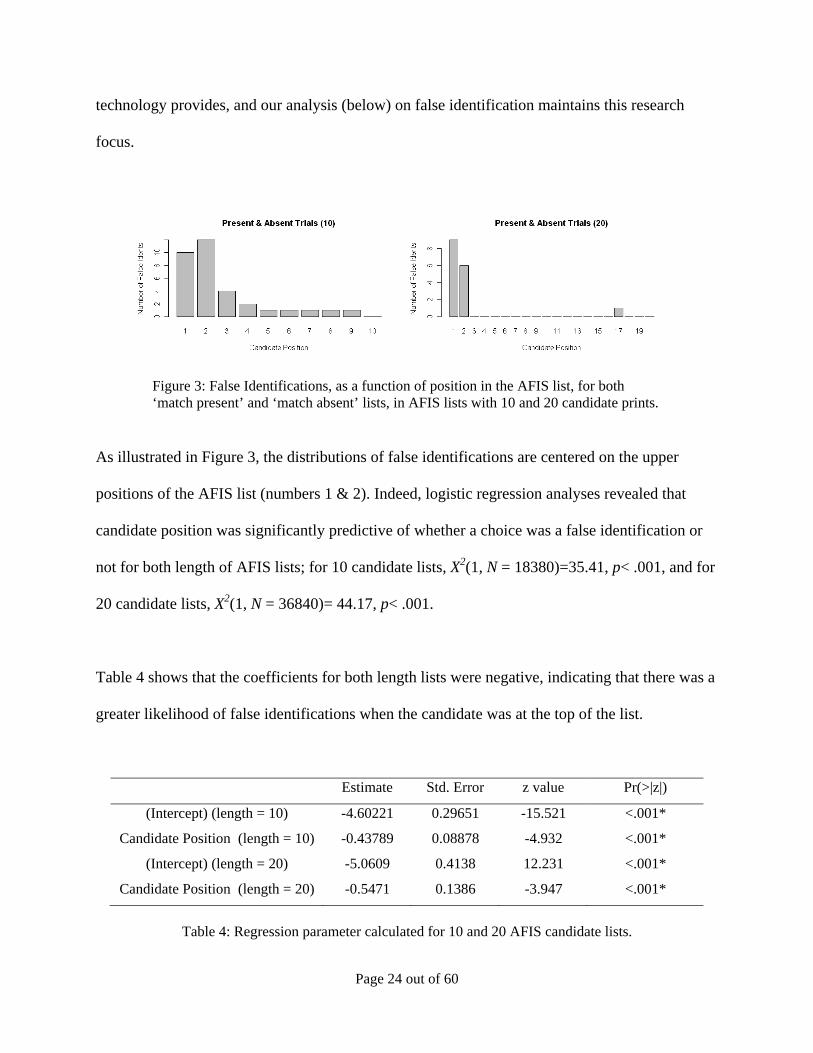
Table 4 shows that the coefficients for both length lists were negative, indicating that there was a
greater likelihood of false identifications when the candidate was at the top of the list.
Estimate Std. Error z value Pr(>|z|)
(Intercept) (length = 10) -4.60221 0.29651 -15.521 <.001*
Candidate Position (length = 10) -0.43789 0.08878 -4.932 <.001*
(Intercept) (length = 20) -5.0609 0.4138 12.231 <.001*
Candidate Position (length = 20) -0.5471 0.1386 -3.947 <.001*
Table 4: Regression parameter calculated for 10 and 20 AFIS candidate lists.
Page 24 out of 60
However, the data above relates to false identifications, regardless of whether they occur within a
list that contained the real matching print, or within a list that did not include the matching print.
In theory if a false identification occurs within a list that does not contain the matching print, the
print identified (as false as it is) may be the most similar to the latent from the entire set of prints
in the list. In this circumstance, the false identification may not be the result of the print’s
position on the AFIS list, but rather a reflection of its relative similarity to the latent. The
examiner may have incorrectly concluded that the prints matched, but correctly selected the print
with the highest degree of similarity to the latent mark, without necessarily being effected by its
position within the AFIS list. However, when a false identification occurs when the real
matching print is present, but lower in the list, then such an error reflects a bias introduced by the
position, as the examiner has selected a print higher in the list, while missing the correct
identification present in a lower position2.
The above results include both errors made on lists that included the actual matching print, and
errors made on lists that did not include the match. We therefore conducted further analysis to
focus on false identifications which occurred only within lists that included the matching print.
This focus also tests a critical issue of this research, i.e., whether the matching print might be
more likely to be missed if it is positioned lower down the AFIS list. The results of this analysis,
illustrated in Figure 4, show that even in these lists, false identifications were concentrated at
2 Some jurisdictions have procedures that allow examiners to stop doing comparisons after they find an identification in an AFIS list. However, the examiners in our study were working within procedures that required them to conduct comparisons with all the candidates in the list, i.e., even if they found a match, they were obligated to finish all comparisons on the list.
Page 25 out of 60

higher candidate positions (but this effect was more pronounced in the longer, 20-candidate, lists,
where false identifications were only made in the first and second candidate positions).
Figure 4: The number of false identifications in AFIS lists that contained the real matching print, for lists of 10 and 20 candidates.
Table 5 shows the parameter of the logistic regression model. The results showed that for list
length of 10, candidate position with a trend for statistical significance, X2(1, N = 9140)= 2.93,
p= .087, and for list length of 20, the candidate position was significant X2(1, N = 18360)= 16,34,
p< .001. These analyses show that false identifications tend to be made in high candidate
positions. This clearly demonstrates that examiners making use of AFIS technology can result in
false identifications even when the real matching print is present in the same list, as long as it is
in a lower position in the list. Indeed, in all four of the false identifications made in the 20-
candidate lists, the actual matching print was lower down the list than the candidate that was
falsely identified as matching.
Estimate Std. Error z value Pr(>|z|)
(Intercept) (length = 10) -5.7297 0.5127 11.175 <.001*
Candidate Position (length = 10) -0.1713 0.1037 -1.652 .099
(Intercept) (length = 20) -4.7389 1.0013 4.733 <.001*
Candidate Position (length = 20) -1.0997 0.5778 -1.903 <.001*
Table 5: Regression parameter calculated only for lists that contained the real matching print, for 10 and 20 AFIS candidate lists.
Page 26 out of 60

Our analyses above included 49 erroneous identifications. However, some of these may have
included errors that may appropriately be classified as ‘clerical errors’. At least arguably, errors
that are the result of ‘clerical’ mistakes should be excluded from the data set. However, such a
step is problematic and can be questioned and criticized. For example, Wertheim, Langenburg,
and Moenssens (2006) reported an error rate of 1.041% but classified almost all the errors
(1.007%) as “clerical” mistakes, and only 0.034% of errors were classified and attributed as
actual erroneous identification judgements. In an examination of that study, Cole (2006)
questions their exclusion of errors as “clerical” mistakes.
There are several issues surrounding exclusion of data as ‘clerical’ mistakes. First, how should a
clerical error be defined or identified? Furthermore, even if some false identifications are indeed
‘clerical errors’, does this automatically justify exclusion? It may well be that such clerical errors
are a result of not paying attention; however, this reduced attention may itself be caused by bias,
such as, for example, a general cognitive bias to prefer the first choice (Sulmont-Rosse,
Chabanet, Issanchou, & Köster, 2008; Carney & Banaji, 2008; Miller & Krosnick, 1998), or a
specific bias relating to AFIS-induced expectation and motivation associated with comparisons
of prints at different positions on the AFIS list; or possibly a combination of both --the exact
topic and focus of this research. Therefore, one must exercise extreme caution in excluding data.
Nevertheless, including data that does not reflect the cognitive processes one is investigating
may taint the results and interpretation of the entire study.
Page 27 out of 60

Given this quandary, we decided to include two analyses. The first, reported above, included all
the false identifications. The second, reported below, excluded the false identification that were
potentially ‘clerical’ in nature, resulting in excluding 37 of the 49 false identifications, giving a
false identification error rate of 0.02%. As our criterion for ‘clerical error,’ we excluded any false
positive errors on lists where the examiner reported more than one identification within the same
list. Examiners knew that in principle any list could not contain more than one matching print; so
in those instances when they indicated two (or more) matching prints, this reveals a process
mistake that can, at least arguably, be deemed likely to be ‘clerical’ in nature. From discussions
with examiners, the likely cause of this scenario was double or triple clicking on a conclusion
button, or getting in the mode of clicking the wrong button (Ident when Exclusion was intended).
Using this criterion eliminated 37 of the 49 false identifications from our totals. With the new
data set, now only with 12 false identifications rather than 49, we were interested to examine, as
we did before, their positions in the AFIS lists. Figure 5 clearly illustrates that false
identifications were still centered at the upper positions of the lists (1 & 2).
Figure 5: False Identifications (excluding potential ‘clerical errors’), as a function of position in the AFIS list, for both ‘match present’ and ‘match absent’ lists, in AFIS list with 10 and 20 candidate prints
Page 28 out of 60

Logistic regression analyses (shown in Table 6) further confirmed our findings: it revealed that
candidate position was significantly predictive of whether a choice was a false identification or
not for the 10 candidate lists, and a trend for statistical significance in the 20 candidate lists. The
coefficients for both lengths of AFIS lists (10 and 20) were negative, indicating that there was a
greater likelihood of false identifications when the candidate was at the top of the list.
Estimate Std. Error z value Pr(>|z|)
(Intercept) (length = 10) -4.737 0.708 -6.687 <.001*
Candidate Position (length = 10) -1.010 0.409 -2.691 .007*
(Intercept) (length = 20) -7.576 0.793 -9.557 <.001*
Candidate Position (length = 20) -0.209 0.123 -1.697 .090
Table 6: Regression parameter calculated for 10 and 20 AFIS candidate lists (excluding potential ‘clerical errors’).
As before, we wanted to conduct an analysis when false identifications were made in lists that
contained the real matching print (see Figure 6).
Page 29 out of 60

Figure 6: The number of false identifications made in lists that contained the real matching print (excluding potential ‘clerical errors’). There were no such errors in the 20-candidate lists, the data in the figure are from the 10-candidate lists.
Estimate Std. Error z value Pr(>|z|)
(Intercept) (length = 10) -5.313 1.084 -4.804 <.001*
Candidate Position (length = 10) -0.915 0.550 -1.665 .100
Table 7: Regression parameter calculated for the 10 AFIS candidate lists that included the real matching print (excluding potential ‘clerical errors’).
Although Table 7 shows that the candidate position is not quite significant, this may be the result
of the low number of false identifications and therefore lack of statistical power. Nevertheless
the fact is that false identifications were only made in the upper candidate positions when the real
matching prints was present lower in the list. This, combined with our earlier analysis of all of
the false positive errors, clearly suggests that AFIS and its design may influence the human
examiner to make a false identification, even when the real matching print is present in the list,
as long as it is in a lower position.
The important and consistent result is that in both analyses, with and without the potential
‘clerical errors’, the position in the AFIS list played a critical contributing role in the way
examiners conduct their comparisons and conclusions. It can be argued that those candidates in
the more upper positions are more similar to the latent, and that drives the error, not the position
in the list, per se. However, our analysis of the lists that contained the real matching print
dismisses such a claim: if the actual similarity was driving the false identifications and there was
no effect based on the position within AFIS, then errors of identification would only be apparent
Page 30 out of 60

in the lists that did not contain the real matching print. We consider this and other conclusions in
the Discussion below.
Experiment 2:
All Comparisons
Target Present Lists
Comparisons N % N %
Total Comparisons 55200 100.0% 18360 100.0% Matching Comparisons 1224 2.2% 1224 6.7% Non Matching Comparisons 53976 97.8% 17136 93.3% Performance Correct 53627 97.2% 17486 95.2% Incorrect 1130 2.0% 444 2.4% Pending 443 0.8% 430 2.3% Errors False Identifications 31 0.1% 10 0.1% False Inconclusive 795 1.4% 130 0.7% Miss 304 0.6% 304 1.7% Pending 443 0.8% 430 2.3%
Table 8. Descriptive statistics for the entire dataset (all trials)
Page 31 out of 60

Match Comparisons
Non Match Comparisons
N % N % Total Comparisons 1224 100.0% 17136 100.0% Matching Comparisons 1224 100.0% 0 0.0% Non Matching Comparisons 0 0.0% 17136 100.0% Performance Correct 918 75.0% 16568 96.7% Incorrect 204 16.7% 140 0.8% Pending 2 0.2% 428 2.5% Errors False Identifications 0 0.0% 10 0.1% False Inconclusive 0 0.0% 130 0.8% Miss 304 24.8% 0 0.0% Pending 2 0.2% 428 2.5%
Table 9. Descriptive Statistics for target matching and non matching comparisons
Miss Errors
The first analysis examined the likelihood of a target being missed (either through a “non ident”
or an “inconclusive” decision) when compared. Because the analysis only includes those
situations in which the prints being compared do match, there are only two choice outcomes
correct (correct), or incorrect (miss). Figure 7 shows the effects of the conditions on the
percentage of errors made during matching comparisons (miss errors) The top left panel shows
the effect of the order condition manipulation. When the order was reordered, a random image
was placed against with a score and hence the ranking should be unrelated to the actual image
being compared. Logistic regression analysis revealed that the order conditions significantly
predicted miss errors, X2(1, N = 1222)= 8.30, p< .004. The model coefficient means that there
Page 32 out of 60

were more miss errors than when the order was kept (Order-Reordered coefficient = 0.383, Std.
Error=.133, z= 2.87, p=.004).
The top right panel of Figure 7 shows the score spread manipulation. Spreading of the scores was
a way of manipulating the score so there were some artificially high scoring candidates. When
the scores were spread apart, the highest score would be higher and the lower scores would be
lower. It was hypothesized that if examiners may be more likely to erroneously identify high
scores if they were artificially raised. The mean score for the when the scores were spread for
each target was 2902.4 (SD = 1631.4), whereas the mean score when the scores were left as
normal was 15579.8 (SD = 563.1). However, the score conditions did not result in any main
effect on the likelihood of miss errors, X2(1, N = 1222)= 1.753, p=.186, (Score-Spread
coefficient = -.175, Std. Error=.133, z= -1.323, p=.186).
Page 33 out of 60

Figure 7. The effect of the order condition (upper left panel), score condition (upper right panel), list length condition (lower left panel) and the time spent making the comparison (lower left panel) as main effects on miss errors.
The bottom left panel shows the list length condition, whereby some lists contained 20
alternatives and others contained just 10. There was no main effect of the number of candidates
in the list (i.e. 10-length lists versus 20-length lists) on the number of miss errors, X2(1, N =
1222)= .089, p=.766, (List-20 coefficient = -.039, Std. Error=.132, p=.766). However, there was
an effect of the mean amount of time spent3 during a single target matching comparison on the
likelihood that that comparison would be missed, X2(1, N = 1222)= 99.527, p<.001. The model
estimates are shown in figure 1 lower panel, whereby the likelihood of error is high when the
examiner only examines the prints for a short time but the likelihood reduces to a low likelihood 3 For modeling purposes the log of the candidate view time was used to distribute values more evenly along the scale.
Page 34 out of 60

of error as the examination time increases (log(Examination Time) coefficient = -.609, Std. Error
=.065, z=-9.430,p<.001). Furthermore, there was a significant interaction between the order
condition and the time spent comparing matching prints on the likelihood of error. The
coefficient for the interaction term suggests that in cases in which the order has been reordered
the effect of the comparison time is stronger than when the order had been kept. However, an
effect of the order being reordered was that the mean score for the matching prints was different.
For the order kept condition the mean score was 2936.3 (SD=1489.1), whereas for the order
reordered the mean score was 1539.1 (SD = 807.5). Accordingly, the interaction seems to
suggest that when the score for the matching print was high then the effect of the comparison
time was less pronounced, presumably as the examiners tended to defer to the score.
Coef Std. Error z
value
P
Intercept 0.379 0.619 0.612 .540
Order-Reordered 2.263 0.745 3.037 .002 *
Log (Comparison Time) -0.313 0.115 -2.722 .006 *
Order-Reordered × Log (Comparison
Time)
-0.430 0.144 -2.995 .003 *
Table 10. The effect of the order condition, comparison time, and interaction on miss errors
This was confirmed by a further analysis comparing the score of matching print being compared
and the comparison time. The results in Table 11 show that a higher score is linked with a
Page 35 out of 60
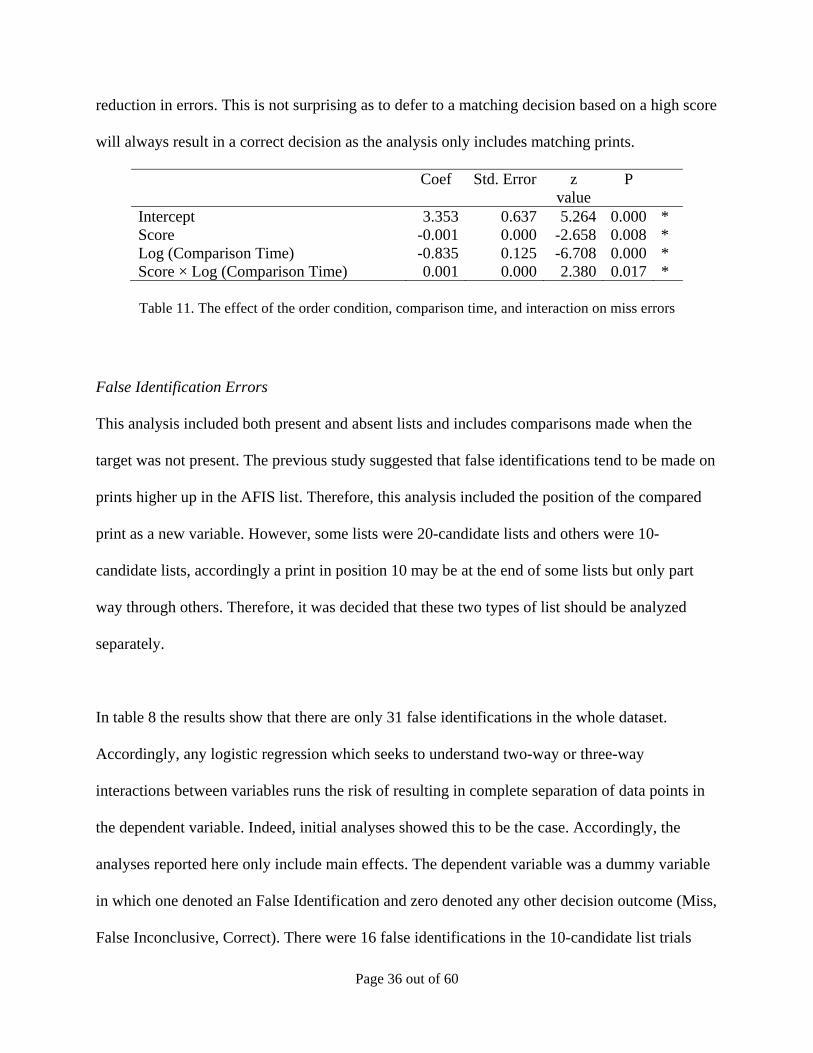
reduction in errors. This is not surprising as to defer to a matching decision based on a high score
will always result in a correct decision as the analysis only includes matching prints.
Coef Std. Error z value
P
Intercept 3.353 0.637 5.264 0.000 * Score -0.001 0.000 -2.658 0.008 * Log (Comparison Time) -0.835 0.125 -6.708 0.000 * Score × Log (Comparison Time) 0.001 0.000 2.380 0.017 *
Table 11. The effect of the order condition, comparison time, and interaction on miss errors
False Identification Errors
This analysis included both present and absent lists and includes comparisons made when the
target was not present. The previous study suggested that false identifications tend to be made on
prints higher up in the AFIS list. Therefore, this analysis included the position of the compared
print as a new variable. However, some lists were 20-candidate lists and others were 10-
candidate lists, accordingly a print in position 10 may be at the end of some lists but only part
way through others. Therefore, it was decided that these two types of list should be analyzed
separately.
In table 8 the results show that there are only 31 false identifications in the whole dataset.
Accordingly, any logistic regression which seeks to understand two-way or three-way
interactions between variables runs the risk of resulting in complete separation of data points in
the dependent variable. Indeed, initial analyses showed this to be the case. Accordingly, the
analyses reported here only include main effects. The dependent variable was a dummy variable
in which one denoted an False Identification and zero denoted any other decision outcome (Miss,
False Inconclusive, Correct). There were 16 false identifications in the 10-candidate list trials
Page 36 out of 60

and 15 false identifications in the 20-candidatie list trials hence it seems unlikely that there is an
effect of list length on false identifications. Pending trials were excluded. Table four shows the
result of the analysis.
10-Lists Coef Std. Error z
value P
Intercept -0.998 1.067 -0.935 0.350 position -1.212 0.300 -4.046 <.001 * Log (Comparison Time)
-1.184 0.256 -4.623 <.001 *
Trial Type (Present) -0.117 0.544 -0.215 .823 Order (Reordered) 1.216 0.544 2.235 .025 * Score (Spread) -0.477 0.620 -0.769 .442 20-Lists Coef Std. Error z
value P
Intercept 5.609 2.015 2.784 .005 * position -3.431 0.840 -4.087 <.001 * Log (Comparison Time)
-2.446 0.377 -6.482 <.001 *
Trial Type (Present) -0.895 0.645 -1.387 .166 Order (Reordered) -0.795 0.678 -1.173 .241 Score (Spread) 1.024 0.568 1.802 .072
Table 12. Regression Analysis Results for False Identifications in 10 and 20-candidate lists
The results appear to support previous findings that there is an effect of position on the
likelihood of error. Both coefficients are negative for the position factor which suggests false
identifications tend to be made on candidates at the top rather than the bottom of the list. This is
shown in figure 8.
Page 37 out of 60
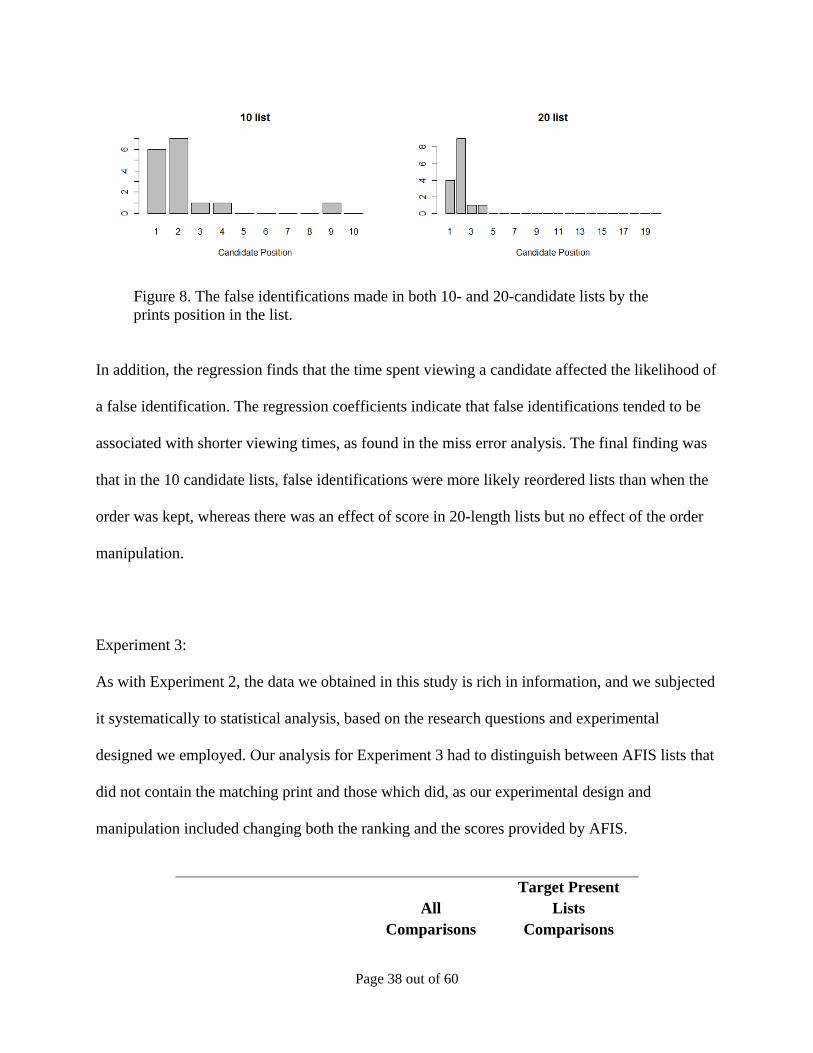
Figure 8. The false identifications made in both 10- and 20-candidate lists by the prints position in the list.
In addition, the regression finds that the time spent viewing a candidate affected the likelihood of
a false identification. The regression coefficients indicate that false identifications tended to be
associated with shorter viewing times, as found in the miss error analysis. The final finding was
that in the 10 candidate lists, false identifications were more likely reordered lists than when the
order was kept, whereas there was an effect of score in 20-length lists but no effect of the order
manipulation.
Experiment 3:
As with Experiment 2, the data we obtained in this study is rich in information, and we subjected
it systematically to statistical analysis, based on the research questions and experimental
designed we employed. Our analysis for Experiment 3 had to distinguish between AFIS lists that
did not contain the matching print and those which did, as our experimental design and
manipulation included changing both the ranking and the scores provided by AFIS.
All Comparisons
Target Present Lists
Comparisons
Page 38 out of 60

N % N % Total Comparisons 55220 100.0% 27500 100.0% Matching Comparisons 1832 3.3% 1832 6.7% Non Matching Comparisons 53388 96.7% 25668 93.3% Performance Correct 53516 96.9% 26287 95.6% Incorrect 830 1.5% 340 1.2% Pending 874 1.6% 873 3.2% Errors False Identifications 22 0.0% 6 0.0% False Inconclusive 519 0.9% 49 0.2% Miss 285 0.5% 285 1.0% Pending 874 1.6% 873 3.2%
Table 13. Descriptive statistics for the entire dataset (all trials)
Table 14. Descriptive Statistics for target matching and non matching comparisons
Match Comparisons
Non Match Comparisons
N % N % Total Comparisons 1832 100.0% 25668 100.0% Matching Comparisons 1832 100.0% 0 0.0% Non Matching Comparisons 0 0.0% 25668 100.0% Performance Correct 1545 84.3% 24742 96.4% Incorrect 285 15.6% 55 0.2% Pending 2 0.1% 871 3.4% Errors False Identifications 0 0.0% 6 0.0% False Inconclusive 0 0.0% 49 0.2% Miss 285 15.6% 0 0.0% Pending 2 0.1% 871 3.4%
Results
Errors
The aim of this study was to determine whether the experimental manipulations affected the
likelihood that a target would be missed or not. The manipulations were as follows; whether the
Page 39 out of 60
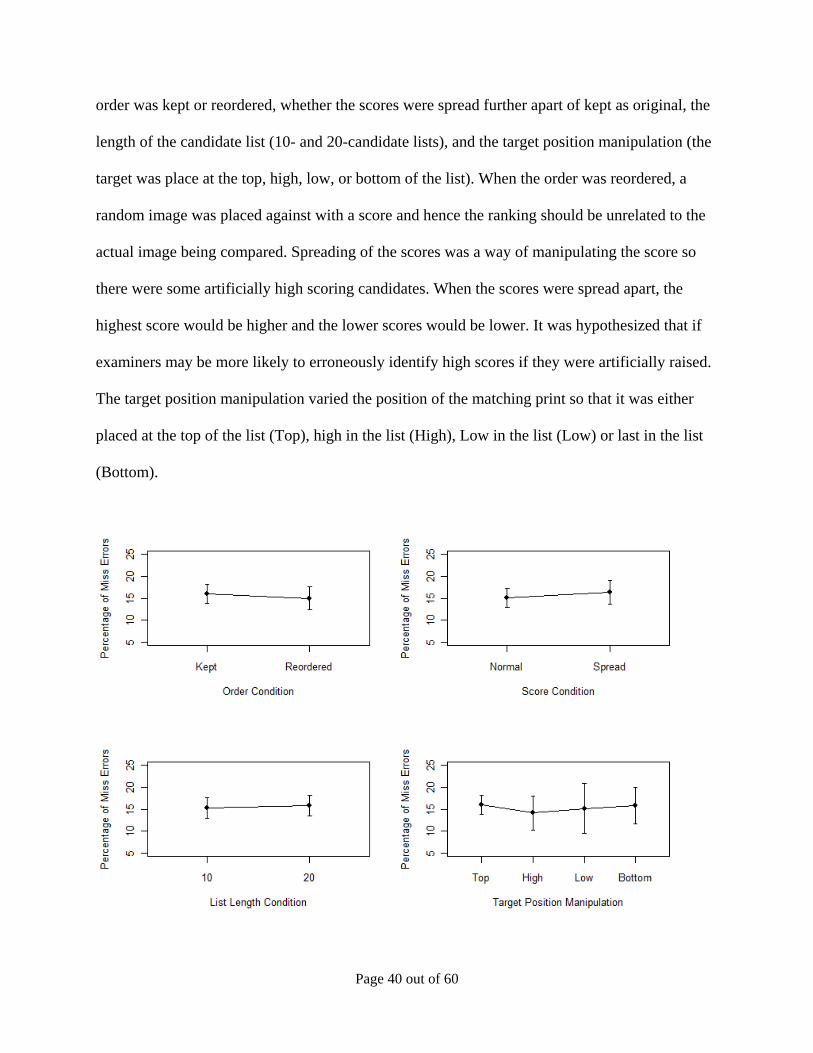
order was kept or reordered, whether the scores were spread further apart of kept as original, the
length of the candidate list (10- and 20-candidate lists), and the target position manipulation (the
target was place at the top, high, low, or bottom of the list). When the order was reordered, a
random image was placed against with a score and hence the ranking should be unrelated to the
actual image being compared. Spreading of the scores was a way of manipulating the score so
there were some artificially high scoring candidates. When the scores were spread apart, the
highest score would be higher and the lower scores would be lower. It was hypothesized that if
examiners may be more likely to erroneously identify high scores if they were artificially raised.
The target position manipulation varied the position of the matching print so that it was either
placed at the top of the list (Top), high in the list (High), Low in the list (Low) or last in the list
(Bottom).
Page 40 out of 60

Figure 9. The main experimental manipulations and the effects on the percentage of targets comparisons which are missed (both “non-ident” and “inconclusive” decisions).
As we are only including those situations in which the prints being compared do match, there are
only two choice outcomes correct (match), or incorrect (do not match/inconclusive, i.e.
miss).Figure 9 appears to show very little in the way of any main effects. Indeed, there was no
main effect of order on miss errors (Order(Reordered) coefficient = -0.075, Std. Error = 0.131, z
value = -0.570, p = 0.568). There was no main effect of the spread of scores manipulation
(Score(Spread) coefficient = -0.095, Std. Error = 0.131, z value = -0.727, p = 0.467). There was
no main effect of the list length on error rates (List(20-Candidates) coefficient = 0.039, Std. Error
= 0.129, z value = 0.302, p = 0.762). Similarly, there was not significant main effect of the
position of the target candidate in the list manipulation, X2(3, N = 1830) = 0.652, p=0.884.
However, given that the experiment involved a large number of manipulations it may be
necessary to control for these various manipulations in order to observe the effects. Accordingly,
a logistic modeling approach was taken which attempted to determine which combination of
factors truly did predict the likelihood of miss errors in the most parsimonious way possible. This
involves weighing the gains in predictability made at the cost of adding the extra parameter. The
complexity of adding a new parameter is considered valid if the parameter significantly improves
predictability. This improvement is measured by the change in the log likelihood of the simple
(i.e. excluding the parameter) compared the complex (i.e. including the parameter) model.
A stepwise simplification technique was employed to achieve this optimized model which
removed those model parameters (both simple and interaction terms) which did not significantly
improve the fit (measured by the log likelihood) of the model. Parameters relating to the
Page 41 out of 60

candidate list length and the order manipulations did not significant improve the fit of the model
and hence were removed. The final model included the Score manipulation condition, the score
value of the candidate shown to participants and the time spent during a single comparison
(comparison time4). The target position manipulation, was simplified to a two level variable in
which the target was either in the top position (Top) or in the higher, low, or bottom position
(Lower). Table 3 shows the parameter estimates for the regression model. The chi squared test
showed that the final model was a significant fit of the data, X2(9, N = 1830) = 46.5, p<.001.
Coefficient Std. Error z value Pr(>|z|) (Intercept) -3.820 1.063 -3.594 0.000 *** Score Value 0.001 0.001 0.297 0.767 Log(Comparison Time) 0.343 0.107 3.210 0.001 ** Score(Spread) 6.770 1.262 5.364 0.000 *** Position(Lower) -6.909 1.972 -3.503 0.000 *** Score Value × Score(Spread) -0.001 0.000 -2.750 0.006 ** Log(Comparison Time) × Score(Spread) -0.899 0.185 -4.873 0.000 *** Score Value × Position(Lower) 0.001 0.000 1.812 0.070 . Log(Comparison Time) × Position(Lower) 0.714 0.190 3.753 0.000 *** Score(Spread) × Position(Lower) 2.253 1.016 2.218 0.027 *
Table 15. Stepwise regression model for miss errors
The regression model reported in table 15 estimates significantly non-zero parameters for
comparison time and the score manipulation as well as effects of the position of the target in the
list. Surprisingly, the model estimates are in the opposite direction to our predictions, at least in
terms of main effect. For example, the model seems to find that overall the errors increase as
comparison time increases, and that there was a lower likelihood of error when the target was not
4 For modeling purposes the log of the comparison time was used to distribute values more evenly along the scale.
Page 42 out of 60

in the top position. However, these estimates must be interpreted alongside the interaction terms.
In particular, it appears as though the spread factor is particularly important. The model estimates
that in situations in which the scores have been artificially spread apart, the score values are
associated with a reduction in errors. Similarly, when the scores are spread apart the time spent
viewing the candidate is more strongly associated with a reduction in misses. The interaction
terms for comparison time and position appear to show that the increase in errors as comparison
time increases are more strongly found in situations in which the target is lower than in the top
position (i.e. in the high, low, or bottom positions). When the candidate is in the bottom position,
an increase in the score value is more strongly associated with errors than in other positions.
Finally, it appears as though in the high and bottom positions (as well as almost significantly in
the low position), a high spread of scores is related to an increase in errors when compared to
spread scores when the target is in the top position.
Page 43 out of 60

RT
Figure 10. The main experimental manipulations and the effects response times
Figure 10 shows the comparison time data under each manipulation, there appears to be a more
pronounced effect in the RT data compared to the miss errors shown in the previous section. In
order to determine where these effects lay, ANOVA analysis was performed on the data. The
results are shown in Table 16.
Page 44 out of 60
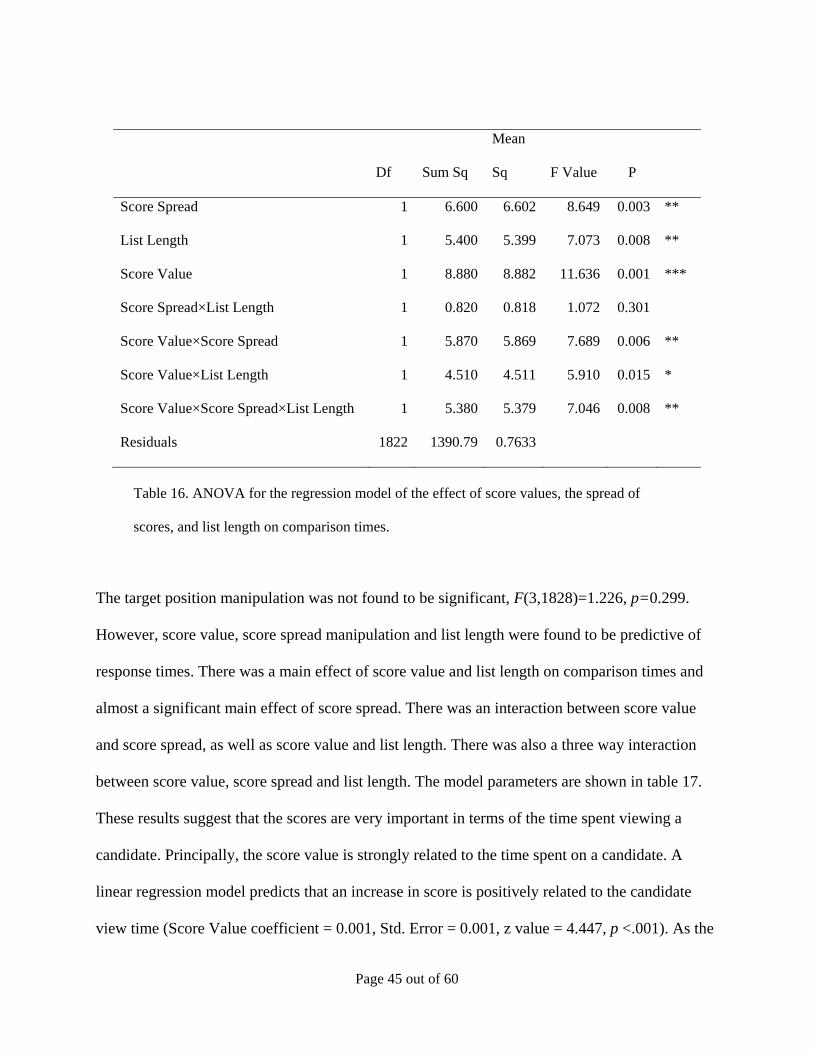
Df Sum Sq
Mean
Sq F Value P
Score Spread 1 6.600 6.602 8.649 0.003 **
List Length 1 5.400 5.399 7.073 0.008 **
Score Value 1 8.880 8.882 11.636 0.001 ***
Score Spread×List Length 1 0.820 0.818 1.072 0.301
Score Value×Score Spread 1 5.870 5.869 7.689 0.006 **
Score Value×List Length 1 4.510 4.511 5.910 0.015 *
Score Value×Score Spread×List Length 1 5.380 5.379 7.046 0.008 **
Residuals 1822 1390.79 0.7633
Table 16. ANOVA for the regression model of the effect of score values, the spread of
scores, and list length on comparison times.
The target position manipulation was not found to be significant, F(3,1828)=1.226, p=0.299.
However, score value, score spread manipulation and list length were found to be predictive of
response times. There was a main effect of score value and list length on comparison times and
almost a significant main effect of score spread. There was an interaction between score value
and score spread, as well as score value and list length. There was also a three way interaction
between score value, score spread and list length. The model parameters are shown in table 17.
These results suggest that the scores are very important in terms of the time spent viewing a
candidate. Principally, the score value is strongly related to the time spent on a candidate. A
linear regression model predicts that an increase in score is positively related to the candidate
view time (Score Value coefficient = 0.001, Std. Error = 0.001, z value = 4.447, p <.001). As the
Page 45 out of 60

mean score during spread trials was 3822.1 (SD=1318.0) whereas the mean score for normal
trials was higher at 4331.1 (SD=502.4), it seems that this difference in mean may explain why
comparison times were generally higher in normal versus spread trials. In fact, this may explain
the interaction between the score manipulation and the position of the target position
manipulation on miss errors (see the final row in Table15). If spread scores are associated with
lower mean scores which in turn tend to be compared for a shorter time and hence may result in
more errors.
Estimate Std. Error t value Pr(>|t|) (Intercept) 5.387 0.312 17.290 .000 *** Score Value 0.001 0.001 -0.032 .975 Score(Spread) 0.064 0.373 0.172 .864 List Length(20) 0.519 0.466 1.112 .266 Score Value×Score(Spread) 0.001 0.001 -0.267 .789 Score Value×List Length(20) 0.001 0.001 -1.213 .225 Score(Spread) ×List Length(20) -1.406 0.523 -2.688 .007 ** Score Value×Score(Spread)×List Length(20) 0.001 0.001 2.671 .008 **
Table 17. Model estimates for the effect of score values, score manipulations and list length on RT.
Conclusions Technology, and especially cognitive technology that performs cognitive operations that were
once only possible by humans, gives rise to new forms of distributed cognition. A forensic
technology such as AFIS is a clear and excellent example of new achievements and possibilities
that can arise from new human-technology collaboration. It also demonstrates the complexity of
Page 46 out of 60
such endeavours, and illustrates that one should fully consider and understand their impact. Too
often technology is deployed with only technical training in its use, without optimizing the
human-technology collaboration; adapting human cognition to the new technological
environment; or taking steps to minimize potential harm or new risks generated by the
technology.
AFIS is a major technological apparatus, widely used, and is very expensive. Nevertheless, there
has not been a single empirical scientific study that examined its cognitive impact on the world
of fingerprinting. When considering AFIS results, fingerprint examiners may continue to
consider similarities for identifications in exactly the same way as they did in the pre-AFIS era
when generally there was no active agent presenting the examiner with similar recorded
fingerprints. That is, they may use the same decision making processes whether a print is
provided by a suspect or from an AFIS search. SWGFAST (the Scientific Working Group that
established guidelines for this profession), the IAI (their professional body), as well as dozens of
laboratories that we have examined, do not seem to provide any guidelines or stipulations
concerning how examiners may need to change their decision making threshold when using
AFIS.
AFIS has in many ways been a great success, but nevertheless it may introduce problems that
have never been studied or researched. AFIS changes the way that comparisons are presented to
an examiner. In non-AFIS searches, an examiner is frequently presented with a limited set of
prints for comparison. By contrast, in an AFIS setting, an examiner is presented with a ranked set
of prints, beginning with the most probable match. Indeed, most AFIS hits are provided as the
Page 47 out of 60

top candidate on the list. While this ranking may therefore be very useful information for the
examiner, it may also create a bias. The research reported here examines the potential biasing
effects of the ranking of prints in an AFIS list.
Do human examiners take this ranking information provided by AFIS and use it in their decision
making process? And if they do, is that a problem? The fact that AFIS views certain candidates
as more likely to be a match than others, may constitute valid and important information for the
human examiner to take on board. If AFIS rankings tend to be accurate, human examiners may
experience efficiency gains by utilizing that information, and focusing their cognitive resources
on the highest-ranking exemplars. However, such influences -- warranted and helpful as they
may be-- need to be carefully researched, considered and formalized (Dror & Mnookin, 2010).
Furthermore, such influences may be biasing in a negative way. For example, they may affect
expectations, leading to lower attention levels and motivation for comparisons of candidates not
at the top of the list, and thereby missing identifications provided by AFIS in lower positions.
Moreover, the less accurate the AFIS rankings, the more problematic it may be if the examiner’s
own processes internalize them. There may also be too much of an examiner focus on the top
prints in a ranked list, especially given the general psychological and cognitive bias to prefer the
first choice (Mantonakis, Rodero, Lesschaeve, & Hastie, 2009).
Providing a ranked list is not a necessary feature of a database search process. It would be very
simple to modify AFIS’s output to eliminate the examiners’ knowledge of AFIS’s ranking, by
providing lists to examiners with prints in a random order. However, it is far from clear if that is
warranted. To determine whether that change would be beneficial, research would be needed on
Page 48 out of 60

at least two distinct questions: First, research must examine whether the AFIS ranking has an
impact on the human examiner. Our study examines this specific issue, and does find that AFIS
ranking impacts examiner decision making processes, both by decreasing the time spent by some
examiners on lower-ranked exemplars, and, as a result of this decreased time, increasing the
number of missed identifications; and by revealing that false identifications were more likely to
occur at the top of an AFIS list. But before we could conclude that such information ought
therefore not be provided to the examiner, we would also need to examine whether the ranking
information was sufficiently valid that its presentation aided accurate decision making (or more
efficient) notwithstanding its potential biasing effect.
In this study we inserted the matching print into different positions in AFIS lists. We compared
how human examiners approached the comparison as a function of where we inserted the
matching prints. We examined if the position would affect their conclusions (i.e., whether they
were more likely to make an error, either a false inconclusive or a false exclusion), and if it
biased their decision making process (i.e., are they likely to go about the comparison differently,
based on the position of the print in the list, as reflected by their Response Time). Our study
design recognized that bias could affect the decision making process, but not necessarily change
the decision outcome every time. The change in decision outcomes is determined by the
direction of the bias and its magnitude, and the complexity of the decision itself (Dror, 2009).
We therefore were interested in both whether the position on an AFIS list affected decisions, but
also whether it affected the cognition and the decision processes itself.
Page 49 out of 60
Our empirical study clearly shows that the ranked position of a print in an AFIS list affects the
human examiners. This effect may well be without their conscious awareness, but the data
demonstrates that examiners change their decision-making process as a function of print
position. We are able to ascertain this with confidence as our experimental setup and design
enabled us to statistically compare performance on the exact same comparison (same pair of
latent and print), which only differed in the position of the print in the AFIS list, and all else
being equal. Furthermore, given that our expert participants conducted the comparisons as
routine casework and hence did not know they were taking part in a study, we can confidently
attribute our findings to the real world of fingerprinting.
Our findings show that examiners take less time to compare items when they are presented at a
lower position on the list. This finding is not a function of the print itself; the same print is
considered differently when presented at a lower position on the ranked list. We also found that
examiners are more likely to miss an identification (false exclusion) or erroneously judge a
matched print inconclusive when comparison time is lower. Furthermore, these two factors
appear to interact such that there is a greater biasing effect of the position in the list when the
comparison is made quickly than when comparison time is longer. This fits with current
sequential sample models of perception and judgment which argue that biases are often more
influential in low threshold decision-making (Busemeyer & Townsend, 1993; Dror, Busemeyer,
& Basola, 1999).
Our findings also show that when false identifications occur, they are closely centered at the top
of the list, further showing the biasing effects of position. Such false identifications occurred
Page 50 out of 60

even when a more similar print (the actual matching one) was present in a lower position in the
list. We are confident in our finding as we found the exact same results when we included all the
false identifications (49 errors, 0.09%) and also when we excluded all those that were potentially
‘clerical errors’ (keeping only 12 errors, 0.02%).
Although our study does not directly address error rates, it is important to note that false
identifications are more likely as the comparison print is more similar to the latent. All of our
prints were generated from an AFIS search of a database that contained only a small number of
tenprints (just over 3,000). We cannot ascertain if the rate of false identification would have been
higher if we obtained prints from an AFIS search of 10s of millions of prints rather than a few
thousands.
Similarly, our finding of 27.40% of missed identifications (false inconclusive and false
exclusions), needs to be taken within the scope of this study. The position of the matching print
in the AFIS list (which was the topic of research of this study) contributed to this error rate and
we cannot ascertain what the rate of error would have been without this biasing factor.
Our research demonstrates the effects of the prints’ position in an AFIS list but does not explain
its cognitive implications. Do examiners utilize different cognitive schemas and processing when
comparing prints in different positions (see Ashworth & Dror, 2000, for details of different
cognitive identification schemas and processing), or do their expectations of finding a match
influence their motivation and drive the time, effort, and attention they dedicate to the
comparison (Carney & Banaji, 2008; Miller & Krosnick, 1998; Sulmont-Rosse, Chabanet,
Page 51 out of 60
Issanchou, and Köster, 2008)? In the typical identification unit, such expectatons may arise from
intentional or incidental exposure to other kinds of case metadata from sources other than AFIS.
Perhaps this and subsequent studies of the relatively easily controlled AFIS metadata bears on
non-AFIS influences upon expectations. Further research can elucidate these questions, which
will help guide recommendations of how best to use AFIS and optimize the human-technological
collaboration. Our findings also indicated the potential relevance of list size on examiners’
decision making processes, i.e., whether AFIS provided a 10- or 20-candidate list to the human
examiner. While the length of the list mediates the effect of position, more research and data is
needed before we can confidently draw conclusions and best practice recommendations on this
issue.
When we examined the scores of AFIS, we did not find such strong effects on the human
examiners as when we examined ranking. Therefore, it seems that some information that AFIS
provides to the human examiners is more influential than others.
Other cognitive aspects regarding AFIS work also require further research and data, such as
whether there are accuracy or efficiency benefits to providing the exemplar list to an examiner
sequentially or simultaneously. Such questions have been heavily researched in other areas of the
criminal justice system (e.g., eye witnesses identifications; see Charman & Wells, 2006; Wells &
Olson, 2003; Turtle, Lindsay, & Wells, 2003), and even in some forensic domains (e.g., face
recognition technology; see Dror & Shaikh, 2005a, 2005b). However, no such research has
investigated these issues with regards to AFIS, and therefore it is impossible to make
Page 52 out of 60

scientifically-informed decisions on better or worse ways to make use of this important and
prevalent technology.
Forensic science requires such cognitive research, especially in the domains that rely heavily on
human perception and judgment, such as pattern and impression evidence. To make such
research scientifically sound as well as applicable to the real world of forensic science,
collaborative research projects –like the one reported here—significantly benefit from the
involvement of both cognitive research scientists and practicing forensic examiners. It would be
premature to recommend best practices regarding AFIS from this study standing alone, but the
clear effects of ranking on examiners’ time to decision, false identification decisions, and missed
identifications demonstrate that AFIS design does have an effect on examiner’s cognitive
processes. This study illustrates the importance of continued further research regarding how
cognition is, and should be, distributed between humans and cognitive technologies.
Disclaimer: This project was supported by Award No. 2009-DN-BX-K224
awarded by the National Institute of Justice, Office of Justice Programs, US
Department of Justice. The opinions, findings, and conclusions or
recommendations expressed in this publication are those of the author(s) and do
not necessarily reflect the views of the Department of Justice.
Page 53 out of 60

References
Ashworth, A.R.S. & Dror, I. E. (2000). Object identification as a function of discriminability and
learning presentations: The effect of stimulus similarity and canonical frame alignment on
aircraft identification. Journal of Experimental Psychology: Applied, 6 (2), 148-157.
Baber, C., Smith, P., Cross, J., Hunter, J., & McMaster, R. (2008). Crime scene investigation as
distributed cognition. In I. Dror & S. Harnad (Eds.), Cognition Distributed: How Cognitive
Technology Extends Our Minds (pp 159–184). Amsterdam: John Benjamins Publishing.
Becker, S. L. (1954). Why an order effect? Public Opinion Quarterly, 18, 271-278.
Berg, H. W., Filipello, F. E., Hinreiner, E. & Sawyer, F. M. (1955). Consumer wine-preference
methodology studies at California fairs. Food Technology, 9, 90-93.
Busey, T., & Dror, I. E. (2009). Special abilities and vulnerabilities in forensic expertise. In The
Fingerprint Sourcebook. Washington D.C.: NIJ Press.
Busemeyer, J. R. & Townsend, J. T. (1993). Decision field theory: A dynamic-cognitive
approach to decision making in an uncertain environment. Psychological Review, 100, 432-459.
Carney, D. R. & Banaji, M. R. (2008). First is the best in rapid social judgment and consumer
decision. Unpublished manuscript, Harvard University, Cambridge, MA.
Page 54 out of 60

Charlton, D., Fraser-Mackenzie, P., & Dror, I. E. (2010). Emotional experiences and motivating
factors associated with fingerprint analysis. Journal of Forensics Sciences, 55 (2), 385-393.
Charman, S. D. and Wells, G. L. (2006). Applied lineup theory. In R. C. L. Lindsay, D. F.
Ross,J. D. Read, and M. P. Toglia (Eds.) Handbook of eyewitness psychology: Memory for
people (pp. 219-254). Mahwah, NJ: Lawrence Erlbaum Associates.
Cole, S. A. (2006). The prevalence and potential causes of wrongful conviction by fingerprint.
Golden Gate University Law Review, 37, 39-105.
Coney, K. A. (1977). Order bias; The special case of letter preference. Public Opinion Quarterly,
41, 385-388.
Davis, C.J. & Hufnagel, E. M. (2007).Through the eyes of experts: a sociocognitive perspective
on the automation of fingerprint work. MIS Quarterly, 31(4), 681-703.
Dean, M. L. (1980). Presentation order effects in product tasting tests. Journal of Psychology,
105, 107-110.
Dror, I.E. (in press). The paradox of human expertise: Why experts can get it wrong.. In N.
Kapur, Pascual-Leone, & V. S. Ramachandran (Eds.) The Paradoxical Brain. Cambridge, UK:
Cambridge University Press.
Page 55 out of 60

Dror, I. E. (2009). On proper research and understanding of the interplay between bias and
decision outcomes. Forensic Science International, 191, 17-18.
Dror, I.E. (ed.) (2007a). Cognitive Technologies and the Pragmatics of Cognition. (186 pp.) John
Benjamins Press, Amsterdam.
Dror, I.E. (2007b). Land mines and gold mines in cognitive technologies. In I. E. Dror (Ed.),
Cognitive Technologies and the Pragmatics of Cognition. Amsterdam: John Benjamins
Publishing.
Dror, I. E., Busemeyer, J. R., & Basola, B. (1999). Decision making under time pressure: An
independent test of sequential sampling models. Memory and Cognition, 27, 713-725.
Dror, I.E. & Charlton, D. (2006a). Why experts make errors. Journal of Forensic Identification,
56 (4), 600-616.
Dror, I.E., Charlton, D. & Péron, A.E. (2006b). Contextual information renders experts
vulnerable to make erroneous identifications. Forensic Science International, 156 (1), 74-78.
Dror, I. E. & Harnad, S. (eds.) (2008a). Cognition Distributed: How Cognitive Technology
Extends Our Minds. (258 pp.) John Benjamins, Amsterdam.
Page 56 out of 60

Dror, I. E. & Harnad, S. (2008b). Offloading cognition onto cognitive technology. In I. Dror &
S. Harnad (Eds.), Cognition Distributed: How Cognitive Technology Extends Our Minds (pp 1-
23). Amsterdam: John Benjamins Publishing.
Dror, I. E. & Mnookin, J. (2010). The use of technology in human expert domains: Challenges
and risks arising from the use of automated fingerprint identification systems in forensics. Law,
Probability and Risk, 9, 47-67.
Dror, I.E., Peron, A., Hind, S., & Charlton, D. (2005). When emotions get the better of us: The
effect of contextual top-down processing on matching fingerprints. Applied Cognitive
Psychology, 19(6), 799-809.
Dror, I. E. & Rosenthal, R. (2008). Meta-analytically quantifying the reliability and biasability of
fingerprint experts’ decision making. Journal of Forensic Sciences, 53(4), 900-903.
Dror, I.E. & Shaikh, A. (2005a). Face recognition technology: Cognitive considerations in
system design. United Kingdom Passport Services (UKPS) Technical Report.
Dror, I.E. & Shaikh, A. (2005b). Training for expertise in face recognition and working with face
recognition technology (TNA). United Kingdom Passport Services (UKPS) Technical Report.
Hall, L.J. & Player, E. (2008). Will the introduction of an emotional context affect fingerprint
analysis and decision making? Forensic Science International 181, 36-39.
Page 57 out of 60

Klug, D, Petersen, J and SToney, D (1992). Automated Fingerprint Identification Systems: Their
Acquisition, Management, Performance and Organizational Impact, National Institute of Justice,
NCI 13749 , 1992.
Komarinski, P.D., (2009), Considerations for improving latent print processing. Presentation at
the National Institute of Standards and Technology (NIST) Latent Fingerprint Testing Workshop
(available at http://fingerprint.nist.gov/latent/workshop09/Komarinski.pdf).
Langenburg,G, Champod, C., & Wertheim, P. (2009). Testing for Potential Contextual Bias
Effects During the Verification Stage of the ACE-V Methodology when Conducting Fingerprint
Comparisons. Journal Forensic Sciences, 54, (3), 571-582.
MacFie, H. J., Bratchell, N., Greenhoff, K., & Vallis, L. V. (1989). Design to balance the effect
of order of presentation and first-order carry-over effect in hall tests. Journal of Sensory Studies,
4, 129-148.
Mantonakis, A., Rodero, P., Lesschaeve, I., & Hastie, R. (2009). Order in choice: Effects of
serial position on preferences. Psychological Science, 20, 1309-1312.
Miller, J. M. & Krosnick, J. A. (1998). The impact of candidate name order on election
outcomes. Public Opinion Quaterly, 62, 291-330.
Page 58 out of 60

Office of the Inspector General (OIG), Oversight and Review Division, U.S. Department of
Justice. (2006). A Review of the FBI’s Handling of the Brandon Mayfield Case
Petersen, J.L. & Moore, J. The Status of AFIS Systems Worldwide: Issues of Organization,
Performance and Impact, in Proceedings of the International Symposium on Fingerprint
Detection and Identification (Joseph Almog & Eliot Springer, eds., Israel National Police 1996).
Schiffer, B. & Champod, C. (2007). The potential (negative) influence of observational biases at
the analysis stage of fingermark individualisation. Forensic Science International, 167, 116-120.
Stacey R. B. (2004). Report on the erroneous fingerprint individualization bombing case. Journal
of Forensic Identification, 54(6), 706–718.
Sulmont-Rosse, C., Chabanet, C., Issanchou, S., & Köster, E. P. (2008). Impact of the arousal
potential of uncommon drinks on the repeated exposure effect. Food, Quality, and Preference,
19, 412-420.
Turtle, J.W., Lindsay, R.C.L. and Wells, G.L. (2003). Best practice recommendations for
eyewitness evidence procedures: New ideas for the oldest way to solve a case. The Canadian
Journal of Police and Security Services, 1, 5-18.
Wells, G. L. and Olson, E. (2003). Eyewitness identification. Annual Review of Psychology, 54,
277-295.
Page 59 out of 60

Page 60 out of 60
Wertheim, K., Langenburg, G., & Moenssens, A. (2006). A report of latent print examiner
accuracy during comparison training exercises. Journal of Forensic Identification, 56 (1), 55-93.
Dissemination of Research Findings
The findings of this project were presented:
1. At the National Science Founation (NSF) Cognitive Bias and Forensic Science
Workshop, held in Chicago, 23 September 2010.
2. At the NIJ R&D Grantees Meeting held in conjunction with the AAFS conference in
Chicago, February 22, 2011.