quantifications of geomagnetic storm impact on tec and ... · 17.03.2013 · o 30-day median and...
TRANSCRIPT

QuantificationsofGeomagneticStormImpact
onTECandfoF2duringMarch17,2013event
NASAGoddardSpaceFlightCenterhttp://ccmc.gsfc.nasa.gov
JaSoonShim1*,Ioanna Tsagouri2,LarisaGoncharenko3M.LeilaMays1,Aleksandre Taktakishvili1,LutzRastaetter4,MariaMKuznetsova4
Modelers:Ionosphere/ThermosphereModelshostedatCommunityCoordinatedModelingCenter
1. CUA/NASAGSFC,Greenbelt,MD,USA,2. NationalObservatoryofAthens,Greece
3. MITHaystackObservatory,Westford,MA.USA4. NASA/GSFC,Greenbelt,MD,USA,

• Quantificationofstormimpact
o Quiet-timebackgroundreferences
o foF2andTECchanges
o Model/datacomparison
• ImpactsofuncertaintyintheIMFonTECsimulation
• Summary
Outline

TECandfoF2at10Ionosonde Stations• 4stationsfromUS,4fromEurope
and2fromSouthAmericatoinvestigate:o latitudeandlocaltime
dependenceo hemisphericasymmetry
• Observations:o foF2datafromtheGlobal
IonosphereRadioObservatory(GIRO)
o GPSverticalTECdatafromMITHaystackObservatory(error<4TECU)

Quiet-timeReferences
• Onedaybeforestormonset
• Fiveconsecutivedaysbeforestormonset
• Fivequietestdayswithin30dayspriortostorm
• 30dayspriortostorm
dailyaveragedKp,AE,Dst,andF10.7

• Onedaybeforestormonset
• Fiveconsecutivedaysbeforestormonset
• Fivequietestdayswithin30dayspriortostorm
• 30dayspriortostorm
Quiet-timeReferences
dailyaveragedKp,AE,Dst,andF10.7

• Onedaybeforestormonset
• Fiveconsecutivedaysbeforestormonset
• Fivequietestdayswithin30daysprior tostorm
• 30dayspriortostorm
Quiet-timeReferences
dailyaveragedKp,AE,Dst,andF10.7

• Onedaybeforestormonset
• Fiveconsecutivedaysbeforestormonset
• Fivequietestdayswithin30dayspriortostorm
• 30daysprior tostorm
Quiet-timeReferences
dailyaveragedKp,AE,Dst,andF10.7

TEC:ComparisonofFourBackgrounds
• Thebackgrounds arerepeatedacross3daysofthestormevent.
• TECononedayprior tothestorm(redline)islargerthanotherreferences.
• 30-daymedian(green)andmeanofthe5quietestdays(blue)aremoresuitable(difference<1TECU)
• Ionosphere-thermosphere modelsimulationsalsoshowsimilarfeatures(not shownhere).
StormtimeTEC30-daymedian5quietest_ave066-070_ave075(03/16)
Athens(23.5E,38.0N)

TECChangeswithrespecttothefourdifferentbackgrounds
• dTEC=100*(TEC– TEC_q)/TEC_q,whereTEC_q =quiettimebackground
• DifferenceinTECchangesbetweenredandblue (orgreen)appearsmorethan100%.
• 30-daymedian(green)andmeanof 5quietestdays(blue)aremoresuitable.
30-daymedian5quietest_ave066-070_ave075(03/16)
Athens(23.5E,38.0N)dTEC
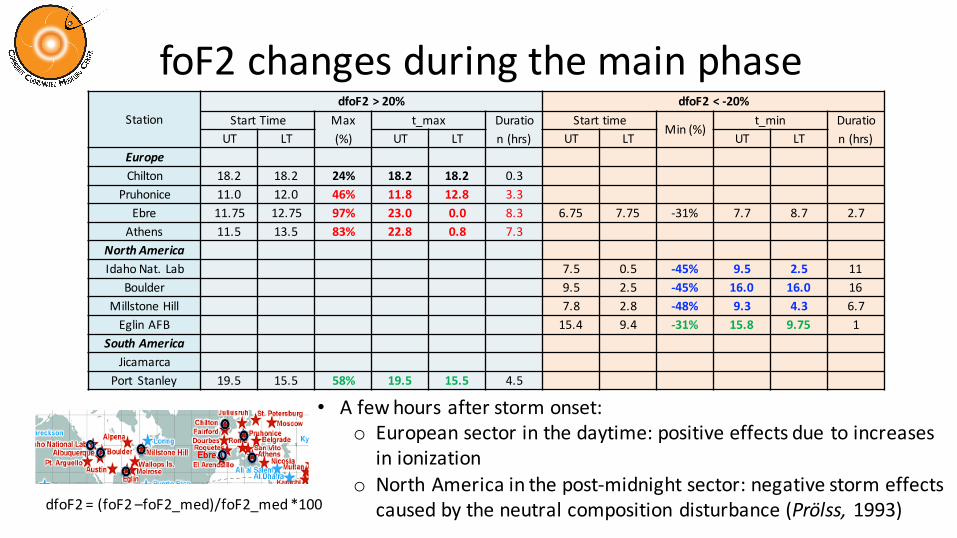
foF2changesduringthemainphaseStation
dfoF2>20% dfoF2<-20%StartTime Max
(%)t_max Duratio
n(hrs)Starttime
Min(%)t_min Duratio
n(hrs)UT LT UT LT UT LT UT LTEuropeChilton 18.2 18.2 24% 18.2 18.2 0.3
Pruhonice 11.0 12.0 46% 11.8 12.8 3.3Ebre 11.75 12.75 97% 23.0 0.0 8.3 6.75 7.75 -31% 7.7 8.7 2.7Athens 11.5 13.5 83% 22.8 0.8 7.3
NorthAmericaIdahoNat.Lab 7.5 0.5 -45% 9.5 2.5 11
Boulder 9.5 2.5 -45% 16.0 16.0 16MillstoneHill 7.8 2.8 -48% 9.3 4.3 6.7EglinAFB 15.4 9.4 -31% 15.8 9.75 1
SouthAmericaJicamarca
Port Stanley 19.5 15.5 58% 19.5 15.5 4.5
dfoF2=(foF2–foF2_med)/foF2_med*100
• Afewhoursafterstormonset:o Europeansectorinthedaytime:positiveeffectsduetoincreases
inionizationo NorthAmericainthepost-midnightsector:negativestormeffects
causedbytheneutralcompositiondisturbance(Prölss,1993)

TECchangesduringthemainphaseStation
dTEC >50% dTEC <-40%start time
Max[%]t_max duration
(hrs)Start time
Min[%]t_min duration
(hrs)UT LT UT LT UT LT UT LTEuropeChilton 10.6 10.5 91.6% 11.5 11.5 2.8 20.2 20.1 -59.1% 11.5 11.5 1.6
Pruhonice 8.8 9.7 123.4% 11.4 12.4 5.8Ebre 9.6 9.6 144.5% 19.9 20.0 10.7Athens 8.3 9.8 148.9% 17.3 18.8 13.7
NorthAmericaIdahoNat.Lab. 9.1 1.6 209.3% 11.8 4.3 5.2
Boulder 9.5 2.5 89.4% 10.3 3.3 3.0MillstoneHill 10.5 5.7 75.1% 19.5 14.7 3.2 9.1 4.3 -43.7% 19.5 14.7 0.3EglinAFB 11.0 5.2 89.6% 19.0 13.2 2.6
SouthAmericaJicamarca 8.7 3.5 232.2% 8.9 3.8 5.1 8.3 3.1 -43.1% 8.9 3.8 0.1
Port Stanley 17.0 13.1 270.7% 20.3 16.4 2.8
• Samecolordepictssimilar latitudesanditshows similarresponses tothestorm.• BothfoF2andTECresponses tothestormarepositive phaseinEuropeansector.• NoticeabledifferencebetweenthefoF2andTECresponse inNorthAmericasector:
o TECshowsmainlypositive effects,whilefoF2showsnegativeeffects.• TECenhancementatPortStanley(42S)isaboutthreetimeslargerthanthatatEglin(40N).• AtJicamarca,foF2changes<|20%|, butTECchangegoesupto230%.
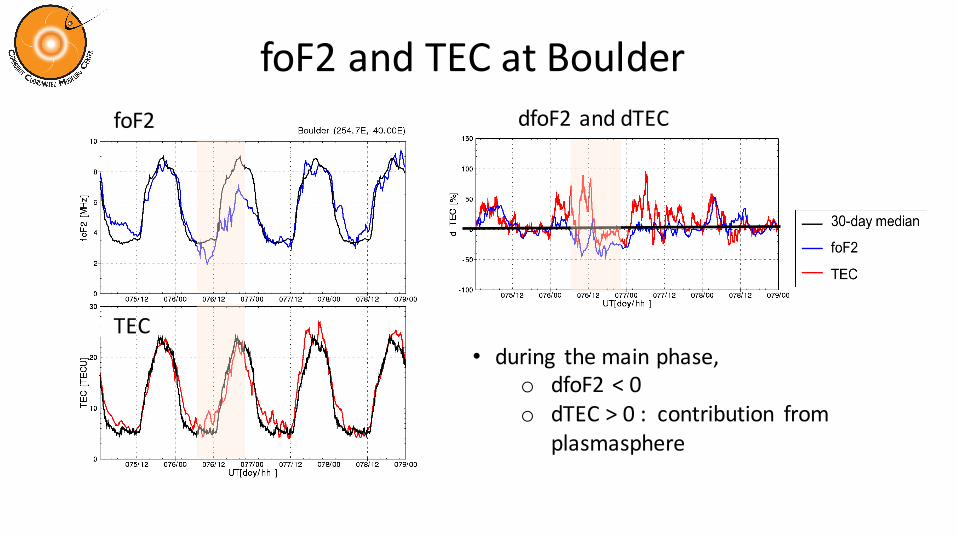
foF2andTECatBoulder
• during themainphase,o dfoF2<0o dTEC >0:contribution from
plasmasphere
foF2
TEC
dfoF2anddTEC

AssessmentofModelPredictionModel ModelSettingDescription/Modelers Lower andUpper
boundary forTECcalculation(km)EmpiricalModel
IRI 2012IRI-2012usingIRI-corrmodelfortopsideNeandusingCCIR(InternationalRadioConsultativeCommittee)forF-peakplasmafrequency foF2, DieterBilitza (GMU,NASA/GSFC)
~60 ~2,000
PhysicsBasedIonosphereModelIFM IFMdrivenbyF10.7andKp,Robert W.Schunk etal.(USU) ~90 ~1,400
SAMI3 SAMI3withtheneutralwindmodelHWM93, JosephHuba etal.(NRL) ~90 ~2,000Physics-basedCoupled Ionosphere-ThermosphereModel
CTIPE CTIPe3.2drivenbyWeimer[2005],TimothyFuller-Rowelletal.(NOAASWPC)
~140 ~2000
GITM GITM2.3drivenbyWeimer2005,AaronRidleyetal.(UM) ~90 ~600
TIE-GCM TIE-GCM2.0drivenbyWeimer[2005], R.G.Robleetal.(HAO,NCAR) ~90 ~600Physics-basedDataAssimilationModel
USU-GAIM USU-GAIM2.4.3withGPSTECobservationsfromup to400groundstations(-60° <lat <60°),Robert W.Schunk etal.(USU)
~90 ~1,400

RMSE
• AverageRMSEfor10and6stationsforTECandfoF2,respectively• ScaledTEC=TEC*(Obs_med/TEC_med)• ShiftedTEC=TEC–min(TEC_med)• DegreeofImprovementofpredictingperformancebyscalingdependsonmodels.• AveragedGPSTECerror<2TECU• 3TECU<TECRMSE<12TECU• 1.6MHz<foF2RMSE<3.6MHz
TEC foF2

where,ratio_max=dfoF2_max_model/dfoF2_max_obs(ordTEC_max_model/dTEC_max_obs)
dt_max=|t_max_obs - t_max_mod|dt_min=|t_min_obs - t_min_mod|
Model dfoF2>20% dfoF2<-20%
ratio_max dt_max ratio_min dt_min
IFM 0.99 8.25 0.71 2.95
SAMI3 0.92 4.50 1.84 2.38
CTIPE 2.54 0.00 0.78 2.67
GITM 2.42 1.00 0.60 2.12
TIE-GCM 0.97 3.5 1.24 2.92
USU-GAIM 0.84 0.88
dTEC >50% dTEC <-40%
ratio_max dt_max ratio_min dt_min
1.5 4.6 1.2 1.9
2.0 6.3 1.5 1.6
0.5 3.6 1.2 2.3
3.7 3.9
0.8 4.6 1.1
0.9 3.1 1.3 2.4
RatioofChanges
• Differencesinratio_max (anddt_max)amongmodelsarelargerthanthoseinratio_min (anddt_min).
• Red:betterratio• Blue:bettertimeprediction

ImpactsofUncertainty
IntheInterplanetaryMagneticField(IMF)
onTEC

SolarWindParametersfromEnsembleofWSA+ENLIL+ConeModelruns
|Vx|
IMFClockangleensembleofITmodel runs:90°,135°,and180°
ACEdatapredictedmeanvalueoutofensemble(generatedbeforetheevent)bestfitoutofensemble(aftertheevent)
Shockarrivaltime:• predicted:2013-03-16T21:34Z• adjusted: 2013-03-17T05:12Z• about7hourdifference

IMFClockAngleEnsemble
• UncertaintyinIMFclockangle(w/adjustedsolarwindparameters)hasnoticeableimpactonTECinmidlatituderegionduringthemainphase.
GPSvTECw/ACEw/ENLIL(90°)w/ENLIL(135°)w/ENLIL(180°)
CTIPe TIE-GCM

Summary• QuantifiedstormimpactsonfoF2andTECat10selectedionosonde locations.• Comparedfourdifferentquiet-timereferences:
o 30-daymedianandmeanoffivequietestdaysarecomparable.o averaged5consecutivedaysandonedaybeforethestormmaynotbesuitable.
• Duringmainphase,o Europeansector:both foF2andTECresponsetothestormarepositivephaseo NorthAmericasector:foF2shows negativeeffects,whileTECshowspositiveresponse.Itis
possiblyduetoplasmaspherecontribution.o TECenhancementatPortStanley(42S)isaboutthreetimeslargerthanthatatEglin(40N).
• EvaluatedhowwellIonosphere-thermospheremodelsreproducetheTECandfoF2changesduringthemainphase.o RMSEofthemodelsislargerthanerrorsinobservations.o performancedependsonmetricsandquantitiesselected.
• UncertaintyinIMFclockanglehasnoticeableimpactonTECinmidlatituderegionduringthemainphase.