quantification of the forest resource report, the … · quantification of the forest resource...
TRANSCRIPT

THE NATIONAL FOREST COMPANY
QUANTIFICATION OF THE FOREST RESOURCE
UPDATE REPORT
For National Forest Company Bath Yard
Moira Swadlincote Derbyshire DE12 6BA
01283 551211
June 2009 Prepared by Eamonn Wall & Co 15 West Burnside Dollar FK14 7DP Tel: 01259 743212

Quantification of the Forest Resource (Main Report) Eamonn Wall & Co
CONTENTS 1. Introduction and scope 1 2. Input data 2 3. Young woodland 8 4. Established woodland 12 5. Summary of existing woodland 15 6. Utilisable woodland resource 17 7. Modelling of yield 18 8. Availability of resources for wood-chip power system 25 9. Summary 33
LIST OF TABLES Table 1 Derivation of total area of young woodland 8 Table 2 Breakdown of young woodland by age class 9 Table 3 Detailed breakdown of young woodland 9 Table 4 Estimated area class distribution of pre-1995 young woodland 9 Table 5 Estimated area class distribution of post-1995 young woodland 10 Table 6 Detailed breakdown of established woodland 12 Table 7 Size distribution of established woodland 13 Table 8 Summary of existing woodland 15 Table 9 Utilisable woodland area : Detailed breakdown 17 Table 10 Derivation of woodland area in each 5-year cohort 18 Table 11 Poplar yields, 4m x 2m initial spacing 20 Table 12 Assignment of cohorts for modelling of yield from young trees 21 Table 13 Modelled yields for cohorts of young trees 22 Table 14 Modelled yield from established woodlands 23 Table 15 Summary of yield data (m3/yr) 23 Table 16 Woodfuel yield from established woodlands 27

Quantification of the Forest Resource (Main Report) Eamonn Wall & Co
Table 17 Woodfuel yield from young broadleaves 27 Table 18 Woodfuel yield from young conifers 28 Table 19 Summary of potential woodfuel availability (dry t) 28 Table 20 Summary of potential woodfuel availability (dryt) 29 Table 21 Summary of amount of existing woodland pre-1995 and
post-1995 30 Table 22 Summary of age class distribution 30 Table 23 Summary of woodland type 31 Table 24 Summary of existing woodland 31 Table 25 Summary of yield projection (m3/yr) 32 Table 26 Summary of potential woodfuel availability 33
LIST OF FIGURES Figure 1 NIWT-plus dataset 4 Figure 2 NFC existing schemes dataset 5 Figure 3 WGS3 dataset 6 Figure 4 Composite of NIWT WGS3 & NFC datasets 11 Figure 5 Area distribution of pre-1995 young woodlands 13 Figure 6 Area distribution of post-1995 young woodland 13 Figure 7 Area distribution of established woodland 14 Figure 8 Breakdown of existing woodland by gross area 16 Figure 9 Potential yield projection 24 Figure 10 Woodlands within National Forest boundary 26 Figure 11 Potential woodfuel yield projection 30

Quantification of the Forest Resource (Main Report) Eamonn Wall & Co
1. Introduction and scope This document reports on analysis work carried out by Eamonn Wall & Co on behalf of the National Forest Company. The report is an update of the Resource Quantification Report produced in 2004. The key tasks which this report seeks to address are: (i) Information on the amount of new woodland (planted after 2003) within The National
Forest. (ii) Revised information concerning the age class distribution and type of the new and
existing woodland (iii) The amount (in terms of hectares) of the overall and utilisable woodland resource. (iv) Modelled information on the growth and yield of woodland within The National Forest
and the amount of yield (m3/year) that could be sustainably harvested over the next 5, 10, 15, 20 and 25 years time.
(v) Consideration of the availability of resources for a hypothetical wood-chip powered heating system based at the National Forest Company offices and estimates of the number of small installations (100kw) which can be supported by wood-chips sourced from the Forest in future years.
Each section of the report details the analysis of the above items. The final summary section draws together the key results and tables from each section. It should be noted that all the figures calculated and derived in this report relate to the technically feasible potential of the forest resource. They do not make any allowance for willingness of owners to manage their woodlands or availability of the necessary expertise to do so to achieve the technical potential. Neither do they take account of the economics of management or the availability of markets.
1

Quantification of the Forest Resource (Main Report) Eamonn Wall & Co
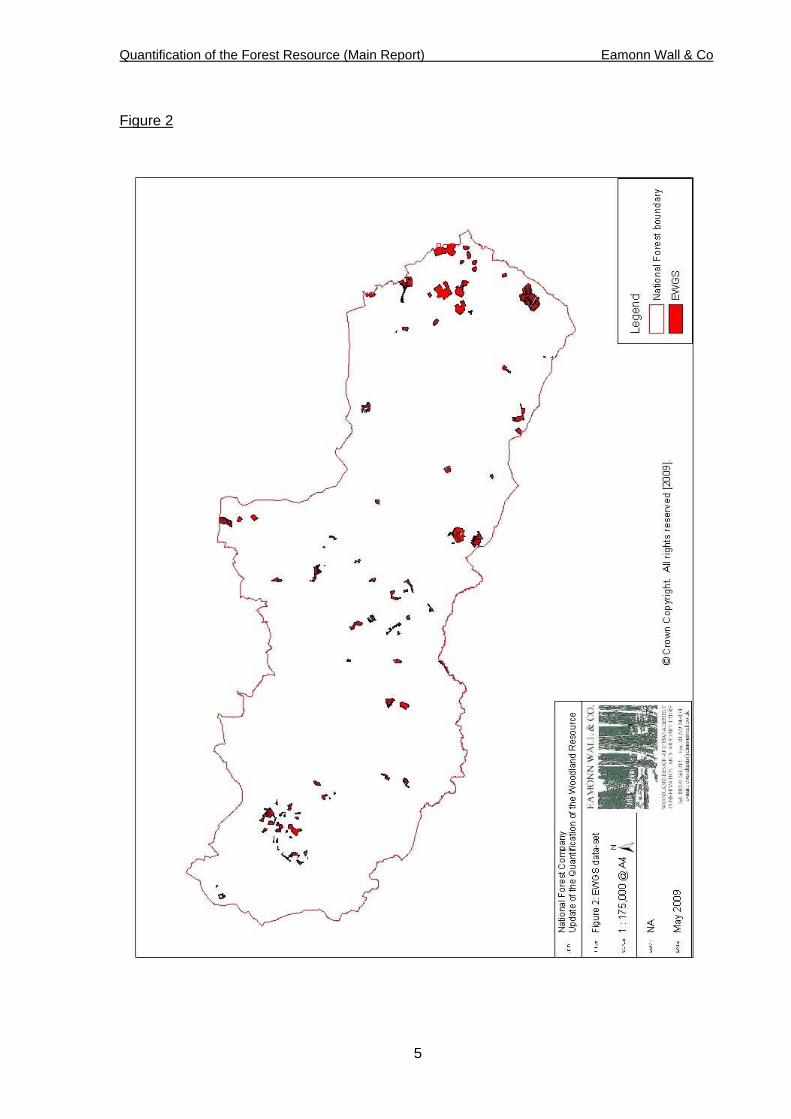
2. Input data There are several key datasets that provide input to the project, most provided in GIS format. Each was examined in the context of the others to determine what information it could contribute. All data-sets contained only data within The National Forest boundary. GIS analysis was undertaken using ArcView 9.2. 2.1 NIWT-plus This is a dataset created during the 2003 project, which combined information from the NIWT and 2004 NFC existing woodlands datasets. In 2003 it was believed to be the best estimate at the time of woodland cover in the National Forest. It contains 1259 items and has a total polygon area of 5586ha. The NIWT-plus dataset is shown in Figure 1. As this data was believed to be the best estimate of woodland cover at that time it was not analysed. The data-set was however used to overlay other data-sets to ensure duplication of polygons was avoided. 2.2 WGS3 dataset This was provided by the Forestry Commission, and contains scheme outlines for WGS contracts from February 2004 to July 2005. Polygon sizes range from 0.1 to 85.9ha with a total polygon area of 1823ha. The data-set contains no information on type of woodland, but does hold brief details of the type of scheme i.e. new planting, restocking, thinning, felling etc. For young woodlands, a negligible area of 4ha was found to not coincide with other polygons. This data-set was also used in the 2004 report and its distribution in relation to NIWT-plus is shown in Figure 1. 2.3 Woodlands This dataset was supplied by NFC in GIS format, and shows outlines of woodlands in The National Forest. The data-set has been up updated since 2003 to include new woodlands and previously unrecorded areas of woodland, identified from aerial photographs and other records. Whereas the 2003 data-set contained 405 items down to 0.11ha, with a total area of 3383ha, the revised data-set contains 762 records, totalling 6444ha down to a minimum of 0.01ha. The data-set is shown in Figure 2. There is considerable overlap with the NIWT-plus and WGS3 data-sets. 2.4 NFC Tender Scheme spreadsheet This non-GIS data supplied by the NFC holds all records of new planting undertaken via the former National Forest Tender Scheme (NFC TS). The data shows that a total of 192 sites were planted under the TS, with a total area of 3635ha. 2.5 FC EWGS data This data-set was also provided by the Forestry Commission and covers the period April 2006 to February 2009. The data-set holds 221 records, totalling 889ha with a minimum area of 0.02ha and maximum of 61ha.
2

Quantification of the Forest Resource (Main Report) Eamonn Wall & Co
3
The data-set does not hold details on operations, but does differentiate between the six strands of the EWGS: woodland creation, woodland regeneration (restocking), woodland management, woodland improvement, woodland planning and woodland assessment. The data was filtered in the first instance to show only those records pertaining to woodland creation and restocking, then compared to the Woodlands data-set, with over-lapping polygons subsequently filtered out. The data-set is shown in Figure 3.

Quantification of the Forest Resource (Main Report) Eamonn Wall & Co
Figure 1
4
Quantification of the Forest Resource (Main Report) Eamonn Wall & Co
Figure 2
5

Quantification of the Forest Resource (Main Report) Eamonn Wall & Co
Figure 3
6

Quantification of the Forest Resource (Main Report) Eamonn Wall & Co
2.8 Definitions Within the following analysis, woodlands were divided into : • Established woodlands: Using a datum of 2009, established woodlands were assumed
to be at, or close to, the age at which they were becoming productive in terms of thinnings or felling, assumed to be at least 20 years old.
• Young woodland: Using a datum of 2009, young woodlands would not on average have reached the age of first thinning (ie. less than 20 years old), and thus are not currently productive.
7

Quantification of the Forest Resource (Main Report) Eamonn Wall & Co
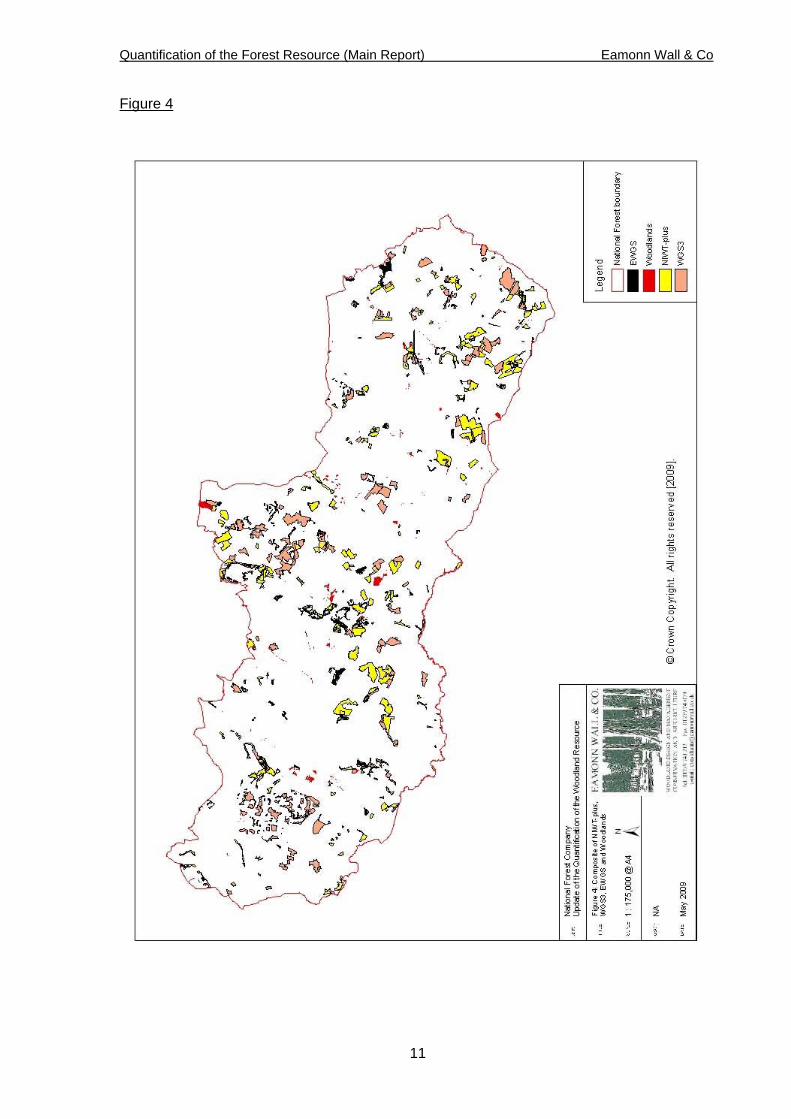
3. Young woodland 3.1 Area of young woodland The total area of young woodland at 2003 was estimated to be 3297ha. The NFC TS spreadsheet gives a total woodland area of 1097ha planted since 2003/04. Although the Woodlands data-set holds details of NFC woods, the total area was found to differ from that given in the NFC spreadsheet and therefore the latter source was used for this category of young woodland. The Woodlands data-set recorded planting dates and this permitted the filtering of young woodlands planted since 2003/04, outwith the NFC grants. Other unplanted or established sites were included in the Woodlands data-set, however detailed records combined with aerial photo analysis identified those polygons, allowing them to be removed from estimates of young woodland area. Woodland creation and restocking polygons from the EWGS data-set which did not coincide with Woodlands amounted to 94ha. It should be noted that 37ha of new planting was completed in March 2009 via the new Changing Landscapes Scheme (CLS), however this has not been included in any the report. Figure 4 shows the locations of the above data-sets for young woodlands. The final aspect to be taken into consideration is the migration of woodlands from the ‘young’ to ‘established’ categories since 2003. This was calculated using the following information: • Yield modelling in the 2004 report split the young woodlands into 5 year cohorts. • Two cohorts pre-dated 1995 i.e. cohorts 1987 and 1982, both with the same area,
accounting for all the pre-1995 woodlands. • The 1982 cohort (half of the pre-1995 woodland) will have migrated into the
‘established’ woodlands category, accounting for a loss of 310ha to the ‘young’ woodlands category.
The derivation of the total area of young woodlands is shown in Table 1. Table 1: Derivation of total area of young woodland. Dataset Ha Young woods area as at 2004 3297 NFC grant aided planting since 2003/04 1097 Woodlands post-03/04 data 175 EWGS new planting & restocking 94 Less 1987 cohort migration to established woods - 310 Total young woodland 4353 This shows an increase in area of young woodlands since 2003 of 1056ha. The total area of young woodlands can be split between pre-1995 and post-1995 woods, due to large differences in annual planting rate and woodland size. As the pre-1995 woodland area has been halved due to age-class migration, only 310ha remains. The remaining 4043ha comprises woodlands planted under the NFC grants, EWGS, WGS3 and other woodlands including landscaping, screening (identified from the Woodlands data-set).
8

Quantification of the Forest Resource (Main Report) Eamonn Wall & Co
Table 2: Breakdown of young woodland by age class. Young woodlands category
Area (ha) % of young woodland
Estimated average annual planting
rate (ha/yr) Pre-1995 310 7 62 Post-1995 4043 93 289 Total 4353 100 351 3.2 Species composition of young woodland Information on the break-out between broadleaved and conifer planting prior to 1995 is not available. The assumptions used in the 2004 report (i.e. a 50/50 split) has been used. Analysis of the NFC data indicated an average split of 85% broadleaves to 15% conifers, and this has been applied to all post-1995 woodlands. Table 3: Detailed breakdown of young woodland Category Total
area (ha)
Species % by area
Area (ha)
Years in period
Ave. annual planting rate (ha/yr)
Broadleaves 50 155 5 31 Pre-1995 (1989 – 1995)
310 Conifers 50 155 5 31 Broadleaves 85 3437 14 246 Post-1995
(1995 – 2009) 4043
Conifers 15 606 14 43 Total 4353 4353 351 3.4 Area-class distribution of young woodland The area-class distribution of pre-1995 woodland (in terms of woodland numbers and areas per age-class) has been assumed to remain unchanged. The only change is to the total area, representing the migration of 310ha out of the age-class. The age-class distribution (see Table 4 and Figure 5) indicates a large area of medium-sized woods. The smallest woods (0-2ha) are greatest in number but represent the smallest contribution to the total woodland area. Table 4: Estimated area class distribution of pre-1995 young woodland
Area range (ha) % of woodland number
% of woodland area Area of woodlands (ha)
0-2 54 4.7 15 2- 5 12 6.4 20
5 - 10 12 14.1 44 10 - 20 6 33.2 103 20 - 50 3 20.1 62
50 - 100 2 21.5 66 100+ 0 0.0 0 Total 100 100 310
Post-2003 woodland areas from the Woodlands, EWGS and NFC data-sets were collated and analysed independently of the existing post-1995 data, which would remain unchanged. The area per age-class from the post-2003 data was added to the post-1995 data.
9

Quantification of the Forest Resource (Main Report) Eamonn Wall & Co
Percentage of woodland number was taken to be the average values of the two periods of data. Similarly to the pre-1995 woodlands, the smallest area class exhibits a high number of woods but a very low area (see Table 5), accounting for only 2.3% of the post-1995 young woodland area. The general trend is a skewed bell-shaped curve (see Figure 6), with a large number of larger woods. The 20-50ha area range has increased the most compared to the pre-1995 young woodlands, suggesting that the introduction of the NF grants encouraged the establishment of larger woods. Table 5: Estimated area class distribution of post-1995 young woodland
Area range (ha) % of woodland number
% of woodland area Area of woodlands
0-2 30 2.3 87 2- 5 15 4.8 172
5 - 10 20 13.5 532 10 - 20 17 22.7 928 20 - 50 15 41.3 1691
50 - 100 3 15.4 633 Total 100 100 4043
10
Quantification of the Forest Resource (Main Report) Eamonn Wall & Co
Figure 4
11

Quantification of the Forest Resource (Main Report) Eamonn Wall & Co
4. Established woodland 4.1 Area of established woodland The 2004 data for established woodlands was used as base data for this exercise. Factored in was the migration of 310ha from young woodlands and 68ha of clear-fells, identified from EWGS data. Mixed woodland was taken to be a 50%/50% mix between broadleaves and conifers. The area of mixed woodland has been split between broadleaved and coniferous categories to give a total estimate of those areas, as demonstrated in Table 6. Table 6: Detailed breakdown of established woodland
Data source
Woodland type 2004 data
Cohort migration
Less clearfells Subtotal
Adjust for mixed
% by area
Established Broadleaved woodland area (ha)
2137 155 34 2258 2651 70%
Established Coniferous woodland area (ha)
620 155 34 741 1134 30%
Established mixed woodland area (ha) 786 0 786 0
Total established woodland 3543 310 68 3785 3785 100
Broadleaved woodland can clearly be seen to dominate, covering an estimated 70% of the gross woodland area. Established woodland can be seen to have increased in area by 242ha since 2004, this figure representing the net effect of age-class immigration (young woods growing older) and emigration (clear-fell and restock). 4.2 Area distribution of established woodland The 2004 established woodland data was used as the base data. Added to this was the net migration of 242ha between young and established woodlands. As the 242ha is a theoretical application of data, no individual woodland size data exists. The percentage distribution of woodland by area class was applied to the incoming 242ha and the resultant area added to each area class (see Table 7 and Figure 7).
12

Quantification of the Forest Resource (Main Report) Eamonn Wall & Co
Table 7: Size distribution of established woodland Area range
(ha) % of number of woodlands
% of woodland area Area of woodlands
(ha) 0-2 33% 5% 196 2- 5 30% 11% 428
5 - 10 18% 15% 570 10-20 10% 17% 617 20-50 4% 16% 592
50-100 3% 29% 1114 100+ 2% 7% 268
Totals 100 100 3785 The table indicates that there is a large number of small woods, but only representing a small proportion of the total established woodland area. The total area within each of these area classes forms a broad bell-shaped curve as seen in Figure 7. The 50-100ha area class has a notably high area and comprises only a very small number of woods. Figure 5: Area distribution of pre-1995 young woodlands by area
0
20
40
60
80
100
120
0-2ha 2-5ha 5-10ha 10-20ha 20-50ha 50-100ha
Area class (ha)
Are
a (h
a)
Figure 6: Area distribution of post-1995 young woodland by area
0
100
200
300
400
500
600
0-2ha 2-5ha 5-10ha 10-20ha 20-50ha 50-100ha
Area class (ha)
Are
a (h
a)
13

Quantification of the Forest Resource (Main Report) Eamonn Wall & Co
Figure 7: Area distribution of established woodland by area
0
200
400
600
800
1000
1200
0-2ha 2-5ha 5-10ha 10-20ha 20-50ha 50-100ha 100+ha
Area class (ha)
Are
a (h
a)
14

Quantification of the Forest Resource (Main Report) Eamonn Wall & Co
5. Summary of existing woodland 5.1 Summary of Data The data from previous sections were combined in the summary in Table 8. The gross area is converted to a net planted area using an estimate of percentage planted to account for open ground within the woodland boundaries: • For young woodland planted under the NFC grants, EWGS and WGS3 it is assumed
that the typical net planted area of these woods would be 80% (e.g. 20% open ground). • For established woodland, the same percentage is applied as in the 2004 report, given
that little will have changed: GIS polygons in the NIWT dataset tend to be quite closely defined around the woodland boundaries and do not contain much open ground. A percentage planted figure of 90% is therefore assumed, based on a visual estimate from the air photography
Table 8: Summary of existing woodland
Category Category totals (ha)
Species type
% of category
Gross area (ha)
% of NFC area (50425ha)
Estimated % planted
Net planted area (ha)
% of net woodland area
Broad-leaved
70 2651 5.3 90
2386 34.6 Established 3785
Conifer
30 1134 2.2 90 1021 14.8
Broad-leaved
50 155 0.3 80 124 1.8 Young pre-95
310
Conifer
50 155 0.3 80 124 1.8
Broad-leaved
81 3275 6.5 80 2620 38.0
Conifer
14 566 1.1 80 453 6.6
Young post-95
4043
Poplar
5 202 0.4 80 162 2.4
Total 8138
8138 16.2 6890 100
Table 8 indicates an increase in gross woodland area of 1298ha since 2004. Figure 8 shows the breakdown of gross woodland area as a pie chart. This clearly shows the following noteworthy facts: Broadleaved woodlands (young & established) dominate in the area, occupying a
proportion of 77% of the total against 23% for conifers, indicating a large shift towards broadleaves since 2004 (when broadleaves accounted for 70%).
Young woodlands now represent over half of the current woodland area, occupying 54% of the total, against 46% for established woodlands.
Post-1995 broadleaved planting has risen from 29% of the woodland area to 40%.
15

Quantification of the Forest Resource (Main Report) Eamonn Wall & Co
Figure 8: Breakdown of existing woodland by gross area
Pre-1995 broadleaved
2%
Post-1995 broadleaved
40%
Post-1995 conifer
7%
Pre-1995 conifer
2%
Poplar2% Established
broadleaved33%
Established conifer14%
5.2 Potential sources of data bias The biases highlighted in the 2004 remain, so this section seeks to indicate those biases which have occurred in the analysis of post-2003 data. It was considered that the NFCTS spreadsheet held the most detailed information. This data source does not however hold spatial data, preventing it from being interrogated via GIS. Woodlands data-set represented the next most complete source of information available and held records of most (but not all) NFC grant schemes. The data-set was updated as recently as March 2009 and includes previously unrecorded young woodlands. Descriptive records were also found to be accurate, having undertaken brief aerial photo analysis. Relatively minor contributions were made to the overall information available by the EWGS data-set. The most likely single largest source of bias lies in the migration of woodlands from young to established categories. The area is a theoretical area and assumes an even planting rate over the five year period of the cohort. Furthermore, no information is available regarding the area distribution of these woods. This cohort migration impacts on pre-1995 young woodlands and established woodlands. In the absence of hard data it is however a best estimate. In summary, it is likely that: Established woodland estimates are fairly accurate Young woodlands are considered to be fairly accurate.
The degree of inaccuracy is difficult to estimate. In general the data used were those that were known to be most up to date and reliable, and the methodology far advancing cohorts is consistent with the 2004 modelled projection.
16

Quantification of the Forest Resource (Main Report) Eamonn Wall & Co
6. Utilisable woodland resource Of the net planted area, only a certain proportion will be capable of utilisation. In calculating the utilisable area, several categories were excluded. These are listed below and where derived figures are not available, values assumed for each, based on experience: • Areas of woodland less than 2ha in size. The percentage of area in this category was
derived in the previous area distribution analyses for each of young and established woodland.
• Areas of shrubs and unproductive species • Areas without management potential, e.g. conservation or amenity planting that it would
not be desirable or practical to manage for wood or timber output • Areas which may fail to establish. Table 9: Utilisable woodland area : Detailed breakdown
Species type
Net planted
area (ha)
% greater
than 2ha
% area of productive
species
% area with management
potential
% area not
failed
Compound %
Utilisable area (ha)
Broad-leaved
2386 95 90 80 100 68 1632 Established
Conifer
1021 95 100 90 100 86 873
Broad-leaved
124 95 90 90 95 73 91 Young pre-95
Conifer
124 95 100 100 98 93 115
Broad-leaved
2620 97 90 90 95 75 1956
Conifer
453 97 100 100 98 95 431
Young post-95
Poplar
162 97 100 100 98 95 154
Total
6890 76 5252
From Table 9 it can be calculated that the total utilisable area of 5252ha is on average 76% of the net planted area, and 65% of the gross woodland area. It is worth reiterating that the utilisable area does not take into account willingness or ability of owners to manage their woodlands in a productive way, and also does not consider the economics of management. It is intended solely as an estimate of technical potential. It is worth commenting that the total area of woods less than 2ha is 283ha. Collectively, this area-class can potentially make a reasonable contribution to woodchip and log supply if markets are strong (providing sufficient incentive to the woodland owners), although this is tempered by the fragmented distribution of such woods, impacting on logistics.
17

Quantification of the Forest Resource (Main Report) Eamonn Wall & Co
7. Modelling of yield 7.1 Young woodlands – General approach Although the young woodlands were, by definition, not productive in 2009, many of them would become so during the subsequent 25 years. The general approach used was to divide the utilisable area of young woodlands into age-classes (or cohorts) each covering 5 years (see Table 10). Each cohort is identified by its middle planting year. For instance, the 1997 cohort contains woodlands planted in the 5-year period from 1995 to 1999 inclusive. To assign an area to each cohort an average rate of establishment was assumed over the periods defined. The period is the number of years that the utilisable area category is assumed to cover (i.e. young woodlands category spans a period of 19 years). Due to the difference in average annual planting rates before and after 1995, Table 10 splits the young woodlands into pre and post 1995 categories. Table 10 shows the utilisable area per year that was assigned to each cohort. Table 10: Derivation of woodland area in each 5-year cohort
Species type
Utilisable area (ha)
Period (years)
Utilisable area
(ha/yr)
Area per 5-year
cohort (ha)Broad-leaved
91 5 18.2 91 Young pre-95
Conifer
115 5 23.0 115
Broad-leaved
1956 14 139.7 699
Conifer
431 14 30.7 154
Young post-95
Poplar
154 14 11 55
Total
2747
Future cohorts have also been derived. For instance, conifer cohort 2013 (P-years 2010-2015) will yield its first thinning in the final modelled period. The utilisable area in future cohorts was calculated assuming that the average rate of establishment for broadleaves and conifers stays at its current rate. The assignment of cohorts is explicitly shown in Table 12. Note that the cohorts are defined in terms of utilisable area. For the purposes of future modelling, a number of 5-year periods have been defined. Each period is named by its middle year, and this year is the datum used when applying yield model data to each cohort. The final period is 2030 - 2034 (datum 2032). 7.2 Growth model for young broadleaves The key young broadleaves in The National Forest having productive potential were assumed to be mainly oak, ash, sycamore and birch. As no species breakdown is available a mean Yield Class (YC) of 6 was assumed, with 25 as the age of first thinning. These figures are based on averages from FC yield tables.
18

Quantification of the Forest Resource (Main Report) Eamonn Wall & Co
The yield for trees of productive age is assumed to be the marginal thinning intensity of 70% x YC6 = 4.2m3/ha/yr. This is the yield used in the model for each cohort once age 25 is reached. The annual yield data for the cohorts of young broadleaves are shown in Table 12, with modelled yields shown in Table 13. 7.3 Growth model for young conifers Discussion with local Forestry Commission offices suggested that the dominant conifer in The National Forest area is Corsican pine, and mean yield classes of 16-18 were quoted. To err on the side of caution a mean yield class of 16 was used in this study, with 20 years as the age of first thinning (based on FC yield tables). The yield for trees of productive age is assumed to be the marginal thinning intensity of 70% x YC16 = 11.2m3/ha/yr. This is the yield used in the model for each cohort once age 20 is reached. The annual yield data for the cohorts of young conifers are shown in Table 12, with modelled yields shown in Table 13. 7.4 Growth model for young poplars The inclusion of poplars in the model needs to be treated with care for several reasons: • Historically, planting of poplar has tended to be sporadic due to uncertainties over
markets and disease resistance. It is therefore difficult to predict future establishment rates.
• The early age of first thinning (10 years) means that cohorts up to 2022 (2020-2024) must be considered to calculate the yield for the period centred on 2032.
• The very high volume yields mean that relatively small amounts of poplar planting can have a significant impact on modelled figures. Consequently any error in the poplar figures causes a disproportionate degree of error in the woodland total.
Little confidence can be put in predictions of poplar establishment rates to the year 2032 given the above points. Therefore to err on the side of caution, only the two cohorts 1997 and 2002 have been included in the model. The following assumptions were made regarding growth, based on suggestions by NFC and information from the Poplar Tree Company: • Two-thirds of each cohort was established at final spacing of 8m x 8m and will not be
thinned. A yield class 14 is assumed and felling will occur at year 25. FC yield tables predict approximately 300 m3/ha on felling.
• One third of each cohort was established at 4m x 2m spacing, and a 50% thin carried out at years 7, 11 and 14 to leave 8m x 8m spacing at the final felling at age 25.
Table 11 shows the yields expected from the thinned case, as supplied by the Poplar Tree Company. In the model, the year 7 and 11 felling have been included as a combined yield for year 10. The year 14 felling is shown at year 15.
19

Quantification of the Forest Resource (Main Report) Eamonn Wall & Co
20
Because FC yield models for poplar were defined at wide spacing, the effective yield classes attainable at closer spacing can be much higher, and usually in excess of YC20. For the 4m x 2m portion of each cohort, an effective yield class of 20 is obtained. The annual yield data for the cohorts of poplars are shown in Table 12, with modelled yields shown in Table 13. Table 11: Poplar yields, 4m x 2m initial spacing Operation Age of
thinning m3/ha Nominal age in
model to which yield attributed
m3/ha cohort m3/ha/yr
Thin 1 7 28 10 106 21.2 Thin 2 11 78 Thin 3 14 80 15 80 16 Fell 25 300 25 300 60 Total yield 486 486

Quantification of the Forest Resource (Main Report) Eamonn Wall & Co
Table 12: Assignment of cohorts for modelling of yield from young trees Broadleaves Conifers PoplarsYear Ave.
Utilisable ha/yr
Cohort Area (ha)
Year Ave. Utilisable
ha/yr
Cohort Area (ha)
Year Ave. Utilisable
ha/yr
Cohort Area (ha)
2014 140 2014 31 2004 11 2013 140 2013 31 2003 11 2012 140 2012 700 2012 31 2012 155 2002 11 2002 55 2011 140 2011 31 2001 11 2010 140 2010 31 2000 11 2009 140 2009 31 1999 11 2008 140 2008 31 1998 11 2007 140 2007 700 2007 31 2007 155 1997 11 1997 55 2006 140 2006 31 1996 11 2005 140 2005 31 1995 11 2004 140 2004 31 2003 140 2003 31 2002 140 2002 700 2002 31 2002 1552001 140 2001 31 2000 140 2000 31 1999 140 1999 31 1998 140 1998 31 1997 140 1997 700 1997 31 1997 1551996 140 1996 31 1995 140 1995 31 1994 18 1994 23 1993 18 1993 23 1992 18 1992 90 1992 23 1992 1151991 18 1991 23 1990 18 1990 23
21

Quantification of the Forest Resource (Main Report) Eamonn Wall & Co
22
Table 13:Modelled yields for cohorts of young trees Modelling of young broadleaves Datum range 2007 2012 2017 2022 2027 2032
2005-2009 2010-2014 2015-2019 2020-2024 2025-2029 2030-2034 Cohort Area
(ha) Age m3/ha/yr m3/yr Age m3/ha/yr m3/yr Age m3/ha/yr m3/yr Age m3/ha/yr m3/yr Age m3/ha/yr m3/yr Age m3/ha/yr m3/yr
2012 700 0 0 0 0 0 0 5 0 0 10 0 0 15 0 0 20 0 0 2007 700 0 0 0 5 0 0 10 0 0 15 0 0 20 0 0 25 4.2 2940 2002 700 5 0 0 10 0 0 15 0 0 20 0 0 25 4.2 2940 30 4.2 2940 1997 700 10 0 0 15 0 0 20 0 0 25 4.2 2940 30 4.2 2940 35 4.2 2940 1992 90 15 0 0 20 0 0 25 4.2 378 30 4.2 378 35 4.2 378 40 4.2 378 Total 0 0 378 3318 6258 9198
Modelling of young conifers Datum range 2007 2012 2017 2022 2027 2032
2005-2009 2010-2014 2015-2019 2020-2024 2025-2029 2030-2034 Cohort Area
(ha) Age m3/ha/yr m3/yr Age m3/ha/yr m3/yr Age m3/ha/yr m3/yr Age m3/ha/yr m3/yr Age m3/ha/yr m3/yr Age m3/ha/yr m3/yr
2012 155 0 0 0 0 0 0 5 0 0 10 0 0 15 0 0 20 11.2 1736 2007 155 0 0 0 5 0 0 10 0 0 15 0 0 20 11.2 1736 25 11.2 1736 2002 155 5 0 0 10 0 0 15 0 0 20 11.2 1736 25 11.2 1736 30 11.2 1736 1997 155 10 0 0 15 0 0 20 11.2 1736 25 11.2 1736 30 11.2 1736 35 11.2 1736 1992 115 15 0 0 20 11.2 1288 25 11.2 1288 30 11.2 1288 35 11.2 1288 40 11.2 1288 Total 0 1288 3024 4760 6496 8232
Modelling of poplars Datum range 2007 2012 2017 2022 2027 2032
2005-2009 2010-2014 2015-2019 2020-2024 2025-2029 2030-2034 Cohort Area
(ha) Age m3/ha/yr m3/yr Age m3/ha/yr m3/yr Age m3/ha/yr m3/yr Age m3/ha/yr m3/yr Age m3/ha/yr m3/yr Age m3/ha/yr m3/yr
Unthin ned 2002 55 5 0 0 10 0 0 15 0 0 20 0 0 25 60 3300 5 0 0 1997 55 10 0 0 15 0 0 20 0 0 25 60 3300 5 0 0 10 0 0
Thinned 2002 55 5 0 0 10 21 1155 15 16 880 20 0 0 25 60 3300 5 0 0 1997 55 10 21 1155 15 16 880 20 0 0 25 60 3300 5 0 0 10 21 1155 Total 1155 2035 880 6600 6600 1155

Quantification of the Forest Resource – Update Report Eamonn Wall & Co
7.5 Established woodlands The yield modelling of established woodlands assumes an approximately even age class distribution. This means that both thinning and felling are ongoing, and the overall woodland area is constant. Hence in ideal circumstances potential annual yield per hectare, when averaged over the whole utilisable area, could be equal to the Yield Class. In reality, there may be various factors that may prevent this from being achieved, even if all owners were willing to attempt management. In particular, previous under-management would be likely to constrain what may be achieved. This has been modelled as a management efficiency, as indicated in Table 14. Although its values are estimates it is thought likely that mature broadleaved stands will suffer most from under-management. The likely yields are constant, as the overall area of woodland remains constant. Table 14: Modelled yield from established woodlands Species Mean
YC Utilisable area (ha)
Potential yield (m3/yr)
Management efficiency
Likely yield (m3/yr)
Broadleaves 6 1632 9792 75 7344 Conifers 16 873 13968 90 12571 Total 23760 19915 7.6 Summary of yield data Table 15 summarises the yield information from both young and established woodlands, and data are illustrated in Figure 9. Table 15: Summary of yield data (m3/yr)
Datum Species 2007 2012 2017 2022 2027 2032 Established broadleaves
7344 7344 7344 7344 7344 7344
Established conifers 12571 12571 12571 12571 12571 12571 Young broadleaves 0 0 378 3318 6258 9198 Young conifers 0 1288 3024 4760 6496 8232 Poplars 1155 2035 880 6600 6600 1155 Total 21070 23238 24197 34593 39269 38500 Several points of interest can be drawn from this: The current yield (for 2009) would be as per the modelled year 2007, and is based on
the contribution from established woodlands and poplars, totalling 21070 m3/yr. Established conifers provide the single greater part of the current yield potential (42%).
This is mainly due to the higher mean yield class for conifers, despite the greater net area of established broadleaved woodland.
Over the modelled period the total potential yield almost doubles to 38500 m3/yr as cohorts of young planting reach the age of first thinning.
Young conifers provide yield in greater quantity and sooner than broadleaves, despite the larger net area of young broadleaves in the model. This is mainly due to their higher yield class.
23

Quantification of the Forest Resource – Update Report Eamonn Wall & Co
The contribution from young conifers is first apparent in 2012, as the 1992 cohort reaches productive age (20 years). However, it only begins to become significant in 2022, when the enhanced planting rates of the 2002 cohort reach age 20.
The contribution from young broadleaves is first apparent in 2017, as the 1992 cohort reaches productive age (25 years). However, it only begins to become significant in 2027, when the enhanced planting rates to the end of the 2007 cohort reach age 25.
Poplars make a significant contribution in 2012, when the post-1995 plantings begin to reach felling age at 25 years. The yield falls in 2017 as poplar sites are restocked. Due to their high yield rates, their contribution to yield is large (10%) compared to their contribution to gross woodland area (2%).
Figure 9 : Potential yield projection
Potential yield projection
05000
1000015000200002500030000350004000045000
2007 2012 2017 2022 2027 2032
Year
Yiel
d (m
3/ye
ar) Poplars
Young conifersYoung broadleavesEstablished conifersEstablished broadleaves
24

Quantification of the Forest Resource – Update Report Eamonn Wall & Co
8. Availability of resources for a wood-chip power system 8.1 General approach The aim of this part of the study was to assess the resources available within the National Forest for a hypothetical woodchip heating system, based at the National Forest Company offices. This calculation was based on a modified version of a simple model presented by Austin Brady (East Midlands Conservator, FC) in a conference paper entitled ‘Woodland & Energy Crops – Resources in the East Midlands: An assessment of the supplies of wood fuel that can be produced in the East Midlands’ at Beaumanor Hall, 22/2/03. This model was based on the following assumptions: Woodfuel supplies would be a by-product of thinnings. Thinning would take place at the marginal intensity (70% of YC / year) For conifers, 20% of yield would on average be available as woodchip, with other
products making up the remainder. For broadleaves, 50% of yield would on average be available as woodchip, with other
products making up the remainder. For conifers, 0.44 dry tonnes are obtainable per m3 of timber. For broadleaves, 0.57 dry tonnes are obtainable per m3 of timber.
The conversion factors from m3 to dry tonnes were derived from the calculations in Brady’s paper, although he did not quote them explicitly. They refer to oven-dry weight. In the analysis below, only the established woodland would contribute to the currently available (2007 datum range) woodfuel resource. As we look forward to future modelled periods, then the thinnings from cohorts of young trees start to make a contribution, and this has also been modelled. Figure 10 shows the woodlands within the National Forest as represented by the NIWT-plus, WGS3, EWGS and Woodlands data-sets (both established and young woodlands). 8.2 Contribution from existing woodland The area of established utilisable woodland within the National Forest is 1632ha for broadleaves and 873ha for conifers, as indicated in Table 9 in Section 6. Substantial areas of woodland lie adjacent or close to the National Forest (Duchy of Lancaster woodland in Needwood and Charnwood Forest) which could potentially add to the projected resource, however these have not been included in the calculations. The process used by Brady (see above) was used to calculate the potential yield of dry tonnes per year and per day: An average per hectare yield of 70% of yield class per year is assumed, and percentage woodfuel proportion is applied. This process is shown in Table 16. The woodfuel proportion percentages are those used by Brady, and the dry tonnes/m3 conversion factor is derived from his figures.
25

Quantification of the Forest Resource – Update Report Eamonn Wall & Co
Figure 10
26

Quantification of the Forest Resource – Update Report Eamonn Wall & Co
Table 16: Woodfuel yield from established woodlands Woodland type
Utilisable area (ha)
YC Thinning intensity (% of YC)
% woodfuel
proportion
Woodfuel yield
(m3/yr)
Dry tonnes/
m3
Dry tonnes/
yr
Dry tonnes/
day Broad-leaved
1632 6 70 50 3427 0.57 1954 5.4
Conifer 873 16 70 20 1956 0.44 860 2.4 Total 2505 5383 2814 7.7 Table 16 shows that the established woodlands’ yield of dry tonnes of woodfuel is dominated by material from broadleaved woodlands (70%). This figure is down from 75% in 2003, likely due to the removal from analysis of woods outside the National Forest which had a high broadleaved composition. 8.3 Contribution from young trees Some of the cohorts of young trees will reach the age where their thinnings will be available for use as fuel within the 25-year timescale of this analysis. This was dealt with separately for broadleaves and conifers, tables 17 and 18 show the calculation of woodfuel yield from young broadleaves and conifers respectively. A woodfuel proportion is applied to the total yield to give a woodfuel yield. In Brady’s paper a woodfuel proportion was chosen that was intended to reflect the surplus low value material averaged over thinnings from all age classes of established woodlands (20% for conifers, 50% for broadleaves). In the calculation of woodfuel yield from young trees a much high proportion has initially been chosen, which fall of with time. This is because the earlier periods contain only cohorts at point of first thinnings, which will contain a much higher proportion of material suited for woodfuel (e.g. less likely to be suited for other markets). As the analysis progresses, the earlier cohorts are becoming older and so correspondingly more of their thinning yield will be available for other markets. Hence the woodfuel proportion gradually declines towards the average for established woodlands. Finally, Brady’s conversion factors are used to convert the yield in m3/yr into dry tonnes/yr and then into dry tonnes/day. Table 17: Woodfuel yield from young broadleaves
Datum range 2007 2012 2017 2022 2027 2032
Yield in whole NF area (m3/yr) 0 0 378 3318 6258 9198 Woodfuel proportion % 0 0 100 90 80 70 Woodland fuel yield (m3/yr) 0 0 378 2986 5006 6439 Dry tonnes/m3 0.57 0.57 0.57 0.57 0.57 0.57 Dry tonnes/yr 0 0 215 1702 2854 3670 Dry tonnes/day 0 0 0.6 4.7 7.8 10.1
27

Quantification of the Forest Resource – Update Report Eamonn Wall & Co
Table 18: Woodfuel yield from young conifers Datum range
2007 2012 2017 2022 2027 2032 Yield in whole NF area (m3/yr) 0 1288 3024 4760 6496 8232 Woodfuel proportion % 0 70 60 50 40 30 Woodland fuel yield (m3/yr) 0 901.6 1814 2380 2598 2470 Dry tonnes/m3 0.44 0.44 0.44 0.44 0.44 0.44 Dry tonnes/yr 0 397 798 1047 1143 1087 Dry tonnes/day 0 1.1 2.2 2.9 3.1 3.0
8.4 Summary of potential woodfuel availability Tables 19 and 20 sum the contributions to woodfuel yield of established and young woodlands and these data are illustrated in Figure 11. The contribution from existing woodlands stays constant, with the increment in later years being due to thinnings from the young woodland cohorts. The following observations can be made: Today’s potential resource of 7.7 dry tonnes/day could be expected to almost triple to
20.7 dry tonnes/day based on this model. This shows that by 2032, 63% of potential production could come from young woodlands (vs 37% from existing woodlands). This figure is down from 67% for 2027 as modelled in the 2004 report, and can be attributed to the exclusion of non-National Forest woods which have a high broadleaved component and the migration of the 1987 cohort into the established woods age-class..
As discussed in section 8.2, broadleaves contribute 70% to the 2007 (i.e. potential current) fuelwood yield.
Young conifers start to make a contribution from first thinnings in 2012 (1992 cohort reaches 20 years of age). This becomes significant quite early on, nearly equalling the contribution from existing conifers by 2017. This is due to the assumed high fuelwood percentage of early thinnings.
Young broadleaves begin to make a contribution from first thinnings in 2017 (1992 cohort reached 25 years of age). By 2022 they have significantly outstripped the yield from young conifers and are approaching a similar level to the yield from established broadleaves. This is a combination of the greater planting rate of broadleaves and the higher fuelwood yield.
By 2032, potential fuelwood yield from young broadleaves provide the greatest contribution to the total, at 48%. The next biggest contributors are established broadleaves at 26% and young conifers at 14%.
Table 19 : Summary of potential woodfuel availability (dry tonnes/year)
2007 2012 2017 2022 2027 2032 Established broadleaves
1954 1954 1954 1954 1954 1954
Established conifers 860 860 860 860 860 860 Young broadleaves 0 0 215 1702 2854 3670 Young conifers 0 397 798 1047 1143 1087 Total 2814 3211 3828 5563 6811 7571
28

Quantification of the Forest Resource – Update Report Eamonn Wall & Co
Table 20: Summary of potential woodfuel availability (dry tonnes/day)
2007 2012 2017 2022 2027 2032 Established broadleaves
5.4 5.4 5.4 5.4 5.4 5.4
Established conifers 2.4 2.4 2.4 2.4 2.4 2.4 Young broadleaves 0.0 0 0.6 4.7 7.8 10.1 Young conifers 0.0 1.1 2.2 2.9 3.1 3.0 Total 7.7 8.8 10.5 15.2 18.7 20.7 Figure 11 : Potential woodfuel yield projection
0.0
5.0
10.0
15.0
20.0
25.0
2007 2012 2017 2022 2027 2032
Year
Yiel
d (d
ry to
nnes
/day
) Young conifers
Young broadleaves
Established conifers
Establishedbroadleaves
It should be noted that due to uncertainties regarding the future establishment rates and markets for poplar, they have not been included in the woodfuel model. However, it is likely that woodfuel may provide an excellent market for first thinnings of poplar. Should the market for woodchip strengthen, there arises opportunities for the harvesting of mature woods with poor quality stock, thereby increasing yield over and above that modelled from thinnings. Conversely, should the market for lower quality logs (such as pallet wood) strengthen, the potential chipwood yield (particularly amongst later thinnings and mature woods of poor quality tree stock) may fall as lower quality tree stock is redirected towards other products. Based on information from the Lovat Arms Hotel, Inverness, their 100kW wood-chip boiler requires 100t of wood-chips per year (0.27t/day). Should wood-chip systems of similar size be implemented in the National Forest, the potential wood-fuel resource would be sufficient to supply up to 10 such systems in the 2007 datum range, 32 in 2012, 38 in 2017, 55 in 2022, 68 in 2027 and 75 in 2032.
29

Quantification of the Forest Resource – Update Report Eamonn Wall & Co
9. Summary The purpose of this section is to clarify the key results relating to the key areas in the study, as listed in section 1. To this end, it summarises the results from the previous analyses, and refers to the relevant Tables and Figures where appropriate. It should be reiterated that all the figures calculated and derived in this report relate to the technically feasible potential of the forest resource. They do not make any allowance for willingness of owners to manage their woodlands or availability of the necessary expertise to do so to achieve the technical potential. Neither do they take account of the economics of management or the availability of markets. (i) Information on the amount of existing (pre-1995) and new (planted after 1995)
woodland within The National Forest. Table 21 summarises the key results for the amount of woodlands, divided into pre- and post-1995. The balance between categories has changed considerably since 2003, moving from a 61%/39% split to a 50%/50% split. This is due to a sustained period of woodland creation, heavily out-weighing the migration of woods between age-classes. This is due, in part, to the high rate of planting under the National Forest Company Tender Scheme from 1995 to 2007. Further detailed analysis and interpretation of this data is given in sections 3, 4 and 5; Tables 1 to 8; and Figures 5 to 8. Table 21: Summary of amount of existing woodland pre-1995 and post-1995 Gross
woodland area (ha)
% of area % of NF area
Pre-1995 woodland (young and established)
4095 50% 8.1%
Post 1995 woodland 4043 50% 8.1% Total 8138 100% 16.2% (ii) Information concerning the age class distribution and type of the new and existing
woodland The detailed analysis divides the woodland into 3 categories and Table 22 summarises the key results concerning the breakdown of age class between them. Established woodlands (at productive age) – The category was assumed to have been
planted before 1985, and is assumed for the purposes of this study to have an even age-class distribution.
Young pre-1995 woodlands - not at productive age as at 2009, planted 1990-1994. Young post-1995 woodlands - not at productive age, planted 1995 onwards
Table 22: Summary of age class distribution
Category Gross area (ha) % area
Established (planted pre-1985) 3785 47Young (pre-1995) 310 4Young (post-1995) 4043 49Total 8138 100
30

Quantification of the Forest Resource – Update Report Eamonn Wall & Co
Due to the rapid rate of establishment in recent years, the age class distribution is heavily skewed towards the post-1995 young woodlands, now accounting for 49% of the total woodland area (against 39% in 2004). The summary breakdown by woodland type is shown in Table 23. In both pre- and post-1995 woodlands, it can be seen that broadleaves occupy the greater gross area. This is particularly the case for the post-1995 woodlands. It was assumed that the area poplar plantations were negligible before 1995, but that 5% of post-1995 planting was poplar. Table 23: Summary of woodland type
Category Species type Gross area (ha)
% of area % of NFC area (50425ha)
Pre-1995 woodlands Broad-leaved 2806 34.5 5.6 Conifer 1289 15.8 2.6
Post 1995 woodlands Broad-leaved 3275 40.2 6.5 Conifer 566 7.0 1.1 Poplar 202 2.5 0.4
Total 8138 100 16.2 Further detailed analysis and interpretation of this data is given in sections 3, 4 and 5; Tables 1 to 8; and Figures 5 to 8. (iii) The amount (in terms of hectares) of the overall and utilisable woodland resource. Table 24, shows the key results for overall and utilisable woodland resource. The quantities shown are: • The gross woodland area includes open ground within the woodland boundary. • The net planted area includes only trees (no open ground). • In calculating the utilisable area, the following categories were excluded:
- Areas of woodland less than 2ha in size - Areas of shrubs and unproductive species - Areas without management potential, e.g. conservation or amenity planting - Areas which may fail to establish.
Thus the utilisable area is that which could be expected to be productive according to a yield model-based system. Table 24: Summary of existing woodland
Category Species type Gross area (ha)
Net planted area (ha)
Utilisable area (ha)
Pre-1995 woodland Broad-leaved 2806 2510 1723 Conifer 1289 1145 988
Post 1995 woodland Broad-leaved 3275 2620 1956 Conifer 566 453 431 Poplar 202 162 154
Total 8138 6890 5252 The gross woodland area is 8138ha The net planted area of 6890ha is estimated on average to be 85% of the gross area.
31

Quantification of the Forest Resource – Update Report Eamonn Wall & Co
The technically utilisable area of 5252ha is estimated on average to be 65% of the gross area. This is down from 66% in 2004 and can be accounted for by the increase in young post-1995 broadleaved woodland, which has a low compound percentage reduction of 75% to ascertain utilisable area.
Further detailed analysis and interpretation of this data is given in sections 5 and 6, Tables 8 and 9; and Figure 8. (iv) Modelled information on the growth and yield of woodland within The National Forest
and the amount of yield (m3/year) that could be sustainably harvested over the next 5, 10, 15, 20 and 25 years time.
The method employed used a yield-class (YC) based model to look at potential production from the utilisable resource. This assumed: Broadleaves had a mean YC of 6, first thin 25 years Conifers (mainly Corsican pine) have a mean YC of 16, first thin 20 years Poplars are planted : 2/3 at 8mx8m no thin, YC 14, fell at 25 years
1/3 at 4mx2m, thinned, YC20, fell at 25 years
Current rates of planting were used to 2009 to model future yield. Table 25 is a reproduction of Table 15 and summarises the yield model results for five-year periods centred on the given years. Note that the young woodland categories include all currently (2009) unproductive woodlands (i.e. all planted since 1992). Table 25: Summary of yield projection (m3/yr)
Datum Species 2007 2012 2017 2022 2027 2032 Established broadleaves
7344 7344 7344 7344 7344 7344
Established conifers 12571 12571 12571 12571 12571 12571 Young broadleaves 0 0 378 3318 6258 9198 Young conifers 0 1288 3024 4760 6496 8232 Poplars 1155 2035 880 6600 6600 1155 Total 21070 23238 24197 34593 39269 38500 The current potential yield totals 21070 m3/yr. Established conifers provide the greater part of the current yield potential (60%). This is
mainly due to their higher YC, despite the greater area of broadleaved woodland. By 2032 the total potential yield almost doubles to 38500 m3/yr, as young woodlands
reach productive age. Further detailed analysis and interpretation of this data is given in section 7; Tables 10 to 15; and Figure 9. (v) Consideration of the availability of resources for a hypothetical wood-chip powered
heating system based at the National Forest Company offices. The woodfuel resource within the National Forest boundary was examined, and an estimate made of the potential woodfuel resource. The key model assumptions are that woodfuel supplies would be a by-product of thinnings and that these are at marginal intensity (70% of YC / year) of the utilisable resource. Assumptions were also made as to the proportion of
32

Quantification of the Forest Resource – Update Report Eamonn Wall & Co
33
yield that would be available as woodfuel, and this varied with both woodland type and age-class. Table 26 shows the summarised results of the model. Table 26 : Summary of potential woodfuel availability 2007 2012 2017 2022 2027 2032 Dry tonnes/yr 2814 3211 3828 5563 6811 7571 Dry tonnes/day 7.7 8.8 10.5 15.2 18.7 20.7 Key results are: Today’s potential resource of 7.7 dry tonnes/day could be expected to almost treble to
20.7 dry tonnes/day by 2032. By 2032, potential fuelwood yield from young broadleaves provide the greatest
contribution to the total, at 48%. The next biggest contributors are established broadleaves at 26% and young conifers at 14%.
Further detailed analysis and interpretation of this data is given in section 8; Tables 16 to 20; and Figure 11. It is estimated that the potential wood-fuel resource would be sufficient to supply up to 10 100Kw. systems in the 2007, 32 in 2012, 38 in 2017, 55 in 2022, 68 in 2027 and 75 in 2032. It is clear that adequate resources lie within the National Forest. The key issues in setting up an operational system are therefore likely to be either; technological, economic or logistical in terms of encouraging management of woodlands and securing a steady supply of suitable material.