quantification of low density lipoprotein and transferrin endocytic
TRANSCRIPT
INTRODUCTION
Various macromolecules that are vital for a cell’s proper func-tioning enter by receptor-mediated endocytosis (Goldstein etal., 1985; van Deurs et al., 1989; McGraw and Maxfield, 1991).In this process, ligands to be internalized bind to their specificreceptors on the plasma membrane and cluster in coated pits,which then pinch off into the cell as coated vesicles that delivertheir contents to early endosomes. Internalized macromole-cules in the early endosomes are sorted into one of two intra-cellular trafficking routes: (i) the lysosomally directedpathway, by which ligands such as low density lipoprotein(LDL) and
α2-macroglobulin end up in lysosomes via lateendosomes (Goldstein et al., 1985; Brown and Goldstein,1986; van Deurs et al., 1989; McGraw and Maxfield, 1991);and (ii) the recycling pathway, by which recycling proteinssuch as transferrin (Tf) and the LDL receptor (LDL-R) arerecycled back to the plasma membrane (van Deurs et al., 1989;Harford et al., 1991; McGraw and Maxfield, 1991).
The various endosomes involved in the sorting and traffick-ing of endocytosed molecules are generally considered to bedistinct, separate compartments, each with a different pH(McGraw and Maxfield, 1991). However, Hopkins et al. (1990)reported the existence of Tf-containing endosomes thatappeared as an extensive tubular reticulum in HEp2 humancarcinoma cells, and they proposed movement along thetubular reticulum as a basis for sorting. Tooze and Hollinsheadalso saw tubular endosomes in HEp2 cells, and confirmed thatthese tubules were early endosomes that were filled with afluid-phase label in ~30 minutes (Tooze and Hollinshead,1991). In contrast, van Deurs et al. (1993) found thatendosomes in HEp2 cells were mainly punctate, sphericalstructures. These observations raised questions as to how Tf istrafficked and sorted in HEp2 cells, and how environmentswith different pH values might be maintained along a tubularnetwork, if it existed (Warren, 1990).
Extensive work has been done to characterize the recyclingand lysosomally directed pathways in Chinese hamster ovary
2177
Numerous experiments on CHO cells have shown thatendosomes are composed of separate vesicular and tubulo-vesicular compartments, such as the sorting endosome, therecycling compartment, and the late endosome. However,Hopkins et al. (
Nature 346, 335-339, 1990) have reportedthat endosomes in HEp2 human carcinoma cells form anextensive tubular reticulum. To resolve their observationswith previous results from CHO and other cells, weexamined the sorting and intracellular transport of endo-cytosed macromolecules in HEp2 cells, using low densitylipoprotein (LDL) and transferrin (Tf) to probe the lyso-somally directed and recycling pathways, respectively. Flu-orescent LDL and Tf were observed with laser scanningconfocal microscopy to visualize simultaneously bothprobes’ sorting and subsequent post-sorting behavior inHEp2 cells. Quantifying the 3-dimensional cellular distrib-utions of fluorescent LDL and Tf, after a variety of pulse-chase schemes, gave the ligands’ trafficking rates.
Initially, both ligands appear in the same punctatesorting endosomes, and fingers of Tf start extending fromthese sorting endosomes. Tf rapidly leaves dual-labeled
sorting endosomes (t
G ~2.5 minutes) and enters a post-sorting recycling compartment from which it is recycledout of the cell (tG ~7 minutes). We present both morpho-logical and kinetic data supporting the existence of thesetwo separate compartments along the recycling pathway inHEp2 cells. LDL remains in punctate sorting endosomesthat eventually lose the ability to receive newly endocytosedLDL, and mature into late endosomes. The trafficking andsorting of Tf and LDL in HEp2 cells follow the samegeneral scheme as in CHO cells, indicating that the tubularendosomes previously seen may be the tubular parts of thesorting endosomes and recycling compartments in thesecells. We propose that the endosomes in the recyclingpathway of HEp2 cells, as in CHO cells, are composed ofshort-lived sorting endosomes, accessible to both Tf andLDL, and long-lived post-sorting recycling compartments,which contain Tf and recycling receptors but not LDL.
Key words: endocytosis, endosome, sorting, HEp2 cell, LDL, lowdensity lipoprotein, transferrin
SUMMARY
Quantification of low density lipoprotein and transferrin endocytic sorting in
HEp2 cells using confocal microscopy
Richik N. Ghosh, Dana L. Gelman and Frederick R. Maxfield*
Department of Pathology, Columbia University College of Physicians and Surgeons, Columbia University, 630 West 168th Street,New York, NY 10032, USA
*Author for correspondence
Journal of Cell Science 107, 2177-2189 (1994)Printed in Great Britain © The Company of Biologists Limited 1994

2178
(CHO) cells. Endocytosed macromolecules are delivered to anacidic (pH ~6) sorting endosome within 2 minutes, where theuncoupling of ligands from their receptors and sorting forproper delivery to the next cellular destination occur (Mellmanet al., 1986; Yamashiro and Maxfield, 1987; Sipe and Murphy,1987; Cain et al., 1989; Presley et al., 1993). Sortingendosomes in CHO cells, which contain newly endocytosedligands such as LDL, α2-macroglobulin and Tf, are punctateperipheral compartments with short tubular extensions(Yamashiro et al., 1984). Sorting occurs as an iterative frac-tionation of membrane components from volume (Dunn et al.,1989). Membrane-associated components in sortingendosomes such as Tf and lipids are then transported to arecycling compartment, presumably by small carrier vesicles(Dunn et al., 1989; Mayor et al., 1993). The recycling com-partment in CHO cells is a large, long-lived, condensed tubularstructure near the cell’s pericentriolar region. It is a distinctcompartment from sorting endosomes, is less acidic, andcontains sorted recycling material such as Tf, LDL receptorsand lipids from the sorting endosome (Yamashiro et al., 1984;Mayor et al., 1993; McGraw et al., 1993). The compartmentsthat contain molecules of the recycling pathway, such as Tf,are often classified as early endosomes (Schmid et al., 1988).Work on CHO cells has shown that the early endosome com-partment is composed of two separate and distinct organelles,the sorting endosomes and the recycling compartment.
Pulse-chase experiments with fluorescently labeled LDL orα2-macroglobulin in CHO cells showed that lysosomallytargeted ligands, which are released from their receptors byacidic pH, accumulated in the bulk volume of sortingendosomes, which eventually stopped receiving freshly endo-cytosed material and matured into late endosomes (Salzman andMaxfield, 1989; Dunn and Maxfield, 1992). Thus, the deliveryof lysosomally directed material to late endosomes occurs by aprocess in which the short-lived sorting endosomes form andthen mature into late endosomes. Delivery of material to lateendosomes by maturation was also found in other cell types(Murphy, 1991; Stoorvogel et al., 1991; van Deurs et al., 1993).
In this study, our goal was to determine whether the modeldescribing sorting in CHO cells applies to HEp2 cells, or ifsorting occurs by a novel tubulo-reticular mechanism. We usedTf as a probe of the recycling pathway and LDL as a probe ofthe lysosomally directed pathway, and examined where Tf andLDL were in HEp2 cells after a variety of pulse-chase schemes.We used confocal microscopy to simultaneously visualize andquantify the fluorescent Tf and LDL distributions in the entirecell in three dimensions rather than in a single focal plane.Quantifying these images yielded the chronology, itinerary andrate constants for entering and leaving various cellular com-partments. We found that HEp2 cells follow a similarendocytic trafficking scheme to CHO cells, where LDL and Tffirst enter tubulo-vesicular sorting endosomes and then the Tfis sorted from the LDL and appears in separate recycling com-partments, before exiting the cell. LDL remains behind insorting endosomes, which eventually lose the ability to receivenewly endocytosed LDL, and mature into late endosomes.
MATERIALS AND METHODS
Cell cultureHEp2 cells were grown in bicarbonate-buffered Dulbecco’s modified
Eagle’s medium (DMEM) (Gibco Laboratories, Grand Island, NY)supplemented with 5% fetal bovine serum (Gibco), 100 units/ml peni-cillin and 100 µg/ml streptomycin (Gibco) at 37°C in a 5% CO2humidified air atmosphere. 48-72 hours before an experiment, cellswere plated in either 6-well plastic dishes for 125I-transferrin experi-ments or, for optical microscope experiments, in 35 mm diameterplastic tissue culture dishes whose bottoms have been replaced withpolylysine-coated no.1 glass coverslips (Salzman and Maxfield,1988). One day before experiments, the medium was replaced with asimilar medium but now containing 5% lipoprotein-deficient serumand 4 µM deferoxamine mesylate (Sigma Chemical Co. St Louis,MO) to stimulate increased expressions of the cells’ LDL and Tfreceptors (Goldstein et al., 1983; Mattia et al., 1984). Cells whoseLDL and Tf receptors had not been upregulated by lipid and irondeprivation, showed similar but dimmer LDL and Tf labeling to thosecells in which the receptors had been upregulated. This indicates thatlipid and iron deprivation is not altering the endosomal morphologiesthat we study.
Fluorescent labelsFluorescein-labeled transferrin (FITC-Tf) was made by first iron-loading human transferrin (Sigma), purifying it by Sephacryl S-300(Pharmacia LKB, Uppsala, Sweden) gel-filtration chromatography,and then conjugating it to fluorescein isothiocyanate, all as previouslydescribed (Yamashiro et al., 1984). diI-LDL and diO-LDL (LDL con-jugated to 3,3′-dioctadecylindocarbocyanine (diI) and 3,3′-dioctade-cyloxacarbocyanine (diO), respectively) were prepared as previouslydescribed (Pitas et al., 1981; Dunn and Maxfield, 1992).
Fluorescent labeling of cellsAll labeling was done in air on a 37°C tray. Prior to any fluorescentlabeling, the cells were rinsed once and then incubated for 5 minuteswith dye-free labeling medium (F-12 medium without bicarbonate,buffered with 20 mM HEPES to pH 7.4, and containing 100 units/mlpenicillin, 100 µg/ml streptomycin and 2 mg/ml ovalbumin; Sigma).To study LDL and transferrin sorting, the cells were then incubatedfor 2 minutes with 20 µg/ml FITC-Tf and 20 µg/ml diI-LDL inlabeling medium for 2 minutes. To remove cell surface transferrin,cells were soaked for 2 minutes at 37°C in a pH 4.6 citrate buffer(containing 25.5 mM citric acid, 24.5 mM sodium citrate, 280 mMsucrose and 0.01 mM deferoxamine mesylate), followed by two rinsesin a pH 7.4 chase medium (McCoy’s 5A medium without bicarbon-ate, buffered with 20 mM HEPES to pH 7.4, and containing 100units/ml penicillin, 100 µg/ml streptomycin, 50 µM deferoxaminemesylate and 100 µg/ml of unlabeled transferrin). This impermeantmild acid wash/neutral rinse procedure is a modification of theprotocol of Salzman and Maxfield (1988), and it removed ~95% ofthe cell surface transferrin. The lack of effects of mild acid washingon cell viability and endocytic kinetics have been validated in earlierpublications (Presley et al., 1993; McGraw and Maxfield, 1990; Dunnet al., 1989; Salzman and Maxfield, 1988). The procedure did notaffect the endocytic machinery of HEp2 cells, as the cells remainedviable following the acid wash and rinses, and could still undergoendocytosis at similar rates to cells that were not mild-acid-washed.In addition the rates for Tf to leave the sorting endosome and thewhole cell were similar in cells that had or had not been mild-acid-washed, as can be seen in the similar rates obtained from the Tf pulse-chase experiments compared to the Tf accumulation experimentsdescribed later in this paper. The cells were then chased for differentlengths of time in the chase medium, fixed and prepared formicroscopy. Unless otherwise noted, fixation for all experiments wasin 2.5% paraformaldehyde freshly diluted in medium 1 (150 mMNaCl, 20 mM HEPES, pH 7.4, 1 mM CaCl2, 5 mM KCl, 1 mMMgCl2) for 2 minutes. After four rinses in medium 1, SlowFadereagent (1,4-diazabicyclo-2,2,2-octane (DABCO) in glycerol/phosphate buffered saline; Molecular Probes) was applied. This wasremoved and fresh SlowFade reagent was reapplied. The SlowFade
R. N. Ghosh and others
2179Transferrin and LDL trafficking in HEp2 cells
reagent reduced photobleaching of the FITC-Tf, and did not affectdiI-LDL staining. This gentle fixation procedure did not noticeablyalter the morphologies of the FITC-Tf- and diI-LDL-containingendosomes. Similar structures were seen in fixed cells as in live cells,and while we could not carry out detailed kinetic analysis in live cells,all of the sorting and recycling behavior was qualitatively the sameas in the gently fixed cells.
Transferrin uptake in HEp2 cells was studied by labeling the cellsfor different lengths of time with 5 µg/ml FITC-Tf in labelingmedium. During the final 4 minutes of transferrin labeling, 20 µg/mldiI-LDL in labeling medium was added, followed by fixation. If theFITC-Tf labeling time was less than 4 minutes, the diI-LDL was firstapplied and then the FITC-Tf was added at the appropriate time,giving a total diI-LDL labeling time of 4 minutes.
diI-LDL uptake in cells was studied by incubating the cells with 20µg/ml diI-LDL in labeling medium for different lengths of time. Allthe images could not be viewed at the same gain of the confocalmicroscope’s photomultiplier tube, as the diI-LDL intensities at latertime points saturated the detector’s 8 bit dynamic range. We recordedthe 8-17 minute samples at a lower gain setting than the 1-5 minutesamples. To compare images taken at the two gain settings, a cali-bration image was taken of the same field of view of the 8 minutesample at each gain. Background was subtracted from each calibra-tion image, and then ratios of the maximum power (integratedintensity) of the same diI-LDL spots from each image were measured.The mean diI-LDL powers (integrated intensities) per spot in the 8-17 minute samples were multiplied by the mean ratio, so they couldbe plotted on the same scale with the mean diI-LDL powers per spotof the 1-5 minute samples.
FITC-Tf exit from cells was studied by first labeling the cells with5 µg/ml FITC-Tf in labeling medium for 1 hour, followed by the mildacid/neutral wash procedure, and then chasing for different lengths oftime with the chase medium. Fusion accessibility and maturation ofsorting endosomes were studied by labeling the cells with a 3 minutepulse of 20 µg/ml diO-LDL in labeling medium, followed by chasesfor different lengths of time with labeling medium (containing nodyes), and then a 2 minute pulse of 2 µg/ml diI-LDL in labelingmedium, a 2 minute additional chase and fixation.
Confocal microscopyFluorescence images of cells were obtained with a Bio-Rad MRC 600laser scanning confocal microscope (Bio-Rad Microscience,Cambridge, MA) on an inverted Zeiss Axiovert microscope (Zeiss,Oberkochen, Germany) using a 63× (NA 1.4) Zeiss Plan-apo infinitycorrected objective. The illumination sources were the 488 nm and514 nm lines from a 25 mW argon laser. FITC-Tf was visualized witha 488 nm band-pass excitation filter, a 510 nm dichroic mirror and a515 nm long-pass emission filter. diI-LDL was visualized with a 514nm band-pass excitation filter, a 540 nm dichroic mirror and a 550nm long-pass emission filter. The confocal microscope had two pho-tomultiplier tubes enabling detection of two fluorophores simultane-ously. To simultaneously visualize FITC-Tf with diI-LDL, a 514 nmexcitation filter was used. Fluorescence emissions were selected witha 527 nm dichroic mirror and divided between the two photomulti-plier tubes by means of a 565 nm dichroic mirror and a 600 nm long-pass emission filter for diI-LDL, and a 525-555 nm band-pass filterfor fluorescein.
The confocal microscope was calibrated using 300 nm fluorescentbeads (Wells et al., 1990) in order to determine the dependence of theimage slice vertical thickness on the aperture size. Five fields of cellswere recorded for each dish. Each field of cells was sectioned 3-dimensionally by recording images from a series of focal planes.Moving from one focal plane to the next was achieved by a steppermotor attached to the fine focus control of the microscope, and thestep sizes (in the range between 0.5 µm to 1.25 µm) were chosen withregard to the aperture size being used, so that there would be someoverlap between adjacent vertical sections. Enough vertical sections
were taken so that the tops and bottoms of all the cells in each fieldwould be recorded. A 10% neutral density filter in the excitation pathwas used to reduce photobleaching. Each image collected was theaverage of four scans at the confocal microscope’s normal scan rate.Photobleaching was not a problem as diI-LDL’s photobleaching wasnegligible under these conditions and the SlowFade reagent preventedFITC-Tf photobleaching. During each imaging session calibrationimages were taken of: (i) a microscope slide containing medium 1, inorder to measure background levels; (ii) a slide containing diIdissolved in DMSO; and (iii) (if needed) a slide containing eitherFITC-Tf, or diO dissolved in DMSO.
Image processing and quantificationImage processing and quantification was done on a Gould-VicomIP9000 image processor (Vicom Visual Computing, Fremont, CA)run by a micro-VAX-II minicomputer (Digital Equipment Corpor-ation, Maynard, MA). The background image was first subtractedfrom each image in a 3-dimensional stack. Then a 2-dimensional pro-jection was made of the 3-dimensional stack of images, where eachpixel’s intensity of the next vertical slice was compared with the pixelintensities of the projection thus far, and the maximum intensity wasretained. For dual-labeled samples, before the projection was made,each image in a stack was corrected for leakage of emission light fromone fluorophore through the barrier filters into the other fluorophore’sdetector. This was done by measuring the fraction of leakage of onefluorophore into the other fluorophore’s detector on a pixel-by-pixelbasis, using the calibration images of diI and FITC-Tf, and then sub-tracting that fraction of the original image from the image receivingthe leaked light. With the filter sets used, 15±1% of the diI fluores-cence per punctate endosome leaked into the green detector (mean ±s.e.m.), and 7±1% of the FITC and 19±2% of the diO fluorescenceper punctate endosome leaked into the red detector. To ensure thatthis excitation light leakage-correction procedure worked every time,we labeled control dishes of cells with one fluorophore only, recordedtheir images in the dual imaging mode, and then tested this correctionprocedure on them.
Image stacks were also viewed on a Tektronix SGS625 color stereomonitor (Tektronix Inc., Beaverton, OR) to localize the differentprobes in three dimensions with each other. There was very littleoverlap in the projection image of fluorescent structures from differentvertical slices, as they typically followed the contours of the cell’ssurface.
Prior to quantifying the amount of fluorescent probes present, theremaining background in the projection image was removed by sub-tracting the median pixel intensity determined from a region in theimage lacking cells. To identify the amount of FITC-Tf in diI-LDLspots, the diI-LDL image was used as a mask to select the regions inthe FITC-Tf image where FITC-Tf was colocalized with diI-LDL.The fluorescence power in the selected regions of the FITC-Tf imageswas then normalized to the number of diI-LDL spots, giving theaverage FITC-Tf fluorescence power per diI-LDL spot. Fig. 3g illus-trates how our image processing selected FITC-Tf in regions colo-calized with diI-LDL. The FITC-Tf in Fig. 3f, colocalized with thediI-LDL spots in Fig. 3e, are shown in Fig. 3g. The mean FITC-Tfpower per region, or the sum of the FITC-Tf powers per field, nor-malized to the number of cells, was also measured. The number ofdiI-LDL spots and their mean power were determined as describedpreviously (Dunn et al., 1989; Dunn and Maxfield, 1992).
125I-transferrin experiments125I-Tf was prepared as described previously (Yamashiro et al., 1984).For the 125I-Tf experiments, the labeling medium was 3 µg/ml 125I-Tf in McCoy’s 5A medium supplemented with 2 mg/ml ovalbumin,and experiments were done on monolayers of cells grown in six-wellplates. To check for 125I-Tf binding specificity, control experimentswere done in the presence of 200 times excess of unlabeled Tf.
Tf exit from HEp2 cells was measured as described previously
2180
(McGraw and Maxfield, 1990). In short, cells were incubated for ~1.5hours at 37°C with 3 µg/ml 125I-Tf in labeling medium. A pH 4.6 mildacid/neutral wash was then used to remove the cell surface transfer-rin, and the cells were chased for different lengths of time in chasemedium. The chase medium was removed, the cells were solubilizedin 0.1 M NaOH, and the radioactivity was counted in a gammacounter.
The steady-state ratio of Tf on the surface of HEp2 cells to Tf insidewas determined, as previously described, from the surface and totalcell-associated 125I-Tf (McGraw and Maxfield, 1990). The surface Tfwas obtained by incubating cells for 2 hours at 4°C with 3 µg/ml 125I-Tf in medium 1. After extensive washing with cold medium 1, thecells were solubilized and counted. To determine the total amount ofcell-associated Tf, cells were incubated at 37°C with 3 µg/ml 125I-Tfin labeling medium for 2 hours, rinsed several times in chase medium,and then solubilized and counted.
RESULTS
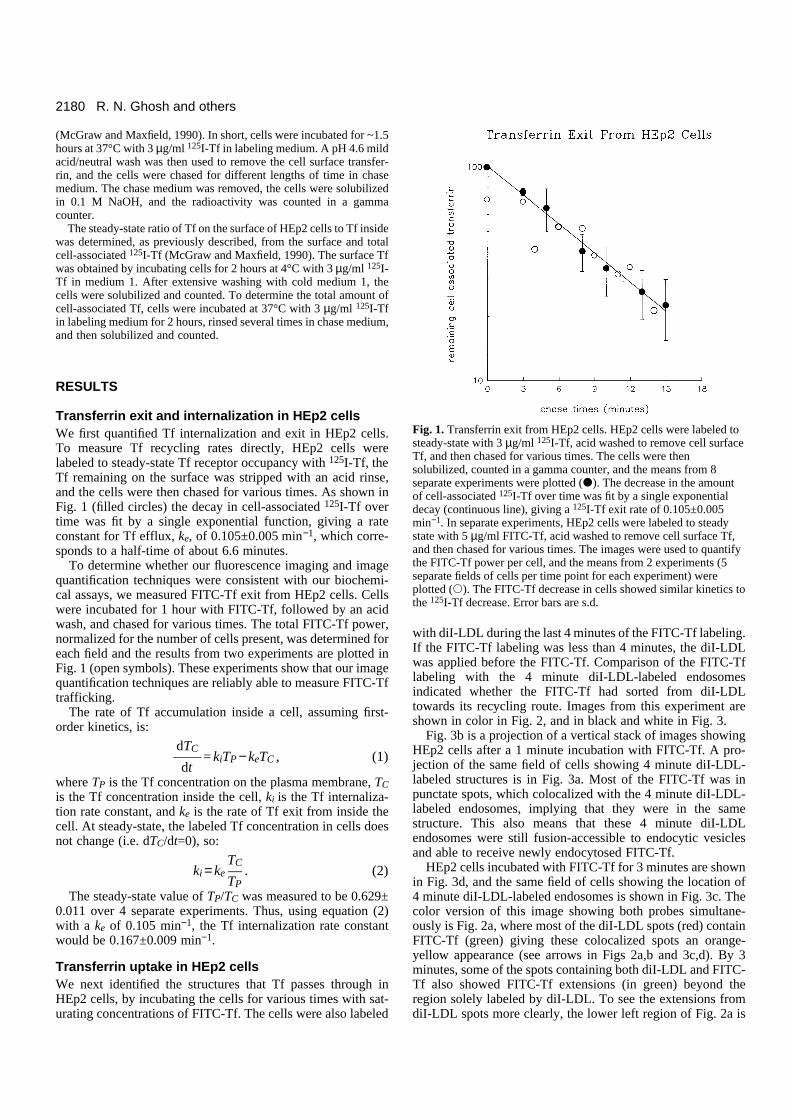
Transferrin exit and internalization in HEp2 cells We first quantified Tf internalization and exit in HEp2 cells.To measure Tf recycling rates directly, HEp2 cells werelabeled to steady-state Tf receptor occupancy with 125I-Tf, theTf remaining on the surface was stripped with an acid rinse,and the cells were then chased for various times. As shown inFig. 1 (filled circles) the decay in cell-associated 125I-Tf overtime was fit by a single exponential function, giving a rateconstant for Tf efflux,
ke, of 0.105±0.005 min−1, which corre-sponds to a half-time of about 6.6 minutes.
To determine whether our fluorescence imaging and imagequantification techniques were consistent with our biochemi-cal assays, we measured FITC-Tf exit from HEp2 cells. Cellswere incubated for 1 hour with FITC-Tf, followed by an acidwash, and chased for various times. The total FITC-Tf power,normalized for the number of cells present, was determined foreach field and the results from two experiments are plotted inFig. 1 (open symbols). These experiments show that our imagequantification techniques are reliably able to measure FITC-Tftrafficking.
The rate of Tf accumulation inside a cell, assuming first-order kinetics, is:
dTC—— = kiTP − keTC , (1)
dtwhere TP is the Tf concentration on the plasma membrane, TCis the Tf concentration inside the cell, ki is the Tf internaliza-tion rate constant, and ke is the rate of Tf exit from inside thecell. At steady-state, the labeled Tf concentration in cells doesnot change (i.e. dTC/dt=0), so:
TCki = ke — . (2)
TPThe steady-state value of TP/TC was measured to be 0.629±
0.011 over 4 separate experiments. Thus, using equation (2)with a ke of 0.105 min−1, the Tf internalization rate constantwould be 0.167±0.009 min−1.
Transferrin uptake in HEp2 cellsWe next identified the structures that Tf passes through inHEp2 cells, by incubating the cells for various times with sat-urating concentrations of FITC-Tf. The cells were also labeled
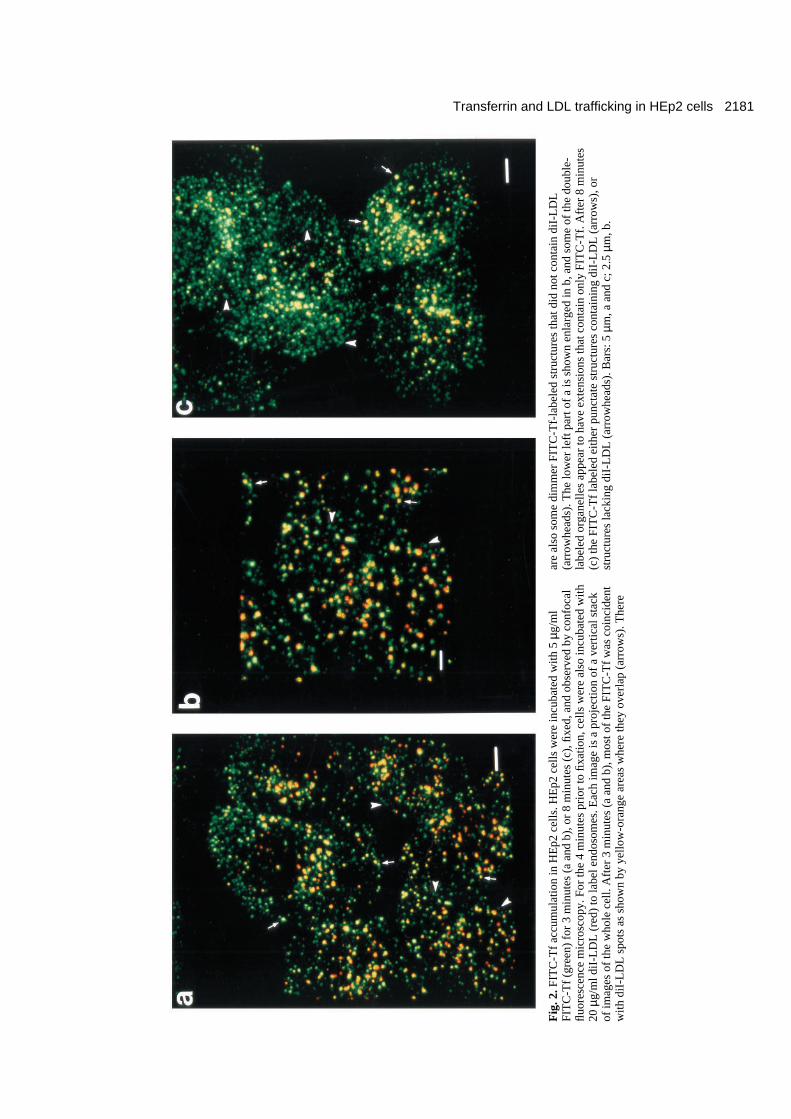
with diI-LDL during the last 4 minutes of the FITC-Tf labeling.If the FITC-Tf labeling was less than 4 minutes, the diI-LDLwas applied before the FITC-Tf. Comparison of the FITC-Tflabeling with the 4 minute diI-LDL-labeled endosomesindicated whether the FITC-Tf had sorted from diI-LDLtowards its recycling route. Images from this experiment areshown in color in Fig. 2, and in black and white in Fig. 3.
Fig. 3b is a projection of a vertical stack of images showingHEp2 cells after a 1 minute incubation with FITC-Tf. A pro-jection of the same field of cells showing 4 minute diI-LDL-labeled structures is in Fig. 3a. Most of the FITC-Tf was inpunctate spots, which colocalized with the 4 minute diI-LDL-labeled endosomes, implying that they were in the samestructure. This also means that these 4 minute diI-LDLendosomes were still fusion-accessible to endocytic vesiclesand able to receive newly endocytosed FITC-Tf.
HEp2 cells incubated with FITC-Tf for 3 minutes are shownin Fig. 3d, and the same field of cells showing the location of4 minute diI-LDL-labeled endosomes is shown in Fig. 3c. Thecolor version of this image showing both probes simultane-ously is Fig. 2a, where most of the diI-LDL spots (red) containFITC-Tf (green) giving these colocalized spots an orange-yellow appearance (see arrows in Figs 2a,b and 3c,d). By 3minutes, some of the spots containing both diI-LDL and FITC-Tf also showed FITC-Tf extensions (in green) beyond theregion solely labeled by diI-LDL. To see the extensions fromdiI-LDL spots more clearly, the lower left region of Fig. 2a is
R. N. Ghosh and others
Fig. 1. Transferrin exit from HEp2 cells. HEp2 cells were labeled tosteady-state with 3 µg/ml 125I-Tf, acid washed to remove cell surfaceTf, and then chased for various times. The cells were thensolubilized, counted in a gamma counter, and the means from 8separate experiments were plotted (
d). The decrease in the amountof cell-associated 125I-Tf over time was fit by a single exponentialdecay (continuous line), giving a 125I-Tf exit rate of 0.105±0.005min−1. In separate experiments, HEp2 cells were labeled to steadystate with 5 µg/ml FITC-Tf, acid washed to remove cell surface Tf,and then chased for various times. The images were used to quantifythe FITC-Tf power per cell, and the means from 2 experiments (5separate fields of cells per time point for each experiment) wereplotted (s). The FITC-Tf decrease in cells showed similar kinetics tothe 125I-Tf decrease. Error bars are s.d.
2181Transferrin and LDL trafficking in HEp2 cells
Fig
. 2. F
ITC
-Tf
accu
mul
atio
n in
HE
p2 c
ells
. HE
p2 c
ells
wer
e in
cuba
ted
with
5 µ
g/m
lFI
TC
-Tf
(gre
en)
for
3 m
inut
es (
a an
d b)
, or
8 m
inut
es (
c), fi
xed,
and
obs
erve
d by
con
foca
lflu
ores
cenc
e m
icro
scop
y. F
or th
e 4
min
utes
pri
or to
fixa
tion,
cel
ls w
ere
also
incu
bate
d w
ith20
µg/
ml d
iI-L
DL
(re
d) to
labe
l end
osom
es. E
ach
imag
e is
a p
roje
ctio
n of
a v
ertic
al s
tack
of im
ages
of
the
who
le c
ell.
Aft
er 3
min
utes
(a
and
b), m
ost o
f th
e FI
TC
-Tf
was
coi
ncid
ent
with
diI
-LD
L s
pots
as
show
n by
yel
low
-ora
nge
area
s w
here
they
ove
rlap
(ar
row
s). T
here
are
also
som
e di
mm
er F
ITC
-Tf-
labe
led
stru
ctur
es th
at d
id n
ot c
onta
in d
iI-L
DL
(arr
owhe
ads)
. The
low
er le
ft p
art o
f a
is s
how
n en
larg
ed in
b, a
nd s
ome
of th
e do
uble
-la
bele
d or
gane
lles
appe
ar to
hav
e ex
tens
ions
that
con
tain
onl
y FI
TC
-Tf.
Aft
er 8
min
utes
(c
) th
e FI
TC
-Tf
labe
led
eith
er p
unct
ate
stru
ctur
es c
onta
inin
g di
I-L
DL
(ar
row
s), o
rst
ruct
ures
lack
ing
diI-
LD
L (
arro
whe
ads)
. Bar
s: 5
µm
, a a
nd c
; 2.5
µm
, b.
2182
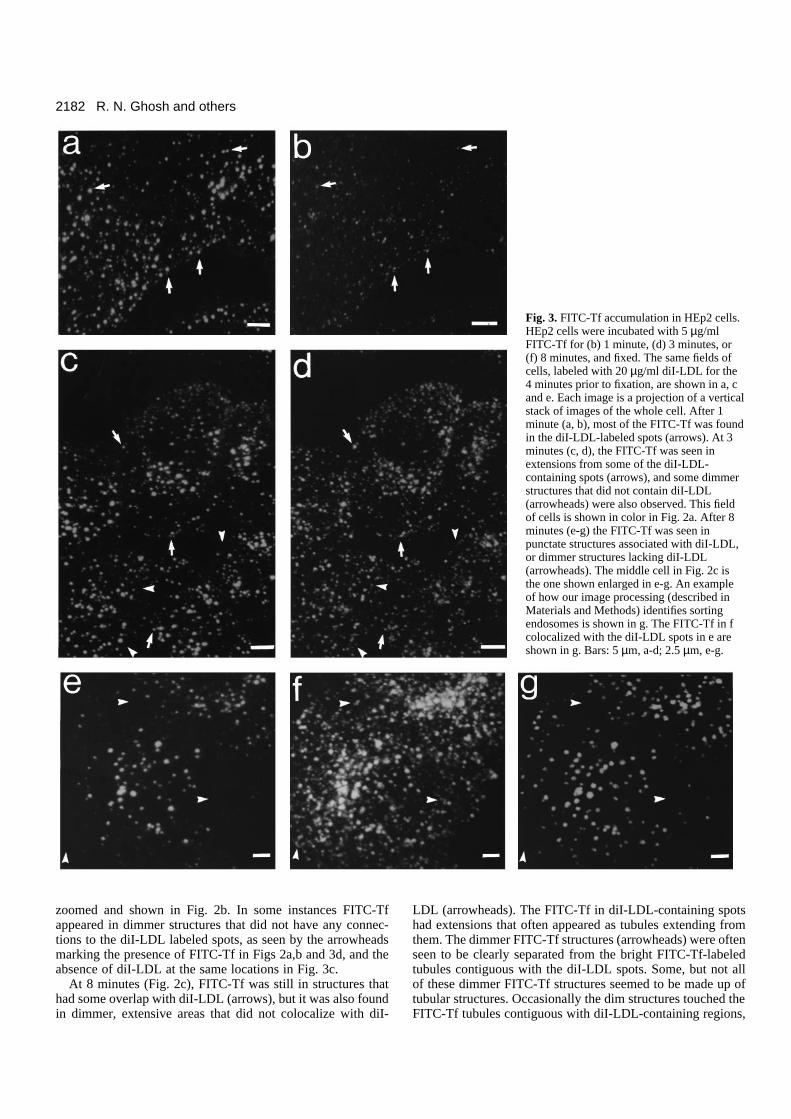
zoomed and shown in Fig. 2b. In some instances FITC-Tfappeared in dimmer structures that did not have any connec-tions to the diI-LDL labeled spots, as seen by the arrowheadsmarking the presence of FITC-Tf in Figs 2a,b and 3d, and theabsence of diI-LDL at the same locations in Fig. 3c.
At 8 minutes (Fig. 2c), FITC-Tf was still in structures thathad some overlap with diI-LDL (arrows), but it was also foundin dimmer, extensive areas that did not colocalize with diI-
LDL (arrowheads). The FITC-Tf in diI-LDL-containing spotshad extensions that often appeared as tubules extending fromthem. The dimmer FITC-Tf structures (arrowheads) were oftenseen to be clearly separated from the bright FITC-Tf-labeledtubules contiguous with the diI-LDL spots. Some, but not allof these dimmer FITC-Tf structures seemed to be made up oftubular structures. Occasionally the dim structures touched theFITC-Tf tubules contiguous with diI-LDL-containing regions,
R. N. Ghosh and others
Fig. 3. FITC-Tf accumulation in HEp2 cells.HEp2 cells were incubated with 5 µg/mlFITC-Tf for (b) 1 minute, (d) 3 minutes, or(f) 8 minutes, and fixed. The same fields ofcells, labeled with 20 µg/ml diI-LDL for the4 minutes prior to fixation, are shown in a, cand e. Each image is a projection of a verticalstack of images of the whole cell. After 1minute (a, b), most of the FITC-Tf was foundin the diI-LDL-labeled spots (arrows). At 3minutes (c, d), the FITC-Tf was seen inextensions from some of the diI-LDL-containing spots (arrows), and some dimmerstructures that did not contain diI-LDL(arrowheads) were also observed. This fieldof cells is shown in color in Fig. 2a. After 8minutes (e-g) the FITC-Tf was seen inpunctate structures associated with diI-LDL,or dimmer structures lacking diI-LDL(arrowheads). The middle cell in Fig. 2c isthe one shown enlarged in e-g. An exampleof how our image processing (described inMaterials and Methods) identifies sortingendosomes is shown in g. The FITC-Tf in fcolocalized with the diI-LDL spots in e areshown in g. Bars: 5 µm, a-d; 2.5 µm, e-g.

2183Transferrin and LDL trafficking in HEp2 cells
but it was not clear if they were truly connected, or if their sep-aration was smaller then the light microscope’s resolution.
To illustrate further the two types of FITC-Tf-labeled struc-tures (attached to diI-LDL spots, or separate), the middle cellin Fig. 2c is shown enlarged with the diI-LDL distribution inFig. 3e and the FITC-Tf labeling in Fig. 3f. In several regionsof this cell there were no diI-LDL-labeled spots nearby (within~2-5 µm), so the separation of the dim FITC-Tf structures fromdiI-LDL-containing spots is more clearly seen. These dimFITC-Tf structures are marked by arrowheads in Fig. 3f, andthe same locations in Fig. 3e are marked to show the absenceof diI-LDL. Occasionally, bright FITC-Tf-containing struc-tures are seen without any diI-LDL fluorescence; this can beeither due to the diI-LDL present not being bright enough fordetection, or because the FITC-Tf-containing structure lacksdiI-LDL but is brightly labeled with FITC-Tf in this instance.
Based on these observations, the Tf-containing endosomesin HEp2 cells can be subdivided as in CHO cells (Dunn et al.,1989; Dunn and Maxfield, 1992; Mayor et al., 1993). Sortingendosomes contain newly endocytosed LDL and Tf, and canbe identified as the structures in Figs 2 and 3 labeled with bothdiI-LDL and FITC-Tf. The FITC-Tf also labeled the tubularextensions of the sorting endosome. The FITC-Tf then exitedthe sorting endosomes and entered the dimmer recycling com-partment, which appeared as a separate compartment from thediI-LDL-containing sorting endosomes in Figs 2 and 3.
FITC-Tf and diI-LDL accumulation kineticsTo determine the kinetics of Tf entry into sorting endosomesand the whole cell we quantified their FITC-Tf fluorescencefrom images similar to those shown in Fig. 3. The FITC-Tfaccumulation in cells at various times was determined bymeasuring the total FITC-Tf power in each projection imageand then normalizing for the number of cells present. Theresults from three experiments were normalized to the 3 minutevalue (which was a common time point for the data sets),averaged, and plotted in Fig. 4a.
The total cell-associated Tf, TT, is the sum of the plasmamembrane Tf and the Tf inside the cell. In the case of contin-uous saturable Tf labeling, the Tf concentration on the plasmamembrane, TP, is a constant, and the rate of Tf accumulationinside a cell is given by equation (1). Solving equation (1)gives the Tf concentration in a cell during continuous saturableligand binding (TP constant) as:
kiTC (t) = TP — [1 − e−ket] . (3)
keThe total FITC-Tf in a cell versus time, shown in Fig. 4a,
was fit by:
TT (t) =A[1 − e−ket] + B , (4)
where the three parameters fit were the asymptotic value A, thedetected Tf amount on the plasma membrane B, and ke. Thebest fit gave a value for ke of 0.13±0.05 min−1, correspondingto a half-time for Tf to exit the cell of 5.3 minutes. The Tf exitrates determined here were faster than those obtained fromdirectly measuring Tf exit in cells labeled to steady state (tG~6.6 minutes; Fig. 1), but the difference was not statisticallysignificant.
Tf in a vectorial pathway goes from the plasma membrane
to sorting endosomes to recycling compartments and then backto the plasma membrane (see schematic diagram in Fig. 8), andthe rate of Tf accumulation in sorting endosomes in such ascheme is:
dTS—— = kiTP − kSTS , (5)
dtwhere TS is the Tf concentration in sorting endosomes, and ksis the sorting rate constant. This was solved, for the case ofsaturable continuous Tf labeling, where TP is a constant. Thus,the Tf in sorting endosomes from a vectorial traffickingpathway is:
TS(t) =C[1 − e−kSt] . (6)
We quantified FITC-Tf accumulation in sorting endosomes.Sorting endosomes were defined as structures where FITC-Tfand diI-LDL were colocalized. As seen in Figs 2 and 3, FITC-Tf in sorting endosomes was not only in the punctate spotslabeled by diI-LDL but also in their tubular extensions.However, there was no unambiguous way to identify thetubular extensions that were connected to diI-LDL spots. Thuswe only measured the FITC-Tf power contained within areascolocalized with the diI-LDL spots. Fig. 3e-g demonstrateswhat our image processing routines select as the colocalizeddiI-LDL- and FITC-Tf-containing regions. The FITC-Tfregions of Fig. 3f colocalized with the diI-LDL spots of Fig.3e are shown in Fig. 3g.
The mean FITC-Tf value over all the diI-LDL spots wasdetermined and fitted with the expression for TS, where the twoquantities fit were the sorting rate constant, kS and the asymp-totic value C. The mean FITC-Tf power in diI-LDL spots wasthen normalized by the value of the asymptote. This was doneso that results from the two experiments could be averaged.The FITC-Tf powers in sorting endosomes after various incu-bation times are plotted in Fig. 4b along with the optimal fit ofthe data using equation (6). The kS for FITC-Tf colocalizedwith diI-LDL spots was 0.26±0.13 min−1, corresponding to ahalf-time of exit from sorting endosomes of 2.7 minutes.
We next examined diI-LDL accumulation in endosomes byincubating HEp2 cells for different lengths of time with diI-LDL. The mean diI-LDL power per spot increased up to 12minutes, after which it leveled off (Fig. 4c). The line connect-ing the points in Fig. 4c is a spline fit through the data.
The relative increase in the amount of diI-LDL in spots wasmuch larger than that of FITC-Tf, suggesting that FITC-Tf isremoved from sorting endosomes while diI-LDL continues toaccumulate. The half-time for Tf to leave sorting endosomeswas 2-3 minutes, but the half-time for it to leave the cell was5-8 minutes (Table 1). This implies that after leaving sortingendosomes, Tf must accumulate in a separate compartment, therecycling compartment, before exiting the cell.
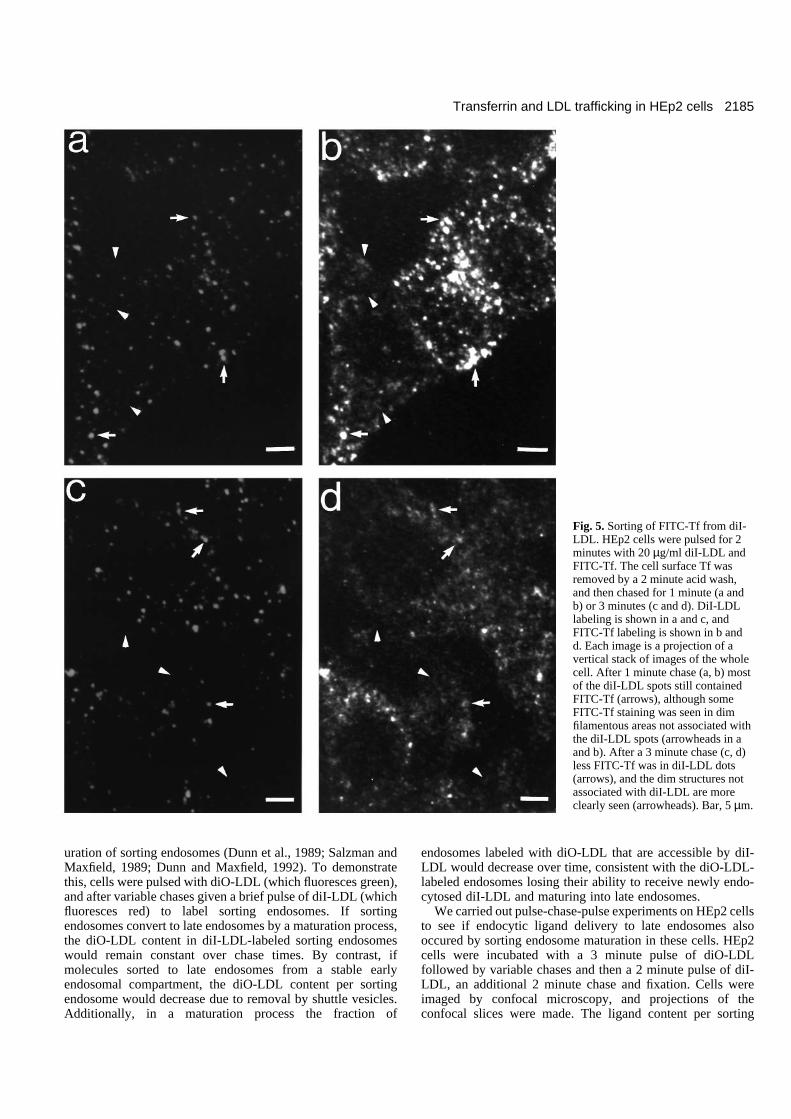
Sorting of FITC-Tf from diI-LDL in sortingendosomesTo directly study Tf sorting from LDL in sorting endosomes,HEp2 cells were labeled with a 2 minute pulse of FITC-Tf anddiI-LDL. The surface Tf was removed by acid stripping,followed by chases of various times. A projection of a verticalstack of HEp2 cells labeled in this manner for 2 minutes withFITC-Tf and diI-LDL, acid washed for 2 minutes and thenchased for 1 minute is shown in Fig. 5a and b. The diI-LDL-

2184
labeled spots contained FITC-Tf (i.e. they were sortingendosomes), and there was also some FITC-Tf in dim struc-tures not associated with diI-LDL (i.e. recycling compart-ments). Another field of cells labeled in the same way, but nowchased for 3 minutes, is shown in Fig. 5c and d. The amountof FITC-Tf in diI-LDL endosomes had decreased (see arrows),
and regions not associated with diI-LDL clearly showed FITC-Tf staining (see arrowheads). The FITC-Tf in diI-LDLendosomes in Fig. 5d is ~55% of the FITC-Tf in diI-LDLendosomes in Fig. 5b. The total FITC-Tf in the cells in Fig. 5dis ~80% of the total FITC-Tf in the cells in Fig. 5b, and thistotal cellular FITC-Tf decrease is consistent with the previ-ously measured exit rate, ke.
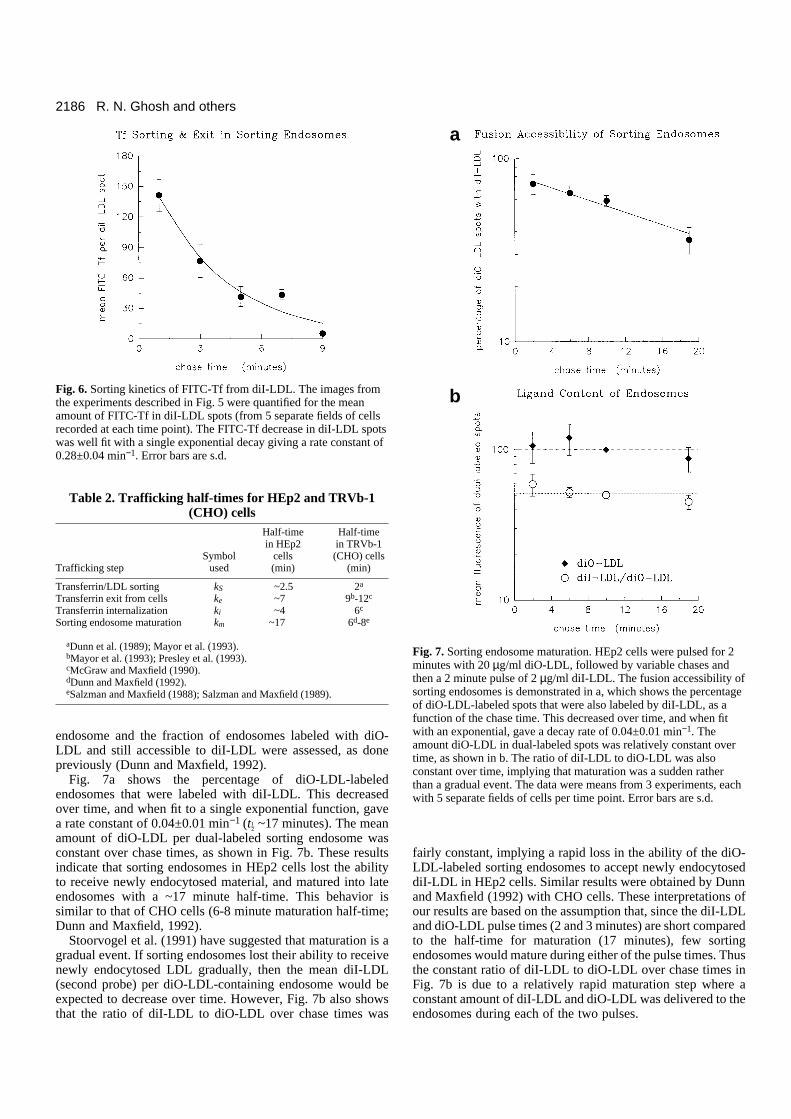
The FITC-Tf in each diI-LDL spot was quantified by imageprocessing, and the mean FITC-Tf power per diI-LDL spot, forall the diI-LDL spots, was plotted versus chase times(following the 2 minute acid wash) in Fig. 6. The mean FITC-Tf power in diI-LDL spots had a single exponential decreaseover chase times, implying that Tf sorted from LDL with first-order kinetics. The sorting rate constant, kS, was obtained froma single exponential fit of the plot and is 0.28±0.04 min−1,giving a 2.5 minute half-time for FITC-Tf sorting from diI-LDL. This sorting rate constant was in the same range as thatobtained from the Tf accumulation data. Similar sorting half-times were seen in two other experiments of this kind (~1.8and 2.3 minutes). Taken together with the analyses of accu-mulation kinetics, these sorting data indicate that Tf exitssorting endosomes with a tG of ~2.5 minutes (Table 2).
Sorting endosomes mature into late endosomesIt has been shown that delivery of ligands from sortingendosomes to late endosomes in CHO cells occurs by the mat-
R. N. Ghosh and others
a
b
cFig. 4. Quantification of FITC-Tf and diI-LDL accumulation inHEp2 cells. (a) The FITC-Tf power per HEp2 cell versus time wasmeasured from images collected in experiments similar to thosedepicted in Figs 2 and 3. The mean from 3 experiments (5 separatefields of cells per time point for each experiment) was fit with theexpression for total cell-associated Tf (eqn 4), and gave a Tf exitrate, ke, of 0.13±0.05 min−1. (b) The FITC-Tf power in 4 minute diI-LDL-labeled spots was measured in images from five separate fieldsof cells recorded at each time point for 2 experiments similar to Fig.2. The data were fit by equation (6), which describes Tfaccumulation in sorting endosomes with 1st-order kinetics, and gavea rate constant, kS, for FITC-Tf to leave diI-LDL spots, of 0.26±0.13min−1. (c) HEp2 cells were incubated with 20 µg/ml diI-LDL fordifferent times, and the mean diI-LDL power per spot (from 5separate fields of cells per time point) was measured as described inthe text. Error bars in a are the s.d. between experiments, and in b arethe s.d. from all 10 fields of the 2 experiments.
Table 1. Summary of measured transferrin and LDLtrafficking rate constants
Rate Half-constant ±s.e. time
Trafficking step Parameter (min−1) (min)
125I-Tf exit from inside the cell measured ke 0.105±0.005 6.6directly (Fig. 1)
FITC-Tf exit from inside the cell measured ke 0.09±0.01 7.7directly (Fig. 1)
FITC-Tf exit from inside the cell measured ke 0.13±0.05 5.3from accumulation kinetics (Fig. 4a)
FITC-Tf exit from diI-LDL spots measured kS 0.28±0.04 2.5directly (Fig. 6)
FITC-Tf exit from diI-LDL spots measured kS 0.26±0.13 2.7from accumulation kinetics (Fig. 4b)
Sorting endosome maturation (Fig. 7a) km 0.04±0.01 17Transferrin internalization (using ke=0.105 ki 0.167±0.009 4.2min−1)
2185Transferrin and LDL trafficking in HEp2 cells
uration of sorting endosomes (Dunn et al., 1989; Salzman andMaxfield, 1989; Dunn and Maxfield, 1992). To demonstratethis, cells were pulsed with diO-LDL (which fluoresces green),and after variable chases given a brief pulse of diI-LDL (whichfluoresces red) to label sorting endosomes. If sortingendosomes convert to late endosomes by a maturation process,the diO-LDL content in diI-LDL-labeled sorting endosomeswould remain constant over chase times. By contrast, ifmolecules sorted to late endosomes from a stable earlyendosomal compartment, the diO-LDL content per sortingendosome would decrease due to removal by shuttle vesicles.Additionally, in a maturation process the fraction of
endosomes labeled with diO-LDL that are accessible by diI-LDL would decrease over time, consistent with the diO-LDL-labeled endosomes losing their ability to receive newly endo-cytosed diI-LDL and maturing into late endosomes.
We carried out pulse-chase-pulse experiments on HEp2 cellsto see if endocytic ligand delivery to late endosomes alsooccured by sorting endosome maturation in these cells. HEp2cells were incubated with a 3 minute pulse of diO-LDLfollowed by variable chases and then a 2 minute pulse of diI-LDL, an additional 2 minute chase and fixation. Cells wereimaged by confocal microscopy, and projections of theconfocal slices were made. The ligand content per sorting
Fig. 5. Sorting of FITC-Tf from diI-LDL. HEp2 cells were pulsed for 2minutes with 20 µg/ml diI-LDL andFITC-Tf. The cell surface Tf wasremoved by a 2 minute acid wash,and then chased for 1 minute (a andb) or 3 minutes (c and d). DiI-LDLlabeling is shown in a and c, andFITC-Tf labeling is shown in b andd. Each image is a projection of avertical stack of images of the wholecell. After 1 minute chase (a, b) mostof the diI-LDL spots still containedFITC-Tf (arrows), although someFITC-Tf staining was seen in dimfilamentous areas not associated withthe diI-LDL spots (arrowheads in aand b). After a 3 minute chase (c, d)less FITC-Tf was in diI-LDL dots(arrows), and the dim structures notassociated with diI-LDL are moreclearly seen (arrowheads). Bar, 5 µm.
2186
endosome and the fraction of endosomes labeled with diO-LDL and still accessible to diI-LDL were assessed, as donepreviously (Dunn and Maxfield, 1992).
Fig. 7a shows the percentage of diO-LDL-labeledendosomes that were labeled with diI-LDL. This decreasedover time, and when fit to a single exponential function, gavea rate constant of 0.04±0.01 min−1 (tG ~17 minutes). The meanamount of diO-LDL per dual-labeled sorting endosome wasconstant over chase times, as shown in Fig. 7b. These resultsindicate that sorting endosomes in HEp2 cells lost the abilityto receive newly endocytosed material, and matured into lateendosomes with a ~17 minute half-time. This behavior issimilar to that of CHO cells (6-8 minute maturation half-time;Dunn and Maxfield, 1992).
Stoorvogel et al. (1991) have suggested that maturation is agradual event. If sorting endosomes lost their ability to receivenewly endocytosed LDL gradually, then the mean diI-LDL(second probe) per diO-LDL-containing endosome would beexpected to decrease over time. However, Fig. 7b also showsthat the ratio of diI-LDL to diO-LDL over chase times was
fairly constant, implying a rapid loss in the ability of the diO-LDL-labeled sorting endosomes to accept newly endocytoseddiI-LDL in HEp2 cells. Similar results were obtained by Dunnand Maxfield (1992) with CHO cells. These interpretations ofour results are based on the assumption that, since the diI-LDLand diO-LDL pulse times (2 and 3 minutes) are short comparedto the half-time for maturation (17 minutes), few sortingendosomes would mature during either of the pulse times. Thusthe constant ratio of diI-LDL to diO-LDL over chase times inFig. 7b is due to a relatively rapid maturation step where aconstant amount of diI-LDL and diO-LDL was delivered to theendosomes during each of the two pulses.
R. N. Ghosh and others
a
b
Fig. 7. Sorting endosome maturation. HEp2 cells were pulsed for 2minutes with 20 µg/ml diO-LDL, followed by variable chases andthen a 2 minute pulse of 2 µg/ml diI-LDL. The fusion accessibility ofsorting endosomes is demonstrated in a, which shows the percentageof diO-LDL-labeled spots that were also labeled by diI-LDL, as afunction of the chase time. This decreased over time, and when fitwith an exponential, gave a decay rate of 0.04±0.01 min−1. Theamount diO-LDL in dual-labeled spots was relatively constant overtime, as shown in b. The ratio of diI-LDL to diO-LDL was alsoconstant over time, implying that maturation was a sudden ratherthan a gradual event. The data were means from 3 experiments, eachwith 5 separate fields of cells per time point. Error bars are s.d.
Table 2. Trafficking half-times for HEp2 and TRVb-1(CHO) cells
Half-time Half-timein HEp2 in TRVb-1
Symbol cells (CHO) cellsTrafficking step used (min) (min)
Transferrin/LDL sorting kS ~2.5 2a
Transferrin exit from cells ke ~7 9b-12c
Transferrin internalization ki ~4 6c
Sorting endosome maturation km ~17 6d-8e
aDunn et al. (1989); Mayor et al. (1993).bMayor et al. (1993); Presley et al. (1993).cMcGraw and Maxfield (1990).dDunn and Maxfield (1992).eSalzman and Maxfield (1988); Salzman and Maxfield (1989).
Fig. 6. Sorting kinetics of FITC-Tf from diI-LDL. The images fromthe experiments described in Fig. 5 were quantified for the meanamount of FITC-Tf in diI-LDL spots (from 5 separate fields of cellsrecorded at each time point). The FITC-Tf decrease in diI-LDL spotswas well fit with a single exponential decay giving a rate constant of0.28±0.04 min−1. Error bars are s.d.
2187Transferrin and LDL trafficking in HEp2 cells
DISCUSSION
Our observations and measurements of Tf and LDL traffick-ing in HEp2 cells have demonstrated that the Tf-containingendosomes in these cells are composed of two separate com-partments: the sorting endosome and the recycling compart-ment. We have presented both morphological and kineticevidence supporting this conclusion. Endocytosed Tf and LDLwere initially internalized into the same punctate tubulo-vesicular compartments (sorting endosomes). Tf then exits theLDL-containing sorting endosomes and starts appearing in aseparate compartment, the recycling compartment. The ratesfor Tf and LDL sorting and trafficking, measured by variousmethods, are shown in Table 1. Table 2 summarizes therounded tG values obtained from the weighted means for thevarious values of ke and kS. Tf sorted from LDL with first-orderkinetics gave a tG of ~2.5 minutes. However, Tf cycled throughthe cell with a half-time of ~7 minutes. The difference in thetwo half-times implies that Tf is delivered to a separate com-partment (recycling compartment) after leaving the LDL-labeled sorting endosome, but before exiting the cell. Sorting
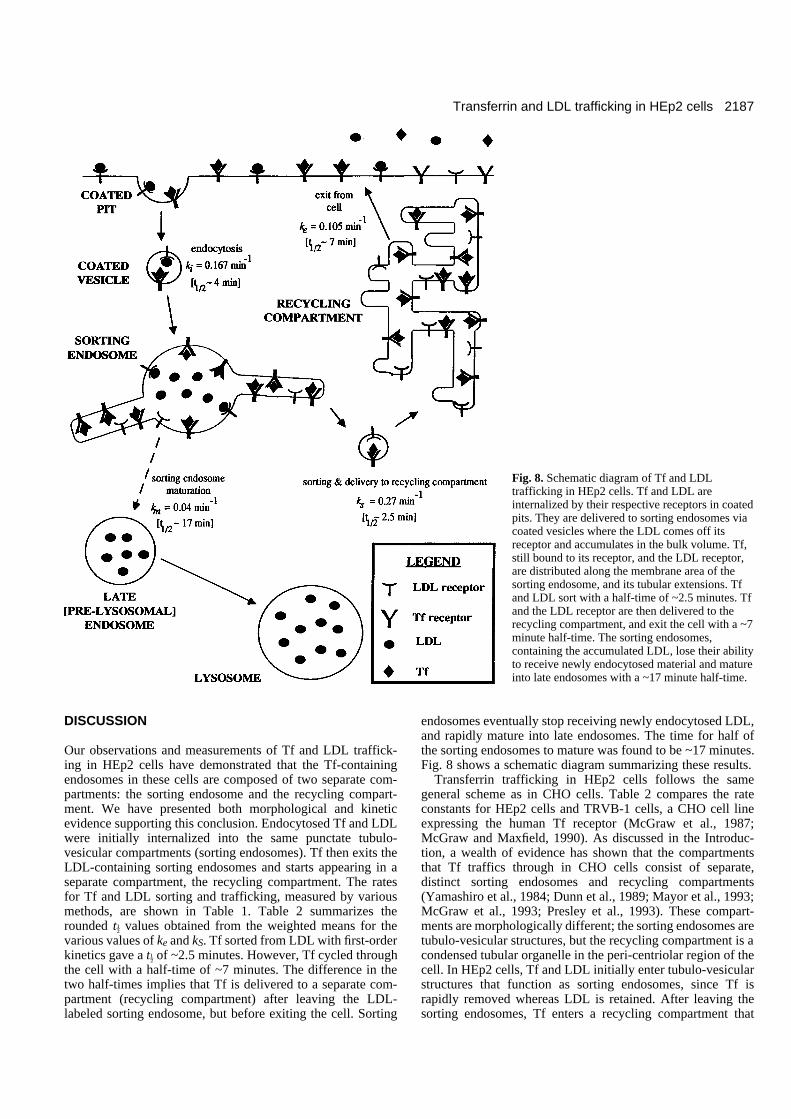
endosomes eventually stop receiving newly endocytosed LDL,and rapidly mature into late endosomes. The time for half ofthe sorting endosomes to mature was found to be ~17 minutes.Fig. 8 shows a schematic diagram summarizing these results.
Transferrin trafficking in HEp2 cells follows the samegeneral scheme as in CHO cells. Table 2 compares the rateconstants for HEp2 cells and TRVB-1 cells, a CHO cell lineexpressing the human Tf receptor (McGraw et al., 1987;McGraw and Maxfield, 1990). As discussed in the Introduc-tion, a wealth of evidence has shown that the compartmentsthat Tf traffics through in CHO cells consist of separate,distinct sorting endosomes and recycling compartments(Yamashiro et al., 1984; Dunn et al., 1989; Mayor et al., 1993;McGraw et al., 1993; Presley et al., 1993). These compart-ments are morphologically different; the sorting endosomes aretubulo-vesicular structures, but the recycling compartment is acondensed tubular organelle in the peri-centriolar region of thecell. In HEp2 cells, Tf and LDL initially enter tubulo-vesicularstructures that function as sorting endosomes, since Tf israpidly removed whereas LDL is retained. After leaving thesorting endosomes, Tf enters a recycling compartment that
Fig. 8. Schematic diagram of Tf and LDLtrafficking in HEp2 cells. Tf and LDL areinternalized by their respective receptors in coatedpits. They are delivered to sorting endosomes viacoated vesicles where the LDL comes off itsreceptor and accumulates in the bulk volume. Tf,still bound to its receptor, and the LDL receptor,are distributed along the membrane area of thesorting endosome, and its tubular extensions. Tfand LDL sort with a half-time of ~2.5 minutes. Tfand the LDL receptor are then delivered to therecycling compartment, and exit the cell with a ~7minute half-time. The sorting endosomes,containing the accumulated LDL, lose their abilityto receive newly endocytosed material and matureinto late endosomes with a ~17 minute half-time.

2188
appears as dimly fluorescent organelles throughout the cell.Some, but not all of these appear to be tubular. Ligand deliveryto late endosomes occurs by sorting endosome maturation(Dunn et al., 1989; Dunn and Maxfield, 1992).
It is our interpretation that the recycling compartment cor-responds to at least some of the tubular endosomes seen byHopkins et al. (1990) and by Tooze and Hollinshead (1991).After an extended labeling period, Hopkins et al. (1990)found extensive Tf-labeled tubular endosomes in HEp2 cellsthat were seen throughout the cell but did not form a contin-uous organelle. Tooze and Hollinshead (1991), using horse-radish peroxidase (HRP) as a fluid-phase marker, also foundtubular endosomes in HEp2 cells when thick sections wereviewed by electron microscopy. They found that in HEp2cells tubular endosomes received HRP within 5 minutes, butat least 30 minutes were needed to label the entire tubularendosomal system. They also saw tubular endosomes thatwere not in the vicinity of cisternal-vesicular earlyendosomes, which would be consistent with our interpreta-tion that the recycling compartment is distinct from thesorting endosomes. The kinetics, temperature sensitivity andmicrotubule insensitivity of HRP entering and leaving tubularendosomes identified them as early endocytic elements, andnot late endosomes.
Hopkins and his colleagues (Futter and Hopkins, 1989;Hopkins et al., 1990) also reported that Tf and EGF traffickedtogether for long periods of time in HEp2 cells, and bothappeared in multi-vesicular bodies (MVB), although Tf was onthe perimeter membrane of MVB while EGF receptors increas-ingly appeared in the inner vesicles of MVB. Although EGFis a lysosomally directed ligand, they found that after a 10minute pulse and a 30 minute chase, 40% of the EGF was inthe same compartment as Tf, whereas our lysosomally directedprobe, LDL, would clearly have been in different compart-ments by this time. Thus, it is not clear that EGF follows thesame endocytic route in HEp2 cells as other lysosomallydestined molecules such as LDL.
van Deurs et al. (1993) observed endosomes in HEp2 cells,using fluorescent Tf and video microscopy as well as HRP andcationized gold in electron microscopy. They observedvesicular endosomes with short tubular projections, and theyfound that these vesicular endosomes matured into lateendosomes in agreement with our pulse-chase experimentswith LDL. van Deurs et al. (1993) observed that the olderendosomes had more inner vesicles. With continuous HRPincubation, the number of labeled MVB increased, whereaswith a 5 minute HRP pulse followed by either 10 or 25 minutechases, the number of labeled MVB remained constant. vanDeurs et al. (1993) did not find extensive tubular endosomes.The reasons for this are not clear.
Using confocal fluorescence microscopy and digital imageanalysis, we have morphologically and kinetically shown thatinternalized Tf first appears in HEp2 cells in sortingendosomes. It then sorts from lysosomally directed LDL andappears in a post-sorting recycling compartment before leavingthe cell. The LDL remains behind in sorting endosomes, whichmature into late endosomes. This is the same scheme as hasbeen shown for CHO cells. We believe that this is a generalscheme for the trafficking of recycling molecules in cells, andthis pathway involves short-lived sorting endosomes contain-ing both recycling and lysosomally directed molecules, and a
chronologically later, post-sorting recycling compartment thatis a relatively permanent (or long-lived) organelle.
Additional pathways may exist in the cell in which smalleramounts of Tf receptors can participate. Some Tf can appearin the TGN; asialotransferrin receptor has been shown to beresialated in the TGN, although with very slow kinetics (Sniderand Rogers, 1985; Stoorvogel et al., 1988). We also haverecent evidence showing that a substantial amount of Tf par-ticipates in a retrograde non-vectorial pathway where it returnsto sorting endosomes from recycling compartments, as shownin a separate paper (Ghosh and Maxfield, unpublished data).This retrograde Tf trafficking does not affect the values of thevarious rate constants for vectorial Tf trafficking that we havemeasured here (kS and ke) as these were determined from pulse-chase experiments that measured the dominant forwardvectorial trafficking rate, and the retrograde trafficking effectswould be detected only after long time incubations.
We thank Michael Hillmeyer for sustained help in computer-relatedmatters, and Jeffrey Myers for making and providing the fluorescentLDLs. We also thank Kenneth Dunn, Satyajit Mayor, TimothyMcGraw and John Presley for critically reading the manuscript. Thiswork was supported by a fellowship from the New York Affiliate ofthe American Heart Association to R. N. Ghosh, and a NationalInsitutes of Health grant DK27083 to F. R. Maxfield.
REFERENCES
Brown, M. S. and Goldstein, J. L. (1986). A receptor-mediated pathway forcholesterol homeostasis. Science 232, 34-47.
Cain, C. C., Sipe, D. M. and Murphy, R. F. (1989). Regulation of endocyticpH by the Na+,K+-ATPase in living cells. Proc. Nat. Acad. Sci. USA 86, 544-548.
Dunn, K. W., McGraw, T. E. and Maxfield, F. R. (1989). Iterativefractionation of recycling receptors from lysosomally destined ligands in anearly sorting endosome. J. Cell Biol. 109, 3303-3314.
Dunn, K. W. and Maxfield, F. R. (1992). Delivery of ligands from sortingendosomes to late endosomes occurs by maturation of sorting endosomes. J.Cell Biol. 117, 301-310.
Futter, C. E. and Hopkins, C. R. (1989). Subfractionation of the endocyticpathway: isolation of compartments involved in the processing ofinternalised epidermal growth factor-receptor complexes. J. Cell Sci. 94,685-694.
Ghosh, R. N. and Maxfield, F. R. (1994). Evidence for non-vectorial,retrograde transferrin trafficking in the early endosomes of Hep2 cells.
Goldstein, J. L., Basu, S. K. and Brown, M. S. (1983). Receptor-mediatedendocytosis of low-density lipoprotein in cultured cells. Meth. Enzymol. 98,241-260.
Goldstein, J. L., Brown, M. S., Anderson, R. G. W., Russell, D. W. andSchneider, W. J. (1985). Receptor mediated endocytosis: conceptsemerging from the LDL receptor system. Annu. Rev. Cell Biol. 1, 1-39.
Harford, J. B., Casey, J. L., Koeller, D. M. and Klausner, R. D. (1991).Structure, function and regulation of the transferrin receptor: insights frommolecular biology. In Intracellular Trafficking of Proteins (ed. C. J. Steerand J. A. Hanover), pp. 302-334. Cambridge University Press, Cambridge.
Hopkins, C. R., Gibson, A., Shipman, M. and Miller, K. (1990). Movementof internalized ligand-receptor complexes along a continuous endosomalreticulum. Nature 346, 335-339.
Mattia, E., Rao, K., Shapiro, D. S., Sussman, H. H. and Klausner, R. D.(1984). Biosynthetic regulation of the human transferrin receptor bydesferrioxamine in K562 cells. J. Biol. Chem. 259, 2689-2692.
Maxfield, F. R. and Yamashiro, D. J. (1991). Acidification of organelles andthe intracellular sorting of proteins during endocytosis. In IntracellularTrafficking of Proteins (ed. C. J. Steer and J. A. Hanover), pp. 157-182.Cambridge University Press, Cambridge.
Mayor, S., Presley, J. F. and Maxfield, F. R. (1993). Sorting of membranecomponents from endosomes and subsequent recycling to the cell surfaceoccurs by a bulk flow process. J. Cell Biol. 121, 1257-1269.
R. N. Ghosh and others
2189Transferrin and LDL trafficking in HEp2 cells
Mellman, I., Fuchs, R. and Helenius, A. (1986). Acidification of theendocytic and exocytic pathways. Annu. Rev. Biochem. 55, 663-700.
McGraw, T. E., Greenfield, L. and Maxfield, F. R. (1987). Functionalexpression of the human transferrin receptor cDNA in Chinese hamster ovarycells deficient in endogenous transferrin receptor. J. Cell Biol. 105, 207-214.
McGraw, T. E. and Maxfield, F. R. (1990). Human transferrin receptorinternalization is partially dependent upon an aromatic amino acid on thecytoplasmic domain. Cell Regul. 1, 369-377.
McGraw, T. E. and Maxfield, F. R. (1991). Internalization and sorting ofmacromolecules: endocytosis. In Targeted Drug Delivery (ed. R. L. Juliano),pp. 11-41. Springer-Verlag, Berlin.
McGraw, T. E., Dunn, K. W. and Maxfield, F. R. (1993). Isolation of atemperature-sensitive variant Chinese hamster ovary cell line with amorphologically altered endocytic recycling compartment. J. Cell. Physiol.155, 579-594.
Murphy, R. F. (1991). Maturation models for endosome and lysosomebiogenesis. Trends Cell Biol. 1, 77-82.
Pitas, R. E., Innerarity, T. L., Weinstein, J. N. and Mahley, R. W. (1981).Acetoacetylated lipoproteins used to distinguish fibroblasts frommacrophages in vitro by fluorescence microscopy. Arteriosclerosis 1, 177-185.
Presley, J. F., Mayor, S., Dunn, K. W., Johnson, L. S., McGraw, T. E. andMaxfield, F. R. (1993). The End2 mutation in CHO cells slows the exit oftransferrin receptors from the recycling compartment but bulk membranerecycling is unaffected. J. Cell Biol. 122, 1231-1241.
Salzman, N. H. and Maxfield, F. R. (1988). Intracellular fusion of sequentiallyformed endocytic compartments. J. Cell Biol. 106, 1083-1091.
Salzman, N. H. and Maxfield, F. R. (1989). Fusion accessibility of endocyticcompartments along the recycling and lysosomal endocytic pathways inintact cells. J. Cell Biol. 109, 2097-2104.
Schmid, S. L., Fuchs, R., Male, P. and Mellman, I. (1988). Two distinctsubpopulations of endosomes involved in membrane recycling and transportto lysosomes. Cell 52, 73-83.
Sipe, D. M. and Murphy, R. F. (1987). High-resolution kinetics of transferrinacidification in BALB/c 3T3 cells: Exposure to pH 6 followed bytemperature-sensitive alkalinization during recycling. Proc. Nat. Acad. Sci.USA 84, 7119-7123.
Snider, M. D. and Rogers, O. C. (1985). Intracellular movement of cellsurface receptors after endocytosis: resialylation of asialo-transferrinreceptor in human erythroleukemia cells. J. Cell Biol. 100, 826-834.
Stoorvogel, W., Geuze, H. J., Griffith, J. M. and Strous, G. J. (1988). Thepathways of endocytosed transferrin and secretory protein are connected inthe trans-Golgi reticulum. J. Cell Biol. 106, 1821-1829.
Stoorvogel, W., Strous, G. J., Geuze, H. J., Oorschot, V. and Schwartz, A.L. (1991). Late endosomes derive from early endosomes by maturation. Cell65, 417-427.
Tooze, J. and Hollinshead, M. (1991). Tubular early endosomal networks inAtT20 and other cells. J. Cell Biol. 115, 635-653.
van Deurs, B., Petersen, O. W., Olsnes, S. and Sandvig, K. (1989). The waysof endocytosis. Int. Rev. Cytol. 117, 131-177.
van Deurs, B., Holm, P. K., Kayser, L., Sandvig, K. and Hansen, S. H.(1993). Multivesicular bodies in HEp-2 cells are maturing endosomes. Eur.J. Cell Biol. 61, 208-224.
Warren, G. (1990). Trawling for receptors. Nature 346, 318-319. Wells, K. S., Sandison, D. R., Strickler, J. and Webb, W. W. (1990).
Quantitative fluorescence imaging with laser scanning confocal microscopy.In Handbook of Biological Confocal Microscopy (ed. J. B. Pawley), pp. 27-39. Plenum Publishing Corporation, New York.
Yamashiro, D. J., Tycko, B., Fluss, S. R. and Maxfield, F. R. (1984).Segregation of transferrin to a mildly acidic (pH 6.5) para-Golgicompartment in the recycling pathway. Cell 37, 789-800.
Yamashiro, D. J. and Maxfield, F. R. (1987). Kinetics of endosomeacidification in mutant and wild-type Chinese hamster ovary cells. J. CellBiol. 105, 2713-2721.
(Received 25 February 1994 - Accepted 22 April 1994)