quantification of ligand bias for clinically relevant b ... · classification and, ultimately,...
TRANSCRIPT

1521-0111/85/3/492–509$25.00 http://dx.doi.org/10.1124/mol.113.088880MOLECULAR PHARMACOLOGY Mol Pharmacol 85:492–509, March 2014Copyright ª 2014 by The American Society for Pharmacology and Experimental Therapeutics
Quantification of Ligand Bias for Clinically Relevantb2-Adrenergic Receptor Ligands: Implications forDrug Taxonomy s
Emma T. van der Westhuizen, Billy Breton, Arthur Christopoulos, and Michel BouvierDepartment of Biochemistry and Institute for Research in Immunology and Cancer, University of Montreal, Montreal, Quebec,Canada (E.T.v.d.W., B.B., M.B.); and Drug Discovery Biology and Department of Pharmacology, Monash Institute forPharmaceutical Sciences, Monash University, Parkville, Victoria, Australia (E.T.v.d.W., A.C.)
Received July 29, 2013; accepted December 23, 2013
ABSTRACTThe concepts of functional selectivity and ligand bias are be-coming increasingly appreciated in modern drug discovery pro-grams, necessitating more informed approaches to compoundclassification and, ultimately, therapeutic candidate selection.Using the b2-adrenergic receptor as a model, we present a proofof concept study that assessed the bias of 19 b-adrenergicligands, including many clinically used compounds, across fourpathways [cAMP production, extracellular signal-regulated kinase1/2 (ERK1/2) activation, calcium mobilization, and receptorendocytosis] in the same cell background (human embryonickidney 293S cells). Efficacy-based clustering placed the ligandsinto five distinct groups with respect to signaling signatures. Insome cases, apparent functional selectivity originated from off-target effects on other endogenously expressed adrenergicreceptors, highlighting the importance of thoroughly assessingselectivity of the responses before concluding receptor-specific
ligand-biased signaling. Eliminating the nonselective compoundsdid not change the clustering of the 10 remaining compounds.Some ligands exhibited large differences in potency for thedifferent pathways, suggesting that the nature of the receptor-effector complexes influences the relative affinity of the com-pounds for specific receptor conformations. Calculation of relativeeffectiveness (within pathway) and bias factors (between path-ways) for each of the compounds, using an operational model ofagonism, revealed a global signaling signature for all of thecompounds relative to isoproterenol. Most compounds werebiased toward ERK1/2 activation over the other pathways, con-sistent with the notion that many proximal effectors converge onthis pathway. Overall, we demonstrate a higher level of ligandtexture than previously anticipated, opening perspectives for theestablishment of pluridimensional correlations between signalingprofiles, drug classification, therapeutic efficacy, and safety.
IntroductionThe taxonomy of therapeutic agents has a tremendous
impact on preclinical approaches toward discovery and opti-mization of drug candidates and on decisions made by clini-cians when selecting such agents. Traditionally, most drugs
targeting G protein–coupled receptors (GPCRs) have beenphenotypically classified as full or partial agonists, (neutral)antagonists, or inverse agonists according to their activity ata single canonical signaling pathway. For instance, in the caseof the b2-adrenergic receptor (b2AR), the many availablepositive and inverse agonists, as well as neutral antagonists,are generally classified on the basis of their efficacy towardcAMP signaling. However, it is well known that the b2AR ispleotropically coupled to many pathways (Evans et al., 2010).Indeed, this is a common observation for most GPCRs, andthere are increasing instances of ligand behavior changingwith the pathway under investigation. For example, somecompounds, which are classified as b2AR neutral antagonistsor inverse agonists based on their efficacy toward cAMP, actas agonists toward the extracellular signal-regulated kinase
This work was supported, in part, by grants to M.B. from the CanadianInstitutes for Health Research [MOP 11215]. E.T.v.d.W. was supported bypostdoctoral research fellowships from the Canadian Institutes for HealthResearch; the Canadian Hypertension Society; the Fonds de la Recherche enSanté du Quebec; and the National Health and Medical Research CouncilAustralia (NHMRC). B.B. was supported by a PhD scholarship from the Fondsde la Recherche en Santé du Quebec. A.C. is a Principal Research Fellow of theNHMRC. M.B. holds the Canada Research Chair in Signal Transduction andMolecular Pharmacology.
dx.doi.org/10.1124/mol.113.088880.s This article has supplemental material available at molpharm.
aspetjournals.org.
ABBREVIATIONS: ALP, alprenolol; ATEN, atenolol; b2AR, b2-adrenergic receptor; BET, betaxolol; BIS, bisoprolol; BUC, bucindolol; CARV,carvedilol; CGP-12177, 4-[3-[(1,1-dimethylethyl)amino]2-hydroxypropoxy]-1,3-dihydro-2H-benzimidazol-2-one; CGP-20712A, (6)-2-hydroxy-5-[2-[[2-hydroxy-3-[4-[1-methyl-4-(trifluoromethyl)-1H-imidazol-2-yl]phenoxy]propyl]amino]ethoxy]-benzamide methanesulfonate salt; DMEM, Dulbec-co’s modified Eagle’s medium; EPAC, exchange protein directly activated by cAMP; EPI, epinephrine; ERK1/2, extracellular signal-regulated kinase1/2; FBS, fetal bovine serum; FRET, fluorescence resonance energy transfer; GPCR, G protein–coupled receptor; HA, hemagglutinin; HBSS, Hanks’balanced salt solution; HEK, human embryonic kidney; ICI 118,551, (6)-erythro-(S*,S*)-1-[2,3-(dihydro-7-methyl-1H-inden-4-yl)oxy]-3-[(1-methylethyl)amino]-2-butanol hydrochloride; ISO, isoproterenol; LAB, labetalol; NAD, nadolol; NE, norepinephrine; PE, phenylephrine; PIN,pindolol; PRO, propranolol; SALB, salbutamol; SALM, salmeterol; SB, stimulation buffer; TIM, timolol; UK 14,304, 5-bromo-N-(2-imidazolin-2-yl)-6-quinoxalinamine, 5-bromo-N-(4,5-dihydro-1H-imidazol-2-yl)-6-quinoxalinamine; XAM, xamoterol.
492
http://molpharm.aspetjournals.org/content/suppl/2013/12/23/mol.113.088880.DC1.htmlSupplemental material to this article can be found at:
at ASPE
T Journals on A
pril 27, 2015m
olpharm.aspetjournals.org
Dow
nloaded from

1/2 (ERK1/2) pathway (Azzi et al., 2003; Galandrin andBouvier, 2006; Shenoy et al., 2006).The ability of ligands to differentially influence receptor
behavior in a pathway-dependent manner has been termed“functional selectivity” or “signaling bias” (Kenakin andChristopoulos, 2013) and can generally be attributed to threesources (Kenakin and Christopoulos, 2013): 1) “system bias,”the relative coupling efficiency of a pathway to the receptor; 2)“observation bias,” the experimental conditions unique to theassay used to measure activity; and 3) “agonist or ligand bias,”the ability of a ligand to engender a unique subset of receptorconformations that promotes signaling through distinct path-ways to the exclusion of others. It is only the latter form of biasthat is associated with the structure of the ligand and receptorand thus reflects a molecular property that can be exploitedtherapeutically. The phenomenon of ligand bias means thatthe current taxonomy for b-adrenergic receptor ligands, andprobably most GPCR ligands, is likely incorrect, because theclassification of any particular ligand can change dependingon the pathway under investigation.Given the increasing discovery of biased ligands in GPCR
drug discovery, it is important to develop approaches thatcan easily quantify the phenomenon in a manner that isexperimentally feasible but statistically robust such that itcan objectively inform structure–activity studies and com-pound classification. Significant analytical advances haverecently been described that extend the classic operationalmodel of agonism (Black and Leff, 1983) to quantify ligandbias (Ehlert, 2008; Figueroa et al., 2009; Evans et al., 2011;Rajagopal et al., 2011; Kenakin et al., 2012; Kenakin andChristopoulos, 2013). An important outcome of such analysesis the potential to yield “fingerprints” of compound profiles ina manner that can enrich standard structure–activity andstructure–function studies. Ultimately, such detailed finger-prints may be implemented into drug discovery workflowsand eventually result in entirely different drug taxonomiesthat can allow physicians to make better choices in theirtreatment regimen, with fewer adverse effects in the future.Because the b2AR is a GPCR with a rich pharmacology and
substantial clinical data, it is an ideal candidate for a proofof concept study aimed at developing a chemical biologyframework based on ligand bias determinations for clusteringcompounds in a manner that may predict in vivo efficacy. Assuch, we investigated 19 clinically relevant compounds thatare used for treating diseases such as asthma, chronicobstructive pulmonary disease, cardiovascular disease, mi-graine, and glaucoma and determined their signaling efficacytoward four functional outcomes, namely, the cAMP, ERK1/2,and calcium signaling pathways, as well as b2AR endocytosis.Importantly, both formal clinical studies and anecdotalobservations suggest that some of these compounds may bemore efficacious and/or safer than others for certain clinicalindications, despite having the same relative efficacy towardthe cAMP pathway (Castle et al., 1993; Cruickshank, 1993;Eichhorn and Young, 2001; Javed andDeedwania, 2009; Ram,2010). Although these differences may be attributed to otherproperties of the drugs (polypharmacology, pharmacokinetics,etc.) it is possible that functional selectivity toward differentsignaling pathways may contribute to their different thera-peutic profiles. In-depth characterization of the four chosensignaling profiles led to the identification of five subgroups ofligands with distinct signaling signatures. This represents
a first step for establishing more informative links betweenthe in vitro cell-based data, whole animal studies, and clinicaldata that may lead to the design of next generationb-adrenergic ligands displaying greater selectivity and re-duced side effects profiles.
Materials and MethodsAdrenergic Ligands. (2)-Isoproterenol hydrochloride (ISO), (2)-
norepinephrine (NE), (2)-epinephrine (EPI), salmeterol xinafoate(SALM), labetalol hydrochloride (LAB), alprenolol hydrochloride(ALP), pindolol (PIN), carvedilol (CARV), bisoprolol hemifumarate(BIS), (6)-metoprolol (1)-tartrate salt, timolol maleate salt (TIM),betaxolol hydrochloride (BET), nadolol (NAD), S(2)-atenolol (ATEN),nebivolol hydrochloride, DL-propranolol hydrochloride (PRO), UK14,304 [5-bromo-N-(2-imidazolin-2-yl)-6-quinoxalinamine, 5-bromo-N-(4,5-dihydro-1H-imidazol-2-yl)-6-quinoxalinamine], phenylephrine(PE), and CGP-20712A ((6)-2-hydroxy-5-[2-[[2-hydroxy-3-[4-[1-methyl-4-(trifluoromethyl)-1H-imidazol-2-yl]phenoxy]propyl]amino]ethoxy]-benzamide methanesulfonate salt) were purchased from Sigma-Aldrich (St. Louis, MO). ICI 118,551 [(6)-erythro-(S*,S*)-1-[2,3-(dihydro-7-methyl-1H-inden-4-yl)oxy]-3-[(1-methylethyl)amino]-2-butanolhydrochloride], salbutamol hemisulfate (SALB), and xamoterol hemi-fumarate (XAM) were from Tocris Bioscience (Ellisville, MO). Bucindolol(BUC)was a gift fromDr.Michael Bristow (University of ColoradoHealthSciences Center, Denver, CO).
Biosensor Constructs. GFP10-mutEPAC1(dDEP; T781A; F782A)-venus (henceforth referred to as exchange protein directly activated bycAMP [EPAC] biosensor) was cloned between the NheI and EcoRI sitesof pcDNA3.1/zeo(1). The EPAC biosensor consists of an amino-terminal-Green Fluorescent Protein10 (GFP10) joined by a 5 aminoacid residue (GSAGT) linker to a mutated EPAC1(dDEP; T781A;F782A) biosensor (Ponsioen et al., 2004) and a carboxy-terminal-venusfluorescent protein (venus) joined by a 5 amino acid residue linker(KLPAT). This biosensor contains 2 mutations (T781A; F782A),rendering the biosensor inactive with respect to its guanine nucleotideexchange factor activity toward Rap1 but maintaining its activation bycAMP (Ponsioen et al., 2004). Deletion of the DEP domain createsa cytosolic EPAC biosensor that binds cAMP with micromolar affinity(binding Kd 5 14 6 2 mM; Ponsioen et al., 2004). mCherry-obelin wascloned between the NheI and XbaI sites of pcDNA3.1/zeo(1). Theobelin biosensor consists of an amino-terminal-mCherry joined by 5amino acid residue linker (GSAGT) to the obelin calcium-activatedphotoprotein (Illarionov et al., 2000). The obelin biosensor is a bio-luminescent photoprotein derived from Obelia longissima that tightlybinds the chromophore (coelenterazine) with oxygen to form a stablecomplex, which is activated upon binding 3 calcium ions (linear range ofsensitivity: 100 nM–100 mM; Illarionov et al., 2000).
Cell Culture and Transfections. Human embryonic kidney(HEK) 293S cells stably expressing human b2AR (Galandrin andBouvier, 2006) [HEK-hemagglutinin (HA)-b2AR] were confirmed toexpress 3.17 6 0.32 pmol/mg protein b2AR (whole cell binding with[3H]CGP-12177 (4-[3-[(1,1-dimethylethyl)amino]2-hydroxypropoxy]-1,3-dihydro-2H-benzimidazol-2-one). Cells expressing high levels ofhuman b2AR were selected for this study to enhance the signalsobserved for weak partial agonists and inverse agonists. Cells weretransiently cotransfected with EPAC biosensor (1500 ng/1� 106 cells)andmCherry-obelin (1500 ng/1� 106 cells) using linear polyethylenimine(1 mg/ml) (Polysciences, Warrington, PA) diluted in NaCl (150 mM, pH7.0) (PEI:DNA ratio 3:1) as described (Reed et al., 2006). Cells wereused 48 hours post-transfection for EPAC and obelin measurements.
Phospho-ERK1/2 Measurements. Intracellular phospho-ERK1/2 wasmeasured using the Surefire pERK kit (PerkinElmer, Waltham,MA) using a modified protocol. HEK-HA-b2AR were plated into 96well plates (50,000 cells/well) and grown for 32 hours. Cells wereserum starved [Dulbecco’s modified Eagle’s medium (DMEM); 0.5%fetal bovine serum (FBS)] for 18 hours prior to ligand stimulation.
b2AR Ligands Are Biased toward ERK1/2 Signaling 493
at ASPE
T Journals on A
pril 27, 2015m
olpharm.aspetjournals.org
Dow
nloaded from

Increasing concentration of compounds, diluted in DMEM, wereadded at 37°C for the indicated times to generate full concentration-response curves. Kinetic assays were initially performed using a max-imal concentration of ligands to determine the optimal stimulationtime for measuring concentration-response curves (2 or 4 minutes).Plates were placed on ice, medium aspirated, and lysis buffer(proprietary mix included in the kit, 10 ml/well) added. Plates werefrozen at 220°C for 18 hours to ensure complete cell lysis. Lysateswere thawed, and a sample from each well (4 ml) was transferred toa white 384-well ProxiPlate (PerkinElmer). Activation buffer (1 ml/well), reaction buffer (4 ml/well), and AlphaScreen Protein A IgGbeads (1:120 dilution) (PerkinElmer) were mixed and then added tothe lysates (5 ml/well) in the dark. The lysates were incubated at 25°Cfor 18 hours and then the plates were read using the Fusion-aFP withexcitation at 680 nm (a-laser) and emission at 520–620 nm.
EPAC Biosensor Measurements. HEK-HA-b2AR were cotrans-fected with the EPAC and mCherry-obelin biosensors (as describedabove) then replated into 96-well white CulturPlates (PerkinElmer)(50,000 cells/well). Cells were serum starved (DMEM, 0.5% FBS) for18 hours prior to stimulation. Wells were washed 1� phosphate-buffered saline, 1� stimulation buffer [Hanks’ balanced salt solution(HBSS): 137 mM NaCl, 5.4 mM KCl, 0.25 mM Na2HPO4, 0.44 mMKH2PO4, 1.8 mMCaCl2, 0.8 mMMgSO4, 4.2 mMNaHCO3, 0.2% (w/v)D-glucose, pH 7.4]. Under basal conditions, the GFP10 and venusfluorescent proteins (FPs) are within close proximity, such that uponexcitation of the GFP10 with a laser at 400 nm, fluorescence resonanceenergy transfer (FRET) occurs between GFP10 and venus. The lightemitted from both FPs is measured using emission filters set at 510nm (GFP10) and 533 nm (venus) and the FRET ratio (venus emissionover GFP10 emission) determined. Upon activation of the EPACbiosensor, a conformational change within the biosensor causesGFP10 and venus to move away from each other, decreasing theFRET between these proteins. Thus, increases in intracellular cAMPlevels are observed as a decrease in the FRET ratio, whereasdecreases in the intracellular cAMP levels results in an increase inthe FRET ratio. Increasing concentrations of compounds, diluted inHBSS, were added to the wells at 37°C for the indicated times togenerate full concentration-response curves. Kinetic assays wereinitially performed using a maximal concentration of ligands todetermine the optimal stimulation time for measuring concentration-response curves (30 minutes) at 37°C.
Obelin Biosensor Measurements. HEK-HA-b2AR cotrans-fected with the EPAC biosensor and mCherry-obelin were replated,starved, and washed as described for the EPACmeasurements above.Cells were preincubated with the obelin substrate, coelenterazine cp(1 mM; 25°C), for 2 hours in the dark. Under basal conditions, a lowlevel of calcium-independent luminescence is observed (Illarionovet al., 2000). Upon calcium binding, the photoprotein oxidizescoelenterazine cp, converting it to coelenteramide, releasing carbondioxide and light in the blue range (465–495 nm) (Illarionov et al.,2000). Therefore, with an increase in intracellular calcium levels, anincrease in luminescence is observed. Compounds, diluted in stim-ulation buffer were injected into the wells, and luminescence wasmeasured using the SpectraMax L (Molecular Devices, Sunnyvale,CA). Full kinetics were determined for each concentration of ligand(60 seconds), and concentration-response curves were determinedfrom the peak calcium responses.
Receptor Endocytosis Enzyme-Linked Immunosorbent As-say. HEK-HA-b2AR (50,000 cells/well) were plated into whiteCulturPlates (PerkinElmer) and grown for 32 hours, then serumstarved (DMEM, 0.5% FBS) for 18 hours prior to endocytosis assay.Wells were washed 1� phosphate-buffered saline, 1� stimulationbuffer (SB) [HBSS: 137 mM NaCl, 5.4 mM KCl, 0.25 mM Na2HPO4,0.44 mM KH2PO4, 1.8 mM CaCl2, 0.8 mM MgSO4, 4.2 mM NaHCO3,0.2% (w/v) D-glucose, 0.5% (w/v) bovine serum albumin, pH 7.4).Increasing concentration of compounds, diluted in SB, were added at37°C for the indicated times to generate full concentration-responsecurves. Kinetic assays were initially performed using a maximal
concentration of ligands to determine the optimal stimulation time formeasuring concentration-response curves (30 minutes). Plates wereplaced on ice, stimulation buffer aspirated, and cells fixed withparaformaldehyde (3%w/v) for 10minutes at 23°C. Cells were washed(3� 10 minutes, SB) before the addition of anti–HA-HRP (3F10; 1:3000) (Roche, Indianapolis, IN) (18 hours, 4°C). Following, cells werewashed (3� 10 minutes, SB), Vybrant dye (Invitrogen, Carlsbad, CA;1:2000) was added (30 minutes, 25°C), and cells were washed again(3� 10 minutes, SB). Vybrant fluorescence was measured withexcitation at 480 nm and emission at 538 nm auto cutoff 530 nmusing the FlexStationII (Molecular Devices) to control for the numberof cells/well. Western lightning-plus ECL (PerkinElmer) was added tothe wells (50 ml/well) and incubated for 1 minute in the dark, and thenchemiluminescence was measured for 1 second/well in the Spectra-MaxL (Molecular Devices)
Preparation of Ligands. All ligands were prepared from powderimmediately prior to each experiment in vehicle and used immedi-ately. All compounds were diluted from stock solutions (10 mM) intostimulation buffer (HBSS) (cAMP, calcium and enzyme-linkedimmunosorbent assay), or DMEM (ERK1/2 assays). Since ISO issusceptible to oxidation, ascorbate is often used to prevent oxidation.However, we elected not to systematically use ascorbate in ourexperiments because we found that low concentrations of ascorbate(34 nM) directly activated ERK1/2 signaling in HEK-HA-b2AR cells ina rapid and transient manner (Supplemental Fig. 1). This would havea significant impact on the quantification of signaling biases of theadrenergic ligands at the b2AR. To confirm that the oxidation of ISOin the experiments had no significant effect on the cAMP assay (theassay with the longest duration; 30 minutes), the kinetics andconcentration-response curves to ISO were compared in stimulationbuffer with or without ascorbate (0.1 mM) (Supplemental Fig. 2).Because no significant effect was observed on the ISO-stimulatedcAMP responses with or without ascorbate, we concluded that therewould be no impact on the bias calculations if ascorbate was excludedfrom the stimulation buffer.
Data Analysis. For each assay, data were normalized as per-centage of the maximal isoproterenol-stimulated response. All valuesare expressed as themean6 S.E.M. of n experiments. The operationalmodel (Black and Leff, 1983) was used to determine the transductionratios (t/KA) of the agonists using eq. 5, derived from the standardform of the operational model by eq. 1:
E5Basal1ðEm 2BasalÞtn½A�ntn½A�n 1 ð½A�1KAÞn (1)
Where the "Basal" parameter was added for fitting nonzero basalresponses. Dividing through by KA yields the t/KA ratio by eq. 2:
E5Basal1ðEm 2BasalÞ
�tKA
�n½A�n�
tKA
�n½A�n 1
�½A�KA
11�n (2)
The t/KA was redefined as the single fitted parameter, R, such that
E5Basal1ðEm 2BasalÞRn½A�n
Rn½A�n 1�½A�KA
11�n (3)
The equation was then simplified by dividing above and below byRn[A]n
E5Basal1ðEm 2BasalÞ
11
0@�
½A�KA
11
�R�½A�
1A
n (4)
For curve-fitting purposes, the parameters KA and Rwere recast aslogarithms (i.e., 10logKA, 10logR), yielding the final equation used fordirect curve fitting:
494 van der Westhuizen et al.
at ASPE
T Journals on A
pril 27, 2015m
olpharm.aspetjournals.org
Dow
nloaded from

E5Basal1ðEm 2BasalÞ
11
0@�
½A�10logKA
11
�10logR�½A�
1A
n (5)
where E is the effect of the ligand, [A] is the concentration of agonist,Em is the maximal possible response of the system, Basal is the basallevel of response in the absence of agonist, logKA denotes thelogarithm of the functional equilibrium dissociation constant of theagonist, n is the slope of the transducer function that links occupancyto response, and logR is the logarithm of the “transduction coefficient”(or “transduction ratio”), t/KA, where t is an index of the couplingefficiency (or efficacy) of the agonist. For more details, see Evans et al.(2011), Kenakin et al., (2012), and Kenakin and Christopoulos (2013).For the analysis, all families of agonist curves at each pathway wereglobally fitted to the model with the parameters, Basal, Em, and nshared between all agonists. For full agonists, the logKA wasconstrained to a value of zero,1 whereas for partial agonists this wasdirectly estimated by the curve fitting procedure. The logR [i.e., log(t/KA)] parameter was estimated as a unique measure of activity foreach agonist.
The relationship between the Black–Leff model and the parame-ters that describe the standard empirical logistic equation (i.e., EC50
and Emax) has been described previously (Black et al., 1985; Kenakinet al., 2012). In brief,
½EC50�5 KA
ð21 tnÞ1=n 21(6)
and
Emax 5Emt
n
11 tn(7)
All data were analyzed using the nonlinear curve fitting equationsin GraphPad Prism (v6.0; GraphPad Software, La Jolla, CA) toestimate the pEC50 values of the curves for the different pathways.Ligand bias was quantified by analyzing the concentration-responsecurves using the operational model of agonism, as described pre-viously (Evans et al., 2010; Kenakin et al., 2012), according to eq. 5(see Supplemental Appendix 1 for GraphPad Prism equations andfitting parameters).
The assessment of true ligand bias requires the elimination of theinfluence of system and observation bias to the observed functionalselectivity (Kenakin and Christopoulos, 2013). This is achieved bycomparing ligand activity at a given signaling pathway to that ofa reference compound. In our study, ISO was selected as the referencecompound because it did not activate any of the four pathwaysthrough other adrenergic receptors and had similar potencies towardall four signaling pathways. Thus, to determine the relative effec-tiveness of the compounds to activate the different signaling path-ways, the difference between the log(t/KA) values was calculated usingeq. 8:
Dlog�
t
KA
�5 log
�t
KA
�LIGAND
2 log�
t
KA
�ISO
(8)
The compounds’ effectiveness toward each pathway, relative to ISO,were calculated as the inverse logarithm of the Dlog(t/KA) using eq. 9:
relative effectiveness510Dlogð tKAÞ (9)
Ligand bias was calculated using eqs. 10 and 11 as the differencebetween the Dlog(t/KA) values derived from eq. 8:
DDlog�
t
KA
�5Dlog
�t
KA
�L1:P1
2Dlog�
t
KA
�L2:P2
(10)
bias factor510DDlogð tKAÞ (11)
where L1 is ligand 1, P1 is pathway 1, L2 is ligand 2, andP2 is pathway 2.The S.E.M. was calculated for the transduction ratios log(t/KA)
using eq. 12:
S:E:M:5sffiffiffin
p (12)
where s is the standard deviation, and n is the number ofexperiments. To avoid propagation of the error through the multiplesubtraction steps, the estimated standard errors for each ligand andeach pathway were calculated using eqs. 13 and 14:
S:E:�Dlogð t
KA�5
ffiffiffiffiffiffiffiffiffiffiffiffiffiffiffiffiffiffiffiffiffiffiffiffiffiffiffiffiffiffiffiffiffiffiffiffiffiffiffiffiffiffiffiffiffiffiffiffiffiffiffiffiffiffiffiffiðS:E:M:L1Þ2 2 ðS:E:M:L2Þ2
q(13)
S:E:�DDlog
�t
KA
��5
ffiffiffiffiffiffiffiffiffiffiffiffiffiffiffiffiffiffiffiffiffiffiffiffiffiffiffiffiffiffiffiffiffiffiffiffiffiffiffiffiffiffiffiffiffiffiffiffiffiffiffiffiffiffiffiffiffiffiffiffiffiffiffiffiffiffiffiffiffiffiffiffiffiffiffiffiffiffiffiffiffiffiffiffiffiffiffiffiffiffiffiffiffiffiffiffiffiffiffiffiffiffiffiffi0@S:E:�
Dlog
�t
KA
��L1:P1
1A
2
2
0@S:E:�
Dlog
�t
KA
��L2:P2
1A
2vuuut
(14)
where L1 is ligand 1, L2 is ligand 2, P1 is pathway 1, and P2 ispathway 2. A detailed set of instructions on how to calculate biaseswith examples taken from this study are included as SupplementalAppendix 1.
Statistical analysis was performed using a two-way unpairedStudent’s t test on the Dlog(t/KA) ratios to make pairwise comparisonsbetween two pathways activated by a given ligand, where P , 0.05was considered to be statistically significant.
ResultsDifferent Potency and Efficacy Profiles Were Ob-
served for Adrenergic Ligands toward Four DistinctSignaling Outputs. Initially, 17 b-adrenergic ligands cur-rently used in various clinical indications (Castle et al., 1993;Cruickshank, 1993; Eichhorn and Young, 2001; Javed andDeedwania, 2009; Ram, 2010) and 2 endogenous ligands wereselected to assess their functional selectivity toward 4signaling pathways: cAMP production, calcium mobilization,ERK1/2 activation, and receptor endocytosis (Tables 1 and 2).For reference purposes, the compounds, structures, bindingaffinities (from published radioligand binding studies), rela-tive efficacies (previously reported for cAMP production),receptor subtype selectivity profile, and clinical uses are
1Because model parameter redundancy, it is usually not possible to estimate separate t or KA values for full agonists from direct fitting of the operational model toa full agonist concentration-response curve unless additional experimental manipulations are performed to provide information about other model parameters(e.g., receptor alkylation studies to reduce system maximum responsiveness and thus allow estimation of Em) or parameter values are constrained to prior knownvalues. However, the t/KA ratio, as a single fitted parameter (R in the formulation used herein), can still be estimated from full agonist concentration-responsecurves because it is obtained from the EC50 of the full agonist curve. Specifically, in operational model terms, the EC50 5 KA/[(21 t n)1/n21] (Black et al., 1985).For high efficacy agonists (high t values), this reduces to KA/(t
n)1/n. If the transducer slope, n, equals 1, then the t/KA ratio is simply the reciprocal of the fullagonist’s EC50 value. Constraining the LogKA parameter in the operational model equation to an arbitrarily low “dummy” value, such as zero, ensuresconvergence of full agonist data to the correct t/KA ratio (i.e., LogR parameter).
b2AR Ligands Are Biased toward ERK1/2 Signaling 495
at ASPE
T Journals on A
pril 27, 2015m
olpharm.aspetjournals.org
Dow
nloaded from
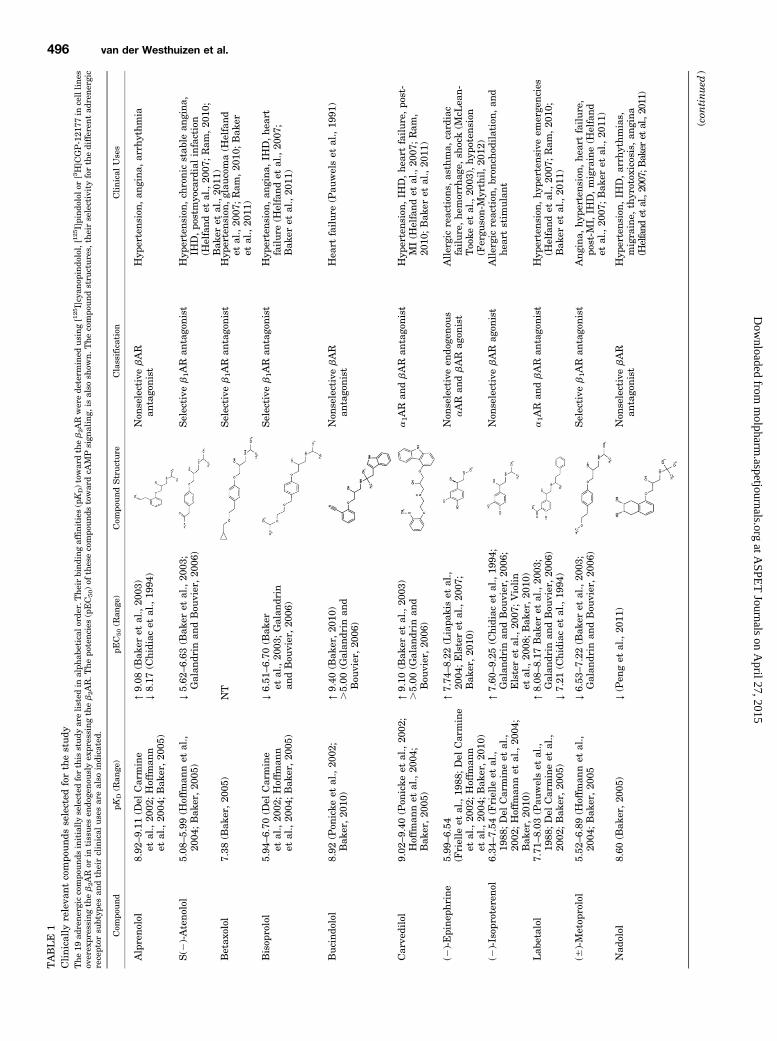
TABLE
1Clinicallyreleva
ntcompo
unds
selected
forthestudy
The19
adrenergiccompo
unds
initiallyselected
forthis
study
arelisted
inalph
abetical
orde
r.Theirbindingaffinities(pKD)tow
ardtheb2ARwerede
term
ined
using[125I]cyan
opindo
lol,[125I]pind
olol
or[3H]C
GP-121
77in
celllines
overex
pressingtheb2AR
orin
tissues
endo
genou
slyex
pressingtheb2AR.T
hepo
tencies
(pEC50)of
thesecompo
unds
towardcA
MPsign
aling,
isalso
show
n.T
hecompo
undstru
ctures,
theirselectivityforthedifferen
tad
renergic
receptor
subtyp
esan
dtheirclinical
usesarealso
indicated.
Com
pound
pKD(R
ange
)pE
C50(R
ange
)Com
poundStructur
eClassification
Clinical
Uses
Alpreno
lol
8.92
–9.11
(Del
Carmine
etal.,20
02;Hoffm
ann
etal.,20
04;Bak
er,20
05)
↑9.08
(Bak
eret
al.,20
03)
Non
selectivebAR
antago
nist
Hyp
ertens
ion,
angina
,arrh
ythm
ia↓8.17
(Chidiac
etal.,19
94)
S(2
)-Ateno
lol
5.08
–5.99
(Hoffm
annet
al.,
2004
;Bak
er,20
05)
↓5.62
–6.63
(Bak
eret
al.,20
03;
Galan
drin
andBou
vier,20
06)
Selective
b1AR
antago
nist
Hyp
ertens
ion,
chronicstab
lean
gina
,IH
D,po
stmyo
card
ialinfaction
(Helfand
etal.,20
07;Ram
,20
10;
Bak
eret
al.,20
11)
Betax
olol
7.38
(Bak
er,20
05)
NT
Selective
b1AR
antago
nist
Hyp
ertens
ion,
glau
coma(H
elfand
etal.,20
07;Ram
,20
10;Bak
eret
al.,20
11)
Bisop
rolol
5.94
–6.70
(Del
Carmine
etal.,20
02;Hoffm
ann
etal.,20
04;Bak
er,20
05)
↓6.51
–6.70
(Bak
eret
al.,20
03;Galan
drin
andBou
vier,20
06)
Selective
b1AR
antago
nist
Hyp
ertension
,an
gina,
IHD,hea
rtfailur
e(H
elfand
etal.,20
07;
Bak
eret
al.,20
11)
Bucind
olol
8.92
(Pon
icke
etal.,20
02;
Bak
er,20
10)
↑9.40
(Bak
er,20
10)
Non
selectivebAR
antago
nist
Hea
rtfailur
e(Pau
welset
al.,19
91)
.5.00
(Galan
drin
and
Bou
vier,20
06)
Carve
dilol
9.02
–9.40
(Pon
icke
etal.,20
02;
Hoffm
annet
al.,20
04;
Bak
er,20
05)
↑9.10
(Bak
eret
al.,20
03)
a1AR
andbAR
antago
nist
Hyp
ertens
ion,
IHD,he
artfailur
e,po
st-
MI(H
elfand
etal.,20
07;Ram
,20
10;Bak
eret
al.,20
11)
.5.00
(Galan
drin
and
Bou
vier,20
06)
(2)-Epine
phrine
5.99
–6.54
(Frielle
etal.,19
88;Del
Carmine
etal.,20
02;Hoffm
ann
etal.,20
04;Bak
er,20
10)
↑7.74
–8.22
(Liapa
kiset
al.,
2004
;Elsteret
al.,20
07;
Bak
er,20
10)
Non
selectiveen
doge
nous
aAR
andbAR
agon
ist
Allergicreaction
s,as
thma,
card
iac
failur
e,hem
orrh
age,
shock(M
cLea
n-Tooke
etal.,20
03),hy
potens
ion
(Fergu
son-Myrthil,20
12)
(2)-Isop
rotereno
l6.34
–7.54
(Frielle
etal.,
1988
;Del
Carmineet
al.,
2002
;Hoffm
annet
al.,20
04;
Bak
er,20
10)
↑7.60
–9.25
(Chidiac
etal.,19
94;
Galan
drin
andBou
vier,20
06;
Elsteret
al.,20
07;Violin
etal.,20
08;Bak
er,20
10)
Non
selectivebAR
agon
ist
Allergicreaction
,bron
chod
ilation,
and
heartstim
ulan
t
Lab
etalol
7.71
–8.03
(Pau
welset
al.,
1988
;Del
Carmineet
al.,
2002
;Bak
er,20
05)
↑8.08
–8.17
Bak
eret
al.,20
03;
Galan
drin
andBou
vier,20
06)
a1AR
andbAR
antago
nist
Hyp
ertens
ion,
hype
rten
sive
emerge
ncies
(Helfand
etal.,20
07;Ram
,20
10;
Bak
eret
al.,20
11)
↓7.21
(Chidiac
etal.,19
94)
(6)-Metop
rolol
5.52
–6.89
(Hoffm
annet
al.,
2004
;Bak
er,20
05↓6.53
–7.22
(Bak
eret
al.,20
03;
Galan
drin
andBou
vier,20
06)
Selective
b1AR
antago
nist
Ang
ina,
hype
rten
sion
,hea
rtfailur
e,po
st-M
I,IH
D,migraine(H
elfand
etal.,20
07;Bak
eret
al.,20
11)
Nad
olol
8.60
(Bak
er,20
05)
↓(Pen
get
al.,20
11)
Non
selectivebAR
antago
nist
Hyp
ertens
ion,
IHD,arrh
ythm
ias,
migraine,
thyrotox
icosis,an
gina
(Helfand
etal.,2007;B
aker
etal.,2011)
(con
tinued
)
496 van der Westhuizen et al.
at ASPE
T Journals on A
pril 27, 2015m
olpharm.aspetjournals.org
Dow
nloaded from

TABLE
1—Con
tinued
Com
pound
pKD(R
ange
)pE
C50(R
ange
)Com
poundStructure
Classification
Clinical
Uses
Neb
ivolol
7.31
–7.92
(Pau
welset
al.,
1988
;Bak
er,20
10)
NR
–↓7.05
(Bak
er,20
10;
Pau
welset
al.,19
91)
Selective
b1AR
antago
nist,also
activa
tesnitric
oxidepa
thway
.Hyp
ertens
ion,
hea
rtfailur
e(R
am,20
10;Bak
eret
al.,20
11)
(2)-Norep
inep
hrine
4.19
–5.41
(Frielle
etal.,19
88;
Hoffm
annet
al.,20
04;Del
Carmineet
al.,20
02;
Bak
er,20
10)
↑5.61–
7.46
(Liapa
kiset
al.,
2004
;Elsteret
al.,20
07;
Bak
er,20
10)
Non
selectiveen
doge
nous
aAR
andbAR
agon
ist
Sev
erehy
potens
ion(Fergu
son-Myrthil,
2012
)
Pindo
lol
8.32
–9.32
(Pau
welset
al.,19
88;
Del
Carmineet
al.,20
02;
Hoffm
annet
al.,20
04;
Bak
er,20
10)
↑8.96
(Bak
eret
al.,
2003
)Non
selectivebAR
antago
nist
Hyp
ertens
ion(H
elfand
etal.,20
07)
↓7.44
(Chidiac
etal.,
1994
)
(6)-Propr
anolol
9.08
–9.37
(Del
Carmineet
al.,
2002
;Pon
icke
etal.,20
02;
Hoffm
annet
al.,20
04;
Bak
er,20
05)
↓8.10
–9.17
(Bak
eret
al.,
2003
;Galan
drin
and
Bou
vier,20
06)
Non
card
ioselective
bAR
antago
nist
Hyp
ertens
ion,
angina
,atrial
arrh
ythm
ia,po
rtal
hyp
ertens
ion,
anxiety,
trem
or,thyrotox
icosis,
migraine(H
elfandet
al.,20
07;Bak
eret
al.,20
11)
Salbu
tamol
5.66
–6.42
(Del
Carmineet
al.,
2002
;Bak
er,20
05,20
10;
Hoffm
annet
al.,20
04)
↑7.10
–7.72
(Elsteret
al.,
2007
;Bak
er,20
10)
Selective
b2AR
agon
ist
Asthm
a,ch
ronicob
stru
ctivepu
lmon
ary
diseas
e(C
astleet
al.,19
93)
Salmeterol
7.61
–9.26
(Hoffm
annet
al.,
2004
;Bak
er,20
05,20
10)
↑8.74
–9.89
(Elsteret
al.,
2007
;Bak
er,20
10)
Selective
b2AR
agon
ist
Asthm
a,ch
ronicob
stru
ctivepu
lmon
ary
diseas
e,allergy(C
astleet
al.,19
93)
Tim
olol
9.68
(Bak
er,20
05)
↓8.00
–8.89
(Chidiac
etal.,
1994
;Bak
eret
al.,20
03)
Non
selectivebAR
antago
nist.
Hyp
ertens
ion,
glau
coma,
IHD,migraine,
post-M
I(H
elfand
etal.,20
07;Bak
eret
al.,20
11)
Xam
oterol
5.55
–6.07
(Isoga
yaet
al.,19
99;
Del
Carmineet
al.,20
02;
Bak
er,20
05)
↑(D
elCarmineet
al.,20
02)
Selective
b1AR
partial
agon
ist
Myo
card
ialisch
emia,mild-mod
erate
heartfailur
e(C
ruicks
hank
,19
93)
IHD,ischem
ichea
rtdiseas
e;MI,
myo
card
ialinfarction
;NR,noresp
onse;N
T,not
tested
.
b2AR Ligands Are Biased toward ERK1/2 Signaling 497
at ASPE
T Journals on A
pril 27, 2015m
olpharm.aspetjournals.org
Dow
nloaded from

TABLE
2Poten
cies,relative
efficacies
(Emax)
andkineticsof
activa
tion
ofcA
MP,ERK1/2,
calcium
sign
alingpa
thway
s,an
dreceptor
endo
cytosisby
adrene
rgic
liga
nds
HEK-H
A-b
2ARcellswerestim
ulatedwithdifferen
tconcentrations
ofclinically
releva
ntad
renergicliga
nds
andresp
onsesweremea
suredfor4distinct
sign
alingpa
thway
s(cAMP,3
0minutes;ERK1/2,
2or
4minutes;calcium
0–60
seconds
anden
docytosis30
minutes).T
heneg
ativepE
C50va
lues
repo
rted
forsomeliga
nds
mea
nthat
thecu
rvewas
biph
asic,a
ndthesearethepE
C50va
lues
forthepa
rtof
thecu
rvefollow
ingtheEmax.Dataarethemea
n6
S.E.M
.of
4–6inde
pende
ntex
perimen
tswithrepe
atsin
duplicate.
Ligan
dcA
MP
pERK1/2
Ca2
+Endo
cytosis
pEC50
Emax
t 1/2
pEC50
Emax
Pea
kpE
C50
Emax
Pea
kpE
C50
Emax
t 1/2
%IS
Ominutes
%IS
Ominutes
%IS
Oseconds
%IS
Ominutes
ISO
a8.23
60.15
100
2.54
60.18
7.95
60.13
100
47.47
60.21
100
18.0
61.08
7.88
60.26
100
7.64
60.04
EPI
7.78
60.23
74.046
6.19
1.64
60.05
6.79
60.19
157.76
14.13
26.82
60.08
112.06
4.10
17.4
60.87
7.26
60.16
115.56
6.24
12.266
0.02
NE
7.08
60.25
88.326
8.53
1.74
60.16
6.48
60.12
154.66
9.26
26.21
60.24
58.016
9.43
21.7
61.32
5.64
60.30
90.006
12.5
12.406
0.04
SALBa
9.08
60.31
111.36
10.5
2.29
60.12
10.816
0.28
87.166
5.89
27.72
60.28
50.936
4.50
19.8
60.46
5.93
60.31
44.946
6.86
5.62
60.34
SALM
a8.63
60.20
105.56
6.11
1.94
60.14
10.146
0.23
74.396
5.28
25.80
60.39
34.456
6.10
30.9
62.86
.4.00
NR
NR
LABa
7.82
60.23
51.846
3.73
2.61
60.38
10.286
0.28
111.96
7.52
4.4.00
NR
NR
.4.00
NR
NR
BUCa
8.64
60.38
62.076
7.48
2.45
60.16
8.51
60.41
107.26
22.1
2.4.00
NR
NR
.4.00
NR
NR
24.86
60.26
ALP
9.81
60.39
35.766
3.70
2.64
60.61
9.54
60.28
102.36
5.71
4.4.00
NR
NR
.4.00
NR
NR
26.63
60.34
PIN
a9.50
60.49
18.436
2.51
0.96
60.14
8.90
60.48
81.556
19.86
4.4.00
NR
NR
.4.00
NR
NR
25.76
60.34
XAM
a.4.00
NR
NR
6.58
60.22
102.76
8.63
4.4.00
NR
NR
.4.00
NR
NR
PRO
.4.00
NR
NR
7.87
60.13
77.286
7.18
4.4.00
NR
NR
.4.00
NR
NR
25.79
60.44
CARVa
.4.00
NR
NR
7.98
60.12
88.556
12.47
4.4.00
NR
NR
.4.00
NR
NR
25.68
60.35
ICI
7.95
60.45
235
.466
5.39
14.156
0.13
.4.00
NR
NR
.4.00
NR
NR
.4.00
NR
NR
BIS
6.96
60.77
218
.256
5.04
6.50
61.01
.4.00
NR
NR
.4.00
NR
NR
.4.00
NR
NR
BETa
6.75
60.42
239
.806
10.8
5.42
62.69
.4.00
NR
NR
.4.00
NR
NR
.4.00
NR
NR
MET
6.87
60.55
239
.006
9.46
6.68
62.46
.4.00
NR
NR
.4.00
NR
NR
.4.00
NR
NR
NEB
7.46
60.57
213
.796
4.04
17.486
3.94
.4.00
NR
NR
.4.00
NR
NR
.4.00
NR
NR
NAD
a8.24
60.37
234
.076
7.80
3.48
61.57
.4.00
NR
NR
.4.00
NR
NR
.4.00
NR
NR
ATEN
5.44
60.44
249
.386
10.9
7.77
61.99
.4.00
NR
NR
.4.00
NR
NR
.4.00
NR
NR
TIM
8.81
60.40
244
.456
5.28
4.47
60.11
.4.00
NR
NR
.4.00
NR
NR
.4.00
NR
NR
ICI,
ICI11
8,55
1;MET,m
etop
rolol;NEB,neb
ivolol;NR,no
resp
onse.
aCom
pounds
that
wereselectivelysign
alingviatheb2AR.
498 van der Westhuizen et al.
at ASPE
T Journals on A
pril 27, 2015m
olpharm.aspetjournals.org
Dow
nloaded from

Fig. 1. Selective adrenoceptor antagonists differentially block the EC50-80 of clinically relevant ligands toward the four signaling outcomes. Cells werepretreated (1 hour, 37°C) with selective adrenoceptor antagonists, CGP-20712A (b1AR; 100 nM), ICI 118,551 (b2AR; 100 nM), prazosin (a1AR; 10 nM), orrauwolscine (a2AR; 100 nM) and then treated with ISO (100 nM cAMP; 10 nM ERK1/2, 1 mM calcium, 10 mM endocytosis), EPI (3 mM cAMP; 10 mMERK1/2, 10 mM calcium; 10 mMendocytosis), NE (3 mM cAMP; 3 mMERK1/2; 10 mM calcium, 10 mMendocytosis), SALB (1 nM cAMP; 0.1 nMERK1/2, 10mM calcium, 10 mM endocytosis), SALM (100 nM cAMP; 3 nMERK1/2; 10 mM calcium), LAB (3 nM cAMP; 1 nMERK1/2), ALP (1 nM cAMP; 3 nMERK1/2), BUC (30 nM cAMP; 10 nM ERK1/2), PIN (10 mM cAMP; 10 nM ERK1/2), XAM (1 mM ERK1/2), CARV (30 nM ERK1/2), PRO (100 nM ERK1/2),
b2AR Ligands Are Biased toward ERK1/2 Signaling 499
at ASPE
T Journals on A
pril 27, 2015m
olpharm.aspetjournals.org
Dow
nloaded from

provided for each compound (Table 1). The first step toquantify the ligand biases at the b2AR was to carefully selectthe test ligands and determine full concentration-responsecurves for the different pathways for all ligands. Second,signaling efficacy was analyzed using the operational modelcurve-fitting parameters, and finally ligand biases werecalculated (see Materials and Methods and SupplementalAppendix 1). The maximal response (Emax) and the potency(pEC50) for each compound demonstrate that each has aunique signaling signature (Table 2).Some Adrenergic Ligands Activate Signaling Path-
ways through Multiple Adrenoceptor Subtypes. Sev-eral compounds included in this study were reported to act at
other adrenergic receptor subtypes (Table 1). To eliminatepossible confounding effects resulting from activation of otherendogenously expressed adrenergic receptors, a single con-centration of each agonist (pEC50–pEC80 toward a particularsignaling output) was tested in cells pretreated (60 minutes)with adrenergic antagonists at concentrations that fullyoccupy the targeted receptors with marginal occupancy (lessthan 11% of b2AR occupancy for all ligands) of the otherreceptor subtypes [b1AR: CGP-20712A (100 nM, 11% occu-pancy at b2AR), b2AR: ICI 118,551 (100 nM, 100% occupancyat b2AR), a1AR: prazosin (10 nM, .0.01% occupancy atb2AR), a2AR: rauwolscine (100 nM, 0.2% occupancy at b2AR)](Fig. 1). These compounds were selected for their lack of
nebivolol (NEB; 1 mM cAMP), ATEN (10 mM cAMP), TIM (1 mM cAMP), BET (10 mM cAMP), metoprolol (MET; 10 mM cAMP), BIS (10 mM cAMP), NAD(10 mM cAMP) (37°C). Responses were measured toward cAMP (30 minutes), ERK1/2 (2–4 minutes), calcium (0–60 seconds), and receptor endocytosis(30 minutes) after stimulation with test compounds. Data are the mean 6 S.E.M. of 4–6 independent experiments with repeats in duplicate. The datawere analyzed by one-way analysis of variance with a Dunnett post hoc test (comparing to the effect of the compound alone): aP , 0.05 for cAMP; bP ,0.05 for ERK1/2; cP , 0.05 for calcium; dP , 0.05 for receptor endocytosis.
Fig. 2. Increasing concentrations of theb2AR-selective antagonist ICI 118,551shifts the agonist-stimulated concentra-tion-response curves of cAMP. Pretreatingcells with ICI 118,551 (10 nM or 1 mM; 60minutes) right-shifted the concentration-response curves of the b2AR-selectiveligands ISO (A), SALB (B), SALM (C),LAB (D), BUC (E), PIN (F) in a classicallycompetitive manner. Data are the mean6S.E.M. of 5 independent experiments per-formed in triplicate.
500 van der Westhuizen et al.
at ASPE
T Journals on A
pril 27, 2015m
olpharm.aspetjournals.org
Dow
nloaded from

intrinsic efficacies on the pathways tested except for ICI118,551, which was an inverse agonist toward cAMP(Supplemental Fig. 3; Table 2).The responses for seven of the compounds (EPI, NE, ALP,
PRO, ATEN, TIM, BET) were partially inhibited by a non-b2AR antagonist, suggesting that some of their activity
originates from binding to a different adrenergic receptorsubtype (Fig. 1). Although activation of the cAMP, calcium,and endocytotic pathways by the agonist compounds were allb2AR specific, (defined by sensitivity to antagonism by ICI118,151 but not CGP-20712A, prazosin, or rauwolscine), theERK1/2 activation promoted by some of the compounds (EPI,
Fig. 3. Increasing concentrations of theb2AR-selective antagonist ICI 118,551shifts the agonist-stimulated concentra-tion-response curves of ERK1/2. Pretreat-ing cells with ICI 118,551 (10 nM or 1 mM;60 minutes) right-shifted the concentra-tion-response curves of the b2AR-selectiveligands ISO (A), SALB (B), SALM (C),LAB (D), BUC (E), PIN (F), XAM (G),CARV (H). Data are the mean6 S.E.M. of5 independent experiments performed intriplicate.
b2AR Ligands Are Biased toward ERK1/2 Signaling 501
at ASPE
T Journals on A
pril 27, 2015m
olpharm.aspetjournals.org
Dow
nloaded from
NE, ALP, and PRO) involved the a2AR (NE and EPI), a1AR(PRO), or both (ALP). To determine whether the endogenouslyexpressed a1AR and a2AR could activate ERK1/2 signaling inthe HEK-HA-b2AR cells, the effects of the a1AR agonist PEand the a2AR agonist, UK 14,304 were tested (SupplementalFig. 4). ERK1/2 was activated by PE and UK 14,304 in theHEK-HA-b2AR cells, demonstrating that the endogenouslyexpressed a1AR and a2AR were coupled to ERK1/2 signalingand could contribute to the overall ERK1/2 responsesobserved in the HEK-HA-b2AR cells. Although activation ofmultiple receptors contributes to the signaling textures ofthese ligands, the contribution of additional receptors to theresponse profile greatly complicates the interpretation ofpotential ligand-biased signaling through the b2AR (systembias). These ligands were excluded from further experiments
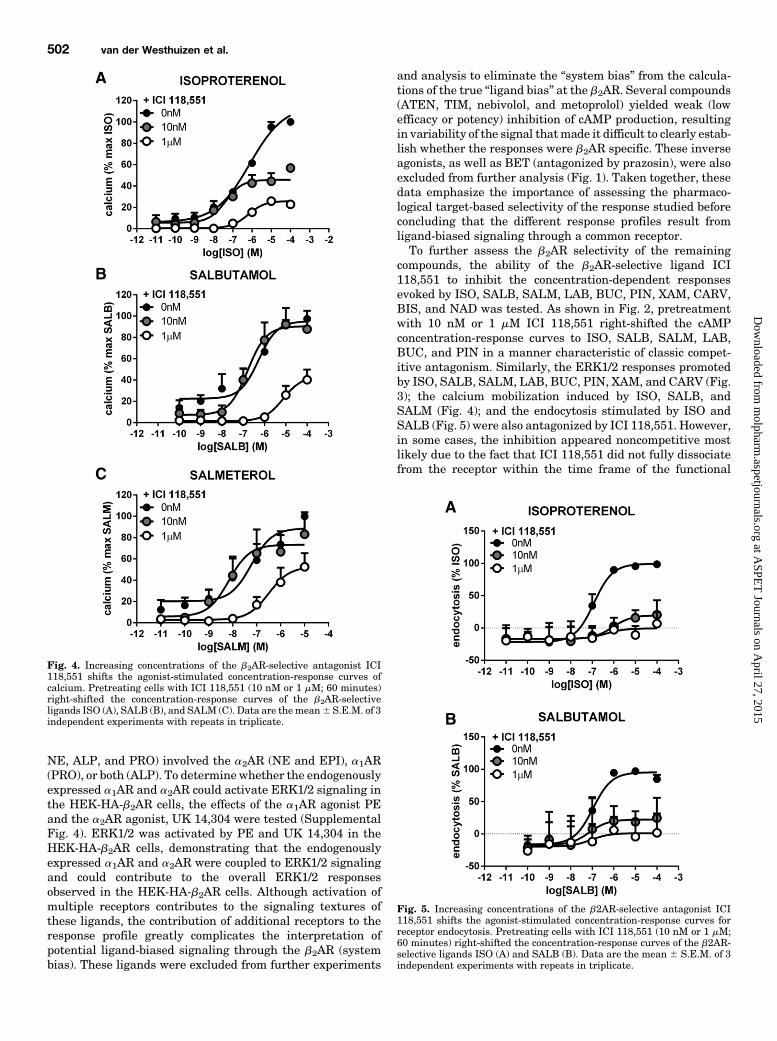
and analysis to eliminate the “system bias” from the calcula-tions of the true “ligand bias” at the b2AR. Several compounds(ATEN, TIM, nebivolol, and metoprolol) yielded weak (lowefficacy or potency) inhibition of cAMP production, resultingin variability of the signal thatmade it difficult to clearly estab-lish whether the responses were b2AR specific. These inverseagonists, as well as BET (antagonized by prazosin), were alsoexcluded from further analysis (Fig. 1). Taken together, thesedata emphasize the importance of assessing the pharmaco-logical target-based selectivity of the response studied beforeconcluding that the different response profiles result fromligand-biased signaling through a common receptor.To further assess the b2AR selectivity of the remaining
compounds, the ability of the b2AR-selective ligand ICI118,551 to inhibit the concentration-dependent responsesevoked by ISO, SALB, SALM, LAB, BUC, PIN, XAM, CARV,BIS, and NAD was tested. As shown in Fig. 2, pretreatmentwith 10 nM or 1 mM ICI 118,551 right-shifted the cAMPconcentration-response curves to ISO, SALB, SALM, LAB,BUC, and PIN in a manner characteristic of classic compet-itive antagonism. Similarly, the ERK1/2 responses promotedby ISO, SALB, SALM, LAB, BUC, PIN, XAM, and CARV (Fig.3); the calcium mobilization induced by ISO, SALB, andSALM (Fig. 4); and the endocytosis stimulated by ISO andSALB (Fig. 5) were also antagonized by ICI 118,551. However,in some cases, the inhibition appeared noncompetitive mostlikely due to the fact that ICI 118,551 did not fully dissociatefrom the receptor within the time frame of the functional
Fig. 4. Increasing concentrations of the b2AR-selective antagonist ICI118,551 shifts the agonist-stimulated concentration-response curves ofcalcium. Pretreating cells with ICI 118,551 (10 nM or 1 mM; 60 minutes)right-shifted the concentration-response curves of the b2AR-selectiveligands ISO (A), SALB (B), and SALM (C). Data are themean6 S.E.M. of 3independent experiments with repeats in triplicate.
Fig. 5. Increasing concentrations of the b2AR-selective antagonist ICI118,551 shifts the agonist-stimulated concentration-response curves forreceptor endocytosis. Pretreating cells with ICI 118,551 (10 nM or 1 mM;60 minutes) right-shifted the concentration-response curves of the b2AR-selective ligands ISO (A) and SALB (B). Data are the mean 6 S.E.M. of 3independent experiments with repeats in triplicate.
502 van der Westhuizen et al.
at ASPE
T Journals on A
pril 27, 2015m
olpharm.aspetjournals.org
Dow
nloaded from
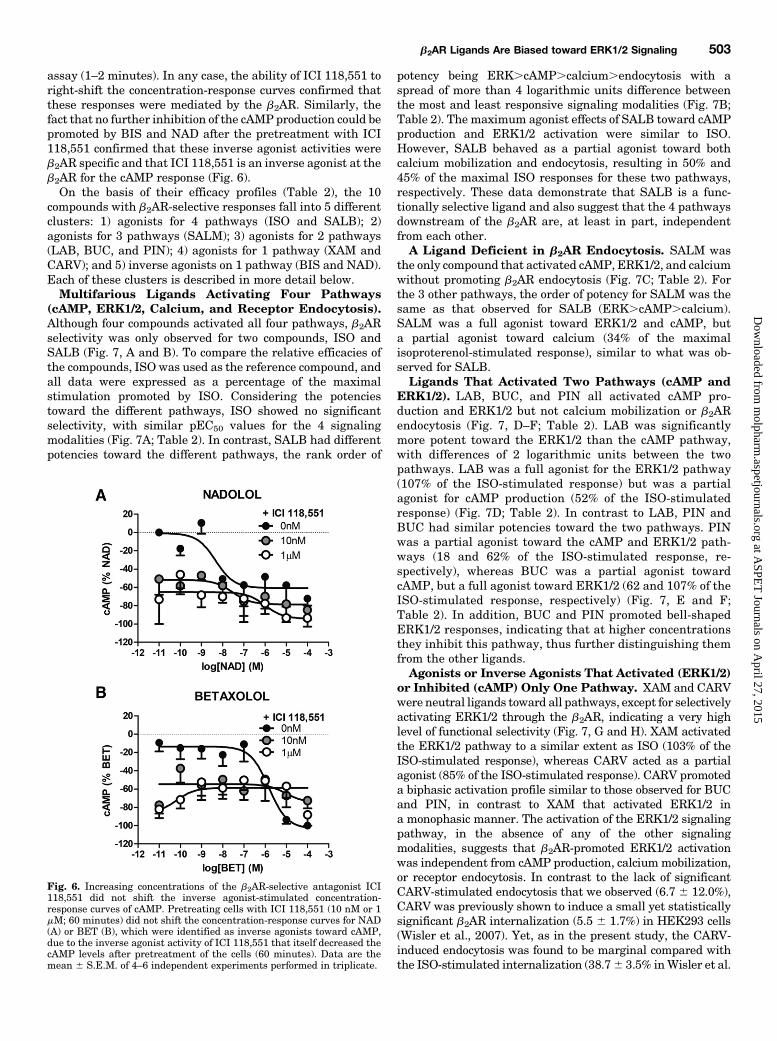
assay (1–2 minutes). In any case, the ability of ICI 118,551 toright-shift the concentration-response curves confirmed thatthese responses were mediated by the b2AR. Similarly, thefact that no further inhibition of the cAMP production could bepromoted by BIS and NAD after the pretreatment with ICI118,551 confirmed that these inverse agonist activities wereb2AR specific and that ICI 118,551 is an inverse agonist at theb2AR for the cAMP response (Fig. 6).On the basis of their efficacy profiles (Table 2), the 10
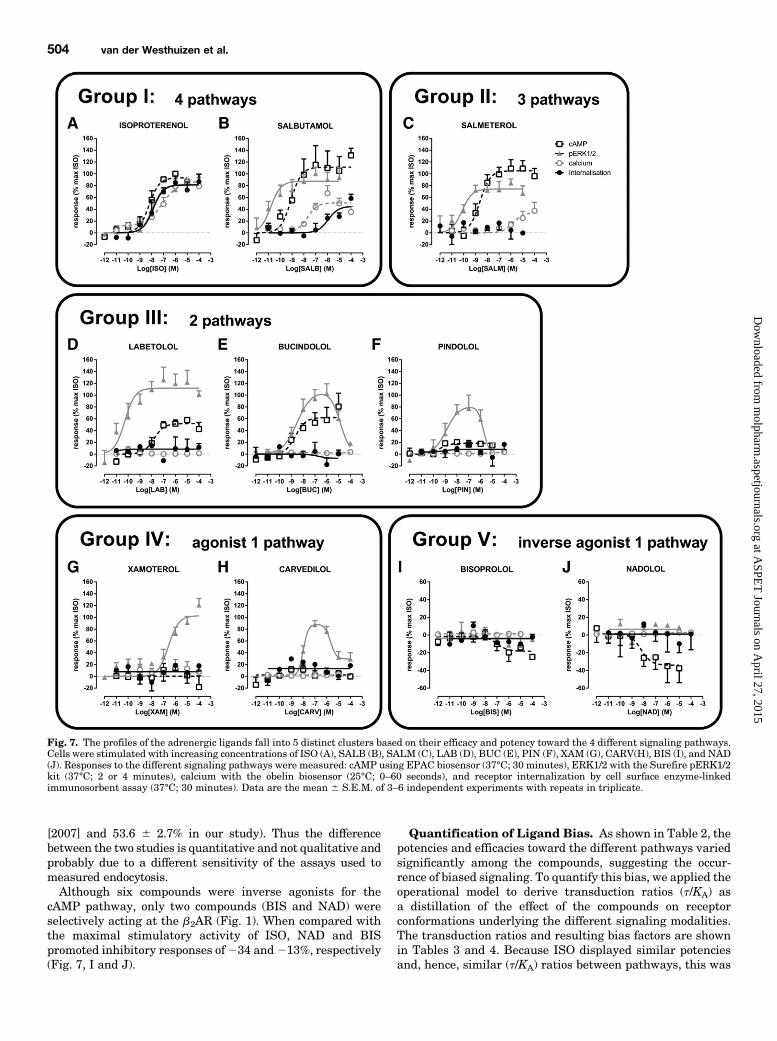
compounds with b2AR-selective responses fall into 5 differentclusters: 1) agonists for 4 pathways (ISO and SALB); 2)agonists for 3 pathways (SALM); 3) agonists for 2 pathways(LAB, BUC, and PIN); 4) agonists for 1 pathway (XAM andCARV); and 5) inverse agonists on 1 pathway (BIS and NAD).Each of these clusters is described in more detail below.Multifarious Ligands Activating Four Pathways
(cAMP, ERK1/2, Calcium, and Receptor Endocytosis).Although four compounds activated all four pathways, b2ARselectivity was only observed for two compounds, ISO andSALB (Fig. 7, A and B). To compare the relative efficacies ofthe compounds, ISO was used as the reference compound, andall data were expressed as a percentage of the maximalstimulation promoted by ISO. Considering the potenciestoward the different pathways, ISO showed no significantselectivity, with similar pEC50 values for the 4 signalingmodalities (Fig. 7A; Table 2). In contrast, SALB had differentpotencies toward the different pathways, the rank order of
potency being ERK.cAMP.calcium.endocytosis with aspread of more than 4 logarithmic units difference betweenthe most and least responsive signaling modalities (Fig. 7B;Table 2). The maximum agonist effects of SALB toward cAMPproduction and ERK1/2 activation were similar to ISO.However, SALB behaved as a partial agonist toward bothcalcium mobilization and endocytosis, resulting in 50% and45% of the maximal ISO responses for these two pathways,respectively. These data demonstrate that SALB is a func-tionally selective ligand and also suggest that the 4 pathwaysdownstream of the b2AR are, at least in part, independentfrom each other.A Ligand Deficient in b2AR Endocytosis. SALM was
the only compound that activated cAMP, ERK1/2, and calciumwithout promoting b2AR endocytosis (Fig. 7C; Table 2). Forthe 3 other pathways, the order of potency for SALM was thesame as that observed for SALB (ERK.cAMP.calcium).SALM was a full agonist toward ERK1/2 and cAMP, buta partial agonist toward calcium (34% of the maximalisoproterenol-stimulated response), similar to what was ob-served for SALB.Ligands That Activated Two Pathways (cAMP and
ERK1/2). LAB, BUC, and PIN all activated cAMP pro-duction and ERK1/2 but not calcium mobilization or b2ARendocytosis (Fig. 7, D–F; Table 2). LAB was significantlymore potent toward the ERK1/2 than the cAMP pathway,with differences of 2 logarithmic units between the twopathways. LAB was a full agonist for the ERK1/2 pathway(107% of the ISO-stimulated response) but was a partialagonist for cAMP production (52% of the ISO-stimulatedresponse) (Fig. 7D; Table 2). In contrast to LAB, PIN andBUC had similar potencies toward the two pathways. PINwas a partial agonist toward the cAMP and ERK1/2 path-ways (18 and 62% of the ISO-stimulated response, re-spectively), whereas BUC was a partial agonist towardcAMP, but a full agonist toward ERK1/2 (62 and 107% of theISO-stimulated response, respectively) (Fig. 7, E and F;Table 2). In addition, BUC and PIN promoted bell-shapedERK1/2 responses, indicating that at higher concentrationsthey inhibit this pathway, thus further distinguishing themfrom the other ligands.Agonists or Inverse Agonists That Activated (ERK1/2)
or Inhibited (cAMP) Only One Pathway. XAM and CARVwere neutral ligands toward all pathways, except for selectivelyactivating ERK1/2 through the b2AR, indicating a very highlevel of functional selectivity (Fig. 7, G and H). XAM activatedthe ERK1/2 pathway to a similar extent as ISO (103% of theISO-stimulated response), whereas CARV acted as a partialagonist (85% of the ISO-stimulated response). CARV promoteda biphasic activation profile similar to those observed for BUCand PIN, in contrast to XAM that activated ERK1/2 ina monophasic manner. The activation of the ERK1/2 signalingpathway, in the absence of any of the other signalingmodalities, suggests that b2AR-promoted ERK1/2 activationwas independent from cAMP production, calciummobilization,or receptor endocytosis. In contrast to the lack of significantCARV-stimulated endocytosis that we observed (6.7 6 12.0%),CARV was previously shown to induce a small yet statisticallysignificant b2AR internalization (5.5 6 1.7%) in HEK293 cells(Wisler et al., 2007). Yet, as in the present study, the CARV-induced endocytosis was found to be marginal compared withthe ISO-stimulated internalization (38.76 3.5% inWisler et al.
Fig. 6. Increasing concentrations of the b2AR-selective antagonist ICI118,551 did not shift the inverse agonist-stimulated concentration-response curves of cAMP. Pretreating cells with ICI 118,551 (10 nM or 1mM; 60 minutes) did not shift the concentration-response curves for NAD(A) or BET (B), which were identified as inverse agonists toward cAMP,due to the inverse agonist activity of ICI 118,551 that itself decreased thecAMP levels after pretreatment of the cells (60 minutes). Data are themean 6 S.E.M. of 4–6 independent experiments performed in triplicate.
b2AR Ligands Are Biased toward ERK1/2 Signaling 503
at ASPE
T Journals on A
pril 27, 2015m
olpharm.aspetjournals.org
Dow
nloaded from
[2007] and 53.6 6 2.7% in our study). Thus the differencebetween the two studies is quantitative and not qualitative andprobably due to a different sensitivity of the assays used tomeasured endocytosis.Although six compounds were inverse agonists for the
cAMP pathway, only two compounds (BIS and NAD) wereselectively acting at the b2AR (Fig. 1). When compared withthe maximal stimulatory activity of ISO, NAD and BISpromoted inhibitory responses of234 and213%, respectively(Fig. 7, I and J).
Quantification of Ligand Bias. As shown in Table 2, thepotencies and efficacies toward the different pathways variedsignificantly among the compounds, suggesting the occur-rence of biased signaling. To quantify this bias, we applied theoperational model to derive transduction ratios (t/KA) asa distillation of the effect of the compounds on receptorconformations underlying the different signaling modalities.The transduction ratios and resulting bias factors are shownin Tables 3 and 4. Because ISO displayed similar potenciesand, hence, similar (t/KA) ratios between pathways, this was
Fig. 7. The profiles of the adrenergic ligands fall into 5 distinct clusters based on their efficacy and potency toward the 4 different signaling pathways.Cells were stimulated with increasing concentrations of ISO (A), SALB (B), SALM (C), LAB (D), BUC (E), PIN (F), XAM (G), CARV(H), BIS (I), and NAD(J). Responses to the different signaling pathways were measured: cAMP using EPAC biosensor (37°C; 30 minutes), ERK1/2 with the Surefire pERK1/2kit (37°C; 2 or 4 minutes), calcium with the obelin biosensor (25°C; 0–60 seconds), and receptor internalization by cell surface enzyme-linkedimmunosorbent assay (37°C; 30 minutes). Data are the mean 6 S.E.M. of 3–6 independent experiments with repeats in triplicate.
504 van der Westhuizen et al.
at ASPE
T Journals on A
pril 27, 2015m
olpharm.aspetjournals.org
Dow
nloaded from
used as the reference agonist against which all within-pathway comparisons to the other agonists were made [Dlog(t/KA)]. The responses to ISO for all four pathways yieldedsimilar potencies, revealing ISO as functionally distinct fromthe other test compounds. Because the potencies for ISOtoward all pathways were similar, the variable potenciesobserved for the other ligands could not be attributed todifferences in the level of amplification between the signalingpathways nor the assay sensitivity. These features of ISOmade it an ideal candidate for a reference compound at theb2AR and a better choice than EPI, the endogenous ligand forthe b2AR, because EPI activated ERK1/2 via endogenouslyexpressed aARs in addition to the overexpressed b2ARs (Fig.1). As previously highlighted (Kenakin and Christopoulos,2013), ligand bias is a relative term; without comparison witha reference agonist to cancel out the influence of system andobservation biases, true ligand bias cannot be determined.Subsequently, between-pathway comparisons were made fora given ligand in the form of the final bias factor [DDlog(t/KA)].Because ISO oxidizes, it was important to verify that anysignaling bias calculated in reference to this compound did notresult from a change in the actual concentration during thecourse of the experiment. For this purpose, time- and dose-dependent ISO-promoted cAMP production was monitored bythe EPAC biosensor in the presence and absence of ascorbate.As shown in Supplemental Fig. 2, the addition of ascorbatedid not significantly affect either the kinetics or the dose-response curves obtained. Because cAMP was the assayinvolving the longest time of incubation, the oxidation ofisoproterenol did not influence the ligand biases calculated inthe present study. This suggests that in the time frame of theexperiments (30minutes) and at the temperature used (37°C),only marginal oxidation occurs.Comparison of the bias factors for each ligand between the
different pathways revealed that, relative to ISO, manyligands were biased for the ERK1/2 pathway over the cAMPpathway, the cAMP pathway over calcium mobilization,whereas there was no bias for calcium over b2AR endocytosis(Fig. 8; Table 4). Together, this suggests that there was a rankorder of pathway bias for all of the compounds tested at theb2AR (ERK.cAMP.calcium 5 endocytosis). LAB was thecompound with the strongest bias toward the ERK1/2 overcAMP, activating ERK1/2 signaling 1108-fold better thancAMP signaling. SALB and SALM for their part were 62- and19-fold better at activating ERK1/2 than cAMP, respectively(Table 4). The biases of SALB and SALM toward cAMP overcalcium were 3- and 17-fold, respectively, whereas they were183- and 316-fold for ERK over calcium (Table 4). SALB was4-fold better at activating cAMP over endocytosis and 223-foldbetter at activating ERK1/2 than endocytosis. PIN and BUC,which could activate only cAMP and ERK1/2 signaling, werenot significantly biased for either of the two pathways (Table 4).Bias factors were not calculated for all pathways for all ligands,because the absence of stimulation of a pathway prevents thecalculation of a t/KA ratio. However, when a pathway was notactivated by a ligand, it may be indicative that the bias waseven greater than the largest bias that could be calculatedbetween the two pathways considered. For example, CARV andXAM, which could activate ERK1/2 but not cAMP, calcium, orreceptor endocytosis (Fig. 3; Table 2), may be activating ERK1/2at least 1108-fold better than cAMP, 316-fold better thancalcium, and 223-fold better than endocytosis. Alternatively, if T
ABLE
3Transd
uctionratios
[log
(t/K
A)]of
adrenergicag
onists
attheb2AR
HEK-H
A-b
2AR
cellswerestim
ulatedwithdifferen
tconc
entrations
ofb2AR-selective
liga
nds
andresp
onsesweremea
suredfor4distinct
sign
alingpa
thway
s.Datawerean
alyz
edby
non
linea
rregression
using
theOpe
ration
alMod
eleq
uation(see
Supp
lemen
talA
ppen
dix1)
inGraph
padPrism
v6to
determ
inethelogR
values
[equ
ivalen
tto
log(t/KA)r
atios].D
log(t/KA)r
atioswerecalculatedfrom
thelog(t/KA)r
atiosconside
ringIS
Oas
thereference
liga
nd
usingeq
.8.T
herelative
effectiven
ess(R
E)o
ftheliga
nds
towardea
chpa
thway
,relativeto
ISO,w
asde
term
ined
byeq
.9.T
hestan
dard
errorwas
estimated
usingeq
.13.
Dataarethemea
n6
S.E.M
.of3
–6inde
pende
ntex
perimen
tswithrepe
atsin
duplicate.
Datawerean
alyz
edin
apa
irwiseman
ner
usingatw
o-tailed
unpa
ired
Stude
nt’s
ttest
[ontheDlog(t/KA)ratios]to
determ
inethesign
ifican
ceof
therelative
effectiven
ess.
Ligan
dcA
MP
ERK1/2
Ca2
+Endo
cytosis
Log
DLog
RE
Log
DLog
RE
Log
DLog
RE
Log
DLog
RE
ISO
7.65
60.15
0.00
60.22
1.00
7.37
60.19
0.00
60.27
1.00
7.00
60.27
0.00
60.39
1.00
7.24
60.16
0.00
60.23
1.00
SALB
8.77
60.31
1.13
60.35
13.40*
10.296
0.34
2.92
60.39
829.91
*7.66
60.36
0.66
60.46
4.54
7.81
60.28
0.57
60.32
3.73
SALM
8.74
60.17
1.09
60.23
12.29*
9.74
60.29
2.37
60.35
233.98
*6.87
60.26
20.13
60.38
0.74
ND
ND
ND
LAB
8.24
60.29
0.59
60.33
3.89
11.016
0.03
3.63
60.20
4307
.91*
ND
ND
ND
ND
ND
ND
PIN
8.50
60.82
0.85
60.84
7.08
7.41
60.03
0.04
60.20
1.09
ND
ND
ND
ND
ND
ND
BUC
8.11
60.07
0.46
60.17
2.87
*7.35
60.10
20.02
60.22
0.96
ND
ND
ND
ND
ND
ND
XAM
ND
ND
ND
8.39
60.48
1.02
60.52
10.47
ND
ND
ND
ND
ND
ND
CARV
ND
ND
ND
6.05
60.08
21.32
60.21
0.05
*ND
ND
ND
ND
ND
ND
ND,no
tde
term
ined
.*P
,0.05
.
b2AR Ligands Are Biased toward ERK1/2 Signaling 505
at ASPE
T Journals on A
pril 27, 2015m
olpharm.aspetjournals.org
Dow
nloaded from
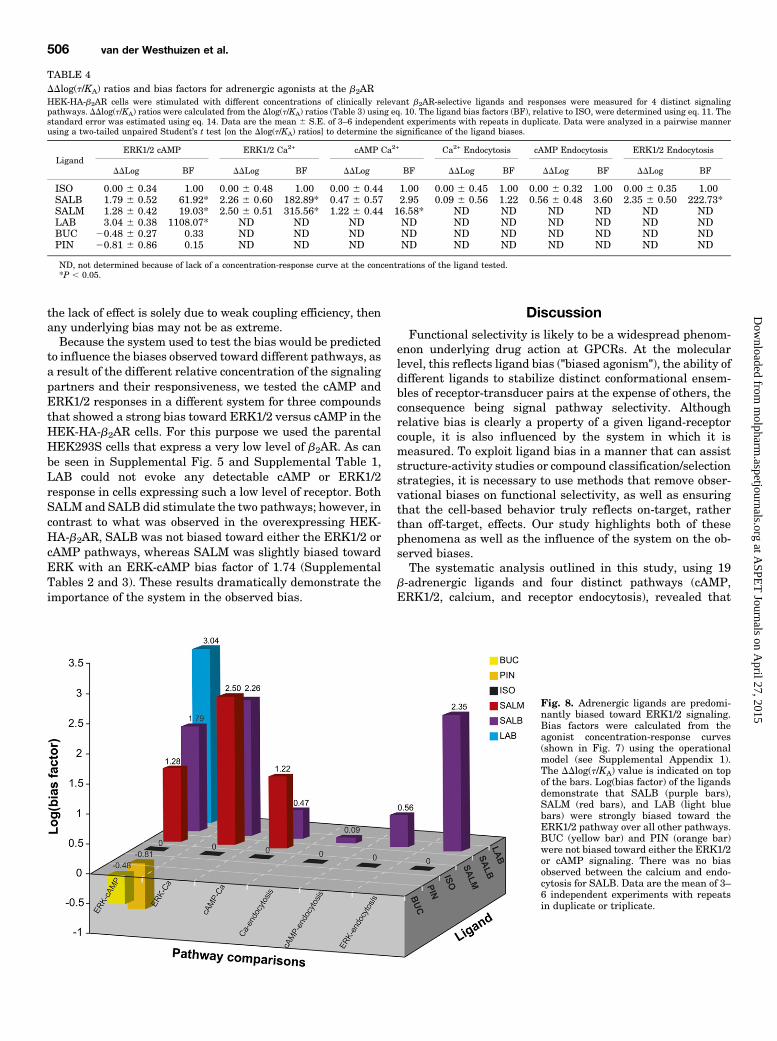
the lack of effect is solely due to weak coupling efficiency, thenany underlying bias may not be as extreme.Because the system used to test the bias would be predicted
to influence the biases observed toward different pathways, asa result of the different relative concentration of the signalingpartners and their responsiveness, we tested the cAMP andERK1/2 responses in a different system for three compoundsthat showed a strong bias toward ERK1/2 versus cAMP in theHEK-HA-b2AR cells. For this purpose we used the parentalHEK293S cells that express a very low level of b2AR. As canbe seen in Supplemental Fig. 5 and Supplemental Table 1,LAB could not evoke any detectable cAMP or ERK1/2response in cells expressing such a low level of receptor. BothSALM and SALB did stimulate the two pathways; however, incontrast to what was observed in the overexpressing HEK-HA-b2AR, SALB was not biased toward either the ERK1/2 orcAMP pathways, whereas SALM was slightly biased towardERK with an ERK-cAMP bias factor of 1.74 (SupplementalTables 2 and 3). These results dramatically demonstrate theimportance of the system in the observed bias.
DiscussionFunctional selectivity is likely to be a widespread phenom-
enon underlying drug action at GPCRs. At the molecularlevel, this reflects ligand bias ("biased agonism"), the ability ofdifferent ligands to stabilize distinct conformational ensem-bles of receptor-transducer pairs at the expense of others, theconsequence being signal pathway selectivity. Althoughrelative bias is clearly a property of a given ligand-receptorcouple, it is also influenced by the system in which it ismeasured. To exploit ligand bias in a manner that can assiststructure-activity studies or compound classification/selectionstrategies, it is necessary to use methods that remove obser-vational biases on functional selectivity, as well as ensuringthat the cell-based behavior truly reflects on-target, ratherthan off-target, effects. Our study highlights both of thesephenomena as well as the influence of the system on the ob-served biases.The systematic analysis outlined in this study, using 19
b-adrenergic ligands and four distinct pathways (cAMP,ERK1/2, calcium, and receptor endocytosis), revealed that
TABLE 4DDlog(t/KA) ratios and bias factors for adrenergic agonists at the b2ARHEK-HA-b2AR cells were stimulated with different concentrations of clinically relevant b2AR-selective ligands and responses were measured for 4 distinct signalingpathways. DDlog(t/KA) ratios were calculated from the Dlog(t/KA) ratios (Table 3) using eq. 10. The ligand bias factors (BF), relative to ISO, were determined using eq. 11. Thestandard error was estimated using eq. 14. Data are the mean 6 S.E. of 3–6 independent experiments with repeats in duplicate. Data were analyzed in a pairwise mannerusing a two-tailed unpaired Student’s t test [on the Dlog(t/KA) ratios] to determine the significance of the ligand biases.
LigandERK1/2 cAMP ERK1/2 Ca2+ cAMP Ca2+ Ca2+ Endocytosis cAMP Endocytosis ERK1/2 Endocytosis
DDLog BF DDLog BF DDLog BF DDLog BF DDLog BF DDLog BF
ISO 0.00 6 0.34 1.00 0.00 6 0.48 1.00 0.00 6 0.44 1.00 0.00 6 0.45 1.00 0.00 6 0.32 1.00 0.00 6 0.35 1.00SALB 1.79 6 0.52 61.92* 2.26 6 0.60 182.89* 0.47 6 0.57 2.95 0.09 6 0.56 1.22 0.56 6 0.48 3.60 2.35 6 0.50 222.73*SALM 1.28 6 0.42 19.03* 2.50 6 0.51 315.56* 1.22 6 0.44 16.58* ND ND ND ND ND NDLAB 3.04 6 0.38 1108.07* ND ND ND ND ND ND ND ND ND NDBUC 20.48 6 0.27 0.33 ND ND ND ND ND ND ND ND ND NDPIN 20.81 6 0.86 0.15 ND ND ND ND ND ND ND ND ND ND
ND, not determined because of lack of a concentration-response curve at the concentrations of the ligand tested.*P , 0.05.
Fig. 8. Adrenergic ligands are predomi-nantly biased toward ERK1/2 signaling.Bias factors were calculated from theagonist concentration-response curves(shown in Fig. 7) using the operationalmodel (see Supplemental Appendix 1).The DDlog(t/KA) value is indicated on topof the bars. Log(bias factor) of the ligandsdemonstrate that SALB (purple bars),SALM (red bars), and LAB (light bluebars) were strongly biased toward theERK1/2 pathway over all other pathways.BUC (yellow bar) and PIN (orange bar)were not biased toward either the ERK1/2or cAMP signaling. There was no biasobserved between the calcium and endo-cytosis for SALB. Data are the mean of 3–6 independent experiments with repeatsin duplicate or triplicate.
506 van der Westhuizen et al.
at ASPE
T Journals on A
pril 27, 2015m
olpharm.aspetjournals.org
Dow
nloaded from

despite overexpression of the target b2AR, many ligands havedetectable efficacy toward other endogenously expressedadrenoceptors in HEK293S cells. Because of the confoundingeffects that the stimulation of more than one receptor subtypehas on the signaling outcomes, biases cannot be determinedfor such ligands. Yet this is useful information because theseoff-target effects may contribute to either the therapeuticefficacy or undesirable effects of drugs.For ligands acting selectively through the b2AR, the
operational model revealed a rank order of pathway bias(ERK.cAMP.Ca 5 endocytosis) for three of the agoniststested (SALB, SALM, LAB) relative to ISO. Compounds withneutral or inverse efficacies cannot be included in the formalbias analysis, yet they are clearly favoring different receptorconformations than the agonists. The different signalingprofiles, based on the ability of the compounds to activatespecific pathways, clustered into five groups, potentiallyrepresenting the propensity of each of these ligand groups tostabilize different receptor–effector complexes. Given thatsome compounds evoked biphasic concentration-responsecurves, one could also include this as a criteria to cluster theligands into seven groups rather than five to account for theunusual behavior of these ligands. Collectively, this studypresents a framework for the quantitative evaluation ofGPCR ligand bias in a manner that can facilitate moreinformed compound classification and, if implemented asa routine approach in drug discovery workflows, preclinicaldrug candidate selection.One striking observation was that all compounds, except for
BUC and PIN, were significantly biased for ERK1/2 signalingover the other pathways relative to ISO. In addition, whena single pathway was activated by a ligand (e.g., CARV andXAM), it was always ERK1/2. The mechanism underlyingsuch prevalence of the ERK1/2 pathway is unknown but couldbe explained by the fact that many effectors (Gas, Gai,b-arrestin) couple the b2AR to the ERK1/2 pathway (Daakaet al., 1997; Azzi et al., 2003; Keiper et al., 2004). Consistentwith this notion, several of the compounds (BUC, PIN, andCARV) activatedERK1/2 in a biphasicmanner, a phenomenonthat can result from ligand-promoted activation of severalconcurrent signaling pathways (Dittman et al., 1994; Rovatiand Nicosia, 1994). Of note, many ligands that activatedERK1/2 did so in the absence of any detectable endocytosis.Given the proposed role of b-arrestin (Azzi et al., 2003; Shenoyet al., 2006) and b-arrestin–mediated endocytosis (Daakaet al., 1998) in the ISO-stimulated ERK1/2 activity, it will beof interest to determine the signaling pathways underlyingthe activation by ligands that do not promote endocytosis.For all compounds tested, calcium was a less preferred
pathway, being either weakly or not stimulated, even forcompounds that maximally stimulated ERK1/2 or cAMP,indicating that this pathway is at least in part independentfrom the cAMP and ERK responses. The exact mechanismresponsible for the calciummobilization in theHEK-HA-b2ARcells used in the present study is unknown, but could occur viaa Gs-cAMP-EPAC-Rap2B-PLC«–dependent pathway, as inHEK293 cells (Schmidt et al., 2001); a Gs-cAMP-PKA-dependent pathway, as in cardiomyocytes or rat hippocampalneurons (Zhang et al., 2001; Tzingounis et al., 2010); or via Gi,as in cardiomyocytes (Zhang et al., 2001). Alternatively, itcould be due to a crosstalk between the Gs-coupled b2AR andGq-promoted IP3 productions as in mouse airway smooth
muscle cells overexpressing the b2AR (McGraw et al., 2003).Determining which pathway is responsible for the calciumresponses observed in the present study as well as themolecular basis for the bias observed opens interesting newavenues.The importance of the system used to assess ligand biases
was clearly illustrated by the difference in the bias valuesobtained in two cell lines expressing different b2AR levels.Consistent with the notion that the effectiveness towarda given pathway is defined by the ligand’s affinity (KA) and thestimulus–effect relationship (Black and Leff, 1983) for thispathway, our data show different transduction ratios [log(t/KA)] for the two cell systems; the ERK1/2 pathway beingmore affected than cAMP. These changes were not equivalentfor all ligands, consistent with the notion of bias. The specificmechanisms responsible for these system-dependent differ-ences are not known but could be linked to the relativeexpression levels of the receptor versus effectors, the consti-tutive activity or the desensitization state of the differentcomponents involved.The prevailing hypothesis to explain functional selectivity
proposes that different ligands promote or stabilize differentreceptor conformation(s) with preferential affinities for sub-sets of effectors. Recent structural studies on the b2AR con-firmed that different compounds stabilized distinct receptorconformations (Rasmussen et al., 2007; Wacker et al., 2010),consistent with this notion. However, the recent findings thatthe effectors contributed to the conformational changes under-gone by a receptor and that these conformational changeswere translated into altered affinities for the ligands (Rasmussenet al., 2011) suggest that assembly of receptor–effector com-plexes before ligand binding could contribute to functionalselectivity. This hypothesis is supported by our study, wherethe distributions of potencies of a given compound for acti-vation of distinct signaling pathways were observed to be asvast as four orders of magnitude (e.g., SALB potency forERK1/2 versus endocytosis).The influence that the effector can have on receptor
conformation and hence ligand affinity is taken into accountby the approach used in the present study, where the t/KA
ratios used to assess biases are derived directly from theconcentration-response curves that take into account differ-ences in ligand affinities for the different agonist–receptor–effector complexes (Kenakin et al., 2012). This is differentfrom other approaches using affinity (pKd) values derivedfrom competition binding experiments against a single radio-ligand to calculate t values. Indeed, such approaches assumethat the affinity of the ligand for the receptor–effector complexis the same in the activation of all signaling pathways. Giventhat different affinity values can be obtained for a givencompound when determined in competition against differentradioligands [e.g., ISO pKd obtained when using differentradioligands: [125I]pindolol 5 7.54 (Del Carmine et al., 2002);[3H]CGP-12177 5 6.64 (Baker, 2010); [3H]epinephrine 5 8.68(U’Prichard et al., 1978)], the affinity of compounds towarda particular agonist–receptor–effector complex using a singlebinding affinity value may introduce a probe dependency intothe calculation of signaling bias. With use of this approach,SALM was biased for b-arrestin recruitment over cAMPsignaling (Rajagopal et al., 2011), which is surprising giventhat SALM did not promote b2AR endocytosis measured bycell-surface enzyme-linked immunosorbent assay (Table 2;
b2AR Ligands Are Biased toward ERK1/2 Signaling 507
at ASPE
T Journals on A
pril 27, 2015m
olpharm.aspetjournals.org
Dow
nloaded from
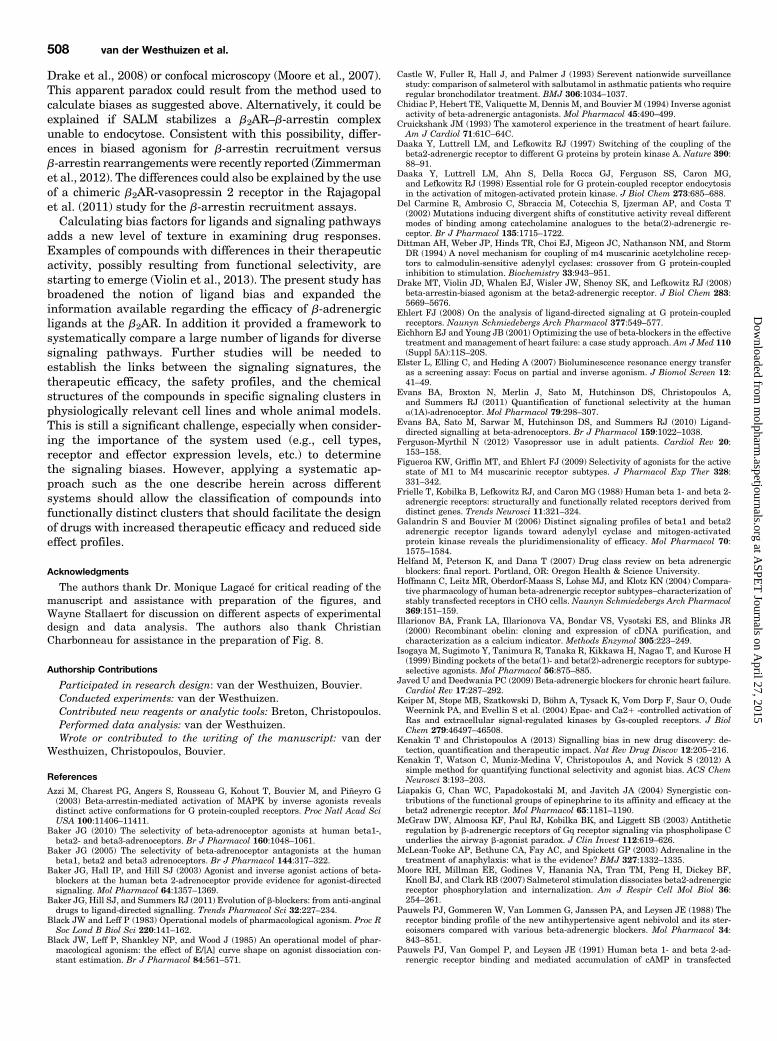
Drake et al., 2008) or confocal microscopy (Moore et al., 2007).This apparent paradox could result from the method used tocalculate biases as suggested above. Alternatively, it could beexplained if SALM stabilizes a b2AR–b-arrestin complexunable to endocytose. Consistent with this possibility, differ-ences in biased agonism for b-arrestin recruitment versusb-arrestin rearrangements were recently reported (Zimmermanet al., 2012). The differences could also be explained by the useof a chimeric b2AR-vasopressin 2 receptor in the Rajagopalet al. (2011) study for the b-arrestin recruitment assays.Calculating bias factors for ligands and signaling pathways
adds a new level of texture in examining drug responses.Examples of compounds with differences in their therapeuticactivity, possibly resulting from functional selectivity, arestarting to emerge (Violin et al., 2013). The present study hasbroadened the notion of ligand bias and expanded theinformation available regarding the efficacy of b-adrenergicligands at the b2AR. In addition it provided a framework tosystematically compare a large number of ligands for diversesignaling pathways. Further studies will be needed toestablish the links between the signaling signatures, thetherapeutic efficacy, the safety profiles, and the chemicalstructures of the compounds in specific signaling clusters inphysiologically relevant cell lines and whole animal models.This is still a significant challenge, especially when consider-ing the importance of the system used (e.g., cell types,receptor and effector expression levels, etc.) to determinethe signaling biases. However, applying a systematic ap-proach such as the one describe herein across differentsystems should allow the classification of compounds intofunctionally distinct clusters that should facilitate the designof drugs with increased therapeutic efficacy and reduced sideeffect profiles.
Acknowledgments
The authors thank Dr. Monique Lagacé for critical reading of themanuscript and assistance with preparation of the figures, andWayne Stallaert for discussion on different aspects of experimentaldesign and data analysis. The authors also thank ChristianCharbonneau for assistance in the preparation of Fig. 8.
Authorship Contributions
Participated in research design: van der Westhuizen, Bouvier.Conducted experiments: van der Westhuizen.Contributed new reagents or analytic tools: Breton, Christopoulos.Performed data analysis: van der Westhuizen.Wrote or contributed to the writing of the manuscript: van der
Westhuizen, Christopoulos, Bouvier.
References
Azzi M, Charest PG, Angers S, Rousseau G, Kohout T, Bouvier M, and Piñeyro G(2003) Beta-arrestin-mediated activation of MAPK by inverse agonists revealsdistinct active conformations for G protein-coupled receptors. Proc Natl Acad SciUSA 100:11406–11411.
Baker JG (2010) The selectivity of beta-adrenoceptor agonists at human beta1-,beta2- and beta3-adrenoceptors. Br J Pharmacol 160:1048–1061.
Baker JG (2005) The selectivity of beta-adrenoceptor antagonists at the humanbeta1, beta2 and beta3 adrenoceptors. Br J Pharmacol 144:317–322.
Baker JG, Hall IP, and Hill SJ (2003) Agonist and inverse agonist actions of beta-blockers at the human beta 2-adrenoceptor provide evidence for agonist-directedsignaling. Mol Pharmacol 64:1357–1369.
Baker JG, Hill SJ, and Summers RJ (2011) Evolution of b-blockers: from anti-anginaldrugs to ligand-directed signalling. Trends Pharmacol Sci 32:227–234.
Black JW and Leff P (1983) Operational models of pharmacological agonism. Proc RSoc Lond B Biol Sci 220:141–162.
Black JW, Leff P, Shankley NP, and Wood J (1985) An operational model of phar-macological agonism: the effect of E/[A] curve shape on agonist dissociation con-stant estimation. Br J Pharmacol 84:561–571.
Castle W, Fuller R, Hall J, and Palmer J (1993) Serevent nationwide surveillancestudy: comparison of salmeterol with salbutamol in asthmatic patients who requireregular bronchodilator treatment. BMJ 306:1034–1037.
Chidiac P, Hebert TE, Valiquette M, Dennis M, and Bouvier M (1994) Inverse agonistactivity of beta-adrenergic antagonists. Mol Pharmacol 45:490–499.
Cruickshank JM (1993) The xamoterol experience in the treatment of heart failure.Am J Cardiol 71:61C–64C.
Daaka Y, Luttrell LM, and Lefkowitz RJ (1997) Switching of the coupling of thebeta2-adrenergic receptor to different G proteins by protein kinase A. Nature 390:88–91.
Daaka Y, Luttrell LM, Ahn S, Della Rocca GJ, Ferguson SS, Caron MG,and Lefkowitz RJ (1998) Essential role for G protein-coupled receptor endocytosisin the activation of mitogen-activated protein kinase. J Biol Chem 273:685–688.
Del Carmine R, Ambrosio C, Sbraccia M, Cotecchia S, Ijzerman AP, and Costa T(2002) Mutations inducing divergent shifts of constitutive activity reveal differentmodes of binding among catecholamine analogues to the beta(2)-adrenergic re-ceptor. Br J Pharmacol 135:1715–1722.
Dittman AH, Weber JP, Hinds TR, Choi EJ, Migeon JC, Nathanson NM, and StormDR (1994) A novel mechanism for coupling of m4 muscarinic acetylcholine recep-tors to calmodulin-sensitive adenylyl cyclases: crossover from G protein-coupledinhibition to stimulation. Biochemistry 33:943–951.
Drake MT, Violin JD, Whalen EJ, Wisler JW, Shenoy SK, and Lefkowitz RJ (2008)beta-arrestin-biased agonism at the beta2-adrenergic receptor. J Biol Chem 283:5669–5676.
Ehlert FJ (2008) On the analysis of ligand-directed signaling at G protein-coupledreceptors. Naunyn Schmiedebergs Arch Pharmacol 377:549–577.
Eichhorn EJ and Young JB (2001) Optimizing the use of beta-blockers in the effectivetreatment and management of heart failure: a case study approach. Am J Med 110(Suppl 5A):11S–20S.
Elster L, Elling C, and Heding A (2007) Bioluminescence resonance energy transferas a screening assay: Focus on partial and inverse agonism. J Biomol Screen 12:41–49.
Evans BA, Broxton N, Merlin J, Sato M, Hutchinson DS, Christopoulos A,and Summers RJ (2011) Quantification of functional selectivity at the humana(1A)-adrenoceptor. Mol Pharmacol 79:298–307.
Evans BA, Sato M, Sarwar M, Hutchinson DS, and Summers RJ (2010) Ligand-directed signalling at beta-adrenoceptors. Br J Pharmacol 159:1022–1038.
Ferguson-Myrthil N (2012) Vasopressor use in adult patients. Cardiol Rev 20:153–158.
Figueroa KW, Griffin MT, and Ehlert FJ (2009) Selectivity of agonists for the activestate of M1 to M4 muscarinic receptor subtypes. J Pharmacol Exp Ther 328:331–342.
Frielle T, Kobilka B, Lefkowitz RJ, and Caron MG (1988) Human beta 1- and beta 2-adrenergic receptors: structurally and functionally related receptors derived fromdistinct genes. Trends Neurosci 11:321–324.
Galandrin S and Bouvier M (2006) Distinct signaling profiles of beta1 and beta2adrenergic receptor ligands toward adenylyl cyclase and mitogen-activatedprotein kinase reveals the pluridimensionality of efficacy. Mol Pharmacol 70:1575–1584.
Helfand M, Peterson K, and Dana T (2007) Drug class review on beta adrenergicblockers: final report. Portland, OR: Oregon Health & Science University.
Hoffmann C, Leitz MR, Oberdorf-Maass S, Lohse MJ, and Klotz KN (2004) Compara-tive pharmacology of human beta-adrenergic receptor subtypes–characterization ofstably transfected receptors in CHO cells. Naunyn Schmiedebergs Arch Pharmacol369:151–159.
Illarionov BA, Frank LA, Illarionova VA, Bondar VS, Vysotski ES, and Blinks JR(2000) Recombinant obelin: cloning and expression of cDNA purification, andcharacterization as a calcium indicator. Methods Enzymol 305:223–249.
Isogaya M, Sugimoto Y, Tanimura R, Tanaka R, Kikkawa H, Nagao T, and Kurose H(1999) Binding pockets of the beta(1)- and beta(2)-adrenergic receptors for subtype-selective agonists. Mol Pharmacol 56:875–885.
Javed U and Deedwania PC (2009) Beta-adrenergic blockers for chronic heart failure.Cardiol Rev 17:287–292.
Keiper M, Stope MB, Szatkowski D, Böhm A, Tysack K, Vom Dorp F, Saur O, OudeWeernink PA, and Evellin S et al. (2004) Epac- and Ca21 -controlled activation ofRas and extracellular signal-regulated kinases by Gs-coupled receptors. J BiolChem 279:46497–46508.
Kenakin T and Christopoulos A (2013) Signalling bias in new drug discovery: de-tection, quantification and therapeutic impact. Nat Rev Drug Discov 12:205–216.
Kenakin T, Watson C, Muniz-Medina V, Christopoulos A, and Novick S (2012) Asimple method for quantifying functional selectivity and agonist bias. ACS ChemNeurosci 3:193–203.
Liapakis G, Chan WC, Papadokostaki M, and Javitch JA (2004) Synergistic con-tributions of the functional groups of epinephrine to its affinity and efficacy at thebeta2 adrenergic receptor. Mol Pharmacol 65:1181–1190.
McGraw DW, Almoosa KF, Paul RJ, Kobilka BK, and Liggett SB (2003) Antitheticregulation by b-adrenergic receptors of Gq receptor signaling via phospholipase Cunderlies the airway b-agonist paradox. J Clin Invest 112:619–626.
McLean-Tooke AP, Bethune CA, Fay AC, and Spickett GP (2003) Adrenaline in thetreatment of anaphylaxis: what is the evidence? BMJ 327:1332–1335.
Moore RH, Millman EE, Godines V, Hanania NA, Tran TM, Peng H, Dickey BF,Knoll BJ, and Clark RB (2007) Salmeterol stimulation dissociates beta2-adrenergicreceptor phosphorylation and internalization. Am J Respir Cell Mol Biol 36:254–261.
Pauwels PJ, Gommeren W, Van Lommen G, Janssen PA, and Leysen JE (1988) Thereceptor binding profile of the new antihypertensive agent nebivolol and its ster-eoisomers compared with various beta-adrenergic blockers. Mol Pharmacol 34:843–851.
Pauwels PJ, Van Gompel P, and Leysen JE (1991) Human beta 1- and beta 2-ad-renergic receptor binding and mediated accumulation of cAMP in transfected
508 van der Westhuizen et al.
at ASPE
T Journals on A
pril 27, 2015m
olpharm.aspetjournals.org
Dow
nloaded from

Chinese hamster ovary cells. Profile of nebivolol and known beta-adrenergicblockers. Biochem Pharmacol 42:1683–1689.
Peng H, Bond RA, and Knoll BJ (2011) The effects of acute and chronic nadololtreatment on b2AR signaling in HEK293 cells. Naunyn Schmiedebergs ArchPharmacol 383:209–216.
Pönicke K, Heinroth-Hoffmann I, and Brodde OE (2002) Differential effects ofbucindolol and carvedilol on noradenaline-induced hypertrophic response in ven-tricular cardiomyocytes of adult rats. J Pharmacol Exp Ther 301:71–76.
Ponsioen B, Zhao J, Riedl J, Zwartkruis F, van der Krogt G, Zaccolo M, MoolenaarWH, Bos JL, and Jalink K (2004) Detecting cAMP-induced Epac activation byfluorescence resonance energy transfer: Epac as a novel cAMP indicator. EMBORep 5:1176–1180.
Rajagopal S, Ahn S, Rominger DH, Gowen-MacDonald W, Lam CM, Dewire SM,Violin JD, and Lefkowitz RJ (2011) Quantifying ligand bias at seven-transmembrane receptors. Mol Pharmacol 80:367–377.
Ram CV (2010) Beta-blockers in hypertension. Am J Cardiol 106:1819–1825.Rasmussen SG, Choi HJ, Rosenbaum DM, Kobilka TS, Thian FS, Edwards PC,Burghammer M, Ratnala VR, Sanishvili R, and Fischetti RF et al. (2007) Crystal struc-ture of the human beta2 adrenergic G-protein-coupled receptor. Nature 450:383–387.
Rasmussen SG, DeVree BT, Zou Y, Kruse AC, Chung KY, Kobilka TS, Thian FS,Chae PS, Pardon E, and Calinski D et al. (2011) Crystal structure of the b2 ad-renergic receptor-Gs protein complex. Nature 477:549–555.
Reed SE, Staley EM, Mayginnes JP, Pintel DJ, and Tullis GE (2006) Transfection ofmammalian cells using linear polyethylenimine is a simple and effective means ofproducing recombinant adeno-associated virus vectors. J Virol Methods 138:85–98.
Rovati GE and Nicosia S (1994) Lower efficacy: interaction with an inhibitory re-ceptor or partial agonism? Trends Pharmacol Sci 15:140–144.
Schmidt M, Evellin S, Weernink PA, von Dorp F, Rehmann H, Lomasney JW,and Jakobs KH (2001) A new phospholipase-C-calcium signalling pathway medi-ated by cyclic AMP and a Rap GTPase. Nat Cell Biol 3:1020–1024.
Shenoy SK, Drake MT, Nelson CD, Houtz DA, Xiao K, Madabushi S, Reiter E,Premont RT, Lichtarge O, and Lefkowitz RJ (2006) beta-arrestin-dependent, G
protein-independent ERK1/2 activation by the beta2 adrenergic receptor. J BiolChem 281:1261–1273.
Tzingounis AV, von Zastrow M, and Yudowski GA (2010) b-blocker drugs mediatecalcium signaling in native central nervous system neurons by b-arrestin-biasedagonism. Proc Natl Acad Sci USA 107:21028–21033.
U’Prichard DC, Bylund DB, and Snyder SH (1978). (1/-2)-[3H]epinephrine and (-)[3H]dihydroalprenolol binding to beta1- and beta2-noradrenergic receptors inbrain, heart, and lung membranes. J Biol Chem 253: 5090–5102.
Violin JD, DiPilato LM, Yildirim N, Elston TC, Zhang J, and Lefkowitz RJ (2008)beta2-adrenergic receptor signaling and desensitization elucidated by quantitativemodeling of real time cAMP dynamics. J Biol Chem 283:2949–2961.
Violin JD, Soergel DG, Boerrigter G, Burnett JC, Jr, and Lark MW (2013) GPCRbiased ligands as novel heart failure therapeutics. Trends Cardiovasc Med 23:242–249.
Wacker D, Fenalti G, Brown MA, Katritch V, Abagyan R, Cherezov V, and Stevens RC(2010) Conserved binding mode of human beta2 adrenergic receptor inverse agonistsand antagonist revealed by X-ray crystallography. J AmChem Soc 132:11443–11445.
Wisler JW, DeWire SM, Whalen EJ, Violin JD, Drake MT, Ahn S, Shenoy SK,and Lefkowitz RJ (2007) A unique mechanism of beta-blocker action: carvedilolstimulates beta-arrestin signaling. Proc Natl Acad Sci USA 104:16657–16662.
Zhang ZS, Cheng HJ, Ukai T, Tachibana H, and Cheng CP (2001) Enhanced cardiacL-type calcium current response to b2-adrenergic stimulation in heart failure. JPharmacol Exp Ther 298:188–196.
Zimmerman B, Beautrait A, Aguila B, Charles R, Escher E, Claing A, Bouvier M,and Laporte SA (2012) Differential b-arrestin-dependent conformational signalingand cellular responses revealed by angiotensin analogs. Sci Signal 5:ra33.
Address correspondence to: Michel Bouvier, IRIC – Université deMontréal, C.P. 6128 Succursale Centre-Ville, Montreal, QC, Canada. E-mail:[email protected]
b2AR Ligands Are Biased toward ERK1/2 Signaling 509
at ASPE
T Journals on A
pril 27, 2015m
olpharm.aspetjournals.org
Dow
nloaded from