quantification and characterization of fracture resistance
TRANSCRIPT

University of Arkansas, FayettevilleScholarWorks@UARK
Theses and Dissertations
5-2016
Quantification and Characterization of FractureResistance in Asphalt Concrete Based on R-CurveMethodShu YangUniversity of Arkansas, Fayetteville
Follow this and additional works at: http://scholarworks.uark.edu/etd
Part of the Civil Engineering Commons
This Dissertation is brought to you for free and open access by ScholarWorks@UARK. It has been accepted for inclusion in Theses and Dissertations byan authorized administrator of ScholarWorks@UARK. For more information, please contact [email protected], [email protected].
Recommended CitationYang, Shu, "Quantification and Characterization of Fracture Resistance in Asphalt Concrete Based on R-Curve Method" (2016).Theses and Dissertations. 1543.http://scholarworks.uark.edu/etd/1543

Quantification and Characterization of Fracture Resistance in Asphalt Concrete Based on
R-Curve Method
A dissertation submitted in partial fulfillment
of the requirements for the degree of
Doctor of Philosophy in Engineering
by
Shu Yang
Southeast University
Bachelor of Science in Civil Engineering, 2006
Southeast University
Master of Science in Highway and Railway Engineering, 2011
May 2016
University of Arkansas
This dissertation is approved for recommendation to the Graduate Council.
____________________________________
Dr. Andrew F. Braham
Dissertation Director
____________________________________
Dr. Kevin D. Hall
Committee Member
____________________________________
Dr. Gary S. Prinz
Committee Member
____________________________________
Dr. Zahid Hossain
Committee Member
____________________________________
Dr. Shengfan Zhang
Committee Member

Abstract
The application of fracture energy is widely applied in the evaluation of cracking in the
laboratory for asphalt concrete. However, this single number does not provide information on the
characterization of the initiation and propagation of cracks. The Resistance Curve method, or R-
Curve, is widely applied in characterizing various materials including, but not limited to, metal,
polymer, rock, and composite. This research R-Curve method introduces asphalt concrete
through a stepwise approach. First, in chapter one, there is a literature review of the history of
fracture mechanics, fracture research in asphalt concrete, and an examination of the role of R-
Curve application in various materials. Second, the current widely applied fracture energy
analysis techniques are studied comprehensively for three types of asphalt concrete, three levels
of aging, and two levels of moisture condition. The main limitation of fracture energy found in
this chapter is that fracture energy alone is not always able to differentiate the fracture resistance
of the three different materials examined. Third, the R-Curve method is applied to analyze and
evaluate the same materials examined in chapter two. It is found that R-Curve can characterize
and quantify the crack initiation and propagation, and the effects of aging and moisture damage
on crack propagation are captured. Finally, a further investigation of R-Curve is performed to
establish the envelope R-Curve considering the internal factors of aggregate size and binder
grade, and the external factors of testing temperature and loading rate. The effects of aggregate
size, binder grade, temperature, and loading rate on crack initiation and propagation are found by
the parameters of cohesive energy and energy rate that are extracted from R-Curve. In
conclusion, it is found that the R-Curve method can characterize and quantify the crack initiation
and propagation for asphalt concrete.

© 2016 by Shu Yang
All Rights Reserved

Acknowledgement
I want to say thank you to my parents, Yang Hualin and Yang Yulan for the support as always. I
am heartily thankful to my advisor, Dr. Andrew Braham, for the encouragement, support and
advice in the past five years. Besides my advisor, I also want to sincerely thank the rest of my
committee: Dr. Kevin Hall, Dr. Zahid Hossain, Dr. Gary Prinz, and Dr. Shengfan Zhang.
I cannot have the great experience in the past five years without my coworkers: Cory Bramlett,
Leslie Parker, Slater Smith; and my friends: Robert Hill and Amanda Garbacz, my first
classmates in the UofA; Alex Jackson and John Ryan, my first research workmates in the UofA;
Chase Henrichs and Sadie Smith, my second research workmates in the UofA; Elvis Castillo,
Airam Morales, and Erica Yeung, my third research workmates in the UofA; Nazmul
Chowdhury, my project colleague from Arkansas State University.

Table of Contents
Abstract
Acknowledgement
Table of Contents
List of Figures
List of Tables
List of Published Papers
Chapter 1 Introduction of Fracture in Asphalt Concrete ........................................................... 1
1.1 General research history ........................................................................................................ 1
1.2 Fracture mechanics history.................................................................................................... 3
1.3 Application of fracture mechanics in asphalt concrete ......................................................... 6
1.4 Problem statement ............................................................................................................... 10
1.5 What is R-Curve? ................................................................................................................ 10
1.6 Application of R-Curve in other area .................................................................................. 14
1.7 Dissertation objectives ........................................................................................................ 18
1.8 Reference ............................................................................................................................. 19
Chapter 2 Preliminary Fracture Energy Research* ................................................................. 25
2.1 Background of preliminary fracture energy research .......................................................... 25
2.2 Chapter objective................................................................................................................. 27
2.3 Test materials ...................................................................................................................... 27
2.4 Test methods ....................................................................................................................... 29
2.4.1 Semi Circular Bend test.................................................................................................... 29
2.4.2 Dynamic modulus test .................................................................................................. 30
2.5 Results and discussion ......................................................................................................... 31
2.5.1 Discussion of SC(B) results .......................................................................................... 31
2.5.2 Discussion of dynamic modulus results ....................................................................... 36
2.6 Summary and chapter conclusion ....................................................................................... 41
2.7 Reference ............................................................................................................................. 43
Chapter 3 Preliminary R-Curve Research* ............................................................................. 44
3.1 Background of preliminary R-Curve research .................................................................... 44
3.2 Chapter objective................................................................................................................. 48
3.3 Test materials ...................................................................................................................... 48

3.4 Test methods ....................................................................................................................... 49
3.5 Results and discussion ......................................................................................................... 49
3.5.1 Effects of testing temperature ....................................................................................... 55
3.5.2 Effects of moisture conditioning .................................................................................. 57
3.5.3 Effects of short term aging ........................................................................................... 59
3.5.4 Effects of long term aging ............................................................................................ 60
3.5.5 Statistical analysis......................................................................................................... 62
3.6 Summary and chapter conclusion ....................................................................................... 63
3.7 Reference ............................................................................................................................. 66
Chapter 4 R-Curve Research for Asphalt Concrete................................................................. 69
4.1 Background ......................................................................................................................... 69
4.2 Chapter objective................................................................................................................. 70
4.3 Material and methods .......................................................................................................... 70
4.3.1 Mix design .................................................................................................................... 73
4.3.3 SC(B) test configuration ............................................................................................... 75
4.3.2 Sample fabrication description ..................................................................................... 76
4.3.4 Dynamic modulus of the material in test matrix .......................................................... 76
4.4 Tests results and discussion ................................................................................................ 80
4.4.1 Fracture energy, cohesive energy and energy rate ....................................................... 81
4.4.2 Crack extension analysis .............................................................................................. 93
4.4.3 Creep damage in fracture tests ...................................................................................... 98
4.5 Summary and chapter conclusion ....................................................................................... 99
4.6 Reference ........................................................................................................................... 101
Chapter 5 Conclusions and Recommendations ..................................................................... 102
5.1 Review of chapter objectives ............................................................................................ 102
5.2 Conclusions ....................................................................................................................... 103
5.3 Recommendations ............................................................................................................. 107
Reference .................................................................................................................................... 109
Appendix A Tables from Chapter 2 ............................................................................................ 119
Appendix B Tables from Chapter 3 ............................................................................................ 129
Appendix C Tables from Chapter 4 ............................................................................................ 130

List of Figures
Figure 1.1 Load Displacement Curve and R-Curve ...................................................................... 11
Figure 2.1 SC(B) Fracture Test Results at -24°C and -12°C ........................................................ 33
Figure 2.2 Conditioned vs. Unconditioned SC(B) Test Results -24˚C and -12˚C ........................ 35
Figure 2.3 Master Curve for Unconditioned Sample (Reference Temperature: 21.1ºC) ............. 36
Figure 2.4 |E*| Comparison for HMA (Moisture Condition vs. Unconditioned) ......................... 37
Figure 2.5 Master Curve at Aging Level Two Hours (Reference Temperature: 21.1ºC) ............. 38
Figure 3.1 Typical R-Curve from Asphalt Concrete .................................................................... 50
Figure 3.2 Example R-Curves for HMA: (a) Three Replicates for HMA; (b) Three Levels of
Aging for HMA Moisture Condition, -12°C ................................................................................ 55
Figure 3.3 Effects of Testing Temperature ................................................................................... 56
Figure 3.4 Effects of Moisture Conditioning ................................................................................ 58
Figure 3.5 Effects of Short Term Aging ....................................................................................... 60
Figure 3.6 Effects of Long Term Aging ....................................................................................... 62
Figure 4.1 Gradation of Asphalt Mixture ..................................................................................... 74
Figure 4.2 Compaction Curve ....................................................................................................... 74
Figure 4.3 SC(B) Test Configuration, Before(left) and After(right) Test .................................... 75
Figure 4.4 SC(B) Sample Fabrication ........................................................................................... 76
Figure 4.5 Dynamic Modulus in Indirect Tensile (IDT) Mode .................................................... 77
Figure 4.6 Master Curves of Mixture with: (a) NMAS 9.5mm, PG 64-22; (b) NMAS 9.5mm, PG
76-22; (c) NMAS 25mm, PG 64-22; (d) NMAS 25mm, PG 76-22 ............................................. 79
Figure 4.7 Master Curve Comparison ........................................................................................... 80
Figure 4.8 Sample R-Curves for 25mm, PG 64-22 HMA, at loading rate of 0.03mm/min ......... 81
Figure 4.9 Effect of Performance Grade on Fracture Energy (a), Cohesive Energy (b), and
Energy Rate (c) ............................................................................................................................. 86
Figure 4.10 Effects of NMAS on Fracture Energy (a), Cohesive Energy (b), and Energy Rate (c)
....................................................................................................................................................... 88
Figure 4.11 Effect of temperature on Fracture Energy (a), Cohesive Energy (b), and Energy Rate
(c) .................................................................................................................................................. 91
Figure 4.12 Effect of Loading Rate on Fracture Energy (a), Cohesive Energy (b), and Energy
Rate (c) .......................................................................................................................................... 93
Figure 4.13 Crack Growth in Asphalt Concrete ........................................................................... 94
Figure 4.14 Isolation of Crack by Threshold Value ..................................................................... 95
Figure 4.15 Example Histogram of One SC(B) Test Image ......................................................... 95
Figure 4.16 Example Crack Area Extension................................................................................. 97
Figure 4.17 Effect of Temperature, NMAS, binder Grade, and Loading Rate with Updated
Energy Rate ................................................................................................................................... 98
Figure 4.18 Creep Damage in SC(B) Test at 24°C, 1.00mm/min, NMAS 25mm, PG 76-22 ...... 99

List of Tables
Table 2.1 Analysis of Variance of Fracture Energy ..................................................................... 35
Table 2.2 Analysis of Variance of |E*| ......................................................................................... 40
Table 3.1 Experimental Matrix for Chapter 3 ............................................................................... 52
Table 3.2 Summary of Chapter 3’s Test Results .......................................................................... 53
Table 3.3 P-value Summary of ANOVA for Fracture Energy, Cohesive Energy and Energy Rate
....................................................................................................................................................... 63
Table 4.1 Experimental Matrix for Chapter 4 ............................................................................... 70
Table 4.2 Optimum Asphalt Binder Content ................................................................................ 74
Table 4.3 Summary of Chapter 4’s Test Results .......................................................................... 82
Table 4.4 P-value Summary of ANOVA for COVs ..................................................................... 83
Table 4.5 P-value Summary of ANOVA for Fracture Energy, Cohesive Energy and Energy Rate
....................................................................................................................................................... 84
Table A.1 Analysis of Variance of |E*| at -10ºC, 25Hz .............................................................. 119
Table A.2 Analysis of Variance of |E*| at -10ºC, 10Hz .............................................................. 119
Table A.3 Analysis of Variance of |E*| at -10ºC, 5Hz ................................................................ 119
Table A.4 Analysis of Variance of |E*| at -10ºC, 1Hz ................................................................ 120
Table A.5 Analysis of Variance of |E*| at -10ºC, 0.5Hz ............................................................. 120
Table A.6 Analysis of Variance of |E*| at -10ºC, 0.1Hz ............................................................. 120
Table A.7 Analysis of Variance of |E*| at 4ºC, 25Hz ................................................................. 121
Table A.8 Analysis of Variance of |E*| at 4ºC, 10Hz ................................................................. 121
Table A.9 Analysis of Variance of |E*| at 4ºC, 5Hz ................................................................... 121
Table A.10 Analysis of Variance of |E*| at 4ºC, 1Hz ................................................................. 122
Table A.11 Analysis of Variance of |E*| at 4ºC, 0.5Hz .............................................................. 122
Table A.12 Analysis of Variance of |E*| at 4ºC, 0.1Hz .............................................................. 122
Table A.13 Analysis of Variance of |E*| at 21ºC, 25Hz ............................................................. 123
Table A.14 Analysis of Variance of |E*| at 21ºC, 10Hz ............................................................. 123
Table A.15 Analysis of Variance of |E*| at 21ºC, 5Hz ............................................................... 123
Table A.16 Analysis of Variance of |E*| at 21ºC, 1Hz ............................................................... 124
Table A.17 Analysis of Variance of |E*| at 21ºC, 0.5Hz ............................................................ 124
Table A.18 Analysis of Variance of |E*| at 21ºC, 0.1Hz ............................................................ 124
Table A.19 Analysis of Variance of |E*| at 37ºC, 25Hz ............................................................. 125
Table A.20 Analysis of Variance of |E*| at 37ºC, 10Hz ............................................................. 125
Table A.21 Analysis of Variance of |E*| at 37ºC, 5Hz ............................................................... 125
Table A.22 Analysis of Variance of |E*| at 37ºC, 1Hz ............................................................... 126
Table A.23 Analysis of Variance of |E*| at 37ºC, 0.5Hz ............................................................ 126
Table A.24 Analysis of Variance of |E*| at 37ºC, 0.1Hz ............................................................ 126
Table A.25 Analysis of Variance of |E*| at 54ºC, 25Hz ............................................................. 127
Table A.26 Analysis of Variance of |E*| at 54ºC, 10Hz ............................................................. 127
Table A.27 Analysis of Variance of |E*| at 54ºC, 5Hz ............................................................... 127
Table A.28 Analysis of Variance of |E*| at 54ºC, 1Hz ............................................................... 128
Table A.29 Analysis of Variance of |E*| at 54ºC, 0.5Hz ............................................................ 128

Table A.30 Analysis of Variance of |E*| at 54ºC, 0.1Hz ............................................................ 128
Table B.1 Analysis of Variance of Fracture Energy ................................................................... 129
Table B.2 Analysis of Variance of Cohesive Energy ................................................................. 129
Table B.3 Analysis of Variance of Energy Rate ......................................................................... 129
Table C.1 Analysis of Variance of Fracture Energy COV ......................................................... 130
Table C.2 Analysis of Variance of Cohesive Energy COV ........................................................ 130
Table C.3 Analysis of Variance of Energy Rate COV ............................................................... 130
Table C.4 Analysis of Variance of Fracture Energy ................................................................... 130
Table C.5 Analysis of Variance of Cohesive Energy ................................................................. 131
Table C.6 Analysis of Variance of Energy Rate ......................................................................... 131

List of Published Papers
Chapter 2: Shu Yang, Andrew Braham, Lianfang Wang, and Qingkai Wang. “Influence of
Aging and Moisture on Laboratory Performance of Asphalt Concrete”, Construction and
Building Materials 115:527-535., 2016
Chapter 3: Shu Yang, and Andrew Braham. “R-Curves Characterisation Analysis for Asphalt
Concrete”, International Journal of Pavement Engineering:1-10., 2016

1
Chapter 1 Introduction of Fracture in Asphalt Concrete
1.1 General research history
Cracking is one of the common distresses and premature failures in asphalt concrete (Birgisson,
et al. 2007). It is generally defined and separated into mechanisms: thermal cracking, reflective
cracking, and fatigue cracking. In cold climate regions, thermal cracking in asphalt pavement is
one of the prominent distresses (Dave et al., 2011). Like many other materials, asphalt concrete
has a thermal response to the environmental temperature change. When the environmental
temperature is low and decreasing, asphalt concrete shrinks and stress grows in the material to
deteriorate the material to form a crack at the weakest defect point. Reflective cracking of asphalt
overlay is an extensive pavement distress and damage in composite pavement structures. (Dave
and Buttlar, 2010). If asphalt course layer paved on the Portland Cement Concrete (PCC), as the
wheel moves from the existing PCC slab joint or crack, shear stress could be generated to create
a crack that initiates from the bottom of asphalt layer and finally reflects to the top. (Braham,
2008). Fatigue cracking occurs in the area of wheel path because of the repeated traffic load
(Miller and Bellinger, 2003). Fatigue cracking is also a major distress in asphalt pavement, in
which researcher put to study in the past twenty years (Luo, 2012).
From 1987 to 1993, Strategic Highway Research Program (SHRP) performed a significant
amount of research to improve the performance of asphalt pavement. The SHRP introduced the
Superior Performing Asphalt Pavement (Superpave) asphalt mixture design and analysis system
in 1992 after five years’ research to control the thermal cracking, fatigue cracking, and rutting
(Kavanagh, 2004). The current mix design method – Superpave considered cracking as one of
the major concerns.

2
Research on cracking in asphalt concrete developed from the empirical method to the target of
mechanistic method. The earlier stage of the studies on cracking in asphalt concrete is empirical.
For example, National Cooperative Highway Research Program (NCHRP) Report 747 is a guide
of forensic analysis. It lists out the causes of cracking including: low strength in mix, low asphalt
content, high air void content, low HMA thickness, poor subgrade or base compaction, high
asphalt binder viscosity, rapid aging of binder, exposure to moisture, high traffic volume,
inadequate structure, and poor drainage. Researchers collected and are collecting large amount of
cracking data that could be used for forensic analysis or statistical analysis. It is important that
the correlation between the cracking performance and these empirical parameters as it can be
used to guide the design and construction of the pavement directly to prevent from cracking in
asphalt concrete. However, empirical research is not adequate to understand the mechanism
behind the correlation. It is even more important to understand the fundamental cause of the
cracking because the environmental that the asphalt concrete work in and the material itself
always vary in huge from one road to another.
In a more advanced stage to the research, studies have moved on to the perspective of fracture
mechanics to discover the fundamental of cracking in asphalt concrete. Single Edge Notched
Beam [SE(B)] test was applied to study the strain energy release rate, which marks the first
application of fracture mechanics in asphalt concrete (Moavenzadeh, 1967). The concept of
Paris’ Law (Paris, 1963) from Linear Elastic Fracture Mechanics (LEFM) was applied in the
studies of the fatigue cracking in asphalt concrete (Majidzadeh et al., 1970), which is another
significant milestone in the history of application of fracture mechanics in asphalt concrete.

3
Later, researchers start to apply more concepts in fracture mechanics that first developed for
other materials, especially in metal, to the studies of the cracking resistance in asphalt concrete.
For example, LEFM concepts include fracture toughness (Ramsamooj et al., 1991), and stress
intensity factor (Dongre et al., 1989) was applied to asphalt concrete. Although these research
were based on fracture mechanic, the asphalt concrete was over simplified as linear elastic
material. More recently, researchers apply the non-liner theory concept, fracture energy to the
investigation of cracking in asphalt concrete. The concept of fracture energy in asphalt concrete
has been studied intensively and comprehensively by a vast amount of researchers. For example,
Li and Marasteanu (2004) applied studied the fracture energy of asphalt concrete with Semi-
Circular Bend [SC(B)] configuration.
1.2 Fracture mechanics history
The development of the fracture mechanics was first motivated and developed by the aircraft
industry. Thus, the fracture mechanics was developed by studying the material of metal. The
application of fracture mechanics in asphalt concrete can be benefit from the review of mechanic
history. Asphalt concrete is a complex material with the following characterizations: Non-linear,
heterogeneous, non-isotropic, viscoelastic. It is important to apply the appropriate theory in
fracture mechanics to asphalt concrete due to its material characterization. Thus, it is important
to review the development history of the fracture mechanics.
When looking at the development history of fracture mechanics, it experienced three decades
from linear elastic theory to non-linear theory, and time-dependent theory. By mid 1950s, LEFM
was developed by the driven of aircraft industry. (Saxena, 1998). Griffith (1921) first proposed

4
the energy release rate, however, Irwin and Kies (1954) defined energy release rate (G) as a rate
of change in potential energy with the crack area. G is also called a crack driving force because it
is the derivative of a potential as seen in Equation 1.1, and it has the same unit as force.
𝑮 = −𝒅П
𝒅𝑨 Equation 1.1
Where;
G = energy release rate,
П= potential energy, and
a = crack area.
Irwin (1957) derived the stress near the crack tip for mode I cracking as seen in Equation 1.2-1.4:
𝝈𝒙 = √𝑬𝑮
𝝅
𝟏
√𝟐𝒓𝒄𝒐𝒔
𝜽
𝟐(𝟏 − 𝒔𝒊𝒏
𝜽
𝟐𝒔𝒊𝒏
𝟑𝜽
𝟐) Equation 1.2
𝝈𝒚 = √𝑬𝑮
𝝅
𝟏
√𝟐𝒓𝒄𝒐𝒔
𝜽
𝟐(𝟏 + 𝒔𝒊𝒏
𝜽
𝟐𝒔𝒊𝒏
𝟑𝜽
𝟐) Equation 1.3
𝝉𝒙𝒚 = √𝑬𝑮
𝝅
𝟏
√𝟐𝒓𝒄𝒐𝒔
𝜽
𝟐𝒔𝒊𝒏
𝜽
𝟐𝒄𝒐𝒔
𝟑𝜽
𝟐 Equation 1.4
Where;
σ= normal stress near the crack tip,
τ = shear stress near the crack tip,
E = young’s modulus,
G = energy release rate, and
r, θ, x, y =coordinate parameter.
KI= √𝐸𝐺 is now known as the single parameter concept of stress intensity factor by which the
stress field at the crack tip could be calculated.

5
Paris law (Paris, 1963) stablished the relation between crack growth and cyclic stress intensity
factor under the LEFM. However, it is realized that LEFM is only limited to the material of
cracked body are dominated with linear elastic behavior, and asphalt concrete is viscoelastic
material at all but lowest service temperatures. In 1960s, nuclear power industry development
leads to develop Elastic-Plastic Fracture Mechanics (EPFM) as the industry uses the ductile
steels in which fracture was associated with plastic deformation. There are two concepts that are
critical to EPFM, Crack Tip Opening Displacement (CTOD) and J-Integral. As defined in
equation 1.5, J-Integral has a similar definition as energy release rate, but for nonlinear material.
J-integral is a more general concept than energy release rate and when the material is linear
elastic, J-integral equals to energy release rate. (Anderson, 2005)
𝐉 = −𝒅П
𝒅𝑨 Equation 1.5
Where;
J = J integral,
П= potential energy, and
A= crack area.
In early to mid-1970s, crack growth under creep condition was complimented to the fracture
mechanics by Siverns and Price (1973). And Time-Dependent Fracture Mechanics (TDFM) was
established.

6
1.3 Application of fracture mechanics in asphalt concrete
The development of fracture mechanics in asphalt concrete is not as advanced as in metal
material. Asphalt concrete is complex in mechanics. In lieu of pure linear elastic, it is a
heterogeneous, non-liner, viscoelastic material. It is reasonably found that the application history
of fracture mechanics in asphalt concrete moved on from linear theory to non-linear, from elastic
to non-elastic, similar to the history of fracture mechanics in metals.
Initially it started with the application of LEFM concepts, Kim et al. (1997) studied the stress
intensity of asphalt concrete at low testing temperature, Majidzadeh et al. (1970) and
Ramsamooj et al. (1991) used stress intensity factor to predict the fatigue life of asphalt concrete.
Tsai et al. (2010) applied Paris Law to predict reflection cracking of HMA overlays.
The research then moved on to non-liner theory by using the concept of Crack Tip Opening
Displacement (CTOD). Wagoner et al. (2005), Braham (2008) investigated the CTOD because
asphalt concrete is not a linear elastic material, and the research on CTOD contributes to
understanding of the “plastic zone” ahead the crack tip. Kuai et al. (2009) applied J-Integral to
crack propagation modeling of asphalt concrete, as J-integral does not require the crack body
behave in linear manner.
In addition to the research discussed above, other research groups have investigated fracture
energy as well. For example, At the University of Illinois, the effects of critical factors on
fracture energy has been well established: binder type, aggregate, composition, (Braham et al.,
2007), aging (Braham et al., 2009), gradation (Ahmed et al., 2010), temperature, air void level,

7
(Dave et al., 2011). Different test configurations have been transmitted from other material to
asphalt concrete to capture fracture energy: indirect tension (Kim et al., 2012), single edge
notched beam (Wagoner et al., 2005), disk-shaped compact tension (Wagoner et al., 2006), and
semi-circular bending (Li and Marasteanu, 2005). In addition, the effects of the geometry on
fracture energy have been investigated by Wagoner et al. (2007).
In the University of Florida, the fundamental study of fracture energy in asphalt concrete was
performed considering the effects of the material components and the environment. For
example, Ruth et al. (2002) studied the relationship between gradation and fracture energy.
Birgisson et al. (2004) measured the fracture energy before and after moisture condition to
evaluate the moisture susceptibility in HMA. More recently, some more in depth research has
been performed on fracture energy in asphalt concrete, the fracture energy analysis was
evaluated by microstructure level analysis (Birgisson et al.,2006). Koh and Roque (2010) used
no uniform stress-state tests to determine fracture energy and claimed that these tests can
accurately determine fracture energy over a range of testing temperature and aging conditions.
Birgisson et al. (2008) applied digital image correlation on IDT and SC(B) test to accurately
capture the fracture energy density for polermer modified asphalt concrete. Kim et al. (2008)
developed a rigorous analytical model to consider the effect of dissipated creep strain energy in
cracking.
At Texas A&M University, Texas overly test protocol is a commonly used fracture test. The
concept of fracture energy index was applied in the overlay tester to characterize the cracking
resistance potential of asphalt concrete (Walubita, et al., 2012). A lot more advanced research

8
was focused on the components of energy in fracture of asphalt concrete. Howson et al. (2012)
separate the total work in a fracture into bond energy, surface free energy, dissipated plastic
energy, and dissipated viscoelastic energy. By review the research from Texas A&M, it was
fatigue cracking was investigated comprehensively by using the energy theory. Although the
fatigue cracking and thermal cracking are considered fundamentally different, the point of view
in fracture of asphalt concrete can be valuable in understanding both fatigue and thermal
cracking. In the research of fatigue cracking in asphalt concrete at Texas A&M, the concept of
surface energy was promoted. It was claimed that the crack in pavement mainly occurs between
the interface of aggregate and asphalt bind or within the asphalt mastic. And the energy used to
separate aggregate and asphalt binder was defined as adhesive energy, while the energy used to
create crack within mastic was defined as cohesion energy. Cheng et al. (2002) applied the
“Principle of Wilhelmy Plate Method” to test and analyzed the surface energy. The fracture
energy was separated into surface free energy, dissipated plastic energy, and dissipated
viscoelastic energy. In addition, Walubita et al. (2012) promoted the concept of pseudo-strain
energy and surface energy to analyze the fracture and fatigue cracking resistance. Luo et al.
(2015) identified the energy in the local nonlinear zone, the energy in the local energy release
zone, and the surface energy in the material to define the energy-based crack initiation criterion.
At the University of Taxes, Bhasin et al. (2009) used the energy methods to characterize fatigue
cracking in asphalt concrete. Bhasin and Little (2009) used the microcalorimeter to directly
measure the surface free energy components: the total energy of adhesion from asphalt binder
and aggregate. It should be noticed that the new created surface area is always rough surface, the

9
measurement of this area can introduce the inaccuracy of the measurement of fracture energy as
it eliminates surface irregularities.
Fracture energy in literatures is normally defined in the Equation 1.6:
𝑮𝒇 =𝑾𝒇
𝑨𝒍𝒊𝒈 Equation 1.6
Where;
Wf = work has been done to create a new crack surface, J/m2, and
Alig = new created surface area, m2.
At Louisiana State University, the parameter “critical strain energy release rate” was applied to
characterize the fracture resistance of asphalt concrete. This parameter was defined as the area
under the load-displacement curve in the pre-peak area divided by the new created surface area.
(Kim et al. 2012). A tremendous amount of typical mixes in Louisiana were tested by using
semi-circular bending test at 25ºC. The critical strain energy release rate, also known as critical
value of J-integral was utilized to evaluate the fracture resistance (Wu et al., 2005). The finite
element method with the cohesive model was performed, and the simulation results agreed with
the semi-circular bending test (Elseifi, et al., 2012)
Fracture energy is currently a most widely used concept to quantify the crack resistance in
asphalt concrete. Based on large amount for research, Marasteanu et al. (2012) claimed that
400J/m2 is sufficient for the asphalt concrete to resist to thermal cracking. It is an easy single
number for the agency to control the quality of asphalt concrete in crack resistance.

10
1.4 Problem statement
In general, there are two approaches for fracture analysis (Anderson, 2005). First approach is
stress intensity analysis: Failure occurs when KI= KIc, and KI is stress intensity factor while KIc is
the critical stress intensity factor of mode I, it is a measure of material resistance to fracture.
Stress intensity analysis will not include the crack propagation; it is a failure analysis. And also
it is not appropriate to be applied in asphalt concrete as stress intensity factor cannot address the
viscous behavior of asphalt concrete. The second approach is Energy criterion: “Crack extension
occurs when energy available for crack growth is sufficient to overcome the resistance of the
material.” One of the benefits of this approach is that: instead of a single static number, this
approach views the cracking process in a dynamic way because it defines the necessary condition
of a crack growth. Thus, it can be used to characterize the whole procedure of a cracking. The
other benefit of this approach is that it quantifies the resistance in measurement of energy. Thus,
the material in fracture analysis does not need to be linear in mechanic property.
As asphalt concrete is a viscoelastic material, due to the nonlinear behavior of the material and
the benefits of the energy criterion, the second approach is appropriate to be applied to quantify
and characterize the resistance to cracking in asphalt concrete. However, as seen in the history of
the fracture mechanics application, no research actually performed this energy criterion to
investigate the reason of crack growth.
1.5 What is R-Curve?
Irwin and Kies (1954) developed the concept to quantify the crack growth resistance: Resistance-
Curve or R-Curve. The R-Curve method considers fracture resistance as a function of crack

11
extension, and crack extension occurs when energy release rate equals to the material resistance.
A plot of resistance vs. crack extension is the defined as the resistance curve, or R-Curve.
The application of R-Curve is the case of fracture analysis using the energy criterion (Anderson,
2005). Crack occurs when the energy release rate equals to the resistance of the material. Crack
could be stable or unstable. The stable crack growth condition is expressed in Equation 1.7, and
unstable condition is shown in equation 1.8:
𝒅𝑮
𝒅𝒂≤
𝒅𝑹
𝒅𝒂 Equation 1.7
𝒅𝑮
𝒅𝒂>
𝒅𝑹
𝒅𝒂 Equation 1.8
Where;
G = crack driving force,
R = fracture resistance, and
a = crack length.
Figure 1.1 Load Displacement Curve and R-Curve
R-Curve is constructed by plotting crack resistance versus crack extension. If the stress at the
low level, the crack cannot grow, the crack will begin to grow a little bit when the stress reaches
to higher level when the crack driving force equals fracture resistance, but cannot grow any
0
100
200
300
400
500
600
700
0 2 4 6 8 10 12
Lo
ad
(N
)
Displacement (0.01 mm)
0
500
1000
1500
2000
2500
0 0.2 0.4 0.6 0.8 1
Cu
mu
lati
ve F
ra
ctu
re E
nerg
y
(J/m
2)
Crack Extension (mm)

12
further unless the stress increases. If the stress is at the level when the driving force increases at a
slower rate than R, the cracking is stable when the stress is at the level that Equation 1.7
expressed. When stress reaches the level that expressed in Equation 1.8, the driving force
increases at a rate quicker than R, the crack growth is unstable. Figure 1.1 illustrates the method
to construct of R-Curve in this research by following the following steps:
1. Run fracture test;
2. Record load and load-line-displacement data;
3. Record images of surface to capture crack extension;
4. Sum up fracture energy at increment of crack length to plot R-Curve.
There are occasional deviations in the R-Curve construction due to the formation of cohesive
zone and complexity of crack patterns, this method referred the construction of R-Curve by
Braham and Mudford (2013).
Many studies use the concept of fracture energy was applied in asphalt concrete. But as a single
number insufficient fracture energy cannot be the fundamental reason of crack initiation and
propagation. Little research in asphalt area was found to characterize the fracture in a dynamic
way. If compare energy release rate and fracture energy: they both share the same unit, because
they both represent the energy to create a unit new surface. The different is that fracture energy is
an overall average energy over the new surface area, so it is a single number of the cracking
result. While energy release rate is the derivative of energy to crack extension increment, it is not
a single number but a dynamic parameter to characterize the cracking process.

13
If fracture test performed at low temperature, chances are the material is very brittle, and the
crack initiates and propagates in a very short time (less than one second). In this case, the R-
Curve is a flat curve and energy release rate is a constant that has no difference with fracture
energy. Thus, fracture energy is a special case of the energy release rate at a special condition
when the cracking is brittle. However, asphalt concrete behaves more ductile when the
temperature is high or the loading rate is low. Only asphalt concrete at brittle condition (proper
temperature and loading rate combination) could be quantified properly with fracture energy. If
the cracking is ductile rather than brittle, the criteria of fracture energy could be misleading,
because it is just an empirical number at a certain condition. The application of R-Curve has the
potential to solve this problem because energy release rate is a dynamic parameter. In addition,
the way R-Curve method defines the crack growth is exactly the same as the second fracture
analysis approach. Thus, R-Curve application to quantify the resistance of fracture has the
support of fracture mechanics rather than empirical numbers. Although energy release rate is still
under LEFM, however, if apply J-integral in R-Curve instead of energy release rate, non-linear
property can be captured. This research will start the investigation of R-Curve from energy
release rate.
In all, in area of asphalt concrete, fracture energy is now widely used to evaluate the material
resistance to thermal cracking. However, cracking occurs because the energy release rate exceeds
the material resistance, no matter it is thermal, load related, or other causes. Fracture energy is
only a specific case of energy release rate when the cracking is a low temperature thermal
cracking. There is a gap between the energy criterion in fracture mechanics and the practice of
evaluation for asphalt concrete’s cracking resistance. The application of R-Curve is expected to

14
fill this gap to evaluate the cracking resistance of asphalt concrete from the perspective of
fracture mechanics.
1.6 Application of R-Curve in other area
R-Curve has been successfully applied in a vast range of material, especially, R-Curve has been
widely applied in the areas such as metal (de Castro, 1984), composite (Fleck et al., 1996),
Ceramic (Yang, 1994), human tooth enamel (Bajaj et al., 2009), human bone (Chan et al., 2012),
epoxy adhesives (Ameli et al., 2009), alloy (Reynolds, 1996), dental porcelain (Cesar et al.,
2011), polymer (Schmit et al., 1990), rock (Ouchterlony, 1982), and Concrete (Xi and Bazant,
1996). It is noticed that there is R-curve application in polymer, which has similar chemical
structural as asphalt cement, and rock, the other important component in asphalt concrete. If R-
Curve could be successfully applied in this large range of materials, there is a potential that this
technique can be successfully applied in asphalt concrete. However, only a few literature of the
application of R-Curve on asphalt concrete was found. Braham and Mudford (2013) applied the
R-Curve for asphalt concrete. Multiple R-Curves at different testing temperatures for the same
mixture were built. By shifting the curves at different temperature, a master R- Curve was
constructed. This study used the master R-Curve to quantify and characterize the cracking
resistance of asphalt concrete. It is noticed that this research used CMOD as the crack extension.
The further literature focusses on answering the following three questions: first, why the R-
Curve was applied for other materials? Second, how R-Curve can be applied in other materials?
Third, what can be found by using R-Curve?

15
Conventionally, it is widely believed that a singular constant fracture toughness (Kc) can be used
to demonstrate the instability conditions in all test geometry size. However, this contradicts to
the concept of R-Curve, which consider the fracture toughness as the resistance is a function of
crack extension. The ASTM committee E-24 on fracture testing metals found that in order to
capture the constant Kc, the specimen need to be as wide as 48 in. R-Curve method can be
applied with a much thinner specimen in a sheet specimen testing, or plain stress problem
testing, which significantly reduces the cost of testing. (ASTM, 1973). Based on literature
review, Heyer (1973) concluded that R-Curve method had been found to be useful to capture
fracture toughness over a large range of material properties and specimen thickness. It is known
that brittle material has a flat R-Curve while ductile material has rising R-Curve. Judy and Goode
(1973) applied R-Curve on three high-strength steels and found that the slope of R-Curve was
dependent on the specimen thickness.
As R-Curve consider the resistance as the function of crack extension, it can be used to
demonstrate the extensive crack tolerance by the minimum fracture toughness. For example, R-
Curve was applied on ASTM A572 grade 50 steel, to investigate the plane-stress fracture
toughness from temperature range -40°F to +72°F, and this fracture toughness can be translated
into critical flaw length. (Novak 1976). In this research, the author used two methods of loading
to capture the R-Curve: displacement control and load control. It was found that load control
method captured a higher measure of the fracture toughness. One of the most interesting findings
was that the critical flaw size was seven times larger than the specimen in all geometry and
testing temperature combinations.
16
In lieu of directly capturing the crack extension and resistance in testing, there are alternative
methods to construct R-Curve indirectly. Zhou, et al. (2015) and Lin, et al. (2015) applied
indentation-strength method developed by Anderson and Braun (1990) to construct R-Curve of
the ceramic material. In this method, the R-curve is determined as the common envelope o the
tangency points of the family of stress intensity factor curves from the strength data sets. The
reason that researchers in ceramic material use R-Curve was that it was found to be hard to
identify the contribution of crack deflection, crack bridging, fiber pull out and transformation to
the toughening of the ceramic composite material. By plotting R-Curve of three materials using
indentation-strength method, analysis of the toughness increment at different crack length stage
showed agreement with the quantitative toughening analysis. At the short crack region, the
increment of the toughness was limited as the fiber behind the crack tip was not functional in
initial indentation flaws. But at a larger crack region, the fresh material was transformed at
advancing tip, caused a significant bridging effect to toughening. It was found that quantitative
of toughening theory analysis agree with the R-Curve results.
R-Curve in its application has alternative of the crack resistance. Usually, accumulative fracture
energy, crack driven force can be used as the measure of resistance. However, this can be
replaced as other measure measurement to address specific material behavior. For example, J-
integral is commonly used in elastic-plastic material to address plastic behavior. Sahu et al.
(2012) applied J-R Curve on characterizing the elastic-plastic fracture behavior of ferritic and
austenitic steel. J-R Curve is the R-Curve that constructed by plotting J-integral as crack
resistance vs. crack extension. Sahu et al. (2012) studied the transferability of fracture toughness

17
properties from specimen to structure components, and it was found that J-R curve were
geometry independent within the limited range of loading and geometric restrictions.
In addition, R-Curve can help to explain the mechanism of crack initiation and propagation, and
the phenomenon that associated during a cracking process. For example, Jeon et al. (2015)
applied R-Curve on Ti-based amorphous alloy containing ductile dendrites. It can explain the
mechanism of blocking of the crack growth and crack blunting and deformation band formation
at dendrites.
Another example is the cohesive energy that associated with cracking process. Gutkin et al.
(2011) studied the R-Curve and its specimen dependence for IM7/8552 unidirectional
carbon/epoxy using Double cantilever beam (DCB) and Compact Tension (CT) test. It was found
that the analytical predicted R-Curve showed agreement with the Finite Element Method (FEM)
R-Curve. It was found that cohesive law model can be used to predict accurate R-Curve. This
research proved that R-Curve can characterize the cohesive zone and cohesive energy. In
addition, the specimen dependent effect under large scale bridging condition was a concern when
applying the R-Curve.
In summary, R-Curve method was comprehensively studied and established in a vast amount of
materials. Due to three most important founds in literature: First, R-Curve can be applied in a
large range of material. Second, R-Curve considers fracture resistance as function of crack
extension instead of constant, which can be applied on thin specimen. Third, R-Curve give
information of cracking initiation such as cohesive energy, and propagation such as the R-curve

18
slope. In conclusion of literature review, there is a research value to transit this R-Curve method
to asphalt concrete.
1.7 Dissertation objectives
The first objective of this research is the review the application of R-Curve in other materials.
This work is discussed as above in chapter one, the other three objectives will be covered from
chapter two to chapter four and listed as below:
- Review of the current widely used quantification of fracture resistance in asphalt
concrete, fracture energy, across various moisture and aging levels, while performing a
viscoelastic analysis of the material by using dynamic modulus.
- Initial investigation of R-Curves by constructing R-Curves from the data in Chapter two
- A full investigation of R-Curves across multiple gradations and asphalt binder types to
determine the potential extremes of R-Curve application.

19
1.8 Reference
Ahmed, Sarfraz, Eshan V. Dave, Behzad Behnia, William G. Buttlar, and Marvin Exline.
"Fracture Characterization of Gap-Graded Asphalt Mixtures and Thin Bonded Wearing
Courses." International Journal of Pavement Research and Technology 3, no. 3 (2010):
128-34.
Ameli, A., M. Papini, J. A. Schroeder, and J. K. Spelt. "Fracture R-Curve Characterization of
Toughened Epoxy Adhesives." Engineering Fracture Mechanics 77, no. 3 (2010): 521-
34.
Anderson, Richard M., and Linda M. Braun. "Technique for the R‐Curve Determination of Y‐Tzp Using Indentation‐Produced Flaws." Journal of the American Ceramic Society 73,
no. 10 (1990): 3059-62.
Anderson, Ted L., and T. L. Anderson. Fracture Mechanics: Fundamentals and Applications.
CRC press, 2005.
Bajaj, Devendra, and Dwayne D. Arola. "On the R-Curve Behavior of Human Tooth Enamel."
Biomaterials 30, no. 23-24 (2009): 4037-46.
Bhasin, Amit, and Dallas N. Little. "Application of Microcalorimeter to Characterize Adhesion
between Asphalt Binders and Aggregates." Journal of Materials in Civil Engineering 21,
no. 6 (2009): 235-43.
Birgisson, B., A. Montepara, E. Romeo, R. Roncella, G. Tebaldi, and R. Roque. "The Use of
Digital Image Correlation for Accurate Determination of Fracture Energy Density in Hot
Mix Asphalt (Hma)." Paper presented at the 6th RILEM International Conference on
Cracking in Pavements, June 16, 2008 - June 18, 2008, Chicago, IL, United states, 2008.
Birgisson, Bjorn, Antonio Montepara, John Napier, Elena Romeo, Riccardo Roncella, and
Gabriele Tebaldi. "Micromechanical Analyses for Measurement and Prediction of Hot-
Mix Asphalt Fracture Energy." Paper presented at the Bituminous Paving Mixtures,
2006.
Birgisson, Bjorn, Antonio Montepara, Elena Romeo, Reynaldo Roque, Riccardo Roncella, and
Gabriele Tebaldi. "Determination of Fundamental Tensile Failure Limits of Mixtures."
Paper presented at the Asphalt Paving Technology 2007 AAPT, March 11, 2007 - March
14, 2007, San Antonio, TX, United states, 2007.
Birgisson, Bjorn, Reynaldo Roque, and Gale C. Page. "Performance-Based Fracture Criterion for
Evaluation of Moisture Susceptibility in Hot-Mix Asphalt." 2004.
Braham, Andrew F., William G. Buttlar, Timothy R. Clyne, Mihai O. Marasteanu, and Mugurel
I. Turos. "The Effect of Long-Term Laboratory Aging on Asphalt Concrete Fracture
Energy." Paper presented at the Asphalt Paving Technology 2009, AAPT, March 15,

20
2009 - March 18, 2009, Minneapolis, MN, United states, 2009.
Braham, Andrew F., William G. Buttlar, and Mihai O. Marasteanu. "Effect of Binder Type,
Aggregate, and Mixture Composition on Fracture Energy of Hot-Mix Asphalt in Cold
Climates." Transportation Research Record, no. 2001 (2007): 102-09.
Braham, Andrew Franz. Fracture Characteristics of Asphalt Concrete in Mode I, Mode Ii, and
Mixed-Mode. ProQuest, 2008.
Braham, Andrew, and Caleb Mudford. "Development of Fracture Resistance Curves for Asphalt
Concrete." Journal of Materials in Civil Engineering 25, no. 11 (2013): 1631-37.
Cesar, Paulo Francisco, Vinicius Rosa, Marcelo Mendes Pinto, Humberto Naoyuki Yoshimura,
and Luoyu Roy Xu. "Effect of Ion Exchange on R-Curve Behavior of a Dental
Porcelain." Journal of Materials Science 46, no. 1 (2011): 117-22.
Chan, Kwai S., and Daniel P. Nicolella. "Micromechanical Modeling of R-Curve Behaviors in
Human Cortical Bone." Journal of the Mechanical Behavior of Biomedical Materials 16,
no. 1 (2012): 136-52.
Cheng, DingXin, Dallas N. Little, Robert L. Lytton, and James C. Holste. "Surface Energy
Measurement of Asphalt and Its Application to Predicting Fatigue and Healing in Asphalt
Mixtures." 2002.
Dave, Eshan V., Behzad Behnia, Sarfraz Ahmed, William G. Buttlar, and Henrique Reis. "Low
Temperature Fracture Evaluation of Asphalt Mixtures Using Mechanical Testing and
Acoustic Emissions Techniques." Paper presented at the Asphalt Paving Technology
2011, AAPT, March 27, 2011 - March 30, 2011, Tampa, FL, United states, 2011.
Dave, Eshan V., and William G. Buttlar. "Thermal Reflective Cracking of Asphalt Concrete
Overlays." International Journal of Pavement Engineering 11, no. 6 (2010): 477-88.
de Castro, P. M. S. T. "R-Curve Behaviour of a Structural Steel." Engineering Fracture
Mechanics 19, no. 2 (1984): 341-57.
Dongre, Rai, M. G. Sharma, and D. A. Anderson. "Development of Fracture Criterion for
Asphalt Mixes at Low Temperatures." Transportation Research Record, no. 1228 (1989):
94-105.
Elseifi, Mostafa A., Louay N. Mohammad, Hao Ying, and Samuel Cooper Iii. "Modeling and
Evaluation of the Cracking Resistance of Asphalt Mixtures Using the Semi-Circular
Bending Test at Intermediate Temperatures." Paper presented at the Asphalt Paving
Technology 2012, AAPT, April 1, 2012 - April 4, 2012, Austin, TX, United states, 2012.
Fleck, N. A., M. P. F. Sutcliffe, S. Sivashanker, and X. J. Xin. "Compressive R-Curve of a
Carbon Fibre-Epoxy Matrix Composite." Composites Part B: Engineering 27, no. 6

21
(1996): 531-41.
Griffith, Alan A. "The Phenomena of Rupture and Flow in Solids." Philosophical transactions of
the royal society of london. Series A, containing papers of a mathematical or physical
character 221 (1921): 163-98.
Gutkin, R., M. L. Laffan, S. T. Pinho, P. Robinson, and P. T. Curtis. "Modelling the R-Curve
Effect and Its Specimen-Dependence." International Journal of Solids and Structures 48,
no. 11-12 (2011): 1767-77.
Howson, Jonathan, Eyad Masad, Dallas Little, and Emad Kassem. "Relationship between Bond
Energy and Total Work of Fracture for Asphalt Binder-Aggregate Systems." Paper
presented at the Asphalt Paving Technology 2012, AAPT, April 1, 2012 - April 4, 2012,
Austin, TX, United states, 2012.
Irwin, G. R., and J. A. Kies. "Critical Energy Rate Analysis of Fracture Strength." Welding
Journal 33, no. 4 (1954): 193-8.
Jeon, Changwoo, Choongnyun Paul Kim, Hyoung Seop Kim, and Sunghak Lee. "Interpretation
of Fracture Toughness and R-Curve Behavior by Direct Observation of Microfracture
Process in Ti-Based Dendrite-Containing Amorphous Alloys." Metallurgical and
Materials Transactions A: Physical Metallurgy and Materials Science 46, no. 4 (2015):
1588-96.
Kavanagh, Leonnie N. "A 9-Year Evaluation of Field Cracking and Rutting Performance of Sps-
9 Superpave Experiment." 2004.
Kim, Jaeseung, Reynaldo Roque, and Bjorn Birgisson. "Integration of Thermal Fracture in the
Hma Fracture Model." Paper presented at the 2008 Annual Meeting of the Association of
Asphalt Paving Technologists, AAPT, April 25, 2008 - April 30, 2008, Philadelphia, PA,
United states, 2008.
Kim, Minkyum, Louay Mohammad, and Mostafa Elseifi. "Characterization of Fracture
Properties of Asphalt Mixtures as Measured by Semicircular Bend Test and Indirect
Tension Test." Transportation Research Record, no. 2296 (2012): 115-24.
Koh, Chulseung, and Reynaldo Roque. "Use of Nonuniform Stress-State Tests to Determine
Fracture Energy of Asphalt Mixtures Accurately." Transportation Research Record, no.
2181 (2010): 55-66.
Kuai, Haidong, Hyun Jong Lee, Goangseup Zi, and Sungho Mun. "Application of Generalized J-
Integral to Crack Propagation Modeling of Asphalt Concrete under Repeated Loading."
Transportation Research Record, no. 2127 (2009): 72-81.
Li, Xue, and Mihai Marasteanu. "Evaluation of the Low Temperature Fracture Resistance of
Asphalt Mixtures Using the Semi Circular Bend Test." Paper presented at the Asphalt

22
Paving Technology 2004, March 8, 2004 - March 10, 2004, Baton Rouge, LA, United
states, 2004.
Li, Xue, and Mihai O. Marasteanu. "Cohesive Modeling of Fracture in Asphalt Mixtures at Low
Temperatures." International Journal of Fracture 136, no. 1-4 (2005): 285-308.
Lin, Jia, Yu Huang, and Houan Zhang. "Damage Resistance, R-Curve Behavior and Toughening
Mechanisms of Zrb2-Based Composites with Sic Whiskers and Zro2 Fibers." Ceramics
International 41, no. 2 (2015): 2690-98.
Luo, Xue. "Characterization of Fatigue Cracking and Healing of Asphalt Mixtures." ProQuest
LLC, 2012.
Luo, Xue, Rong Luo, and Robert L. Lytton. "Energy-Based Crack Initiation Criterion for
Viscoelastoplastic Materials with Distributed Cracks." Journal of Engineering Mechanics
141, no. 2 (2015).
Majidzadeh, K., E. M. Kauffmann, and D. V. Ramsamooj. "Application of Fracture Mechanics
in the Analysis of Pavement Fatigue." 1971 1970.
Marasteanu, Mihai, William Buttlar, Hussain Bahia, Christopher Williams, Ki Hoon Moon,
Eyoab Zegey Teshale, Augusto Cannone Falchetto, et al. "Investigation of Low
Temperature Cracking in Asphalt Pavements National Pooled Fund Study–Phase Ii."
(2012).
Moavenzadeh, Fred. "Asphalt Fracture." 1967 1967.
Novak, Stephen R. "Resistance to Plane-Stress Fracture (R-Curve Behavior) of A572 Structural
Steel." In Mechanics of Crack Growth: ASTM International, 1976.
Ouchterlony, Finn. "Simple R-Curve Approach to Fracture Toughness Testing of Rock Core
Specimens." Paper presented at the Proceedings 23rd Symposium on Rock Mechanics,
Berkeley, Calif, USA, 1982.
Paris, P., and F. Erdogan. "Critical Analysis of Crack Propagation Laws." American Society of
Mechanical Engineers -- Transactions -- Journal of Basic Engineering 85, no. 4 (1963):
528-34.
Rada, Gonzalo R. Guide for Conducting Forensic Investigations of Highway Pavements (with
Supplemental Material on Cd-Rom). Vol. 747: Transportation Research Board, 2013.
Ramsamooj, D. V. "Prediction of Fatigue Life of Asphalt Concrete Beams from Fracture Tests."
Journal of Testing & Evaluation 19, no. 3 (1991): 231-39.
Reynolds, Anthony P. "Comparison of R-Curve Methodologies for Ranking the Toughness of
Aluminum Alloys." Journal of Testing and Evaluation 24, no. 6 (1996): 406-10.

23
Ruth, Byron E., Reynaldo Roque, Bensa Nukunya, Richard Davis, Mihai Marasteanu, William
Vavrik, Frank Fee, et al. "Aggregate Gradation Characterization Factors and Their
Relationships to Fracture Energy and Failure Strain of Asphalt Mixtures." Paper
presented at the Asphalt Paving Technology 2002, March 18, 2002 - March 20, 2002,
Colorado Springs, CO, United states, 2002.
Sahu, M. K., J. Chattopadhyay, and B. K. Dutta. "Transferability of Specimen J-R Curve to
Straight Pipe with Circumferential Surface Flaw." Fatigue and Fracture of Engineering
Materials and Structures 35, no. 5 (2012): 476-87.
Saxena, Ashok. Nonlinear Fracture Mechanics for Engineers. CRC press, 1998.
Schmit, F., D. Bouvart, and D. Francois. "Ductile Fracture Characterization of Polycarbonate by
the R-Curve Method." International Journal of Fracture 43, no. 2 (1990): 83-96.
Siverns, M. J., and A. T. Price. "Crack Propagation under Creep Conditions in a Quenched 2 One
Quarter Chromium 1 Molybdenum Steel." International Journal of Fracture 9, no. 2
(1973): 199-207.
Tsai, Fang-Ling, Robert L. Lytton, and Sangick Lee. "Prediction of Reflection Cracking in Hot-
Mix Asphalt Overlays." Transportation Research Record, no. 2155 (2010): 43-54.
Wagoner, Michael P., and William G. Buttlar. "Influence of Specimen Size on Fracture Energy
of Asphalt Concrete." Paper presented at the Asphalt Paving Technology 2007 AAPT,
March 11, 2007 - March 14, 2007, San Antonio, TX, United states, 2007.
Wagoner, Michael P., William G. Buttlar, and Glaucio H. Paulino. "Development of a Single-
Edge Notched Beam Test for Asphalt Concrete Mixtures." Journal of Testing and
Evaluation 33, no. 6 (2005): 452-60.
Wagoner, Michael P., William G. Buttlar, Glaucio H. Paulino, and Philip Blankenship.
"Investigation of the Fracture Resistance of Hot-Mix Asphalt Concrete Using a Disk-
Shaped Compact Tension Test." 2005.
Wagoner, Michael P., William G. Buttlar, Glaucio H. Paulino, Philip Blankenship, Reynaldo
Roque, Wu Rongzong, Adriaan De Bondt, et al. "Laboratory Testing Suite for
Characterization of Asphalt Concrete Mixtures Obtained from Field Cores." Paper
presented at the Association of Asphalt Paving Technologists -Proceedings of the
Technical Sessions 2006 Annual Meeting, March 27, 2006 - March 29, 2006, Savannah,
GA, United states, 2006.
Walubita, Lubinda F., Geoffrey S. Simate, Edward Ofori-Abebresse, Amy Epps Martin, Robert
L. Lytton, and Luis E. Sanabria. "Mathematical Formulation of Hma Crack Initiation and
Crack Propagation Models Based on Continuum Fracture-Mechanics and Work-Potential
Theory." International Journal of Fatigue 40 (2012): 112-19.

24
Wu, Zhong, Louay N. Mohammad, L. B. Wang, and Mary Ann Mull. "Fracture Resistance
Characterization of Superpave Mixtures Using the Semi-Circular Bending Test." Journal
of ASTM International 2, no. 3 (2005): 135-49.
Xi, Yunping, and Zdenek P. Bazant. "Analysis of Crack Propagation in Concrete Structures by
Markov Chain Model and R-Curve Method." Paper presented at the Proceedings of the
1996 7th Specialty Conference on Probabilistic Mechanics and Structural Reliability,
August 7, 1996 - August 9, 1996, Worcester, MA, USA, 1996.
Yang, Kwanho, C. James Hwang, and John A. Rice. "New Testing Method for Ceramic R-Curve
Determination at Elevated Temperatures." Paper presented at the Proceedings of the 1994
International Mechanical Engineering Congress and Exposition, November 6, 1994 -
November 11, 1994, Chicago, IL, USA, 1994.
Zhou, Peng, Ping Hu, Xinghong Zhang, Wenbo Han, and Youhua Fan. "R-Curve Behavior of
Laminated Zrbinf2/Inf-Sic Ceramic with Strong Interfaces." International Journal of
Refractory Metals and Hard Materials 52 (2015): 12-16.
25
Chapter 2 Preliminary Fracture Energy Research*1
2.1 Background of preliminary fracture energy research
Based on the founding of the literature review in chapter one, it can be seen that fracture energy
is an appropriate and widely applied quantification of crack resistance for asphalt concrete. As
the preliminary research prior to the R-Curve study for asphalt concrete, a comprehensive study
of asphalt concrete will be introduced in this chapter, including a standard analysis of cracking
using only fracture energy, a study of the influence of moisture and aging, and a full viscoelastic
quantification through dynamic modulus. It is known that asphalt concrete is a viscoelastic
material, of whose performance is highly related to the environmental temperature. When the
environmental temperature is relatively low, asphalt concrete tends to behave less viscous and
more brittle, the material needs to be designed more flexible, or less tough to resist the crack;
whereas when the environmental temperature is relatively high, asphalt concrete tends to behave
more viscous and low in toughness, the material needs to be designed tougher, to resist
permanent deformation or rutting. Obviously, the balance between flexibility and stiffness needs
to be considered so that asphalt concrete has sufficient flexibility to resist cracking and sufficient
toughness to resist rutting. Stiffness or toughness can be a vital role in this balance
consideration. Thus, in addition to fracture energy, dynamic modulus as a toughness parameter is
another study object in this preliminary fracture research.
1* The major work in this chapter was an article: Shu Yang, Andrew Braham, Lianfang Wang,
and Qingkai Wang. “Influence of Aging and Moisture on Laboratory Performance of
Asphalt Concrete”, Construction and Building Materials 115:527-535., 2016

26
Besides the environmental temperature, moisture and aging are two other external factors which
may significantly affect the performance of asphalt concrete. First, water in asphalt concrete
may strip the asphalt binder from the aggregate, and result in less bonding at the interface. Also,
the moisture in asphalt concrete can change the thermal dynamic of the material in a freeze-thaw
cycle due to the environmental temperature change. Second, asphalt concrete is exposed to
oxygen, sun radiation, and wind, which age it over time to build on toughness. In order to fully
understand the crack resistance in asphalt concrete, these factors including temperature, moisture
condition, and aging were added to the test matrix in this chapter.
Rather than external factors, asphalt concrete itself has a few variations due to the manufacture
and new technique. Hot Mix Asphalt (HMA) is the most traditional one which needs to be
mixed, transferred, placed, and compacted at high temperature range approximately from 150°C
to 175°C depend on the viscosity of the asphalt cement. Except for the conventional HMA,
warm mix technology and reclaimed material add new uncertainties to asphalt concrete. First,
Warm Mix Asphalt (WMA) has been promoted in recent years to reduce the manufacturing
(from mixing to compacting) temperature. By using lower temperature, warm mix technology
should be able to reduce the aging of asphalt concrete during construction, and thus result in a
better performance and longer service life. However, research need to be performed to verify
this inference. Besides, warm mix has the advantage to reduce the emission of CO2, improve the
working condition at construction site, extend the construction season, extend the material
transfer distance, etc. As a result, there is a huge driven to use this warm mix technology in
industry, while there is concern about the long term performance because there is not much
experience to apply this technology. Second, Reclaimed Asphalt Pavement (RAP) has been
27
utilized to add to HMA in many states. As RAP contains asphalt cement, the usage of RAP in
HMA can reduce the new asphalt cement, which not only meets the demands of sustainability
but also reduces the cost. However, as asphalt binder has the issue of aging as mentioned
previously, RAP containing old binder attracts concerns in industry and academia on long term
performance as well. In order to have a comprehensive understanding of the fracture resistance
characterization of concrete, HMA, WMA, and WMA with usage of RAP (WR), as mixture type
factor, was considered in the experimental matrix too.
In all, a comprehensive research of fracture energy coupled with consideration of toughness
(dynamic modulus) for asphalt concrete is presented in this chapter to fully understand the
current evaluation system of the fracture resistance in asphalt concrete.
2.2 Chapter objective
This chapter targeting using fracture energy and dynamic modulus to characterize the behavior
of asphalt concrete considering aging and moisture condition.
2.3 Test materials
Three types of mixtures were used in this chapter: HMA without RAP (HMA), HMA with 25%
RAP (HR), and WMA with 25% RAP (WR). In order to avoid another verbal of gradation by
including 25% RAP in the HR and WR mixtures, the HMA mix design had to be slightly
changed. The gradation was kept as close as possible to reduce conflicting variables when
comparing the three mixtures. The gradation for the HR and WR mixtures was achieved by
minimizing the sum of square errors (SSE, errors between HMA and HR/WR blend for each

28
size). In order to adjust the optimal asphalt cement content to accommodate the 25% RAP, the
same air voids at Nmax in the Superpave Gyratory Compactor were targeted to match the HMA,
HR, and WR mixtures. While this is not as accurate as a complete mix design to determine the
optimal asphalt cement content, due to limited materials available, this was deemed the best path
forward.
The asphalt cement used in this study was SBS modified PG 76-22 binder. The RAP utilized in
this study was unprocessed RAP shipped from Hebei Province. After solvent extraction, the PG
grade of the binder in the RAP was determined to be a PG70-22, and the binder content in the
RAP was determined to be 4.41% by taking the average of ignition oven and solvent extraction
test. The total binder content for WR and HR incorporated this asphalt cement into the optimal
asphalt cement content used in the samples fabricated in the lab. Since the RAP received was
unprocessed, a lab processing procedure needed to be established.
The moisture conditioning procedure followed the AASHTO T 283 specification. Unconditioned
samples were fabricated and tested with no temperature or moisture conditioning. The
conditioning procedure can be described briefly in three steps: vacuum saturating, freezing, and
thawing. This process may not be representative of the field situations, because the moisture
damage may not be significant after one freeze-thaw cycle, and the conditioning was performed
before the loading, which is not the field case. But this process is the current best way to simulate
moisture damage. The samples were conditioned after they were cut. While this exposes cut
aggregates directly to the moisture conditioning process, it can be very difficult to cut samples
after the conditioning procedure, and many samples could be lost due to fabrication issues.

29
Along with moisture conditioning, aging was the second factor that was considered in the
experimental matrix. AASHTO R 30 was followed to age the samples for testing. Three levels of
this factor were considered: unaged, short term aged, and long term aged. These levels can be
described as:
Unaged: uncompacted samples were exposed to the “standard” aging time of two
hours at compaction temperature before compaction as specified in the Superpave mix
design procedure.
Short term aged: uncompacted samples were aged for four hours at compaction
temperature.
Long term aged: samples were run through the short term aging protocol first and
compacted. After compaction, the sample was placed at room temperature for sixteen
hours, and then aged in an oven at a temperature of 85±3˚C for 120 hours (five days).
2.4 Test methods
2.4.1 Semi Circular Bend test
In this research, the fracture energy of asphalt mixtures is investigated by using the Semi-
Circular Bend [SC(B)]. As mentioned before, in both the fracture test and dynamic modulus test,
two factors were considered: moisture conditioning and laboratory aging. Two levels of
moisture conditioning (conditioned and unconditioned) and three levels of aging (unaged, short
term, and long term) were explored.
30
The fabrication of SC(B) sample, testing temperature and loading rate followed the specification
of SC(B) test. Superpave Gyratory Compaction samples were compacted to Ndesign=100,
targeting 4% air voids. Next, the samples were sliced into 3 disks, each with a thickness of
25mm. Finally, the sliced disks were cut in half into semi-circular shape and a 15mm in depth,
1mm in width notch was cut at the center bottom of each semi-circular sample.
Two testing temperatures in the specification were applied for each mix, -12°C and -24°C. The
HMA, HR, and WR mixtures were placed in an MTS load frame with a clip gauge attached at
the center bottom of sample. A load was applied to the sample, and the load line displacement
(LLD) and Crack Mouth Opening Displacement (CMOD) were recorded by the MTS machine.
All of the SC(B) tests were controlled with a constant COMD rate, set at 0.03mm/min. A preload
of 0.3kN was applied before testing and the test stopped when the load drops below 0.5kN or
when clip gauge range limit was reached.
2.4.2 Dynamic modulus test
As an important input of Mechanistic-Empirical Pavement Design Guide (MEPDG), dynamic
modulus is very widely used to predict the rutting resistance for HMA. Pellinen and Witczak
(2002) investigated the correlation between dynamic modulus and field performance including
rutting, thermal and fatigue cracking, and dynamic modulus was suggested to be a parameter of
the Simple Performance Test [SPT, known as asphalt mixture performance test (AMPT) later]
for rutting.

31
The dynamic modulus test was performed by following AASHTO T 342. To fabricate the
dynamic modulus samples, the Superpave gyratory compaction samples were compacted at
Ndesign=100, targeting 4% air voids. Next, the samples were cored to a 100mm diameter and the
ends were trimmed for a final height of 150mm. Three replicates were used for each test. The
dynamic modulus testing was performed in the MTS loading frame with an environmental
chamber at five temperatures (-10°C,+ 4°C, +21°C, +37°C, and +54°C) and 6 frequencies (25Hz,
10Hz, 5Hz, 1Hz, 0.5Hz, and 0.1Hz). AASHTO T 342 and AASHTO R 62 were followed to run
the test and analyze the data.
2.5 Results and discussion
2.5.1 Discussion of SC(B) results
Figure 2.1 illustrated the results of the SC(B) tests with three types of mixture: HMA, HR, and
WR at two conditions (unconditioned and moisture conditioned), three levels of age (two hours,
four hours and five days), two testing temperatures (-24°C and -12°C). Fracture energy at each
condition was captured to quantify the potential cracking characteristics of asphalt concrete
mixtures.
As seen in Figure 2.1(a), the fracture energy of the SC(B) test at testing temperature -24°C with
unconditioned samples. The average air voids of the sample tested are seen at the top of the bars
in the figure. At testing temperature -24°C, and aging level two hours, WR indicates the highest
fracture energy, HMA shows the lowest and HR is in between the other two. At aging level four
hours, HMA indicates higher fracture energy than HR and WR. At aging level five days, HR and
WR show higher fracture energy than HMA. However, the fracture energy trends are not

32
consistent between the three mixtures. It is disconcerting that the five days aging has such high
variability between the replicates, especially with the HR and WR mixtures. This could indicate
that the long term AAHSTO R 30 aging procedure does not consistently age samples, or creates
significantly different crack patterns in the asphalt mixtures. It is also surprising that for the HR
and WR mixtures, the five days aging has higher fracture energy. It was expected that as the
samples were aged longer, they would become more quasi-brittle, and thus lose a significant
amount of their fracture energy.
Figure 2.1(b) shows the fracture energy of the SC(B) test at testing temperature -24°C with
moisture conditioned samples. At both aging levels two hours and four hours, HMA shows the
highest fracture energy and WR shows the lowest. But at aging level five days, WR shows the
highest fracture energy and HR shows the lowest; while WR does not show this fracture energy
advantage in unconditioned samples, which may indicate that WR improves the moisture
resistance in long term, but it does not improve the short-term cracking performance. It is
encouraging that the variation between replicates on the moisture conditioned samples is lower
than on the unconditioned samples. It is interesting to note that the fracture energy for the HMA
mixtures is quite similar between conditioned and unconditioned samples, while the HR and WR
mixtures show a larger decrease in fracture energy after moisture conditioning.

33
(a) Unconditioned (b) Moisture Conditioned
(c) Unconditioned (d) Moisture Conditioned
*average air voids are shown above bars
Figure 2.1 SC(B) Fracture Test Results at -24°C and -12°C
Figure 2.1(c) and Figure 2.1(d) show the fracture data at -12°C. Specifically, Figure 2.1(c)
shows the fracture energy of the SC(B) test at testing temperature -12°C with unconditioned
samples. At both aging levels two hours and four hours, HMA shows the highest fracture energy
and WR shows the lowest. At aging level five days, HMA still has the highest fracture energy
but WR has slightly higher fracture energy than HR samples. A trend that is very apparent is
that as the samples age, the fracture energy either remains essentially constant or decreases. This
was the expected trend, as higher levels of aging in theory should make a mixture more brittle,
thus, more susceptible to cracking. Another trend that was not observed at -24°C is that moisture
5.4% 3.8% 4.0%
4.8% 4.0% 4.0%
5.5% 3.4% 4.1%
0
400
800
1200
1600
2000
2400
2800
Fra
ctu
re E
nerg
y (
J/m
2)
2hrs@-24°C 4hrs@-24°C 5days@-24°C
HMA HR WR
4.2% 4.5% 4.3%
5.6% 4.2% 4.3%
5.6% 3.9% 3.6%
0
400
800
1200
1600
2000
2400
2800F
ra
ctu
re E
nerg
y (
J/m
2)
2hrs@-24°C 4hrs@-24°C 5days@-24°C
HMA HR WR
4.2% 4.5% 4.3%
5.6% 4.2% 4.3%
5.6% 3.9% 3.6%
0
400
800
1200
1600
2000
2400
2800
Fra
ctu
re E
nerg
y (
J/m
2)
2hrs@-12°C 4hrs@-12°C 5days@-12°C
HMA HR WR
5.4% 3.8%4.0%
4.8% 4.0%
4.0%
5.5% 3.4% 4.1%
0
400
800
1200
1600
2000
2400
2800
Fra
ctu
re E
nerg
y (
J/m
2)
2hrs@-12°C 4hrs@-12°C 5days@-12°C
HMA HR WR

34
conditioning either does not affect the fracture energy or decreases it, as seen in Figure 2.1(d). It
was expected that as a sample was moisture conditioned, the cracking resistance would decrease.
These trends of aging and moisture conditioning indicate that in order to better capture the
effects of aging and moisture conditioning, fracture testing at -12°C is preferred.
From Figure 2.1, there does not seem to be any detrimental effects on usage of RAP in mixtures.
It also shows that the WMA technology is able to have equal performance to the HR technology,
but at mixing and compacting temperatures that are 30°C lower. Therefore, by using the WMA
technology, similar performance to standard RAP containing mixtures can be achieved in the lab,
while reducing manufacturing temperatures. These effects are more beneficial to the
environment through reduced energy use and emissions, and the WMA technology allows the
opportunity to increase haul time.
As mentioned above, several of these sets of data have a high variability in fracture energy. The
high COV shown by the bars in Figure 2.1 does not tend to appear for the unconditioned samples
at two hours aging and four hours aging. It can be implied, therefore, that moisture conditioning
and long term aging may be the reason for increased variability. In an attempt to more directly
observe the effects of moisture conditioning at both -24°C and -12°C, equality line plots were
made to compare the fracture energy of conditioned and unconditioned samples, as seen in
Figure 2.2. It is apparent that the unconditioned fracture energy is higher than the moisture
conditioned fracture energy in general. This is reasonable as one would expect moisture damage
to occur during the conditioning process, and this would in turn decrease the fracture resistance
of the mixtures.

35
(a) -24 ˚C (b) -12 ˚C
Figure 2.2 Conditioned vs. Unconditioned SC(B) Test Results -24˚C and -12˚C
In order to find out the factor that impacts the fracture energy, Analysis of Variance (ANOVA)
for SC(B) fracture energy is performed, and the result is shown in Table 2.1. Four factors
including mixture type, moisture condition, testing temperature, and aging are considered. It is
found that p-values (With a 95% confidence) of temperature is less than 0.05, which means that
only testing temperature significantly affects fracture energy values, or the susceptibility of
mixtures to cracking. In other words, RAP and warm mix do not statistically change the fracture
energy significantly compare to traditional HMA. Considering WR has 0.46% lower binder
content than HR, and is produced and placed at lower temperatures, WR and HR are statistically
similar based on cracking performance.
Table 2.1 Analysis of Variance of Fracture Energy
Source Sum Sq. d.f. Mean Sq. F p-value
Mix Type 20704.6 2 10352.3 0.13 0.8763
Aging 216469.1 2 108234.6 1.39 0.2658
Moisture 256171.0 1 256171 3.28 0.0803
Temperature 471923.2 1 471923.2 6.05 0.0201
Error 2262278.8 29 78009.6
Total 3227546.7 35
0
500
1000
1500
2000
0 500 1000 1500 2000
Mo
istu
re C
on
dit
ion
ed
Fra
ctu
re E
nerg
y
(J/m
2)
Unconditioned Fracture Energy (J/m2)
Line of Equality
HMA
HR
WR
0
500
1000
1500
2000
0 500 1000 1500 2000
Mo
istu
re C
on
dit
ion
ed
Fra
ctu
re E
nerg
y
(J/m
2)
Unconditioned Fracture Energy (J/m2)
Line of Equality
HMA
HR
WR

36
2.5.2 Discussion of dynamic modulus results
To visually simplify the dynamic modulus data, the master curve technique was applied in this
study. Master curves were constructed by using the method from AASHTO PP 62-10. The
effects of mixture type, aging duration, and moisture condition were analyzed in these master
curves. The reference temperature is 21.1˚C.
Figure 2.3 Master Curve for Unconditioned Sample (Reference Temperature: 21.1ºC)
As seen in Figure 2.3, the master curves for the three mixtures (unconditioned) at three aging
level are plotted. In general, HR aged five days shows the highest |E*|, while HMA aged two
hours shows the lowest |E*|at the high reduced frequencies area (low testing temperature area)
and WR aged four hours shows the lowest |E*|at the low reduced frequencies area (high testing
temperature area). The difference among the HR master curves is larger than WR curves, which
indicates WR reduced the effect of aging on modulus. In addition, the curves of the three
mixtures at five days aging level tend to be closer than at the other two aging levels. This result
indicates all three mixtures show similar long term rutting resistance.
100
1000
10000
100000
1.00E-06 1.00E-03 1.00E+00 1.00E+03 1.00E+06 1.00E+09
|E*
| (M
pa
)
Reduced Frequency (Hz)
WR_2hr WR_4hr WR_5day
HR_2hr HR_4hr HR_5day
HMA_2hr HMA_4hr HMA_5day

37
(a) WR (b) HR
(c) HMA
Figure 2.4 |E*| Comparison for HMA (Moisture Condition vs. Unconditioned)
To look at the effect of moisture on |E*|, the entire |E*|values under moisture conditioned versus
unconditioned are plotted as seen in Figure 2.4. If the points under the line of equality, it means
that the modulus decreases after moisture condition. Otherwise, the modulus increases after the
moisture condition. As seen in Figure 2.5 (a), the three levels of aging are considered for WR,
the |E*| points of the sample under a normal two hours aging are closest to perfect line, which
means the modulus does not change much because of the moisture condition. Four hours short
term aging increases the modulus, while five days’ long term aging decrease the modulus. HMA
has the similar trend as WR does. HR shows different trends, moisture condition affect the |E*|
0
10000
20000
30000
40000
0 10000 20000 30000 40000
Mo
istu
re C
on
dit
ion
ed
|E*
| (M
pa
)
Unconditioned |E*| (Mpa)
HR_2hrs HR_4hrs
HR_5days Line of Equality
0
10000
20000
30000
40000
0 10000 20000 30000 40000
Mo
istu
re C
on
dit
ion
ed
|E*
| (M
pa
)
Unconditioned |E*| (Mpa)
WR_2hrs WR_4hrs
WR_5Days Line of Equality
0
10000
20000
30000
40000
0 10000 20000 30000 40000
Mo
istu
re C
on
dit
ion
ed
|E*
| (M
pa
)
Unconditioned |E*| (Mpa)
HMA_2hrs HMA_4hrs
HMA_5days Line of Equality

38
of HR at five days aging the least, |E*| increases after condition for two hours aging sample and
reduces for four hours aging sample.
(a) Unconditioned (b) Moisture conditioned
Figure 2.5 Master Curve at Aging Level Two Hours (Reference Temperature: 21.1ºC)
Another difference between unconditioned and moisture conditioned samples is the shape of the
master curve changed because of the moisture conditioning. In Figure 2.5 (a), the curves have
well defined inflection points; the slope of the curves is lower as the distance increases from the
inflection points. The curves for moisture conditioned samples don’t contain these two inflection
points, which indicate that the mixtures become stiffer more quickly faster as temperature
decreases.
To investigate the significance of effects of mix type, aging, and moisture on dynamic modulus,
ANOVA was performed. The p-value was calculated considering factor of mix type, aging, and
moisture for the modulus at each temperature and frequency. As shown in Table 2.2, there are
only 8 p-values out of 180(combination of five temperatures, six frequencies, three factors) are
lower than 0.05. They are p-values of mixture type at -10ºC for all six frequencies, and moisture
at -10 ºC for 25Hz and 0.5Hz. In other words, Warm mix and RAP make significant difference in
1
10
100
1000
10000
100000
1.E-06 1.E-03 1.E+00 1.E+03 1.E+06
|E*
| (M
pa
)
Reduced Frequency (Hz)
MC_WR_2hr
MC_HR_2hr
MC_HMA_2hr
1
10
100
1000
10000
100000
1.E-06 1.E-03 1.E+00 1.E+03 1.E+06
|E*
| (M
pa
)
Reduced Frequency (Hz)
WR_2hr
HR_2hr
HMA_2hr

39
modulus at -10 ºC for all frequencies; moisture impacts the modulus at -10 ºC for 25Hz and
0.5Hz. The warm mix and RAP usage didn’t impact the stiffness at higher temperatures, also,
the effect of aging and moisture showed no significant different (95% confidence) at almost all
temperatures and frequencies with two exceptions (moisture at -10 ºC, 25Hz and 5Hz) compare
to HMA. The full ANOVA tables for all factors are attached in the appendix A.

40
Table 2.2 Analysis of Variance of |E*|
Temp Frequency p-value
(°C) (Hz) Mix
type Aging Moisture
-10
25 0.020 0.567 0.044
10 0.024 0.389 0.133
5 0.022 0.368 0.097
1 0.011 0.258 0.088
0.5 0.006 0.339 0.034
0.1 0.007 0.199 0.058
4
25 0.158 0.350 0.486
10 0.190 0.408 0.702
5 0.162 0.345 0.712
1 0.153 0.346 0.870
0.5 0.136 0.203 0.706
0.1 0.124 0.139 0.712
21
25 0.066 0.754 0.118
10 0.317 0.247 0.975
5 0.372 0.232 0.939
1 0.469 0.202 0.853
0.5 0.455 0.176 0.902
0.1 0.582 0.111 0.694
37
25 0.366 0.223 0.087
10 0.663 0.295 0.106
5 0.428 0.234 0.179
1 0.392 0.199 0.251
0.5 0.390 0.217 0.267
0.1 0.362 0.181 0.365
54
25 0.109 0.174 0.366
10 0.197 0.220 0.599
5 0.221 0.251 0.705
1 0.247 0.237 0.878
0.5 0.225 0.263 0.561
0.1 0.327 0.328 0.474

41
2.6 Summary and chapter conclusion
This preliminary research investigated the behavior of asphalt concrete materials in the
perspective of fracture energy and dynamic modulus. Three different types of asphalt concrete
mixtures were investigated: Hot Mix Asphalt without Recycled Asphalt Pavement (RAP), Hot
Mix Asphalt with 25% RAP, and Warm Mix Asphalt with 25% RAP. After processing the RAP,
mix designs were performed on the three mixtures. These mixtures, moisture conditioning, and
aging procedures, were evaluated by fracture energy and dynamic modulus, the following
conclusions were made:
The Warm Mix Asphalt with RAP mixture performed very similar to the Hot Mix
Asphalt with RAP mixture in terms of fracture according to the results of fracture energy
from SC(B) test, but at mixing and compacting temperatures 30°C lower. It is expected
that lower mixing and compacting temperature results in a lower aging and further higher
fracture energy. But this didn’t happen to fracture energy, which indicates that fracture
energy didn’t differentiate the cracking resistance performance of material of HMA, HR
and WR.
SC(B) fracture tests performed at -12°C (both conditioned and unconditioned) and the
moisture conditioned samples at -12°C as expected, with decreasing fracture energy as
more aging was applied. However, the -24°C unconditioned samples had large variability
and did not follow logical trends. WR and HR performs similarly based on statistical
analysis, even WR has 0.46% lower binder content than HR.
Moisture conditioned samples tended to have flatter dynamic modulus master curves,
indicating that they become stiffer more quickly as temperature decreases versus
unconditioned samples.

42
After long term aging, it appears that all three asphalt concrete mixtures perform in a
similar manner in dynamic modulus.
The statistical analysis shows that WMA and RAP application result in a significant
different dynamic modulus at -10°C, but no significant difference at higher temperature.
The effect of aging and moisture has no significant difference on WMA and WR compare
to HMA.
After this fracture energy research, it is true that fracture energy does give an evaluation of the
asphalt concrete as concluded above. Fracture energy in this study didn’t differentiate the crack
resistance capability of the three types of mixture. In addition, it didn’t give information about
the crack initiation and prorogation, and effects of the moisture and aging on them. In next
chapter, a preliminary R-Curve method will be applied on the same raw data from the same test
matrix to discover the information that fracture energy cannot provide. It is expected that R-
Curve can provide more detailed crack resistance characterization and quantification of asphalt
concrete.

43
2.7 Reference
American Association of State Highway and Transportation Officials."Mixture Conditioning of
Hot Mix Asphalt (Hma)." Washington, D.C.: American Association of State Highway
and Transportation Officials.
American Association of State Highway and Transportation Officials. "Standard Method of Test
for Resistance of Compacted Asphalt Mixtures to Moisture-Induced Damage."
Washington D.C.: American Association of State Highway and Transportation Officials.

44
Chapter 3 Preliminary R-Curve Research*2
3.1 Background of preliminary R-Curve research
Thermal and reflective cracking are two common types of cracking (Dave et al., 2011). Both of
types of cracking need initiate from dislocation where stress concentrate on: defect for thermal
cracking and joint for reflective cracking. Traditional cracking tests, for example, the Superpave
Indirect Tension test (IDT) does not represent the crack propagation and post-peak behavior (Li
and Marasteanu, 2010), as there is no stress intensity isolation in the bulk of the material.
However, recent research has used the concept of fracture energy as an evaluation of the thermal
and reflective cracking of asphalt pavement. The fracture energy is captured from the different
fracture test configurations all have a notch in common. The most common fracture tests found
in literature are: Semi-Circular Bend [SC(B)] (Li and Marasteanu, 2004), Disc-Shaped Compact
Tension Test [DC(T)] (Wagoner et al., 2005), and Single Edge notched Beam [SE(B)]
(Mobasher, 1997). However, there is a disadvantage of these test configurations. The loading
head pushing on the specimen can cause the localized deformation which may lead to the
inaccuracy and inconsistency of the test results. University of Florida developed Dog-Bone
Direct Tension (DBDR) test configuration, which can solve this problem. Also there is not a
notch in DBDT configuration, the strain at the failure cross section are more determined by the
actual failure plane and the measurement of fracture energy is less affect by the micro-damage.
(Koh and Roque, 2010). Despite the disadvantage of notched-specimen, these tests configuration
has one pre-cut notch on the specimen can lead to concentration of the stress at the notch tip and
2* The major work in this chapter was an article: Shu Yang, and Andrew Braham. “R-Curves
Characterisation Analysis for Asphalt Concrete”, International Journal of Pavement
Engineering:1-10., 2016

45
initiate the crack start from the notch tip. In other words, the crack initiation and propagation can
be expected in an under control range, and the crack initiation can be controlled from the notch
rather than random defects. Fracture energy is at least a combination of two energies: the energy
of both initiating a crack and propagating a crack. Therefore, when fracture energy is reported as
a single number, there is no specific information on the behavior of the crack initiation and
propagation. Reporting a single number may be too general and could mask important
differences between asphalt concrete mixtures. A potential complementary alternative to fracture
energy is the Resistance Curve, or R-Curves. R-Curves graphically show the cumulative fracture
energy versus crack extension. Technically, if crack extension can be captured in a fracture test,
the R-Curve method can be used to analyze the same fracture behavior.
As found in literature, R-Curve have been successfully used in a few fields that gain interests to
application in asphalt concrete: steel (Tanaka and Harrison, 1978), polymer (Schmit et al.,
1990), and composite (Fleck et al., 1996). Steel, polymer and composite are all different
materials where fracture behavior is an important characteristic, but R-Curve can be successfully
applied on all these different materials. In many industries, testing of material can be expensive
due to the size of the specimen. However, if the testing is geometry dependent, the specimen
needs to be thick to have plane strain status in testing to mimic the field condition. Haynes and
Gangloff (1997) used R-Curve for small and thin aluminum alloy specimen, and compared with
the R-Curve from large to middle specimen. It is found that the R-Curve results from thin
specimen is still reasonable, which can improve the efficiency of the testing. Based on the
investigation of aluminum alloy, Nesphor(1987) also claimed that R-Curve is dependent on the
type and loading, the width of specimen, the ratio of the initial length of notch to specimen
46
width. This invariant characteristic benefited the testing of material with given test condition.
Fett et al. (2000) also concluded that R-Curve can be the true material property for small crack
extensions.
As R-Curve is a function of resistance to crack extension, it is often applied as the prediction of
residual strength of metal. Wu and Wilson (1997) suggest that R-Curve is suitable approach for
damage tolerance analysis in certain laminated materials. Cracking is usually a complicated
process in many materials; R-Curve was reported to give information of the characterization of
the cracking. For example, there are two stages in Portland Cement Concrete: deceleration stage
and acceleration stage. Brake et al. (2012) captured the first stage that was neglected in normal
Portland Cement Concrete testing. Lach et al. (2005) reported R-Curve can be used to describe
the steady-state stable crack propagation in polymer as a three-phase kinetic phenomenon: crack
tip blunting or crack initiation, non-stationary stable crack growth, and steady-state stable crack
growth. In some cases, crack occurs in an instable manner. The initiation can be important in
these cases. R-Curve has the capability to quantify the initiation of instability cracking.
Sundaresan and Nageswara (2014) used R-Curve to evaluate the life expectancy of aerospace
press vessels at the initiation of instability cracking. In addition, R-Curve can characterize both
slow crack propagation (Suzuki, et al., 1995), and instantaneous crack propagation (Kim et al.,
2005).
The application of R-Curve has been found to be powerful to solve mechanical and engineering
problems for many other materials. Bertram and Kalthoff (2003) used R-Curve to study the crack
propagation in rock, and it was found that the energy dissipated in crack propagation can be two

47
orders of magnitude larger than crack initiation. Fett et al. (2000) concluded that R-Curve for
small crack extensions can be considered as a true material property. Wu and Wilson (1997)
applied the concept of R-Curve to predict the residual strength of metal-matrix laminated panels,
and it was found that R-curve was independent of the initial notch length and specimen thickness
for aluminum alloy. Shah et al. (2009) evaluated fracture resistance of resin-based composite by
using R-Curve, and use the R-Curve shape change explain the strength increment due to post-
cure heat treatment of the dental composites. Du et al. (1999) used R-Curve to investigate the
evolution of the process zone in rubber modified epoxy polymer. Therefore, this research looks
to apply the of R-Curve method to quantify and characterize asphalt concrete cracking. Asphalt
concrete is a composite (asphalt binder, rock, and air) and it has similar rheological
characteristics as polymer, so R-Curve may have the potential to be able to provide similar
benefits as the material discussed above to understand cracking behavior.
There is one research found using R-Curve on asphalt concrete to characterize the crack
propagation, Ghafari and Nejad (2015) constructed R-Curve in asphalt concrete by using SE(B)
test to characterize the crack propagation. Image analysis is used to capture the crack extension.
It is claimed that crack extension form image analysis can be an alternative of compliance
method. The critical crack length at crack propagation instability was found to be highly related
to testing temperature. The critical crack length decreases as the testing temperature decreases.
In chapter two, fracture energy from SC(B) fracture test was investigated to quantify the crack
resistance of three types of asphalt concrete at multiple aging levels and moisture conditions.
Although there are advantages to use fracture energy, it did not give any information of crack
48
initiation and propagation. But stress intensity isolation (or notch) in fracture test supplies with
the potential to evaluate crack initiation and propagation. The R-curve considers the crack
resistance as a function of crack extension, which includes initiation and propagation. When
performing the SC(B) fracture test discussed in chapter two, the crack growth of the fracture test
was recorded by taking digital images of the specimen surface. Thus, R-Curve can be used to
analyze the same fracture test matrix in chapter two: three asphalt concrete mixtures, including
hot mix, hot mix with RAP, and warm mix with RAP were tested at two testing temperatures (-
12°C and -24°C), three levels of aging (none aged, short term aged, and long term aged), and two
levels of moisture condition (non-conditioned and moisture conditioned) by SC(B) fracture test.
In this preliminary R-Curve study, it is found that the information of crack initiation and
propagation can be captured.
3.2 Chapter objective
As a preliminary research, this chapter is introducing to extract crack initiation and crack
propagation of asphalt concrete utilizing R-Curves method. This will be accomplished by
applying the R-Curve method on the same experimental matrix in chapter two: asphalt concrete
mixture types, two testing temperatures, moisture conditioning, and three levels of aging. The
effects of mixture type, aging, and moisture condition on fracture resistance are expected to be
seen by using R-Curve method.
3.3 Test materials
In order to discover the advantage of R-Curve method compare to fracture energy method, the
test materials in this chapter is identical as the test material used in chapter two: Hot Mix Asphalt
49
without RAP (HMA), Hot Mix Asphalt with 25% RAP (HR), and WMA with 25% RAP (WR).
The WMA utilized a chemical technology at 0.5% by weight of binder. The asphalt binder used
in this study was a SBS modified PG 76-22 binder. The binder content in the RAP was
determined to be 4.41% by taking the average of ignition oven and solvent extraction test. The
total binder content for WR and HR incorporated this asphalt cement into the optimal asphalt
cement content used in the specimens fabricated in the lab. The R-Curve analysis in this chapter
is based on the same raw fracture test data in chapter two plus the image data. Thus, the factors
of moisture condition and aging are the same in the experimental matrix.
3.4 Test methods
The SC(B) test configuration was introduced in chapter two. In order to have the crack extension
to construct R-Curve, an industrial digital camera was used during testing to capture the crack
growth on one side surface of the SC(B) specimen, the camera capture the image of the specimen
surface at a rate of 0.2 frame per second, the images are 8-bit gray scale, and 18 megapixels in
resolution.
3.5 Results and discussion
R-Curve tracks the energy dissipation history in the cracking process, so one potential
application of R-Curve in asphalt concrete is the ability to characterize crack initiation and
propagation. Two parameters were extracted from the R-Curves: cohesive energy and energy
rate, which quantify crack initiation and propagation respectively. Figure 3.1 shows a typical R-
Curve from asphalt concrete materials.

50
Figure 3.1 Typical R-Curve from Asphalt Concrete
As can be seen in the typical R-Curve of asphalt concrete in Figure 3.1, as the crack grew, more
fracture energy was dissipated in the cracking process. There were a couple of common
characterizations for all of the R-Curves constructed for asphalt concrete. First, there was always
a vertical straight line at the beginning of the cracking procedure. This straight line indicated that
there was no crack detected by image analysis the beginning of SC(B) test. During this stage of
cracking, energy was dissipated throughout the specimen. In other words, the energy dissipated
in the specimen didn’t create a visible crack during this stage, which is termed the crack
initiation stage. The energy consumed in this initiation stage processes can be defined as the
cohesive energy, and is quantified by reading the maximum value of the vertical straight line of
the R-Curve. Second, after the initiation stage, the crack grows as more energy consumed,
which was defined as the propagation stage. Theoretically, the shape of R-Curve can be
classified in two groups. The first group, when the R-Curve has a slope of zero, the material has
brittle cracking behavior. However, the second group, when the R-Curve gradually increases,
the material has ductile cracking behavior (Anderson, 2005). With asphalt concrete the
propagation stage of the R-Curve for asphalt concrete was not consistently flat (brittle) or
0
400
800
1200
1600
0 5 10 15 20 25 30
Cu
mu
lati
ve
Fra
ctu
re E
ner
gy
(J
/m2)
Crack Length Extension (mm)
Crack propagation
Cohesive process
Crack Initiation: Cohesive Energy

51
gradually increasing (ductile). It was observed that there often was a localized vertical straight
line in the propagation stage, which indicated that an additional area of the specimen experienced
crack initiation without crack growth. Therefore, the traditional thought process of a single
cohesive zone starting at crack initiation followed by pure crack growth may not be accurate, and
cracks may experience more than one cohesive event with the crack growth. This phenomenon
is also shown in Figure 3.1.
In order to characterize the general resistance of crack growth during the propagation stage, an
energy rate was developed and is defined in Equation 3.1. Energy rates approaching zero indicate
slopes approaching zero, or a brittle failure. However, as the energy rate increased, the cracking
of the asphalt concrete is more ductile in nature.
𝐄𝐧𝐞𝐫𝐠𝐲 𝐑𝐚𝐭𝐞 =𝐅𝐫𝐚𝐜𝐭𝐮𝐫𝐞 𝐄𝐧𝐞𝐫𝐠𝐲−𝐂𝐨𝐡𝐞𝐬𝐢𝐯𝐞 𝐄𝐧𝐞𝐫𝐠𝐲
𝐂𝐫𝐚𝐫𝐜𝐤 𝐄𝐱𝐭𝐞𝐧𝐭𝐢𝐨𝐧 Equation 3.1
Where,
Energy rate – unit energy consumed in crack propagation stage, J/m3,
Fracture energy - the energy consumed in both crack initiation stage and propagation
stage, J/m2,
Cohesive energy - the energy consumed in crack initiation stage, can be found in the R-
Curve as the vertical axis reading of the top end of the vertical straight line, J/m2, and
Crack extension - the crack length on one surface side of SC(B) specimen by image
analysis, mm.
In order to characterize the initiation and propagation behavior in asphalt concrete, R-Curves
were constructed for all of the mixtures shown in Table 3.1. The fracture energy was calculated
traditionally (the area under the load/LLD curve divided by the area of the ligament), cohesive

52
energy, and energy rate were extracted from each R-Curve and are summarized in Table 3.2. The
coefficient of the variance (COV) for fracture energy in the test results varied from 0.6% to
67.0%. An analysis of variance (ANOVA) was performed to determine that if the testing
conditions (included mixture type, moisture condition, testing temperature, age) significantly
affect the variance. The ANOVA results as shown indicated that none of the testing condition
affected the COV significantly. In other words, the variance of the testing results tended to be
from the heterogeneous of the material rather than the testing conditions.
Figure 3.2 shows two sets of example R-Curves. In Figure 3.2(a), three replicates are shown for
Hot Mix Asphalt (HMA), tested at -12°C, with moisture conditioning, and two hours aging,
while Figure 3.2(b) shows the influence of aging by examining three replicates of two hours
aging (no aging), four hour aging (short), and 120 hour aging (long).
Table 3.1 Experimental Matrix for Chapter 3
Factors Number of
levels Level
Mixture Type 3
Hot Mix Asphalt (HMA)
Hot Mix Asphalt with 25% RAP (HR)
Warm Mix Asphalt with 25% RAP (WR)
Testing Temperature 2 -12°C
-24°C
Moisture Conditioning 2 Unconditioned
Conditioned
Aging 3
Unaged
Short term
Long term

53
Table 3.2 Summary of Chapter 3’s Test Results
Mix Condition Temp
(°C) Age
Fracture
Energy COV
Cohesive
Energy COV
Energy
Rate
(J/m2) (%) (J/m2) (%) (J/m3)
HMA Unco
ndit
ioned
-12
2hours 1583.3 10.3 650.1 28.6 24.4
4hours 1638.4 4.8 851.9 9.5 29.9
5days 961.2 32.1 760.6 38.1 6.1
-24
2hours 772.5 6.6 545.9 43.6 6.1
4hours 778.4 10.1 636.3 14.2 6.3
5days 432.8 49.3 383.7 48.5 1.6
Condit
ion
ed
-12
2hours 1171.2 36.1 789.7 41.6 11.1
4hours 871.4 23.1 555.5 36.9 8.6
5days 813.3 12.0 625.7 7.3 5.5
-24
2hours 1002.8 - 966.0 - 3.1
4hours 977.6 45.3 794.1 45.6 5.1
5days 731.2 21.9 652.7 26.1 2.1
HR Unco
ndit
ioned
-12
2hours 1334.6 17.7 655.6 33.7 29.3
4hours 910.6 2.4 596.0 42.6 7.7
5days 798.9 25.4 725.9 22.7 2.1
-24
2hours 1113.2 12.9 845.4 71.5 7.1
4hours 554.7 0.7 390.8 0.8 4.1
5days 1507.6 67.0 537.9 23.7 18.5
Condit
ion
ed
-12
2hours 1117.0 29.8 1031.8 35.7 2.0
4hours 1092.2 57.2 867.2 86.2 6.3
5days 779.5 10.1 690.1 22.5 2.4
-24
2hours 644.4 19.5 452.7 48.1 5.2
4hours 578.5 30.5 525.8 24.0 1.3
5days 631.0 29.8 488.8 40.2 3.5
WR Unco
ndit
ioned
-12
2hours 1036.6 5.5 525.0 20.7 18.0
4hours 1031.6 4.2 876.9 9.0 3.8
5days 867.8 35.2 775.7 37.4 2.5
-24
2hours 1219.6 6.4 1005.6 24.7 8.4
4hours 618.5 19.4 460.5 15.5 4.7
5days 1363.0 54.3 815.5 48.2 15.2
Condit
ion
ed
-12
2hours 1101.4 13.0 832.8 19.1 7.3
4hours 1187.6 17.4 915.3 5.0 7.3
5days 769.2 14.5 596.0 35.4 4.9
-24
2hours 552.2 25.7 479.9 50.6 1.9
4hours 527.1 56.9 459.3 78.1 1.6
5days 938.9 0.6 854.9 14.6 2.8

54
In Figure 3.2(a), two trends immediately appeared. First, there was a relatively large spread of
cohesive energy, with values ranging from 400-1000 J/m2. This large spread could indicate one
of two things. First, cohesive energy as captured in this analysis was not precise enough to glean
any useful information. However, an alternative explanation was that by only testing three
samples, if one data point was an outlier, it would not be identifiable. While large factorial
designs such as the one presented in this paper were interesting, they inherently reduce the
number of replicates that are available in order to try and keep total number of tests under
control. The second trend was that the slopes of the R-Curves, or the energy rate, appeared to be
similar for all three replicates. This indicated that after the crack has formed and is propagating,
the extension is relatively consistent.
In Figure 3.2(b), cohesive energy trends were matched expectations, with cohesive energy
decreasing as the aging increased. As a material ages, it was expected that they cohesive nature
of the material would deteriorate. However, the energy rates were not consistent, as the short
term aging showed more brittle behavior versus no aging and the long term aging, it was
expected that the energy rate would decrease as the aging time increased. However, Figure 3.2
contains only two sets of data. To fully explore the trends of the effects of mixture type, testing
temperature, moisture condition, and aging on the crack initiation and propagation
characterization, lines of equality were utilized and are shown in Figures 3.3-3.7.

55
(a) (b)
Figure 3.2 Example R-Curves for HMA: (a) Three Replicates for HMA; (b) Three Levels
of Aging for HMA Moisture Condition, -12°C
3.5.1 Effects of testing temperature
As seen in Figure 3.2 (a), the majority of data points fell above the line of equality, indicating
that lower temperatures result in lower fracture energy for HMA and HR. This is reasonable as it
was expected that lower temperatures create a more brittle (or elastic) material, decreasing the
amount of energy that the HMA and HR mixtures absorb. The trend is not as clear, however,
with the WR mixture, as the data points fell both above and below the line of equality.
0
400
800
1200
1600
2000
0 10 20 30 40 50
Cu
mu
latv
ie F
ract
ure
En
erg
y (
J/m
2)
Crack Length Extention (mm)
2 Hour Aging (none) 4 Hour Aging (short)
120 Hour Aging (long)
0
400
800
1200
1600
2000
0 10 20 30 40 50
Cu
mu
lati
ve F
ra
ctu
re E
nerg
y (
J/m
2)
Crack Length Extention (mm)
Replicate 1 Replicate 2
Replicate 3 Average

56
(a) Fracture energy (b) Cohesive energy
(c) Energy rate
Figure 3.3 Effects of Testing Temperature
As seen in Figure 3.2(b), the effects of testing temperature on cohesive energy were not clear, as
the data did not show any clear trends around the line of equality. However, when Figure 3.2(a)
and Figure 3.2(b) were compared, the data points for cohesive energy were more tightly
clustered at the range of approximately 400 to 1000 J/m2, despite the difference in temperature,
whereas the fracture energy was spread over a larger range, approximately 600 to 1500 1000
J/m2. This trend was also seen in Figures 3.3-3.5, which indicated that cohesive energy was less
sensitive than fracture energy to testing temperature, moisture conditioning, and aging.
0
500
1000
1500
2000
0 500 1000 1500 2000
Fra
ctu
re E
nerg
y, -1
2˚C
(J
/m2)
Fracture Energy, -24˚C (J/m2)
HMA HR WR Equality Line
0
10
20
30
0 10 20 30
En
erg
y R
ate
, -1
2˚C
(J
/m3)
Energy Rate, -24˚ C(J/m3)
HMA HR WR Equality Line
0
500
1000
1500
2000
0 500 1000 1500 2000
Co
hesi
ve E
nerg
y, -1
2˚
C (
J/m
2)
Cohesive Energy, -24˚ C (J/m2)
HMA HR WR Equality Line

57
Therefore, there is a possibility that crack initiation may not be as effected by temperature,
moisture conditioning, aging as crack propagation. However, this potential phenomenon should
be explored in more detail in future work.
As seen in Figure 2(c), lower testing temperature leads to lower energy rate for all the HMA
mixtures and most of the WR mixtures. This demonstrates that higher testing temperatures
created more ductile cracking behavior, which aligns with previous fracture research findings
(Braham et al., 2008). However, this trend was not as clear with HR, indicating that perhaps the
addition of RAP to HMA influenced ductile versus brittle cracking behavior.
3.5.2 Effects of moisture conditioning
As can be seen in Figure 3.4, the effect of moisture condition on fracture energy was not
consistent for HMA, HR, or WR mixtures. One potential reason might be that testing
temperature, aging levels, and moisture conditioning interacted with each other, and moisture
conditioning was not a strong enough factor to impact the fracture energy (Yang and Braham,
2015). The effect of moisture conditioning on cohesive energy was similar to fracture energy,
there was no clear trend found.
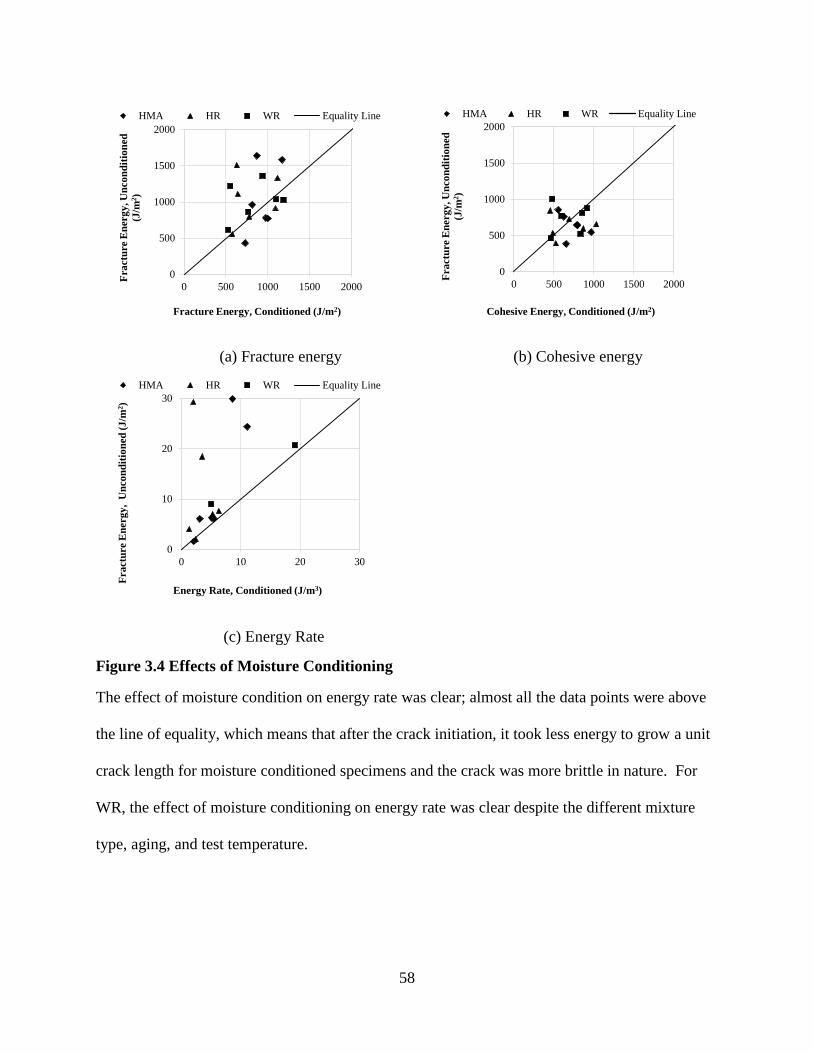
58
(a) Fracture energy (b) Cohesive energy
(c) Energy Rate
Figure 3.4 Effects of Moisture Conditioning
The effect of moisture condition on energy rate was clear; almost all the data points were above
the line of equality, which means that after the crack initiation, it took less energy to grow a unit
crack length for moisture conditioned specimens and the crack was more brittle in nature. For
WR, the effect of moisture conditioning on energy rate was clear despite the different mixture
type, aging, and test temperature.
0
500
1000
1500
2000
0 500 1000 1500 2000
Fra
ctu
re E
ner
gy
, U
nco
nd
itio
ned
(J/m
2)
Fracture Energy, Conditioned (J/m2)
HMA HR WR Equality Line
0
10
20
30
0 10 20 30
Fra
ctu
re E
nerg
y, U
nco
nd
itio
ned
(J
/m2)
Energy Rate, Conditioned (J/m3)
HMA HR WR Equality Line
0
500
1000
1500
2000
0 500 1000 1500 2000
Fra
ctu
re E
nerg
y, U
nco
nd
itio
ned
(J/m
2)
Cohesive Energy, Conditioned (J/m2)
HMA HR WR Equality Line
59
3.5.3 Effects of short term aging
As illustrated in Figure 3.5, short term aging resulted in lower fracture energy for all three types
of mixtures, but didn’t necessarily lead to lower cohesive energy for all three mixtures. This
again highlights that the energy required to initiate the crack, the cohesive energy, may not be as
dependent on short term aging, while the energy required to propagate the crack is more
dependent on short term aging. Finally, in general, short term aging resulted in lower energy,
confirming previous fracture research that indicated aging increased the brittle behavior of
asphalt concrete mixtures (Braham et al., 2009).

60
(a) Fracture energy (b) Cohesive energy
(c) Energy Rate
Figure 3.5 Effects of Short Term Aging
3.5.4 Effects of long term aging
As shown in Figure 3.6, long term aging led to lower fracture energy for HMA, which continued
the aging trend found in the short term aging. However, this trend wasn’t found for HR and WR,
showing that perhaps the addition of RAP to mixtures affects the overall cracking characteristics
of asphalt concrete. The effects of long term aging on cohesive energy fell on both sides of the
line of equality, but most points fell below the line. As discussed above, however, the range of
fracture energy was much tighter for cohesive energy versus the fracture energy, indicating that
0
500
1000
1500
2000
0 500 1000 1500 2000
Fra
ctu
re E
nerg
y, 4
ho
urs
Ag
ing
(J
/m2)
Fracture Energy, 2 hours Aging (J/m2)
HMA HR WR Equality Line
0
10
20
30
0 10 20 30
En
erg
y R
ate
, 4
ho
urs
Ag
ing
(J/m
3)
Energy Rate, 2 hours Aging (J/m2)
HMA HR WR Equality Line
0
500
1000
1500
2000
0 500 1000 1500 2000
Co
hesi
ve E
nerg
y, 4
ho
urs
Ag
ing
(J
/m2)
Cohesive Energy, 2 hours Aging (J/m2)
HMA HR WR Equality Line

61
long term aging may have less influence on the crack initiation versus the crack propagation.
Finally, in general, long term aging lowered the energy rate. Specifically, all of the data points
for HMA were below the line of equality, which demonstrated that the crack propagation
consumed less energy when long term aged and the mixture was more brittle. In general, long
term aging reduced the fracture energy, cohesive energy, and energy rate, which means that long
term aging not only impacted the crack initiation, but also affected the crack propagation. It
should be mentioned that both HR and WR used lab processed RAP. The RAP was processed by
first freezing, then running through a lab-scale jaw crusher. Most RAP used in pavements goes
through field scale crushing, so the use of lab-scale crushing may have introduced a significant
factor that overshadowed the other factors. This was bolstered by the fact that the HMA
mixtures usually showed a clearer trend.

62
(a) Fracture energy (b) Cohesive energy
(c) Energy Rate
Figure 3.6 Effects of Long Term Aging
3.5.5 Statistical analysis
In order to test the hypothesis whether the mixture type, aging, condition and testing temperature
was statistically significant with a 95% confidence on fracture energy, cohesive energy, and
energy rate, an analysis of variance (ANOVA) were performed. The p-value results were shown
in Table 3.3. It could be found that there are three p-values under 0.05. This indicates that three
cases, effect of testing temperature on fracture energy, effect of testing temperature on energy
rate, and effect of moisture condition on energy rate. This statistical analysis proved that
0
500
1000
1500
2000
0 500 1000 1500 2000
Fra
ctu
re E
nerg
y, 1
20
ho
urs
Ag
ing
(J
/m2)
Fracture Energy, 2 hours Aging (J/m2)
HMA HR WR Equality Line
0
10
20
30
0 10 20 30
En
erg
y R
ate
, 1
20
ho
urs
Ag
ing
(J
/m3)
Energy Rate, 2 hours Aging (J/m2)
HMA HR WR Equality Line
0
500
1000
1500
2000
0 500 1000 1500 2000Co
hesi
ve E
nerg
y, 1
20
ho
urs
Ag
ing
(J/m
2)
Cohesive Energy, 2 hours Aging (J/m2)
HMA HR WR Equality Line

63
cohesive energy and energy rate are important complementary of fracture energy. For example,
the moisture condition only impacted the energy rate, but it didn’t impact the fracture energy and
cohesive energy. None of the factors significantly impacted on cohesive energy, this results
agreed that a narrow range of cohesive energy indicated cohesive energy is less sensitive to all
factors. The full ANOVA tables are attached in Appendix B.
Table 3.3 P-value Summary of ANOVA for Fracture Energy, Cohesive Energy and Energy
Rate
P-value Fracture
Energy
Cohesive
Energy
Energy
Rate
Mix Type 0.8763 0.6742 0.6150
Aging 0.2658 0.5369 0.2165
Moisture 0.0803 0.6220 0.0073
Temperature 0.0201 0.0711 0.0494
3.6 Summary and chapter conclusion
This preliminary R-Curve investigation of asphalt concrete constructed the R-Curve by using the
SC(B) fracture test data to analyze the crack resistance of asphalt concrete. The initiation
parameter cohesive energy, and the propagation parameter energy rate, were extracted from the
R-Curves. It is found that cohesive energy was always in a narrower range (approximately 500-
1000 J/m2) compared to the fracture energy range (approximately 500-1700 J/m2) over all
combinations of aging and moisture conditions. The results of energy rate indicated that moisture
and short term aging impact the crack propagation by reducing the resistance of crack growth.
These results proved that R-Curves is a potentially useful tool to quantify the cracking resistance
of asphalt concrete in both crack initiation and propagation. Three mixture included HMA, HMA
with RAP and WMA with RAP were tested at two temperatures, -12°C, -24°C, three levels of
aging (none aged, short term aged and long term aged), and two levels of moisture condition
(none conditioned, and moisture conditioned). Fracture energy, cohesive energy and energy rate

64
were analyzed to evaluate the crack resistance of the three mixtures. The effects of aging and
moisture condition on crack initiation and propagation were studied. In summary, the following
conclusions can be made based on the test results analysis:
Lower testing temperature leads to a lower energy rate for HMA and WR, this wasn’t
found in HR, which indicates that RAP may reduce the resistance to crack propagation
but Warm mix could improve this propagation resistance when using RAP.
Moisture condition does not impact the crack initiation but reduce the ability to resist
crack propagation.
Short term aging has the similar trend as moisture, it does not impact the ability to resist
crack initiation but reduce the resistance to crack growth.
The long term aging reduces the general fracture energy, cohesive energy and energy
rate, in other words, it decreases the ability to resist cracking both in crack initiation and
propagation.
The R-Curve analyzed results and the statistical result proved that R-Curve is effective
tool that can characterize the cracking behavior in asphalt concrete in both crack
initiation and propagation.
This preliminary research of R-Curve proved that R-Curves rather than fracture energy gives
more information of the quantification and characterization of the fracture resistance of asphalt
concrete. R-Curves can potentially characterize the crack resistance in terms of crack imitation
and propagation. However, the results of cohesive energy indicated it is not sensitive to
temperature, aging, and moisture. The cohesive energy need to be further studied. The next
chapter will discuss the further in depth research in R-Curve of asphalt concrete, a more effective

65
viable control need to be performed to differentiate the characterization of R-Curve, as the usage
of RAP may result in high variation in test result which may hide the trend of the R-Curve. In
addition, in this preliminary R-Curve study, it is realized in the image process that crack
extension as one out of two components in R-Curve, need a further investigation. Due to the
complexity of the crack pattern and the of the heterogeneous characterization of asphalt concrete,
crack length as the normal crack quantification might not be adequate to fully characterize the
crack growth. The crack extension will be defined more than a crack length in next chapter.

66
3.7 Reference
Anderson, Ted L., and T. L. Anderson. Fracture Mechanics: Fundamentals and Applications.
CRC press, 2005.
Bertram, A., and J. F. Kalthoff. "Crack Propagation Toughness of Rock for the Range of Low to
Very High Crack Speeds." Paper presented at the Advances in Fracture and Damage
Mechanics, September 2, 2003 - September 4, 2003, Paderborn, Germany, 2003.
Brake, Nicholas Andres, and Karim Chatti. "Prediction of Transient and Steady-State Flexural
Fatigue Crack Propagation in Concrete Using a Cyclic R-Curve." Journal of Engineering
Mechanics 138, no. 4 (2012): 371-78.
Dave, Eshan V., Behzad Behnia, Sarfraz Ahmed, William G. Buttlar, and Henrique Reis. "Low
Temperature Fracture Evaluation of Asphalt Mixtures Using Mechanical Testing and
Acoustic Emissions Techniques." Paper presented at the Asphalt Paving Technology
2011, AAPT, March 27, 2011 - March 30, 2011, Tampa, FL, United states, 2011.
Du, J., M. D. Thouless, and A. F. Yee. "Development of a Process Zone in Rubber-Modified
Epoxy Polymers." International Journal of Fracture 92, no. 3 (1999): 271-85.
Fett, T., D. Munz, R. D. Geraghty, and K. W. White. "Bridging Stress Determination by
Evaluation of the R-Curve." Journal of the European Ceramic Society 20, no. 12 (2000):
2143-48.
Fett, T., D. "Influence of Specimen Geometry and Relative Crack Size on the R-Curve."
Engineering Fracture Mechanics 66, no. 4 (2000): 375-86.
Fleck, N. A., M. P. F. Sutcliffe, S. Sivashanker, and X. J. Xin. "Compressive R-Curve of a
Carbon Fibre-Epoxy Matrix Composite." Composites Part B: Engineering 27, no. 6
(1996): 531-41.
Ghafari, Sepehr, and Fereidoon Moghadas Nejad. "R-Curve Behavior and Crack Propagation
Properties of Asphalt Concrete at Low Temperatures." Journal of Civil Engineering and
Management 21, no. 5 (2015): 559-70.
Haynes, M. J., and R. P. Gangloff. "High Resolution R-Curve Characterization of the Fracture
Toughness of Thin Sheet Aluminum Alloys." Journal of Testing and Evaluation 25, no. 1
(1997): 82-98.
Kim, Ji Sik, Young-Nam Kwon, and Kee-Sun Sohn. "Dynamic Visualization of Crack Tip Stress
Field and Propagation Using the Mechano-Luminescence in Sral2o4:(Eu,Dy,Nd)." Paper
presented at the 5th Pacific Rim International Conference on Advanced Materials and
Processing, PRICM 2004, November 2, 2004 - November 5, 2004, Beijing, China, 2005.
Koh, Chulseung, and Reynaldo Roque. "Use of Nonuniform Stress-State Tests to Determine
67
Fracture Energy of Asphalt Mixtures Accurately." Transportation Research Record, no.
2181 (2010): 55-66.
Lach, R., S. Seidler, and W. Grellmann. "Resistance against the Intrinsic Rate of Fracture
Mechanics Parameters for Polymeric Materials under Moderate Impact Loading."
Mechanics of Time-Dependent Materials 9, no. 2-3 (2005): 103-19.
Li, X. J., and M. O. Marasteanu. "Using Semi Circular Bending Test to Evaluate Low
Temperature Fracture Resistance for Asphalt Concrete." Paper presented at the
Proceedings of the Society for Experimental Mechanics, Inc., 2010.
Li, Xue, and Mihai Marasteanu. "Evaluation of the Low Temperature Fracture Resistance of
Asphalt Mixtures Using the Semi Circular Bend Test." Paper presented at the Asphalt
Paving Technology 2004, March 8, 2004 - March 10, 2004, Baton Rouge, LA, United
states, 2004.
Mobasher, Barzin, Michael S. Mamlouk, and How-Ming Lin. "Evaluation of Crack Propagation
Properties of Asphalt Mixtures." Journal of Transportation Engineering 123, no. 5
(1997): 405-13.
Neshpor, G. S. "Some Special Features of the R-Curve and Its Use for Evaluating the Modulus
of Rupture of Aluminum Alloys." Industrial laboratory 53, no. 5 (1987): 460-67.
Schmit, F., D. Bouvart, and D. Francois. "Ductile Fracture Characterization of Polycarbonate by
the R-Curve Method." International Journal of Fracture 43, no. 2 (1990): 83-96.
Shah, M. B., J. L. Ferracane, and J. J. Kruzic. "R-Curve Behavior and Micromechanisms of
Fracture in Resin Based Dental Restorative Composites." Journal of the Mechanical
Behavior of Biomedical Materials 2, no. 5 (2009): 502-11.
Sundaresan, S., and B. Nageswara Rao. "Stress Intensity at the Initiation of Instability by R
Curve." Paper presented at the 2014 International Mechanical Engineering Congress,
IMEC 2014, June 13, 2014 - June 15, 2014, Tiruchirappalli, TN, India, 2014.
Suzuki, Kenji, Keisuke Tanaka, Yoshihisa Sakaida, and Hiroyuki Yamagishi. "R-Curve
Behavior for Stable Crack Growth from Indentation Cracks in Alumina." Zairyo/Journal
of the Society of Materials Science, Japan 44, no. 504 (1995): 1133-37.
Tanaka, K., and J. D. Harrison. "R Curve Approach to Cod and J for an Austenitic Steel."
International Journal of Pressure Vessels and Piping 6, no. 3 (1978): 177-201.
Wagoner, Michael P., William G. Buttlar, Glaucio H. Paulino, and Philip Blankenship.
"Investigation of the Fracture Resistance of Hot-Mix Asphalt Concrete Using a Disk-
Shaped Compact Tension Test." 2005.
Wu, Ming, and Dale Wilson. "Residual Strength of Metal-Matrix Laminated Panels." Paper

68
presented at the Proceedings of the 1995 6th Symposium on Composites: Fatigue and
Fracture, May 16, 1995 - May 18, 1995, Denver, CO, USA, 1997.

69
Chapter 4 R-Curve Research for Asphalt Concrete
4.1 Background
The preliminary R-Curve findings in Chapter 3 were collected from samples from a study
focused on incorporated RAP and WMA technology into asphalt concrete. In chapter three, R-
Curve for three types of asphalt concrete at different aging levels, moisture conditions, and
temperature were constructed. Cohesive energy and energy rate were extracted to quantify the
crack imitation and propagation. While this data provided a first glimpse to the potential benefits
of utilizing R-Curves, it did not explore common variables in asphalt concrete design, common
variables in testing conditions, and only used a single analysis technique. In this chapter, in
order to evaluate this R-Curve method itself more comprehensively, there are three
considerations to construct the experimental matrix. First, this expanded research of R-Curve
intends to investigate the most fundamental variables in asphalt concrete: Nominal Maximum
Aggregate Size (NMAS) and Performance Grade (PG) of asphalt cement. The theory of NMAS
and PG has been established, it is clear that NMAS and PG grade is essential in the mix-design
to control the cracking resistance performance. Second, as asphalt concrete is a viscoelastic
material, the testing temperature and loading rate impact the crack behavior significantly.
Viscous deformation always associates with the fracture process, it is important to know the
energy dissipated in the system is used to create crack, or creep deformation. Third, R-Curve
method highly depend on the crack extension analysis. However, crack pattern in a fracture test
can be very complex. Conventionally, crack extension is defined as the growth of crack in
length. Instead of a straight line, crack in asphalt concrete is usually random in shape, and it has
branches and grows both in length and width. Thus, a simple definition of crack length extension
may be too simplified to quantify the crack extension.

70
4.2 Chapter objective
This chapter investigates the next stage R-Curve research considering fundamental internal
factors of NMAS and PG, external factors of testing temperature and loading rate. In addition, it
expands the quantification of the crack extension during the crack growth in asphalt concrete.
4.3 Material and methods
In order to maximize the envelope of R-Curve in asphalt concrete, this chapter uses the
experimental matrix shown in Table 4.1. The factors (including PG grade, Nominal Maximum
Aggregate Size, testing temperature, and loading rate) and levels are chosen to expect significant
difference in R-Curve behavior of asphalt concrete.
Table 4.1 Experimental Matrix for Chapter 4
Factors # of Levels Level
Performance Grade 2 PG 64-22, PG 76-22
NMAS 2 9.5mm, 25mm
Test Temperature 3 +24˚C, 0˚C, -24˚C
Loading Rate 2 0.03mm/min, 1.0mm/min
In a performance grade (PG), there are two numbers, for example, PG 76-22. These two number
are converted from air temperature to pavement temperature in Celsius. The first one is from the
maximum seven-day average pavement temperature of the year. Asphalt binder graded as PG76-
should be able to perform well in this high temperature with a certain reliability. The second
number is from the minimum pavement temperature in the year, asphalt binder graded as PG-22
is expected to perform without distress at this low temperature. In this study, the factor of PG
grade has two levels, PG 76-22, and PG 64-22. These two are typical asphalt binders that are
applied in Arkansas. Cracking is usually an issue at low temperature and these two asphalt

71
binders share the same lower limit in the PG. However, it is considered that the fracture behavior
of these two binders in asphalt concrete can be very different too for the following reasons. First,
the low temperature grading in a Superpave PG is graded by Bending Beam Rheometer (BBR).
This BBR test uses a pure asphalt binder as the sample rather than a mixture, the binder
performed in a different mechanism when mixed with aggregate. Second, PG 76-22 is usually
styrene-butadiene-styrene (SBS) polymer modified asphalt binder whereas PG 64-22 is usually a
neat binder without any modification. The purpose of the addition of polymer in the binder is the
toughness increment at high temperature, while the polymer may also change the fracture
behavior at low temperature without impacting on BBR results. Thus, this chapter is
investigating the effects of these two type of binders on R-Curve of asphalt concrete.
NMAS 9.5mm is usually applied in surface course, whereas NMAS 25mm is usually placed in
filed as the binder course in between surface course and base course. NMAS 9.5mm is a finer
gradation than NMAS 25mm as illustrated in Figure 4.1. As known, the finer aggregate
gradation has more surface area than the courser gradation, thus the binder content is usually
higher in finer aggregate gradation to cover the surface area. In asphalt concrete, the binding
between aggregate and asphalt binder is usually the weak point compare to the tensile strength of
aggregate itself, so it is unlikely the crack occurs in a solid aggregate. It is usually observed
crack growing in the asphalt binder filled voids of the asphalt concrete. Noticing that crack can
be observed in an elongated or flat aggregate as well, but the content of elongated and flat
aggregate is strictly controlled in a Superpave mix design. Besides, the gradation structures in the
asphalt concrete can be very different due to the NMAS, which may result in significant fracture
72
toughness and fracture behavior. This chapter will look at the influence of the NMAS on the R-
Curve behavior of the asphalt concrete.
Due to the viscoelasticity, time and temperature are vital in fracture behavior of asphalt concrete.
This chapter use three testing temperature at: -24°C, 0°C and 24°C. The temperature of -24°C is
chosen because of the lower limit of the PG grade for both binder is -22. -24°C is 2°C below the
lower PG limit. This test temperature for fracture test was established by Braham et al. (2007)
and was intended to within the range of glass transition temperature of the asphalt cement. 24°C
is usually the ambient temperature, and significant amount of research was found to perform
fracture test at ambient temperature. For example, Faruk et al. (2014) at Texas A&M
Transportation Institute, found that the room temperature at 25 ºC, was the better suited for low
binder content asphalt concrete in SC(B) test. Wu et al. (2005) at Louisiana Transportation
Research Center perform the SC(B) test at 25°C, for the asphalt concrete contains the binder for
PG 76-22 and PG70-22. However, it is considered that energy dissipated in the specimen during
a fracture tests can be separated into three parts: fracture energy, recoverable strain energy, and
creep strain energy. (Braham, 2008). This indicates that fracture is associated with the elastic
deformation (recoverable) and viscous deformation (creep). Li and Marasteanu (2005) found that
it took higher external work in a fracture test at higher testing temperature. This may indicate
that the creep deformation is larger at higher testing temperature. In other words, the creep
energy increases in the system as the increment of the testing temperature. This research cannot
separate the three types of energy, but the three levels of testing temperature may promote a
trend of the change of creep energy and elastic energy. Thus, -24°C, 0°C, and 24°C are chosen to
expect to detect the trend. It is known that the effect of time and temperature can be converted by

73
the law of time-temperature superposition. Loading rate is the form of time in a fracture test, a
faster loading rate at higher temperature may be equivalent to a slower loading rate at lower
temperature. In this chapter, two loading rates are considered in the experimental matrix,
0.03mm/min, and 1.0mm/min, in the control of CMOD. Four replicates are performed for each
factor at each level.
As the stiffness is an indicator to the viscoelastic behavior, dynamic modulus was tested for the
material listed in the test matrix. In order to achieve the stiffness at SC(B) testing temperature of
-24°C, it is decided to add a dynamic modulus testing temperature of -24°C instead of
extrapolation values from the dynamic modulus master curve.
4.3.1 Mix design
A Superpave mix design was performed for the NMAS 9.5mm, and NMAS 25mm gradation,
using PG 64-22 binder and targeting 4% air voids. The gradation of the NMAS 9.5mm and
NMAS 25mm are illustrated in the Figure 4.1. In order to control the viable of binder content
that could have added a confounding factor on the cracking behavior of asphalt concrete, this
research uses the same binder contents for PG 76-22 binder and PG 64-22 binder. The binder
contents in the mix design are listed in the Table 4.2. The compaction data is recorded during
the compaction as illustrated in Figure 4.2, the percentage of theoretical maximum specific
gravity (Gmm) is plotted versus gyration numbers. The testing sample compaction reduced the
gyrations according to the compaction curve when compacting to achieve 7% air void to mimic
the field air void immediately after the construction and as per standard practice. All the samples
experienced two hours aging at the compaction temperature before the compaction.

74
Figure 4.1 Gradation of Asphalt Mixture
Figure 4.2 Compaction Curve
Table 4.2 Optimum Asphalt Binder Content
NMAS Binder Content*
9.5mm 5.70%
25 mm 4.02%
(* binder content for both PG 64-22 and PG 76-22)
0.0%
20.0%
40.0%
60.0%
80.0%
100.0%P
ercen
t P
ass
ing
(%)
Aggregate Size (mm^0.45)
NMAS 9.5mm
NMAS 25mm
0.075 0.15 0.3 0.6 1.18 2.36 4.75 9.5 12.5 19 25
70
80
90
100
0 10 20 30 40 50 60 70 80
% G
mm
(%
)
Gyration (#)
%96Gmm or 4% AV
%93Gmm or 7% AV
Full
gyra
tion
s
Red
uce
d g
yra
tion
s

75
4.3.3 SC(B) test configuration
The SC(B) test configuration remains the same as in chapter two and three: SC(B) samples are
tested on a MTS load frame with a 5kip load cell, a clip gauge is attached to the bottom center of
the SC(B) to control the opening of the crack mouth. The same camera as preliminary research is
setup to capture the images of one surface of the sample for crack growth analysis. The images
captured are 18 megapixels, eight-bit monochrome grey scale, which means each pixel in the
image has a grey value that ranges from 0 to 28. For the tests at loading rate of 1.00mm/min, the
frame rate of 14 frame per second(fps) are applied, and a slower 0.2 fps is applied to the tests at
loading rate 0.03mm/min due to the ram memory of the equipment. The illumination of the
camera is improved by using two 60w, 60Hz LED bulbs, as shown in Figure 4.3. LED lights has
cold light that would not radiate and heat up the SC(B) sample, which can help with the sample
to remain at an even and constant temperature. A bulb level is used to ensure that the camera is
level every after it is disturbed.
Figure 4.3 SC(B) Test Configuration, Before(left) and After(right) Test

76
4.3.2 Sample fabrication description
The geometry of the SC(B) sample also remained the same as in chapter two and three. Samples
are cut from a 150mm gyratory compaction cylinder sample. The thickness of the sample is
25mm, and the notch is 1mm wide and 15mm deep at the bottom center of the sample. The only
difference in sample fabrication as preliminary research is the orientation of the sample. In the
preliminary research, samples are cut from three slices of the cylinder sample and then cut into
halves, thus the six samples have three orientations from the cylinder height. As the air voids
may vary in cylinder height, the SC(B) samples in preliminary research may have air void
variation because of the orientation of the sample. As shown in Figure 4.4, the samples discussed
in this chapter, are all cut from the middle height of the cylinder, so only one slice is cut from the
cylinder and the slide is cut into two SC(B) samples.
Figure 4.4 SC(B) Sample Fabrication
4.3.4 Dynamic modulus of the material in test matrix
4.3.4.1 Test configuration and sample preparation
In this chapter, the dynamic modulus in indirect tensile (IDT) mode (Kim et al. 2004) is tested
for the four type of HMA in the SC(B) experimental matrix: PG 76-22, NMAS 25mm; PG 76-
22, NMAS 9.5mm; PG 64-22, NMAS 25mm; PG 64-22, NMAS 9.5mm. The IDT samples are
tested under a MTS load frame with a 5kip load cell. Two pair of 38mm extensometers are
attached in two surface sides of the IDT sample to measure the vertical and horizontal strain.

77
Five testing temperature are selected: -24°C, -10°C, 4°C, 21°C, 37°C and 54°C; -24°C is selected
because of one of the SC(B) testing temperature is -24°C, and the other five temperatures are
from the specification of uniaxial dynamic modulus, AASHTO T 342. Five frequencies are
selected: 25Hz, 10 Hz, 5 Hz, 1 Hz, 0.5 Hz, and 0.1 Hz by following AAHTO T 342. The IDT
samples are cut from the gyratory cylinder sample. The samples are targeting 40mm thickness
slice orienting from the mid height of the cylinder sample. All the samples target 7% air void.
Figure 4.5 Dynamic Modulus in Indirect Tensile (IDT) Mode
4.3.4.2 Dynamic modulus master curve
At the testing temperature of 54°C, the strain level was not able to be controlled within the range
of linear elastic, or 50-150 micron even with extreme low load. Thus, the data collected at 54°C
are not applied to construct master curve. Besides, the data collected at 25Hz, and 10Hz are high
in error, so those data are not applied to construct master curve as well. The master curves of
dynamic modulus for the four mixtures are constructed by following AASHTO R62-13, using
Equation 4.1.1 to Equation 4.1.4. An improved method that restricts initial coefficient of
a1 and a2 is applied to construct rational smoother master curves. (Yang et al., 2015)
𝐥𝐨𝐠|𝑬∗| = 𝜹 +𝜶
𝟏+𝒆𝜷+𝜸𝐥𝐨𝐠 (𝒇𝒓) Equation 4.1
𝒇𝒓 = 𝒇 × 𝒂𝑻 Equation 4.2

78
𝒍𝒐𝒈𝒂𝑻 = 𝒂𝟏(𝑻𝑹 − 𝑻)𝟐 + 𝒂𝟐(𝑻𝑹 − 𝑻) Equation 4.3
𝑺𝑺𝑬 = ∑ (𝐥𝐨𝐠|�̂�∗|𝒊
− 𝐥𝐨𝐠|𝑬∗|𝒊)𝟐𝑵
𝒊=𝟏 Equation 4.4
Where;
|𝐸∗|𝑖 = average measured dynamic modulus for each testing temperature and testing frequency
combination, i, Mpa,
|�̂�∗|𝑖 = predicted dynamic modulus by Equation 4.1 for each testing temperature and testing
frequency combination, i, Mpa,
N = total number of testing temperature and frequency combination,
SSE = square sum of error between measured and predicted dynamic modulus, and
𝛼, 𝛽, 𝛾, 𝑎1, 𝑎2 = coefficient for best fitted curve in order to have lowest SSE.
The master curves for the four types of mixtures, NMAS9.5mm, PG 64-22; NMAS9.5mm, PG
76-22; NMAS25mm, PG 64-22; NMAS25mm, PG 76-22; are illustrated in Figure 4.6 a-d.

79
(a) (b)
(c) (d)
*SSE = sum of square error; TR = reference temperature in °C
Figure 4.6 Master Curves of Mixture with: (a) NMAS 9.5mm, PG 64-22; (b) NMAS 9.5mm,
PG 76-22; (c) NMAS 25mm, PG 64-22; (d) NMAS 25mm, PG 76-22
In order to have a clear view that how the dynamic modulus varies among these four mixtures,
these four master curves are plotted in Figure 4.7. As can be seen in the upper right corner of
Figure 4.7, the modulus of the two mixtures with the NMAS25mm is higher than the other two
mixtures with the NMAS9.5mm, while the difference in modulus between PG 76-22 and PG 64-
22 are much smaller. In other words, at low temperature or high frequency, mixtures with
NMAS25mm observed higher modulus than mixtures with NMAS9.5mm, while the binder PG
76-22 and PG 64-22 do not differentiate the modulus at low temperature. This trend is as
expected because larger aggregate size is expected to lead to be tougher in modulus. And the
100
1000
10000
100000
1.00E-04 1.00E+00 1.00E+04 1.00E+08 1.00E+12
|E*
|( M
pa
)
Reduced Frequency
-24°C
-10°C
4.4°C
21.1°C
37.8°C
Master Curve
100
1000
10000
100000
1.00E-04 1.00E+00 1.00E+04 1.00E+08 1.00E+12
|E*
|( M
pa
)
Reduced Frequency (Hz)
-24°C
-10°C
4.4°C
21.1°C
37.8°C
Master Curve
100
1000
10000
100000
1.00E-04 1.00E+00 1.00E+04 1.00E+08 1.00E+12
|E*
|( M
pa
)
Reduced Frequency
-24°C
-10°C
4.4°C
21.1°C
37.8°C
Master Curve
100
1000
10000
100000
1.00E-04 1.00E+00 1.00E+04 1.00E+08 1.00E+12
|E*
|( M
pa
)
Reduced Frequency
-24°C
-10°C
4.4°C
21.1°C
37.8°C
Master Curve
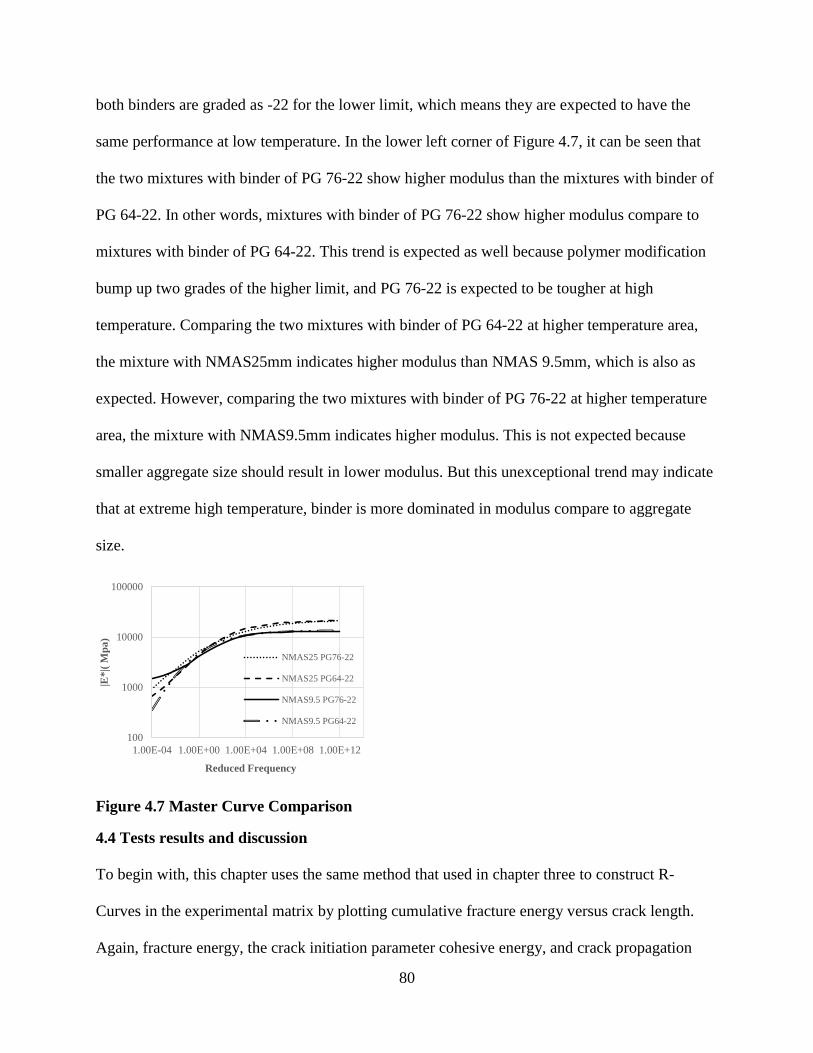
80
both binders are graded as -22 for the lower limit, which means they are expected to have the
same performance at low temperature. In the lower left corner of Figure 4.7, it can be seen that
the two mixtures with binder of PG 76-22 show higher modulus than the mixtures with binder of
PG 64-22. In other words, mixtures with binder of PG 76-22 show higher modulus compare to
mixtures with binder of PG 64-22. This trend is expected as well because polymer modification
bump up two grades of the higher limit, and PG 76-22 is expected to be tougher at high
temperature. Comparing the two mixtures with binder of PG 64-22 at higher temperature area,
the mixture with NMAS25mm indicates higher modulus than NMAS 9.5mm, which is also as
expected. However, comparing the two mixtures with binder of PG 76-22 at higher temperature
area, the mixture with NMAS9.5mm indicates higher modulus. This is not expected because
smaller aggregate size should result in lower modulus. But this unexceptional trend may indicate
that at extreme high temperature, binder is more dominated in modulus compare to aggregate
size.
Figure 4.7 Master Curve Comparison
4.4 Tests results and discussion
To begin with, this chapter uses the same method that used in chapter three to construct R-
Curves in the experimental matrix by plotting cumulative fracture energy versus crack length.
Again, fracture energy, the crack initiation parameter cohesive energy, and crack propagation
100
1000
10000
100000
1.00E-04 1.00E+00 1.00E+04 1.00E+08 1.00E+12
|E*
|( M
pa
)
Reduced Frequency
NMAS25 PG76-22
NMAS25 PG64-22
NMAS9.5 PG76-22
NMAS9.5 PG64-22

81
parameter energy rate are extracted from the R-Curve to be analyzed. After that a new method to
quantify the crack growth is developed to construct R-Curve, the energy rate data is analyzed
again by using the new crack growth quantification. Finally, the creep damage in SC(B) test is
discussed, and the dynamic modulus data is analyzed.
4.4.1 Fracture energy, cohesive energy and energy rate
SC(B) tests discussed in this chapter are performed at three testing temperatures: -24°C, 0°C,
24°C. However, it is found that, the tests performed at 24°C cannot be defined as fracture tests as
crack cannot be detected in many of the tests while significant creep damage can be seen in the
sample. This chapter will discuss the results of SC(B) tests at 24°C in section 4.4.3. This section
only covers the results at the temperature of -24°C, and 0°C. These results are summarized in
Table 4.3. Figure 4.8 illustrates a group of sample R-Curves for 25mm, PG 64-22 HMA at the
loading rate of 0.03mm/min, with four replicates and the average R-Curve.
Figure 4.8 Sample R-Curves for 25mm, PG 64-22 HMA, at loading rate of 0.03mm/min
0
200
400
600
800
1000
1200
1400
1600
0 5 10 15 20 25 30 35 40Cu
mu
lati
ve F
ra
ctu
re E
nerg
y (
J/m
2)
Crack Length Extention (mm)
Replicate 1 Replicate 2Replicate 3 Replicate 4Average Curve

82
Table 4.3 Summary of Chapter 4’s Test Results
Binder
Grade NMAS Temp.
Loading
Rate F.E.*
COV*
of F.E. C.E.*
COV
of C. E. E. R.*
COV
of E. R.
°C mm/min J/m2 % J/m2 % J/m3 %
64-22 9.5 -24 0.03 357.5 11.6 342.8 11.8 0.4 98.3
1.00 409.8 43.0 290.6 22.1 0.6 173.2
0 0.03 981.2 12.8 630.3 19.1 9.9 42.9
1.00 539.3 20.0 484.5 17.1 1.3 93.8
25 -24 0.03 461.4 40.4 326.6 67.9 2.3 268.0
1.00 393.0 27.0 393.0 27.0 0.0 N/A
0 0.03 1053.9 44.9 820.9 45.7 7.7 72.5
1.00 575.3 52.6 511.1 55.4 2.1 158.9
76-22 9.5 -24 0.03 352.0 13.4 338.3 13.3 0.4 58.0
1.00 523.5 13.6 521.6 14.3 0.0 200.0
0 0.03 806.8 26.1 658.4 26.8 26.8 7.5
1.00 860.5 8.5 786.4 8.5 2.1 37.8
25 -24 0.03 507.9 29.1 484.7 34.1 0.6 214.4
1.00 256.6 20.0 256.6 20.0 0.0 N/A
0 0.03 882.6 37.5 620.9 54.8 9.1 41.7
1.00 1079.9 28.0 907.8 27.1 5.9 57.8
* F.E. = fracture energy
C.E. = cohesive energy
E. R. = energy rate
COV = coefficient of variance
Due to the heterogeneous characterization, the coefficient of variance (COV) for some of the
results are very high, an analysis of variance (ANOVA) is performed to test the hypothesis
whether the factors of binder grade, NMAS, temperature or loading rate is statistically significant
on COV with a 95% confidence. As seen in Table 4.4, it is found that there are five p-values are
under 0.05: factor of temperature on COV of energy rate; factor of NMAS on COV of fracture
energy, COV of cohesive energy, and COV of energy rate; factor of loading rate on COV of
energy rate. In other words, testing temperature be the reason to increase the heterogeneous on
crack growth, however, it is not the reason to increase the heterogamous on fracture energy or
cohesive energy. This is reasonable: asphalt concrete becomes more brittle and less viscous as
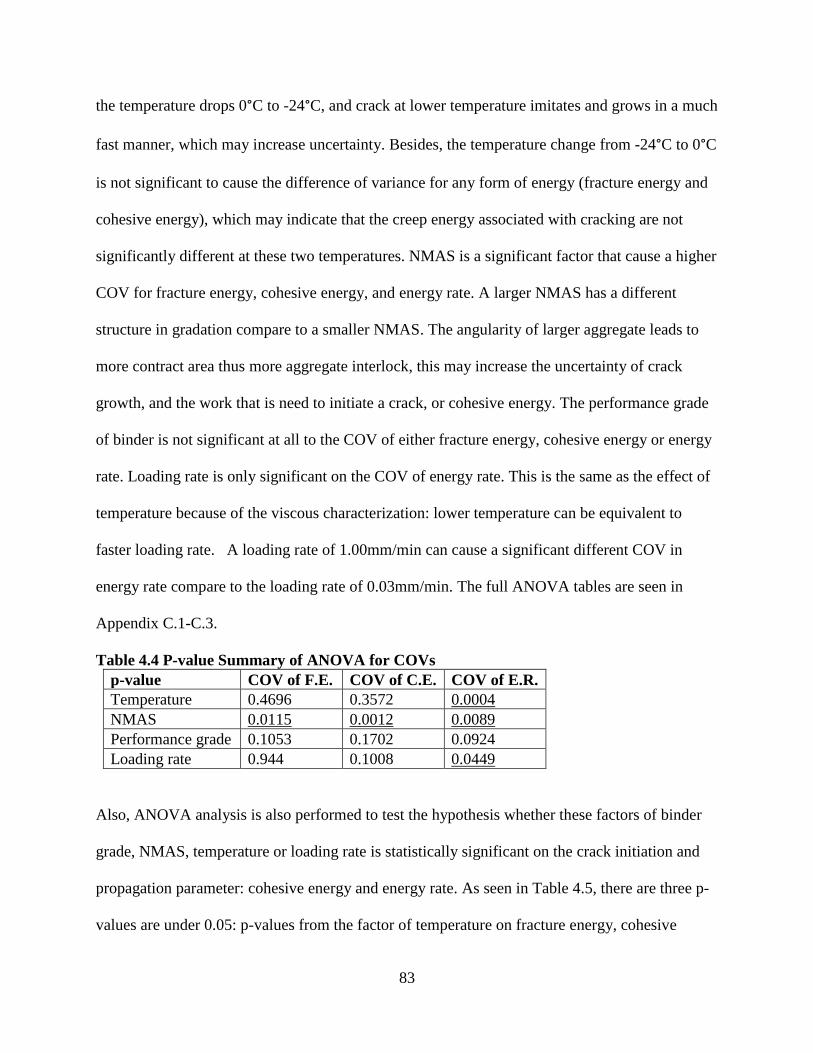
83
the temperature drops 0°C to -24°C, and crack at lower temperature imitates and grows in a much
fast manner, which may increase uncertainty. Besides, the temperature change from -24°C to 0°C
is not significant to cause the difference of variance for any form of energy (fracture energy and
cohesive energy), which may indicate that the creep energy associated with cracking are not
significantly different at these two temperatures. NMAS is a significant factor that cause a higher
COV for fracture energy, cohesive energy, and energy rate. A larger NMAS has a different
structure in gradation compare to a smaller NMAS. The angularity of larger aggregate leads to
more contract area thus more aggregate interlock, this may increase the uncertainty of crack
growth, and the work that is need to initiate a crack, or cohesive energy. The performance grade
of binder is not significant at all to the COV of either fracture energy, cohesive energy or energy
rate. Loading rate is only significant on the COV of energy rate. This is the same as the effect of
temperature because of the viscous characterization: lower temperature can be equivalent to
faster loading rate. A loading rate of 1.00mm/min can cause a significant different COV in
energy rate compare to the loading rate of 0.03mm/min. The full ANOVA tables are seen in
Appendix C.1-C.3.
Table 4.4 P-value Summary of ANOVA for COVs
p-value COV of F.E. COV of C.E. COV of E.R.
Temperature 0.4696 0.3572 0.0004
NMAS 0.0115 0.0012 0.0089
Performance grade 0.1053 0.1702 0.0924
Loading rate 0.944 0.1008 0.0449
Also, ANOVA analysis is also performed to test the hypothesis whether these factors of binder
grade, NMAS, temperature or loading rate is statistically significant on the crack initiation and
propagation parameter: cohesive energy and energy rate. As seen in Table 4.5, there are three p-
values are under 0.05: p-values from the factor of temperature on fracture energy, cohesive
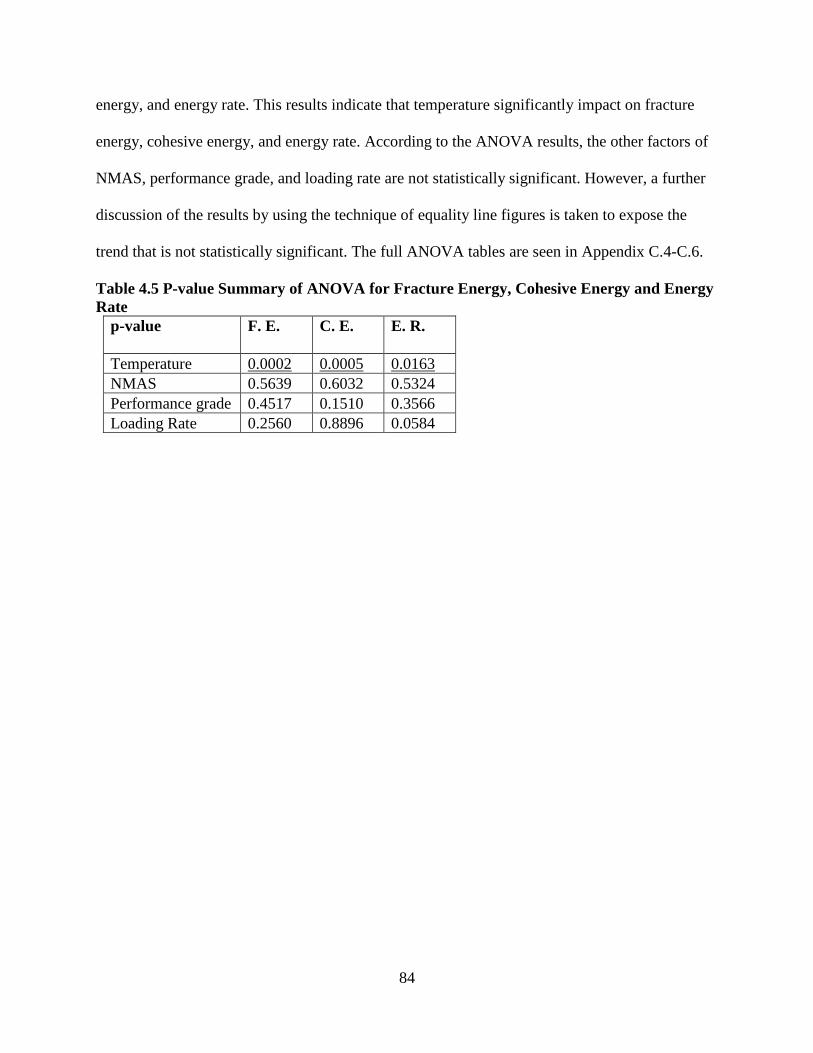
84
energy, and energy rate. This results indicate that temperature significantly impact on fracture
energy, cohesive energy, and energy rate. According to the ANOVA results, the other factors of
NMAS, performance grade, and loading rate are not statistically significant. However, a further
discussion of the results by using the technique of equality line figures is taken to expose the
trend that is not statistically significant. The full ANOVA tables are seen in Appendix C.4-C.6.
Table 4.5 P-value Summary of ANOVA for Fracture Energy, Cohesive Energy and Energy
Rate
p-value F. E. C. E. E. R.
Temperature 0.0002 0.0005 0.0163
NMAS 0.5639 0.6032 0.5324
Performance grade 0.4517 0.1510 0.3566
Loading Rate 0.2560 0.8896 0.0584

85
4.4.1.1 Effect of performance grade of binder
According to the statistical analysis, the performance grade of binder is not significant to impact
on the fracture energy, cohesive energy and energy rate. The equality line figures are plotted to
check if there is any trend can be found. Take Figure 4.9(a) as an example, each point has an x-
axis value of fracture energy for PG 64-22 binder, versus a y-value of fracture energy for PG 76-
22 binder. All the other variables rather than binder type are fixed for each point. Thus, if the
point falls below the equality line, the fracture energy of the PG 64-22 binder sample is higher;
whereas if the point is above the equality line, the fracture energy of PG 76-22 binder sample is
higher. In Figure 4.9(a), four points are above the equality line, three points are below while one
point is close to the equality line. This result agrees with the ANOVA result, there is not a
significant difference found between these two binders in fracture energy. Take a further look at
the cohesive energy in Figure 4.9(b), there are less points fall below the equality line, which may
indicate that the effect of the performance grade is stronger in impacting cohesive energy rather
than fracture energy. The impaction of performance grade is not stronger in energy rate as seen
in Figure 4.9(c). Noticed that these two type of binder are all graded to -22 for the lower limit in
PG, and these SC(B) tests are all performed at low temperature of -24°C or 0°C. PG 76-22 and
PG 64-22 are graded different at the high limit due to the polymer modification for the high
temperature performance improvement such as rutting resistance, however, a slight effect of
polymer modification on cohesive energy is detected. Five out of eight cases observed increase
in cohesive energy. This is not statistically proved, but the sampling size in this research is
relatively small, it is recommended to increase the statistical sample size in the future work. In
summary, the polymer modification may have effect on cohesive energy despite the lower limit
of the PG remains the same, but further research needs to be performed to verify.

86
(a) (b)
(c)
Figure 4.9 Effect of Performance Grade on Fracture Energy (a), Cohesive Energy (b), and
Energy Rate (c)
0
200
400
600
800
1000
1200
0 200 400 600 800 1000 1200
Fra
ctu
re E
nerg
y(J
/m2, P
G 7
6-2
2)
Fracture Energy(J/m2, PG 64-22)
0
5
10
15
20
25
30
0 5 10 15 20 25 30
En
erg
y R
ate
(J
/m3,
PG
76
-22
)
Energy Rate (J/m3, PG 64-22)
0
200
400
600
800
1000
1200
0 200 400 600 800 1000 1200
Co
hesi
ve E
nerg
y(J
/m2
, P
G 7
6-2
2)
Cohesive Energy(J/m2, PG 64-22)

87
4.4.1.2 Effect of NMAS
The equality line figures are applied to detect the effect of NMAS on fracture energy, cohesive
energy and energy rate. As seen in Figure 4.10(a), six out of eight points are above the equality
line, which means in most of the cases, bigger NMAS 25mm results in higher fracture energy
than NMAS 9.5mm. This trend does not change much on cohesive energy, most of the five
points out of eight are above the equality line while two points are close the line. Figure 4.10(c)
shows the effect of NMAS on energy rate. In this figure, there is one point far away from all the
other points. This point is the case of NMAS 9.5mm, PG 76-22, and loading rate 0.03mm/min. If
taken this point out, for NMAS 9.5mm six out of eight points have the energy rate range from 0
to 2.1 J/m3, and one point has the energy rate of 9.9J/m3, whereas there are five out of eight
points have the energy rate range from 2.1 J/m3 to 9.1 J/m3. Although this is not proved by
ANOVA, the equality line figure indicates that NMAS 25mm may lead to higher energy rate. In
summary, NMAS 25mm indicates higher fracture energy, higher cohesive energy and higher
energy rate in general. However, this conclusion needs to be verified with a larger amount of
experiment.

88
(a) (b)
(c)
Figure 4.10 Effects of NMAS on Fracture Energy (a), Cohesive Energy (b), and Energy
Rate (c)
0
200
400
600
800
1000
1200
0 200 400 600 800 1000 1200
Fra
ctu
re E
nerg
y(J
/m2, N
MA
S2
5m
m)
Fracture Energy(J/m2, NMAS9.5mm)
0
5
10
15
20
25
30
0 5 10 15 20 25 30
En
erg
y R
ate
(J
/m3,
NM
AS
25
mm
)
Energy Rate (J/m3, NMAS9.5mm)
0
200
400
600
800
1000
1200
0 200 400 600 800 1000 1200
Co
hesi
ve E
nerg
y(J
/m2, N
MA
S2
5m
m)
Cohesive Energy(J/m2, NMAS9.5mm)

89
4.4.1.2 Effect of testing temperature
The trend of effect of testing temperature is highly agreed with ANOVA: effect of testing
temperature is significant on fracture energy, cohesive energy and energy rate. At the testing
temperature of 0°C, fracture energy, cohesive energy and energy rate are always higher than they
are at the testing temperature of -24°C. This can be a proof that at higher testing temperature, the
total work may contain more creep dissipated energy. In this research, SC(B) tests are also
performed at 24°C. In most of those cases, crack cannot even be detected, because the work
applied on the sample may be totally used to create creep damage rather than crack. This will be
discussed later but it is also a proof that as the testing temperature increase, there are more creep
dissipated energy associated with the fracture.
In addition, as seen in Figure 4.11(c), most of the points are above the equality line and closer to
the y-axis. Compared to Figure 4.11(a) and (b), in Figure 4.11 (c), the y-axis values at 0°C, is
even more significantly higher than the x-axis value -24°C. This indicates that once the crack
initiated, it consumes every small amount of energy to grow the crack, or the crack grows very
fast after the initiation, most of the extern work applied on the sample dissipates into the
cohesive energy. In other words, testing temperature has a larger impaction on crack
propagation than crack initiation.
Still, these extractions (fracture energy, cohesive energy and energy rate) from R-Curve cannot
separate the elastic portion, or recoverable strain energy, and viscous portion, or creep strain
energy, from the fracture energy. But there is a trend of viscous portion increasing detected when
testing temperature increases. Besides, this viscous portion increment may associate with crack

90
propagation more than crack initiation, because testing temperature has a larger impaction on
crack propagation than crack initiation.
In summary, testing temperature significantly impacts on fracture energy, cohesive energy and
energy rate. Higher testing temperature results in higher creep energy associated with fracture,
and this higher creep energy associated with crack propagation more than crack initiation. Again,
this finding needs to be verified with a large amount of experiment.

91
(a) (b)
(c)
Figure 4.11 Effect of temperature on Fracture Energy (a), Cohesive Energy (b), and
Energy Rate (c)
4.4.1.2 Effect of loading rate
The effect of loading rate may interact with the effect of testing temperature due to the
viscoelastic behavior of asphalt concrete, or the equivalency between temperature and loading
rate. As seen in Figure 4.12, the trend is not as clear as it is in Figure 4.11. In Figure 4.12 (a)-(b),
0
200
400
600
800
1000
1200
0 200 400 600 800 1000 1200
Fra
ctu
re E
nerg
y(J
/m2, 0
°C)
Fracture Energy(J/m2, -24°C)
0
2
4
6
8
10
0 2 4 6 8 10
En
erg
y R
ate
(J
/m3,
0°C
)
Energy Rate (J/m3, -24°C)
0
200
400
600
800
1000
1200
0 200 400 600 800 1000 1200
Co
hesi
ve E
nerg
y(J
/m2, 0
°C)
Cohesieve Energy(J/m2, -24°C)

92
half of the points are above the equality line and half of the points are below the equality line.
The effects of the loading rate on fracture energy and cohesive energy are hidden in equality line
figures due to the interaction of temperature and loading rate. However, the trend of effect on
energy rate is clear: Loading rate of 0.03mm/min results in higher energy rate. In other words, if
the crack propagates slower, the crack growth consumes more external work. The same trend can
be found in Figure 4.8(c): crack growth consumes more external work at higher testing
temperature.
It is interesting to see that although the effects of fracture energy and cohesive energy can be
hidden by equality line in Figure 4.12 (a)-(b), this effect of loading rate on energy rate is so
strong and cannot be hidden because of the interaction. Due to the equivalency of temperature
and loading rate at some extends, this is another prove that viscous portion energy associates
with crack propagation more than crack initiation.

93
(a) (b)
(c)
Figure 4.12 Effect of Loading Rate on Fracture Energy (a), Cohesive Energy (b), and
Energy Rate (c)
4.4.2 Crack extension analysis
Before this point, all the crack extension discussed in this research is the extension in length. As
discussed before, energy rate, which is highly related to crack extension, did not differentiate the
effect of NMAS and binder type. This is not as expected. A potential reason might be the
0
200
400
600
800
1000
1200
0 200 400 600 800 1000 1200
Fra
ctu
re E
nerg
y(J
/m2
, 1
.00
mm
/min
)
Fracture Energy(J/m2, 0.03mm/min)
0
5
10
15
20
25
30
0 5 10 15 20 25 30
En
erg
y R
ate
(J
/m3
, 1
.00
mm
/min
)
Energy Rate (J/m3, 0.03mm/min)
0
200
400
600
800
1000
1200
0 200 400 600 800 1000 1200
Co
hesi
ve E
nerg
y(J
/m2
, 1
.00
mm
/min
)
Cohesive Energy(J/m2, 0.03mm/min)
94
measure of the crack extension. The crack growth in asphalt concrete or any other material can
be complex. As illustrated in Figure 4.13, the crack grows from the beginning of arrow one to the
end of arrow one, and then it stops growing from the end of arrow one but start to grow from the
beginning of arrow two to the end of arrow two. After that, two cracks connect to each other at
the location of arrow three. In this case, the length of crack is hard to be defined. In all this
research, the crack is defined as the length from the crack tip to the notch tip. This may not be
enough to fully quantify the crack extension because crack can open in width plus crack can have
branches. As crack extension is one out of two components in the R-Curve, it is important to
improve the definition of crack extension. Thanks to the image analysis, crack extension can
also be defined as the crack area extension for two reasons: first, crack area can quantify the
crack extension not only in length extend but also in width open; second, no matter how complex
the crack pattern is, the definition of the crack area is much easier than crack length. The crack
area is very practicable in image analysis. The following paragraph will discuss the development
of quantification of crack area by image analysis. Notice that this is an attempt to explore
appropriate crack extension, the result is preliminary.
Figure 4.13 Crack Growth in Asphalt Concrete

95
The initial procedure to capture crack area extension in images includes three steps: first, as
illustrated in Figure 4.14, establish an optimal static threshold value to isolate the crack in each
image; second, count the number of pixels of isolated crack and compare with the reference
image to capture the change; third, convert pixel into square millimeter.
Figure 4.14 Isolation of Crack by Threshold Value
Figure 4.15 Example Histogram of One SC(B) Test Image
This method can capture the crack area extension when the crack is relatively large in size.
However, when the crack is tiny at low testing temperature, there is difficulty to find out a static
threshold value. Thus, another dynamic method is developed by using the histogram of the
collected images. As shown in Figure 4.15 a histogram of an image counts the numbers of pixel
0
5000
10000
15000
20000
25000
30000
1
10
19
28
37
46
55
64
73
82
91
10
0
10
9
11
8
12
7
13
6
14
5
15
4
16
3
17
2
18
1
19
0
19
9
20
8
21
7
22
6
23
5
24
4
25
3
Nu
mb
er o
f P
ixels
(#
)
Grey Scale Value

96
at each grey scale value. The camera used in this research is an eight-bit image depth, which
means each pixel has 256 possible grey scale values. Thus, the x-axis in this histogram ranges
from 0 to 256. This method follows five steps and calculated in Matlab®:
1. Calculate the histogram for each image in one SC(B) test;
2. Compare the histogram of each image with the reference image;
3. Find out the maximum change of the pixel numbers at one out of 256 grey scale values;
4. Use the maximum change of pixel numbers at one grey scale value as the crack area in
current image;
5. Convert the pixel into square millimeter.
Figure 4.16 shows two examples of the crack area extension. The left figure captures the crack
area extension by the images collected at a frame rate of 0.2fps, whereas the right figure is the
crack area extension by the images collected at 10fps. The right figure has much lower noise
compare to the left one. The cause of the higher noise in left figure can be the lower frame, and
the frequency of the LED light. It can be seen that the noise in left figure occurs in a regular pace
overtime. This method can be improved by using a continual illumination and faster frame rate.
In addition, the image resolution in this research is 18 megapixels, and there is more than 100
pixels in 1mm2. This image resolution is sufficient to capture cracks in asphalt concrete, but
improvement in grey scale depth may increase the accuracy of the analysis. However, the current
captured crack area extension can still be valuable to construct R-Curves. The energy rate in the
test matrix is updated by using the crack area extension as shown in Figure 4.17, the trend didn’t
change as the old figures that use crack length as extension.
97
(a) 0.2fps (b) 10fps
Figure 4.16 Example Crack Area Extension
0
100
200
300
400
500
0 2 4 6 8 10
Cra
ck A
rea
(m
m2)
Time (sec)
0
100
200
300
400
500
0 50 100 150 200 250 300
Cra
ck
Area
(m
m2)
Time (sec)
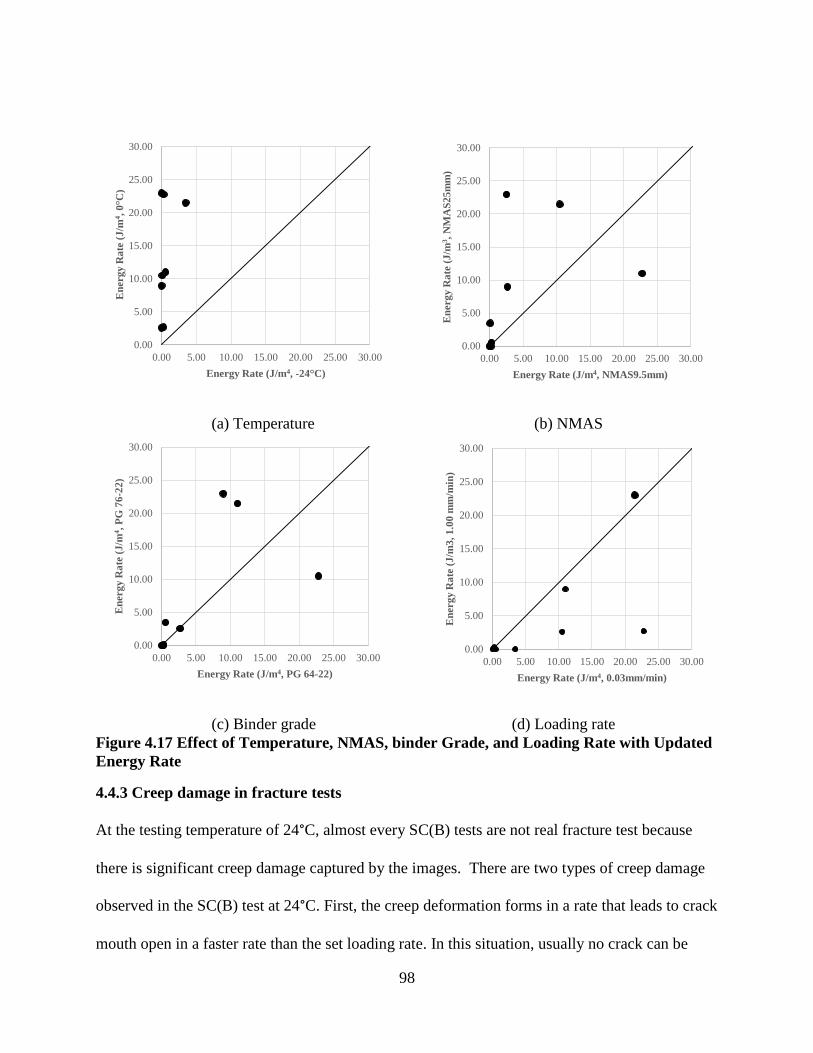
98
(a) Temperature (b) NMAS
(c) Binder grade (d) Loading rate
Figure 4.17 Effect of Temperature, NMAS, binder Grade, and Loading Rate with Updated
Energy Rate
4.4.3 Creep damage in fracture tests
At the testing temperature of 24°C, almost every SC(B) tests are not real fracture test because
there is significant creep damage captured by the images. There are two types of creep damage
observed in the SC(B) test at 24°C. First, the creep deformation forms in a rate that leads to crack
mouth open in a faster rate than the set loading rate. In this situation, usually no crack can be
0.00
5.00
10.00
15.00
20.00
25.00
30.00
0.00 5.00 10.00 15.00 20.00 25.00 30.00
En
erg
y R
ate
(J
/m4,
0°C
)
Energy Rate (J/m4, -24°C)
0.00
5.00
10.00
15.00
20.00
25.00
30.00
0.00 5.00 10.00 15.00 20.00 25.00 30.00
En
erg
y R
ate
(J
/m4,
PG
76
-22
)
Energy Rate (J/m4, PG 64-22)
0.00
5.00
10.00
15.00
20.00
25.00
30.00
0.00 5.00 10.00 15.00 20.00 25.00 30.00
En
erg
y R
ate
(J
/m3,
NM
AS
25
mm
)
Energy Rate (J/m4, NMAS9.5mm)
0.00
5.00
10.00
15.00
20.00
25.00
30.00
0.00 5.00 10.00 15.00 20.00 25.00 30.00
En
erg
y R
ate
(J
/m3
, 1
.00
mm
/min
)
Energy Rate (J/m4, 0.03mm/min)

99
observed in the sample. This type of creep damage usually occurs at the loading rate of
0.03mm/min. The second type of creep damage is shown as in the Figure 4.18, the crack does
not initiate form the notch tip, which means that the stress does not concentrate on the notch tip.
The external work applied dominantly deforms the sample as permanent creep damage rather
than create crack.
Figure 4.18 Creep Damage in SC(B) Test at 24°C, 1.00mm/min, NMAS 25mm, PG 76-22
4.5 Summary and chapter conclusion
In this chapter, the SC(B) tests are performed with the new designed experimental matrix to
differentiate the crack characterization between materials. The factors of testing temperature,
loading rate (0.3 mm/min and 1.0 mm/min), performance grade of binder (PG 64-22 and PG 76-
22), and NMAS (9.5 mm and 25 mm) are considered in the experimental matrix. A clearer trend
was found compare to chapter three. A new method of crack extension quantification using
crack area is initially developed. The propagation parameter energy rate is updated by using the
crack area extension. The following conclusions can be made based on the results analysis:
Polymer modification may effect on crack initiation parameters of cohesive energy
despite the lower limit of the PG remains the same;

100
NMAS 25mm indicates higher fracture energy, higher cohesive energy and higher energy
rate in general;
The R-Curve results regarding binder type and NMAS does not completely agree with
the dynamic modulus results, which reinforce that there are significant benefits to have
both dynamic modulus and a form of cracking test to fully understand asphalt concrete;
Testing temperature significantly impacts on fracture energy, cohesive energy and energy
rate. Higher testing temperature results in higher creep energy associated with fracture,
and this higher creep energy associated with crack propagation more than crack initiation.
Loading rate of 0.03mm/min results in higher energy rate. Slow crack propagation
consumes more external work;
Crack area is an alternative of creak length to quantify the crack extension in R-Curve;
Significant creep strain energy and creep damage increases as testing temperature
increases. Fracture tests for R-Curve construction are suggested to be performed at low
temperature rather than ambient temperature.
The above conclusions are made based on the results of ninety-six SC(B) tests, a further larger
amount of tests are suggested to be performed to prove those conclusions. These conclusions
suggest that R-Curve in asphalt concrete provided information of fracture behavior in terms of
crack initiation and prorogation. The quantification of crack initiation and propagation can
benefit the understanding the fracture mechanism in asphalt concrete.

101
4.6 Reference
Faruk, Abu N. M., Xiaodi Hu, Yuly Lopez, and Lubinda F. Walubita. "Using the Fracture
Energy Index Concept to Characterize the Hma Cracking Resistance Potential under
Monotonic Crack Testing." International Journal of Pavement Research and Technology
7, no. 1 (2014): 40-48.
Li, Xue, and Mihai O. Marasteanu. "Cohesive Modeling of Fracture in Asphalt Mixtures at Low
Temperatures." International Journal of Fracture 136, no. 1-4 (2005): 285-308.
Wu, Zhong, Louay N. Mohammad, L. B. Wang, and Mary Ann Mull. "Fracture Resistance
Characterization of Superpave Mixtures Using the Semi-Circular Bending Test." Journal
of ASTM International 2, no. 3 (2005): 135-49.
Yang, Shu, and Braham, Andrew, Underwood, Shane., Hanz, Andrew., and Reinke, Gerald.
"Correlating Field Performance to Laboratory Dynamic Modulus from Indirect Tension
and Torsion Bar" Accepted by Journal of the Association of Asphalt Paving
Technologists 2015

102
Chapter 5 Conclusions and Recommendations
5.1 Review of chapter objectives
Cracking, one of the most common types of distress in asphalt concrete, has been studied
extensively both empirically and mechanistically. In recent years, fracture theory has emerged as
one of the most promising paths to explore cracking behavior in the laboratory. However, most
of the fracture theory research has focused on using a single number to quantify the fracture
resistance of asphalt concrete--most frequently either the stress intensity factor, the fracture
energy, or the J-Integral. An innovative method of quantifying the crack initiation and
propagation was explored in the study, the method of Resistance Curve, or R-Curve. R-Curve is
widely used in other materials, but was hardly found in asphalt concrete literature. This
dissertation reviewed in depth the R-Curve application in many other materials to discover the
benefits and challenges of utilizing R-Curve, methods of applying R-Curve, and analyzing R-
Curve results. In order to fully explore the concept of R-Curve, first, the fracture energy of an
asphalt concrete mixture modified with Recycled Asphalt Pavement (RAP) and Warm Mix
Asphalt (WMA) additives was explored at multiple aging and moisture conditioning levels. This
provided a base understanding of current fracture theory of a set of asphalt concrete mixtures and
conditions. Second, R-Curve analysis techniques were applied to the same material, and
preliminary findings concluded that R-Curve gave detailed information on crack initiation and
propagation. Finally, a new test matrix exploring the effect of testing temperature, Nominal
Maximum Aggregate Size (NMAS), binder grade, and loading rate was designed to explore the
envelope of the R-Curve in asphalt concrete.
103
5.2 Conclusions
The first objective of this dissertation was to review the application of R-Curve in other
materials. The general history of research in fracture of asphalt concrete was investigated. The
research of fracture in asphalt concrete developed from empirical method to mechanical method
in general. The history of fracture mechanics was also reviewed: linear elastic fracture
mechanics, plastic-elastic fracture mechanics, and time-dependent fracture mechanics. In the
application of fracture mechanics, the linear elastic theory was first applied in asphalt concrete,
which simplified the material as a linear elastic material. Then, research of the nonlinear theory
started to dominate the investigation of fracture in asphalt concrete, especially, the energy
criterion: fracture energy was widely used as a quantitative of the fracture resistance of asphalt
concrete. The R-Curve method looks at the fracture resistance in the view of energy criterion,
which is widely applied in many materials but not asphalt concrete. Overall, the first object was
met, and the need for research of R-Curve in asphalt concrete was established.
The second objective was the investigation of the current widely used fracture energy and
viscoelastic analysis with dynamic modulus. This investigation was designed to evaluate the
advantage and limitation of the application of fracture energy. In chapter two, the discussion of
fracture energy is based on the SC(B) test on asphalt concrete. Fracture energy was used to
quantify the fracture resistance performance. RAP usage, warm mix technology application,
aging, and moisture were considered to address the concern in industry and academia. It was
found that fracture energy as a single number can give direct simple information about fracture
resistance; however, fracture energy may not be able to differentiate the fracture resistance of
different materials. Also, as a single number, it cannot include the quantification of crack

104
initiation and propagation, which may be the reason this single number cannot differentiate the
fracture resistance of different material. The experimental matrix considered the factors of RAP
(0% and 25% RAP), aging (short term and long term aging per AASHTO R 30), and moisture
(conditioned and unconditioned per AASHTO T 283), which could potentially change the
mechanical behavior of the material, including fracture energy. In summary, the conclusions of
the second objective were:
Fracture energy was not able to always differentiate the cracking resistance performance
of material among asphalt concrete without RAP, asphalt concrete with RAP, and warm
mix asphalt with RAP.
Moisture conditioned samples tended to have flatter dynamic modulus master curves,
indicating that they become stiffer more quickly as temperature decreases versus
unconditioned samples.
After long term aging, all three asphalt concrete mixtures perform in a similar manner in
dynamic modulus.
The statistical analysis shows that WMA and RAP application results in a significantly
different dynamic modulus at -10°C, but there is no significant difference at higher
temperature. The effect of aging and moisture makes no significant difference to WMA
and WR compared to HMA.
Warm Mix Asphalt with RAP has similar compaction characteristics as Hot Mix Asphalt
with RAP but at lower production and construction temperatures and 0.46% lower binder
content. This lower asphalt binder content could lead to significant cost savings for the
roadway owners without compromising performance.

105
The third objective was the construction and evaluation of R-Curves for the same material testing
in the second objective. This objective was met as the R-Curve was successfully constructed for
asphalt concrete in three mixture types, three aging levels, and two moisture condition levels. In
addition to comparing the general shape of the R-Curve, parameters were developed by
extracting information from the R-Curve including cohesive energy (theoretical crack initiation)
and energy rate (theoretical crack propagation). R-Curve quantified the effect of aging and
moisture on crack propagation as expected. Overall, the third objective was partially met by
finding of cohesive energy and energy rate from the R-Curve. However, it was not clearly
determined which factor affects the cohesive energy measurement. The same limitation as the
second objective, the usage of RAP, aging and moisture may increase the variation and
uncertainty, which may obscure the proper evaluation of the application of R-Curve of asphalt
concrete. In summary, the conclusions of the third objective were:
RAP can reduce the resistance to crack propagation of hot mix, while warm mix may
improve the resistance when using RAP.
Moisture conditioning does not impact the crack initiation but reduces the ability to resist
crack propagation.
Short term aging does not impact the ability to resist crack initiation but reduces the
resistance to crack growth.
The long term aging reduces the general fracture energy, cohesive energy and energy
rate.
The R-Curve analyzed results and the statistical result proved that R-Curve is an effective
tool that can characterize the cracking behavior in asphalt concrete in both crack
initiation and propagation.

106
The fourth objective was a further investigation of R-Curve in asphalt concrete. Due to the
limitations caused by the existing externally imposed experimental matrix in the third objective,
a new test matrix was designed to differentiate the material with the internal factors that
dominate the material property: NMAS and binder type; and external factors that impact
asphalt concrete behavior: temperature and loading rate. Overall, a clearer trend of R-Curve was
found in this objective than in the third objective. The factors that have an impact on cohesive
energy measurement were found to be testing temperature and NMAS. The dynamic modulus
results does not completely agree with the R-Curve results, which indicates there are benefits to
involve both dynamic modulus and R-Curve to fully understand asphalt concrete. In addition,
these studies of R-Curve proved the existence of creep energy associated with the fracture, and
that temperature is a significant factor that impacts the amount of creep damage associated with
fracture. Because of the finding of creep damage, this objective was definitive that “cumulative
fracture energy” as the fracture resistance may not be the most accurate quantification of
cracking behavior, as the external work dissipated in the specimen included fracture energy,
elastic strain energy, and creep strain energy. If the testing temperature is relatively high or the
loading rate is relatively low, the creep portion can be extremely high which converts a “fracture
test” into a “creep test”. However, there is not an existing protocol to separate those three types
of energy during lab testing. At this stage, using the external work as the fracture energy can still
be considered valid, if the testing temperature is low. There is one limitation in the test matrix in
the fourth objective: binder grade. Two binders used in the fourth objective have the same lower
PG limit. Although it was found that polymer modification has an effect on the R-Curve, the
effect of the lower limit in PG is important to investigate. Finally, in the fourth objective, a new

107
method that quantifies the crack extension in two dimensions is preliminarily developed during
the image analysis. However, the noise in the image analysis is high and needs to be improved.
5.3 Recommendations
R-Curve has been investigated in asphalt concrete, and a large amount of materials have been
evaluated by using R-Curve method. Due to the limitation that were found during the process of
the research, there is still more research that needs to be performed. For the first objective, it is
recommended that the literature continue tracking the R-Curve method development in other
materials stays up to date, as the application of fracture mechanics is more developed in
materials such as metal, polymer, and composite.
The second objective of this research is the investigation of the current widely applied fracture
energy in asphalt concrete. There is plenty of research on fracture energy comprehensively;
however, there is an issue on the separation of recoverable strain energy and creep strain energy
from the fracture energy. If the fracture energy can be isolated in measurement from the total
external work in fracture testing, a more appropriate evaluation of the general fracture resistance
can be performed.
The third and fourth objectives of this research are the construction and application of R-Curve
in asphalt concrete. There are four recommendations on further research of R-Curve in asphalt
concrete. First, it is recommended that a wider range of PG be investigated, so that the effect of
PG on R-Curve can be understood. Second, it is recommended the recoverable strain energy and
creep strain energy measurement be separated from the fracture energy. Alternatively, a proper

108
testing temperature of the fracture test needs to be selected to ensure that the fracture energy is
dominated in the total energy dissipation. Third, in this research, only one test configuration was
performed in R-Curve research. Forth, it is noticed that most R-Curves at low temperature may
be unstable cracking, and future work shall study the correlation between test temperature,
loading rate and instability of crack growth. It is known that R-Curve is geometry dependent,
other testing configurations included SE(B), DC(T) and also the geometry size effect need to be
studied. In this research all the SC(B) sample are fixed in geometry with sample width of 25mm,
the dependence of sample width on R-Curve should be investigated to address the stress status in
field. Fourth, image analysis for the crack extension is recommended for further study:
improvement of grey scale depth rather than the resolution of the camera sensor is
recommended.

109
Reference
Ahmed, Sarfraz, Eshan V. Dave, Behzad Behnia, William G. Buttlar, and Marvin Exline.
"Fracture Characterization of Gap-Graded Asphalt Mixtures and Thin Bonded Wearing
Courses." International Journal of Pavement Research and Technology 3, no. 3 (2010):
128-34.
Ameli, A., M. Papini, J. A. Schroeder, and J. K. Spelt. "Fracture R-Curve Characterization of
Toughened Epoxy Adhesives." Engineering Fracture Mechanics 77, no. 3 (2010): 521-
34.
Anderson, Richard M., and Linda M. Braun. "Technique for the R‐Curve Determination of Y‐Tzp Using Indentation‐Produced Flaws." Journal of the American Ceramic Society 73,
no. 10 (1990): 3059-62.
Anderson, Ted L., and T. L. Anderson. Fracture Mechanics: Fundamentals and Applications.
CRC press, 2005.
Bajaj, Devendra, and Dwayne D. Arola. "On the R-Curve Behavior of Human Tooth Enamel."
Biomaterials 30, no. 23-24 (2009): 4037-46.
Bertram, A., and J. F. Kalthoff. "Crack Propagation Toughness of Rock for the Range of Low to
Very High Crack Speeds." Paper presented at the Advances in Fracture and Damage
Mechanics, September 2, 2003 - September 4, 2003, Paderborn, Germany, 2003.
Bhasin, Amit, and Dallas N. Little. "Application of Microcalorimeter to Characterize Adhesion
between Asphalt Binders and Aggregates." Journal of Materials in Civil Engineering 21,
no. 6 (2009): 235-43.
Birgisson, B., A. Montepara, E. Romeo, R. Roncella, G. Tebaldi, and R. Roque. "The Use of
Digital Image Correlation for Accurate Determination of Fracture Energy Density in Hot
Mix Asphalt (Hma)." Paper presented at the 6th RILEM International Conference on
Cracking in Pavements, June 16, 2008 - June 18, 2008, Chicago, IL, United states, 2008.
Birgisson, Bjorn, Antonio Montepara, John Napier, Elena Romeo, Riccardo Roncella, and
Gabriele Tebaldi. "Micromechanical Analyses for Measurement and Prediction of Hot-
Mix Asphalt Fracture Energy." Paper presented at the Bituminous Paving Mixtures,
2006.
110
Birgisson, Bjorn, Antonio Montepara, Elena Romeo, Reynaldo Roque, Riccardo Roncella, and
Gabriele Tebaldi. "Determination of Fundamental Tensile Failure Limits of Mixtures."
Paper presented at the Asphalt Paving Technology 2007 AAPT, March 11, 2007 - March
14, 2007, San Antonio, TX, United states, 2007.
Birgisson, Bjorn, Reynaldo Roque, and Gale C. Page. "Performance-Based Fracture Criterion for
Evaluation of Moisture Susceptibility in Hot-Mix Asphalt." 2004.
Braham, Andrew F., William G. Buttlar, Timothy R. Clyne, Mihai O. Marasteanu, and Mugurel
I. Turos. "The Effect of Long-Term Laboratory Aging on Asphalt Concrete Fracture
Energy." Paper presented at the Asphalt Paving Technology 2009, AAPT, March 15,
2009 - March 18, 2009, Minneapolis, MN, United states, 2009.
Braham, Andrew F., William G. Buttlar, and Mihai O. Marasteanu. "Effect of Binder Type,
Aggregate, and Mixture Composition on Fracture Energy of Hot-Mix Asphalt in Cold
Climates." Transportation Research Record, no. 2001 (2007): 102-09.
Braham, Andrew Franz. Fracture Characteristics of Asphalt Concrete in Mode I, Mode Ii, and
Mixed-Mode. ProQuest, 2008.
Braham, Andrew, and Caleb Mudford. "Development of Fracture Resistance Curves for Asphalt
Concrete." Journal of Materials in Civil Engineering 25, no. 11 (2013): 1631-37.
Brake, Nicholas Andres, and Karim Chatti. "Prediction of Transient and Steady-State Flexural
Fatigue Crack Propagation in Concrete Using a Cyclic R-Curve." Journal of Engineering
Mechanics 138, no. 4 (2012): 371-78.
Cesar, Paulo Francisco, Vinicius Rosa, Marcelo Mendes Pinto, Humberto Naoyuki Yoshimura,
and Luoyu Roy Xu. "Effect of Ion Exchange on R-Curve Behavior of a Dental
Porcelain." Journal of Materials Science 46, no. 1 (2011): 117-22.
Chan, Kwai S., and Daniel P. Nicolella. "Micromechanical Modeling of R-Curve Behaviors in
Human Cortical Bone." Journal of the Mechanical Behavior of Biomedical Materials 16,
no. 1 (2012): 136-52.
Chen, Xiang, Randy K. Nanstad, and Mikhail A. Sokolov. "J-R Curve Determination for Disk-

111
Shaped Compact Specimens Based on the Normalization Method and the Direct Current
Potential Drop Technique." Paper presented at the 6th International Symposium on Small
Specimen Test Techniques, January 29, 2014 - January 31, 2014, Houston, TX, United
states, 2015.
Cheng, DingXin, Dallas N. Little, Robert L. Lytton, and James C. Holste. "Surface Energy
Measurement of Asphalt and Its Application to Predicting Fatigue and Healing in Asphalt
Mixtures." 2002.
Dave, Eshan V., Behzad Behnia, Sarfraz Ahmed, William G. Buttlar, and Henrique Reis. "Low
Temperature Fracture Evaluation of Asphalt Mixtures Using Mechanical Testing and
Acoustic Emissions Techniques." Paper presented at the Asphalt Paving Technology
2011, AAPT, March 27, 2011 - March 30, 2011, Tampa, FL, United states, 2011.
Dave, Eshan V., and William G. Buttlar. "Thermal Reflective Cracking of Asphalt Concrete
Overlays." International Journal of Pavement Engineering 11, no. 6 (2010): 477-88.
de Castro, P. M. S. T. "R-Curve Behaviour of a Structural Steel." Engineering Fracture
Mechanics 19, no. 2 (1984): 341-57.
Dongre, Rai, M. G. Sharma, and D. A. Anderson. "Development of Fracture Criterion for
Asphalt Mixes at Low Temperatures." Transportation Research Record, no. 1228 (1989):
94-105.
Du, J., M. D. Thouless, and A. F. Yee. "Development of a Process Zone in Rubber-Modified
Epoxy Polymers." International Journal of Fracture 92, no. 3 (1999): 271-85.
Elseifi, Mostafa A., Louay N. Mohammad, Hao Ying, and Samuel Cooper Iii. "Modeling and
Evaluation of the Cracking Resistance of Asphalt Mixtures Using the Semi-Circular
Bending Test at Intermediate Temperatures." Paper presented at the Asphalt Paving
Technology 2012, AAPT, April 1, 2012 - April 4, 2012, Austin, TX, United states, 2012.
Faruk, Abu N. M., Xiaodi Hu, Yuly Lopez, and Lubinda F. Walubita. "Using the Fracture
Energy Index Concept to Characterize the Hma Cracking Resistance Potential under
Monotonic Crack Testing." International Journal of Pavement Research and Technology
7, no. 1 (2014): 40-48.

112
Fett, T., D. Munz, R. D. Geraghty, and K. W. White. "Bridging Stress Determination by
Evaluation of the R-Curve." Journal of the European Ceramic Society 20, no. 12 (2000):
2143-48.
Fett, T., D. Munz, R. D. Geraghty, and K. W. White. "Influence of Specimen Geometry and
Relative Crack Size on the R-Curve." Engineering Fracture Mechanics 66, no. 4 (2000):
375-86.
Fischer, David S., and Christopher A. Schuh. "Effect of a Rising R-Curve on the Sliding Wear of
Silicon-Disilicide in Situ Composites." Journal of the American Ceramic Society 95, no.
4 (2012): 1406-13.
Fleck, N. A., M. P. F. Sutcliffe, S. Sivashanker, and X. J. Xin. "Compressive R-Curve of a
Carbon Fibre-Epoxy Matrix Composite." Composites Part B: Engineering 27, no. 6
(1996): 531-41.
Ghafari, Sepehr, and Fereidoon Moghadas Nejad. "R-Curve Behavior and Crack Propagation
Properties of Asphalt Concrete at Low Temperatures." Journal of Civil Engineering and
Management 21, no. 5 (2015): 559-70.
Gopalakrishnan, Karthik, and John J. Mecholsky. "Mixed-Mode Fracture in an R-Curve
Material." Engineering Fracture Mechanics 79 (2012): 380-88.
Griffith, Alan A. "The Phenomena of Rupture and Flow in Solids." Philosophical transactions of
the royal society of london. Series A, containing papers of a mathematical or physical
character 221 (1921): 163-98.
Gutkin, R., M. L. Laffan, S. T. Pinho, P. Robinson, and P. T. Curtis. "Modelling the R-Curve
Effect and Its Specimen-Dependence." International Journal of Solids and Structures 48,
no. 11-12 (2011): 1767-77.
Haynes, M. J., and R. P. Gangloff. "High Resolution R-Curve Characterization of the Fracture
Toughness of Thin Sheet Aluminum Alloys." Journal of Testing and Evaluation 25, no. 1
(1997): 82-98.
Howson, Jonathan, Eyad Masad, Dallas Little, and Emad Kassem. "Relationship between Bond
Energy and Total Work of Fracture for Asphalt Binder-Aggregate Systems." Paper

113
presented at the Asphalt Paving Technology 2012, AAPT, April 1, 2012 - April 4, 2012,
Austin, TX, United states, 2012.
Irwin, G. R., and J. A. Kies. "Critical Energy Rate Analysis of Fracture Strength." Welding
Journal 33, no. 4 (1954): 193-8.
Jeon, Changwoo, Choongnyun Paul Kim, Hyoung Seop Kim, and Sunghak Lee. "Interpretation
of Fracture Toughness and R-Curve Behavior by Direct Observation of Microfracture
Process in Ti-Based Dendrite-Containing Amorphous Alloys." Metallurgical and
Materials Transactions A: Physical Metallurgy and Materials Science 46, no. 4 (2015):
1588-96.
Kavanagh, Leonnie N. "A 9-Year Evaluation of Field Cracking and Rutting Performance of Sps-
9 Superpave Experiment." 2004.
Kim, Jaeseung, Reynaldo Roque, and Bjorn Birgisson. "Integration of Thermal Fracture in the
Hma Fracture Model." Paper presented at the 2008 Annual Meeting of the Association of
Asphalt Paving Technologists, AAPT, April 25, 2008 - April 30, 2008, Philadelphia, PA,
United states, 2008.
Kim, Ji Sik, Young-Nam Kwon, and Kee-Sun Sohn. "Dynamic Visualization of Crack Tip Stress
Field and Propagation Using the Mechano-Luminescence in Sral2o4:(Eu,Dy,Nd)." Paper
presented at the 5th Pacific Rim International Conference on Advanced Materials and
Processing, PRICM 2004, November 2, 2004 - November 5, 2004, Beijing, China, 2005.
Kim, Kwang W., and M. El Hussein. "Variation of Fracture Toughness of Asphalt Concrete
under Low Temperatures." Construction and Building Materials 11, no. 7-8 (1997): 403-
11.
Kim, Minkyum, Louay Mohammad, and Mostafa Elseifi. "Characterization of Fracture
Properties of Asphalt Mixtures as Measured by Semicircular Bend Test and Indirect
Tension Test." Transportation Research Record, no. 2296 (2012): 115-24.
Koh, Chulseung, and Reynaldo Roque. "Use of Nonuniform Stress-State Tests to Determine
Fracture Energy of Asphalt Mixtures Accurately." Transportation Research Record, no.
2181 (2010): 55-66.

114
Kuai, Haidong, Hyun Jong Lee, Goangseup Zi, and Sungho Mun. "Application of Generalized J-
Integral to Crack Propagation Modeling of Asphalt Concrete under Repeated Loading."
Transportation Research Record, no. 2127 (2009): 72-81.
Lach, R., S. Seidler, and W. Grellmann. "Resistance against the Intrinsic Rate of Fracture
Mechanics Parameters for Polymeric Materials under Moderate Impact Loading."
Mechanics of Time-Dependent Materials 9, no. 2-3 (2005): 103-19.
Li, X. J., and M. O. Marasteanu. "Using Semi Circular Bending Test to Evaluate Low
Temperature Fracture Resistance for Asphalt Concrete." Paper presented at the
Proceedings of the Society for Experimental Mechanics, Inc., 2010.
Li, Xue, and Mihai Marasteanu. "Evaluation of the Low Temperature Fracture Resistance of
Asphalt Mixtures Using the Semi Circular Bend Test." Paper presented at the Asphalt
Paving Technology 2004, March 8, 2004 - March 10, 2004, Baton Rouge, LA, United
states, 2004.
Li, Xue, and Mihai O. Marasteanu. "Cohesive Modeling of Fracture in Asphalt Mixtures at Low
Temperatures." International Journal of Fracture 136, no. 1-4 (2005): 285-308.
Lin, Jia, Yu Huang, and Houan Zhang. "Damage Resistance, R-Curve Behavior and Toughening
Mechanisms of Zrb2-Based Composites with Sic Whiskers and Zro2 Fibers." Ceramics
International 41, no. 2 (2015): 2690-98.
Luo, Xue. "Characterization of Fatigue Cracking and Healing of Asphalt Mixtures." ProQuest
LLC, 2012.
Luo, Xue, Rong Luo, and Robert L. Lytton. "Energy-Based Crack Initiation Criterion for
Viscoelastoplastic Materials with Distributed Cracks." Journal of Engineering Mechanics
141, no. 2 (2015).
Majidzadeh, K., E. M. Kauffmann, and D. V. Ramsamooj. "Application of Fracture Mechanics
in the Analysis of Pavement Fatigue." 1971 1970.
Marasteanu, Mihai, William Buttlar, Hussain Bahia, Christopher Williams, Ki Hoon Moon,
Eyoab Zegey Teshale, Augusto Cannone Falchetto, et al. "Investigation of Low
Temperature Cracking in Asphalt Pavements National Pooled Fund Study–Phase Ii."

115
(2012).
McCabe, D. E. "Fracture Toughness Evaluation by R-Curve Methods." 1973.
Miller, J. S., and W. Y. Bellinger. "Distress Identification Manual for the Long-Term Pavement
Performance (Ltpp) Project." FHWA-RD-03, 2003.
Moavenzadeh, Fred. "Asphalt Fracture." 1967.
Mobasher, Barzin, Michael S. Mamlouk, and How-Ming Lin. "Evaluation of Crack Propagation
Properties of Asphalt Mixtures." Journal of Transportation Engineering 123, no. 5
(1997): 405-13.
Neshpor, G. S. "Some Special Features of the R-Curve and Its Use for Evaluating the Modulus
of Rupture of Aluminum Alloys." Industrial laboratory 53, no. 5 (1987): 460-67.
Novak, Stephen R. "Resistance to Plane-Stress Fracture (R-Curve Behavior) of A572 Structural
Steel." In Mechanics of Crack Growth: ASTM International, 1976.
Ouchterlony, Finn. "Simple R-Curve Approach to Fracture Toughness Testing of Rock Core
Specimens." Paper presented at the Proceedings 23rd Symposium on Rock Mechanics,
Berkeley, Calif, USA, 1982.
Paris, P., and F. Erdogan. "Critical Analysis of Crack Propagation Laws." American Society of
Mechanical Engineers -- Transactions -- Journal of Basic Engineering 85, no. 4 (1963):
528-34.
Ramsamooj, D. V. "Prediction of Fatigue Life of Asphalt Concrete Beams from Fracture Tests."
Journal of Testing & Evaluation 19, no. 3 (1991): 231-39.
Reynolds, Anthony P. "Comparison of R-Curve Methodologies for Ranking the Toughness of
Aluminum Alloys." Journal of Testing and Evaluation 24, no. 6 (1996): 406-10.
Ruth, Byron E., Reynaldo Roque, Bensa Nukunya, Richard Davis, Mihai Marasteanu, William
Vavrik, Frank Fee, et al. "Aggregate Gradation Characterization Factors and Their
Relationships to Fracture Energy and Failure Strain of Asphalt Mixtures." Paper

116
presented at the Asphalt Paving Technology 2002, March 18, 2002 - March 20, 2002,
Colorado Springs, CO, United states, 2002.
Sahu, M. K., J. Chattopadhyay, and B. K. Dutta. "Transferability of Specimen J-R Curve to
Straight Pipe with Circumferential Surface Flaw." Fatigue and Fracture of Engineering
Materials and Structures 35, no. 5 (2012): 476-87.
Saxena, Ashok. Nonlinear Fracture Mechanics for Engineers. CRC press, 1998.
Schmit, F., D. Bouvart, and D. Francois. "Ductile Fracture Characterization of Polycarbonate by
the R-Curve Method." International Journal of Fracture 43, no. 2 (1990): 83-96.
Shah, M. B., J. L. Ferracane, and J. J. Kruzic. "R-Curve Behavior and Micromechanisms of
Fracture in Resin Based Dental Restorative Composites." Journal of the Mechanical
Behavior of Biomedical Materials 2, no. 5 (2009): 502-11.
Siverns, M. J., and A. T. Price. "Crack Propagation under Creep Conditions in a Quenched 2 One
Quarter Chromium 1 Molybdenum Steel." International Journal of Fracture 9, no. 2
(1973): 199-207.
Sundaresan, S., and B. Nageswara Rao. "Stress Intensity at the Initiation of Instability by R
Curve." Paper presented at the 2014 International Mechanical Engineering Congress,
IMEC 2014, June 13, 2014 - June 15, 2014, Tiruchirappalli, TN, India, 2014.
Suzuki, Kenji, Keisuke Tanaka, Yoshihisa Sakaida, and Hiroyuki Yamagishi. "R-Curve
Behavior for Stable Crack Growth from Indentation Cracks in Alumina." Zairyo/Journal
of the Society of Materials Science, Japan 44, no. 504 (1995): 1133-37.
Tanaka, K., and J. D. Harrison. "R Curve Approach to Cod and J for an Austenitic Steel."
International Journal of Pressure Vessels and Piping 6, no. 3 (1978): 177-201.
Wagoner, Michael P., and William G. Buttlar. "Influence of Specimen Size on Fracture Energy
of Asphalt Concrete." Paper presented at the Asphalt Paving Technology 2007 AAPT,
March 11, 2007 - March 14, 2007, San Antonio, TX, United states, 2007.
Wagoner, Michael P., William G. Buttlar, and Glaucio H. Paulino. "Development of a Single-
Edge Notched Beam Test for Asphalt Concrete Mixtures." Journal of Testing and
Evaluation 33, no. 6 (2005): 452-60.
117
Wagoner, Michael P., William G. Buttlar, Glaucio H. Paulino, and Philip Blankenship.
"Investigation of the Fracture Resistance of Hot-Mix Asphalt Concrete Using a Disk-
Shaped Compact Tension Test." 2005.
Wagoner, Michael P., William G. Buttlar, Glaucio H. Paulino, Philip Blankenship, Reynaldo
Roque, Wu Rongzong, Adriaan De Bondt, et al. "Laboratory Testing Suite for
Characterization of Asphalt Concrete Mixtures Obtained from Field Cores." Paper
presented at the Association of Asphalt Paving Technologists -Proceedings of the
Technical Sessions 2006 Annual Meeting, March 27, 2006 - March 29, 2006, Savannah,
GA, United states, 2006.
Walubita, Lubinda F., Geoffrey S. Simate, Edward Ofori-Abebresse, Amy Epps Martin, Robert
L. Lytton, and Luis E. Sanabria. "Mathematical Formulation of Hma Crack Initiation and
Crack Propagation Models Based on Continuum Fracture-Mechanics and Work-Potential
Theory." International Journal of Fatigue 40 (2012): 112-19.
Wu, Ming, and Dale Wilson. "Residual Strength of Metal-Matrix Laminated Panels." Paper
presented at the Proceedings of the 1995 6th Symposium on Composites: Fatigue and
Fracture, May 16, 1995 - May 18, 1995, Denver, CO, USA, 1997.
Wu, Zhong, Louay N. Mohammad, L. B. Wang, and Mary Ann Mull. "Fracture Resistance
Characterization of Superpave Mixtures Using the Semi-Circular Bending Test." Journal
of ASTM International 2, no. 3 (2005): 135-49.
Xi, Yunping, and Zdenek P. Bazant. "Analysis of Crack Propagation in Concrete Structures by
Markov Chain Model and R-Curve Method." Paper presented at the Proceedings of the
1996 7th Specialty Conference on Probabilistic Mechanics and Structural Reliability,
August 7, 1996 - August 9, 1996, Worcester, MA, USA, 1996.
Yang, Kwanho, C. James Hwang, and John A. Rice. "New Testing Method for Ceramic R-Curve
Determination at Elevated Temperatures." Paper presented at the Proceedings of the 1994
International Mechanical Engineering Congress and Exposition, November 6, 1994 -
November 11, 1994, Chicago, IL, USA, 1994.
Yang, Shu, and Andrew Braham. R-curves characterisation analysis for asphalt concrete.
International Journal of Pavement Engineering:1-10, 2016.
Yang, Shu, Andrew Braham, Lianfang Wang, and Qingkai Wang. Influence of aging and
moisture on laboratory performance of asphalt concrete. Construction and Building

118
Materials 115:527-535, 2016.
Zhou, Peng, Ping Hu, Xinghong Zhang, Wenbo Han, and Youhua Fan. "R-Curve Behavior of
Laminated Zrbinf2/Inf-Sic Ceramic with Strong Interfaces." International Journal of
Refractory Metals and Hard Materials 52 (2015): 12-16.

119
Appendix A Tables from Chapter 2
Table A.1 Analysis of Variance of |E*| at -10ºC, 25Hz
Source Sum Sq. d.f. Mean Sq. F p-value
Mix 9.82E+07 2 4.91E+07 12.31 0.020
Age 5.23E+06 2 2.62E+06 0.66 0.567
Condition 3.35E+07 1 3.35E+07 8.41 0.044
Mix*Age 4.46E+07 4 1.11E+07 2.79 0.172
Mix*Condition 2.22E+06 2 1.11E+06 0.28 0.770
Age*Condition 2.19E+07 2 1.10E+07 2.75 0.177
Error 1.60E+07 4 3.99E+06
Total 2.22E+08 17
Table A.2 Analysis of Variance of |E*| at -10ºC, 10Hz
Source Sum Sq. d.f. Mean Sq. F p-value
Mix 1.48E+08 2 7.38E+07 10.82 0.024
Age 1.65E+07 2 8.24E+06 1.21 0.389
Condition 2.41E+07 1 2.41E+07 3.53 0.134
Mix*Age 5.33E+07 4 1.33E+07 1.95 0.266
Mix*Condition 2.85E+06 2 1.43E+06 0.21 0.820
Age*Condition 5.00E+07 2 2.50E+07 3.66 0.125
Error 2.73E+07 4 6.82E+06
Total 3.22E+08 17
Table A.3 Analysis of Variance of |E*| at -10ºC, 5Hz
Source Sum Sq. d.f. Mean Sq. F p-value
Mix 1.25E+08 2 6.26E+07 11.54 0.022
Age 1.41E+07 2 7.03E+06 1.3 0.368
Condition 2.54E+07 1 2.54E+07 4.68 0.097
Mix*Age 4.15E+07 4 1.04E+07 1.91 0.273
Mix*Condition 2.39E+06 2 1.20E+06 0.22 0.811
Age*Condition 4.42E+07 2 2.21E+07 4.07 0.108
Error 2.17E+07 4 5.42E+06
Total 2.74E+08 17
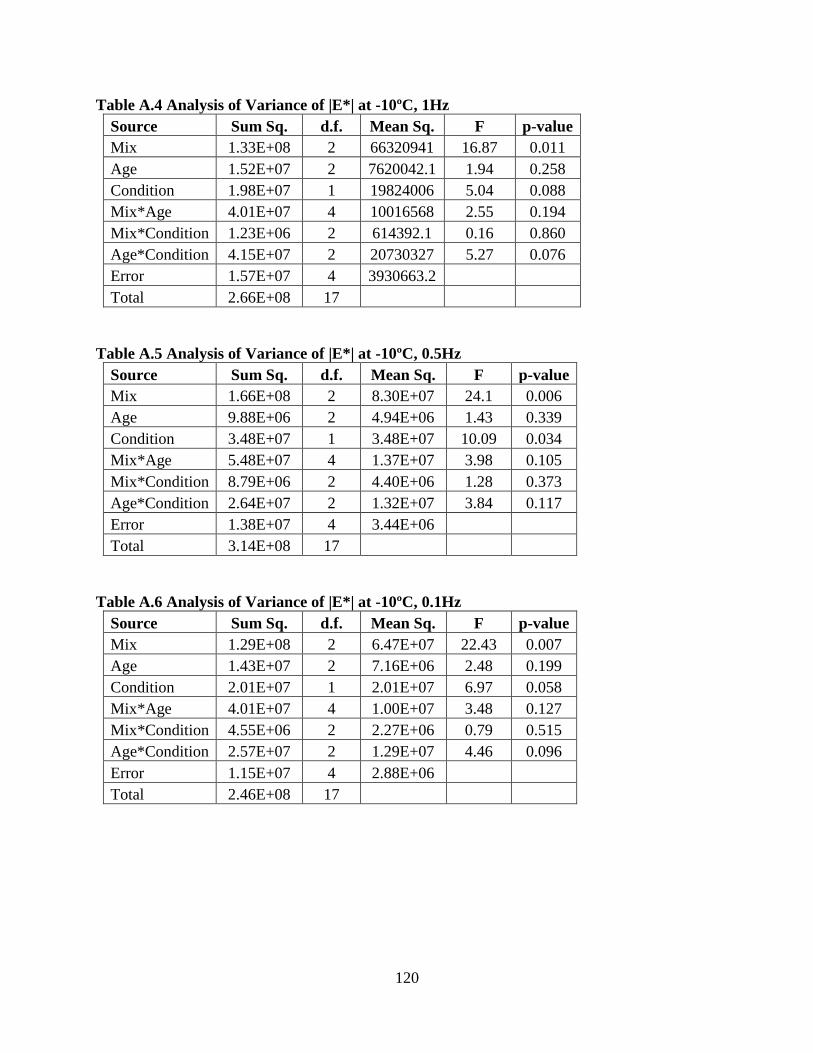
120
Table A.4 Analysis of Variance of |E*| at -10ºC, 1Hz
Source Sum Sq. d.f. Mean Sq. F p-value
Mix 1.33E+08 2 66320941 16.87 0.011
Age 1.52E+07 2 7620042.1 1.94 0.258
Condition 1.98E+07 1 19824006 5.04 0.088
Mix*Age 4.01E+07 4 10016568 2.55 0.194
Mix*Condition 1.23E+06 2 614392.1 0.16 0.860
Age*Condition 4.15E+07 2 20730327 5.27 0.076
Error 1.57E+07 4 3930663.2
Total 2.66E+08 17
Table A.5 Analysis of Variance of |E*| at -10ºC, 0.5Hz
Source Sum Sq. d.f. Mean Sq. F p-value
Mix 1.66E+08 2 8.30E+07 24.1 0.006
Age 9.88E+06 2 4.94E+06 1.43 0.339
Condition 3.48E+07 1 3.48E+07 10.09 0.034
Mix*Age 5.48E+07 4 1.37E+07 3.98 0.105
Mix*Condition 8.79E+06 2 4.40E+06 1.28 0.373
Age*Condition 2.64E+07 2 1.32E+07 3.84 0.117
Error 1.38E+07 4 3.44E+06
Total 3.14E+08 17
Table A.6 Analysis of Variance of |E*| at -10ºC, 0.1Hz
Source Sum Sq. d.f. Mean Sq. F p-value
Mix 1.29E+08 2 6.47E+07 22.43 0.007
Age 1.43E+07 2 7.16E+06 2.48 0.199
Condition 2.01E+07 1 2.01E+07 6.97 0.058
Mix*Age 4.01E+07 4 1.00E+07 3.48 0.127
Mix*Condition 4.55E+06 2 2.27E+06 0.79 0.515
Age*Condition 2.57E+07 2 1.29E+07 4.46 0.096
Error 1.15E+07 4 2.88E+06
Total 2.46E+08 17

121
Table A.7 Analysis of Variance of |E*| at 4ºC, 25Hz
Source Sum Sq. d.f. Mean Sq. F p-value
Mix 3.67E+07 2 1.84E+07 3.04 0.158
Age 1.67E+07 2 8.35E+06 1.38 0.350
Condition 3.56E+06 1 3.56E+06 0.59 0.486
Mix*Age 1.91E+07 4 4.77E+06 0.79 0.589
Mix*Condition 1.90E+07 2 9.52E+06 1.57 0.313
Age*Condition 1.85E+07 2 9.26E+06 1.53 0.321
Error 2.42E+07 4 6.05E+06
Total 1.38E+08 17
Table A.8 Analysis of Variance of |E*| at 4ºC, 10Hz
Source Sum Sq. d.f. Mean Sq. F p-value
Mix 4.58E+07 2 2.29E+07 2.59 0.190
Age 2.00E+07 2 1.00E+07 1.13 0.408
Condition 1.49E+06 1 1.49E+06 0.17 0.702
Mix*Age 2.13E+07 4 5.34E+06 0.6 0.682
Mix*Condition 2.61E+07 2 1.31E+07 1.48 0.331
Age*Condition 3.16E+07 2 1.58E+07 1.79 0.279
Error 3.54E+07 4 8.85E+06
Total 1.82E+08 17
Table A.9 Analysis of Variance of |E*| at 4ºC, 5Hz
Source Sum Sq. d.f. Mean Sq. F p-value
Mix 4.68E+07 2 2.34E+07 2.97 0.162
Age 2.22E+07 2 1.11E+07 1.41 0.345
Condition 1.24E+06 1 1.24E+06 0.16 0.712
Mix*Age 2.09E+07 4 5.22E+06 0.66 0.651
Mix*Condition 2.48E+07 2 1.24E+07 1.57 0.313
Age*Condition 2.48E+07 2 1.24E+07 1.57 0.314
Error 3.16E+07 4 7.89E+06
Total 1.72E+08 17
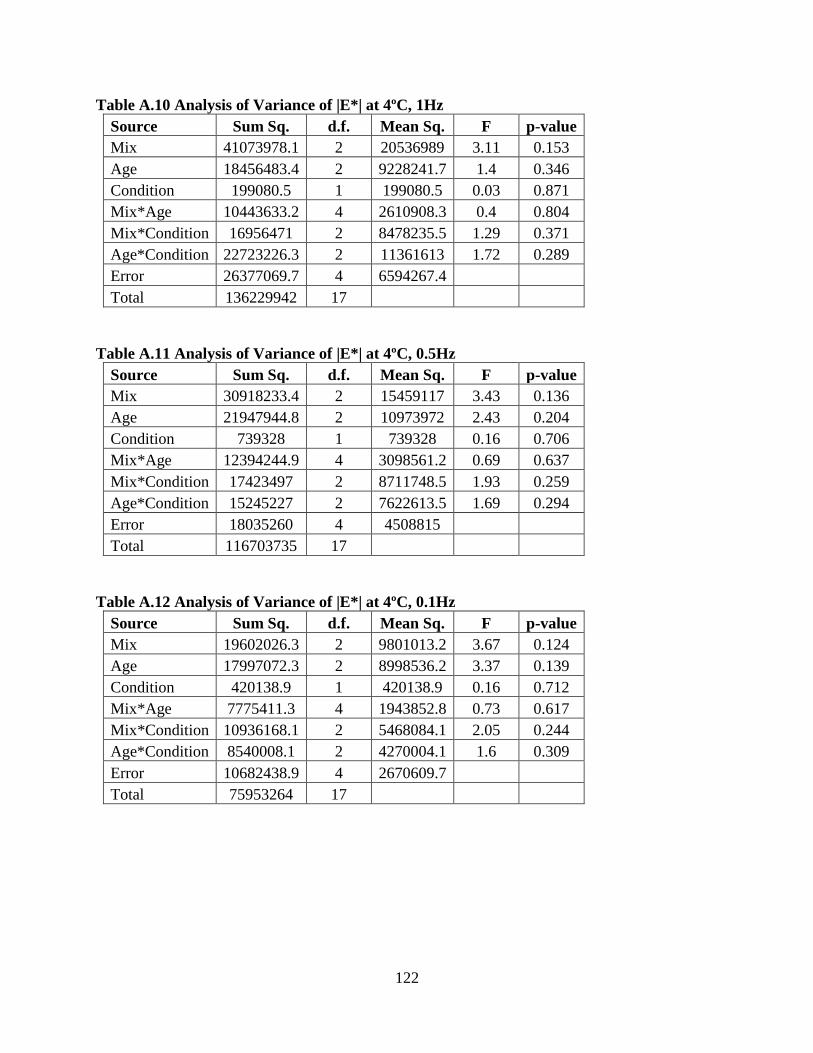
122
Table A.10 Analysis of Variance of |E*| at 4ºC, 1Hz
Source Sum Sq. d.f. Mean Sq. F p-value
Mix 41073978.1 2 20536989 3.11 0.153
Age 18456483.4 2 9228241.7 1.4 0.346
Condition 199080.5 1 199080.5 0.03 0.871
Mix*Age 10443633.2 4 2610908.3 0.4 0.804
Mix*Condition 16956471 2 8478235.5 1.29 0.371
Age*Condition 22723226.3 2 11361613 1.72 0.289
Error 26377069.7 4 6594267.4
Total 136229942 17
Table A.11 Analysis of Variance of |E*| at 4ºC, 0.5Hz
Source Sum Sq. d.f. Mean Sq. F p-value
Mix 30918233.4 2 15459117 3.43 0.136
Age 21947944.8 2 10973972 2.43 0.204
Condition 739328 1 739328 0.16 0.706
Mix*Age 12394244.9 4 3098561.2 0.69 0.637
Mix*Condition 17423497 2 8711748.5 1.93 0.259
Age*Condition 15245227 2 7622613.5 1.69 0.294
Error 18035260 4 4508815
Total 116703735 17
Table A.12 Analysis of Variance of |E*| at 4ºC, 0.1Hz
Source Sum Sq. d.f. Mean Sq. F p-value
Mix 19602026.3 2 9801013.2 3.67 0.124
Age 17997072.3 2 8998536.2 3.37 0.139
Condition 420138.9 1 420138.9 0.16 0.712
Mix*Age 7775411.3 4 1943852.8 0.73 0.617
Mix*Condition 10936168.1 2 5468084.1 2.05 0.244
Age*Condition 8540008.1 2 4270004.1 1.6 0.309
Error 10682438.9 4 2670609.7
Total 75953264 17

123
Table A.13 Analysis of Variance of |E*| at 21ºC, 25Hz
Source Sum Sq. d.f. Mean Sq. F p-value
Mix 54042432.1 2 27021216 5.77 0.066
Age 2840547.4 2 1420273.7 0.3 0.754
Condition 18477120.5 1 18477121 3.95 0.118
Mix*Age 11263798.9 4 2815949.7 0.6 0.683
Mix*Condition 13781590.3 2 6890795.2 1.47 0.332
Age*Condition 594901 2 297450.5 0.06 0.939
Error 18725294.7 4 4681323.7
Total 119725685 17
Table A.14 Analysis of Variance of |E*| at 21ºC, 10Hz
Source Sum Sq. d.f. Mean Sq. F p-value
Mix 12789387.4 2 6394693.7 1.55 0.317
Age 16672787.4 2 8336393.7 2.03 0.247
Condition 4512.5 1 4512.5 0 0.975
Mix*Age 6287086.22 4 1571771.6 0.38 0.813
Mix*Condition 4157162.33 2 2078581.2 0.51 0.637
Age*Condition 9916092.33 2 4958046.2 1.21 0.389
Error 16455209.3 4 4113802.3
Total 66282237.6 17
Table A.15 Analysis of Variance of |E*| at 21ºC, 5Hz
Source Sum Sq. d.f. Mean Sq. F p-value
Mix 8637214.3 2 4318607.2 1.28 0.372
Age 14491790.3 2 7245895.2 2.15 0.232
Condition 22684.5 1 22684.5 0.01 0.939
Mix*Age 6121653.3 4 1530413.3 0.45 0.769
Mix*Condition 4013832.3 2 2006916.2 0.6 0.594
Age*Condition 8082736.3 2 4041368.2 1.2 0.391
Error 13487099.3 4 3371774.8
Total 54857010.5 17

124
Table A.16 Analysis of Variance of |E*| at 21ºC, 1Hz
Source Sum Sq. d.f. Mean Sq. F p-value
Mix 3288389.8 2 1644194.9 0.92 0.469
Age 8752022.1 2 4376011.1 2.45 0.202
Condition 69564.5 1 69564.5 0.04 0.853
Mix*Age 4345345.9 4 1086336.5 0.61 0.679
Mix*Condition 2803745.3 2 1401872.7 0.79 0.515
Age*Condition 4534308.3 2 2267154.2 1.27 0.374
Error 7133570.3 4 1783392.6
Total 30926946.3 17
Table A.17 Analysis of Variance of |E*| at 21ºC, 0.5Hz
Source Sum Sq. d.f. Mean Sq. F p-value
Mix 3288389.8 2 1644194.9 0.92 0.469
Age 8752022.1 2 4376011.1 2.45 0.202
Condition 69564.5 1 69564.5 0.04 0.853
Mix*Age 4345345.9 4 1086336.5 0.61 0.679
Mix*Condition 2803745.3 2 1401872.7 0.79 0.515
Age*Condition 4534308.3 2 2267154.2 1.27 0.374
Error 7133570.3 4 1783392.6
Total 30926946.3 17
Table A.18 Analysis of Variance of |E*| at 21ºC, 0.1Hz
Source Sum Sq. d.f. Mean Sq. F p-value
Mix 520620.4 2 260310.2 0.62 0.582
Age 3340344.4 2 1670172.2 3.99 0.111
Condition 74755.6 1 74755.6 0.18 0.694
Mix*Age 1978874.2 4 494718.6 1.18 0.437
Mix*Condition 535987.1 2 267993.6 0.64 0.574
Age*Condition 780508.4 2 390254.2 0.93 0.465
Error 1672672.9 4 418168.2
Total 8903763.1 17

125
Table A.19 Analysis of Variance of |E*| at 37ºC, 25Hz
Source Sum Sq. d.f. Mean Sq. F p-value
Mix 1194016.8 2 597008.4 1.31 0.366
Age 2045773.4 2 1022886.7 2.24 0.223
Condition 2327043.6 1 2327043.6 5.09 0.087
Mix*Age 1195813.2 4 298953.3 0.65 0.654
Mix*Condition 714525.4 2 357262.7 0.78 0.517
Age*Condition 1724915.4 2 862457.7 1.89 0.265
Error 1827294.6 4 456823.6
Total 11029382.4 17
Table A.20 Analysis of Variance of |E*| at 37ºC, 10Hz
Source Sum Sq. d.f. Mean Sq. F p-value
Mix 394970.1 2 197485.1 0.46 0.663
Age 1456174.8 2 728087.4 1.68 0.295
Condition 1868244.5 1 1868244.5 4.32 0.106
Mix*Age 1480594.2 4 370148.6 0.86 0.559
Mix*Condition 695224.3 2 347612.2 0.8 0.509
Age*Condition 1164866.3 2 582433.2 1.35 0.357
Error 1731651.3 4 432912.8
Total 8791725.6 17
Table A.21 Analysis of Variance of |E*| at 37ºC, 5Hz
Source Sum Sq. d.f.
Mean
Sq. F p-value
Mix 601573 2 300786.5 1.06 0.428
Age 1213246.3 2 606623.2 2.13 0.234
Condition 753582.7 1 753582.7 2.65 0.179
Mix*Age 752604.7 4 188151.2 0.66 0.650
Mix*Condition 372160.8 2 186080.4 0.65 0.568
Age*Condition 1054963.4 2 527481.7 1.86 0.269
Error 1136873.6 4 284218.4
Total 5885004.5 17

126
Table A.22 Analysis of Variance of |E*| at 37ºC, 1Hz
Source Sum Sq. d.f. Mean Sq. F p-value
Mix 217546.3 2 108773.2 1.2 0.392
Age 450916.3 2 225458.2 2.48 0.199
Condition 163973.6 1 163973.6 1.8 0.251
Mix*Age 243232.3 4 60808.1 0.67 0.647
Mix*Condition 130393.4 2 65196.7 0.72 0.542
Age*Condition 304780.8 2 152390.4 1.68 0.296
Error 363809.2 4 90952.3
Total 1874652 17
Table A.23 Analysis of Variance of |E*| at 37ºC, 0.5Hz
Source Sum Sq. d.f. Mean Sq. F p-value
Mix 142828.4 2 71414.2 1.2 0.390
Age 272163.1 2 136081.6 2.29 0.217
Condition 98272.2 1 98272.2 1.66 0.267
Mix*Age 155338.2 4 38834.6 0.65 0.654
Mix*Condition 92727.1 2 46363.6 0.78 0.517
Age*Condition 189749.8 2 94874.9 1.6 0.309
Error 237224.9 4 59306.2
Total 1188303.8 17
Table A.24 Analysis of Variance of |E*| at 37ºC, 0.1Hz
Source Sum Sq. d.f. Mean Sq. F p-value
Mix 49321 2 24660.5 1.32 0.362
Age 100681 2 50340.5 2.7 0.181
Condition 19404.5 1 19404.5 1.04 0.365
Mix*Age 47785 4 11946.2 0.64 0.661
Mix*Condition 25981 2 12990.5 0.7 0.550
Age*Condition 57490.3 2 28745.2 1.54 0.318
Error 74451.7 4 18612.9
Total 375114.5 17

127
Table A.25 Analysis of Variance of |E*| at 54ºC, 25Hz
Source Sum Sq. d.f. Mean Sq. F p-value
Mix 300538.8 2 150269.4 4.04 0.110
Age 207704.8 2 103852.4 2.8 0.174
Condition 38456.9 1 38456.9 1.04 0.367
Mix*Age 273212.9 4 68303.2 1.84 0.285
Mix*Condition 43734.8 2 21867.4 0.59 0.597
Age*Condition 96220.1 2 48110.1 1.3 0.368
Error 148602.2 4 37150.6
Total 1108470.4 17
Table A.26 Analysis of Variance of |E*| at 54ºC, 10Hz
Source Sum Sq. d.f. Mean Sq. F p-value
Mix 182460.1 2 91230.1 2.5 0.197
Age 164680.4 2 82340.2 2.26 0.221
Condition 11858 1 11858 0.33 0.599
Mix*Age 183359.6 4 45839.9 1.26 0.415
Mix*Condition 65816.3 2 32908.2 0.9 0.475
Age*Condition 67692 2 33846 0.93 0.466
Error 145780.7 4 36445.2
Total 821647.1 17
Table A.27 Analysis of Variance of |E*| at 54ºC, 5Hz
Source Sum Sq. d.f. Mean Sq. F p-value
Mix 106064.1 2 53032.1 2.25 0.221
Age 93890.8 2 46945.4 1.99 0.251
Condition 3901.4 1 3901.4 0.17 0.705
Mix*Age 111761.2 4 27940.3 1.19 0.436
Mix*Condition 46296.8 2 23148.4 0.98 0.450
Age*Condition 41204.1 2 20602.1 0.87 0.484
Error 94199.2 4 23549.8
Total 497317.6 17

128
Table A.28 Analysis of Variance of |E*| at 54ºC, 1Hz
Source Sum Sq. d.f. Mean Sq. F p-value
Mix 34520.1 2 17260.1 2.03 0.247
Age 35971.4 2 17985.7 2.11 0.237
Condition 227.6 1 227.6 0.03 0.878
Mix*Age 36509.2 4 9127.3 1.07 0.474
Mix*Condition 20584.8 2 10292.4 1.21 0.389
Age*Condition 18407.4 2 9203.7 1.08 0.422
Error 34085.2 4 8521.3
Total 180305.8 17
Table A.29 Analysis of Variance of |E*| at 54ºC, 0.5Hz
Source Sum Sq. d.f. Mean Sq. F p-value
Mix 32157 2 16078.5 2.22 0.225
Age 27571 2 13785.5 1.9 0.263
Condition 2913.4 1 2913.4 0.4 0.561
Mix*Age 29876 4 7469 1.03 0.489
Mix*Condition 11802.8 2 5901.4 0.81 0.506
Age*Condition 12726.8 2 6363.4 0.88 0.483
Error 29035.6 4 7258.9
Total 146082.5 17
Table A.30 Analysis of Variance of |E*| at 54ºC, 0.1Hz
Source Sum Sq. d.f. Mean Sq. F p-value
Mix 11113 2 5556.5 1.5 0.327
Age 11077.3 2 5538.67 1.49 0.328
Condition 2312 1 2312 0.62 0.474
Mix*Age 13072.7 4 3268.17 0.88 0.548
Mix*Condition 8386.3 2 4193.17 1.13 0.409
Age*Condition 7777.3 2 3888.67 1.05 0.431
Error 14865.3 4 3716.33
Total 68604 17

129
Appendix B Tables from Chapter 3
Table B.1 Analysis of Variance of Fracture Energy
Source Sum Sq. d.f. Mean Sq. F p-value
Mix Type 20704.6 2 10352.3 0.13 0.8763
Aging 216469.1 2 108234.6 1.39 0.2658
Moisture 256171.0 1 256171 3.28 0.0803
Temperature 471923.2 1 471923.2 6.05 0.0201
Error 2262278.8 29 78009.6
Total 3227546.7 35
Table B.2 Analysis of Variance of Cohesive Energy
Source Sum Sq. d.f. Mean Sq. F p
Mix Type 25969.7 2 12984.8 0.4 0.6742
Aging 41295.8 2 20647.9 0.64 0.5369
Moisture 8070.0 1 8070 0.25 0.622
Temperature 114018.8 1 114018.8 3.51 0.0711
Error 942260.1 29 32491.7
Total 1131614.4 35
Table B.3 Analysis of Variance of Energy Rate
Source Sum Sq. d.f. Mean Sq. F p
Mix Type 42.5 2 21.272 0.49 0.615
Aging 138.9 2 69.443 1.61 0.2165
Moisture 358.7 1 358.724 8.34 0.0073
Temperature 181.1 1 181.082 4.21 0.0494
Error 1247.9 29 43.031
Total 1969.1 35

130
Appendix C Tables from Chapter 4
Table C.1 Analysis of Variance of Fracture Energy COV
Source Sum Sq. d.f. Mean Sq. F p
Temperature 65.21 1 65.21 0.56 0.4696
NMAS 1064.39 1 1064.39 9.16 0.0115
PG 361.95 1 361.95 3.11 0.1053
Loading rate 0.6 1 0.6 0.01 0.944
Error 1278.46 11 116.22
Total 2770.6 15
Table C.2 Analysis of Variance of Cohesive Energy COV
Source Sum Sq. d.f. Mean Sq. F p
Temperature 121 1 121 0.92 0.3572
NMAS 2475.06 1 2475.06 18.89 0.0012
PG 282.24 1 282.24 2.15 0.1702
Loading rate 420.25 1 420.25 3.21 0.1008
Error 1441.44 11 131.04
Total 4740 15
Table C.3 Analysis of Variance of Energy Rate COV
Source Sum Sq. d.f. Mean Sq. F p
Temperature 51000 1 51000 30.01 0.0004
NMAS 18773.1 1 18773.1 11.05 0.0089
PG 6023.7 1 6023.7 3.55 0.0924
Loading rate 9208.5 1 9208.5 5.42 0.0449
Error 15292.5 11 1699.2
Total 82453.1 15
Table C.4 Analysis of Variance of Fracture Energy
Source Sum Sq. d.f. Mean Sq. F p
Temperature 773432.3 1 773432.3 30.33 0.0002
NMAS 9025 1 9025 0.35 0.5639
PG 15525.2 1 15525.2 0.61 0.4517
Loading rate 36614.8 1 36614.8 1.44 0.256
Error 280466.6 11 25497
Total 1115064 15

131
Table C.5 Analysis of Variance of Cohesive Energy
Source Sum Sq. d.f. Mean Sq. F p
Temperature 380103.1 1 380103.1 24.13 0.0005
NMAS 4512.5 1 4512.5 0.29 0.6032
PG 37529.4 1 37529.4 2.38 0.151
Loading rate 317.7 1 317.7 0.02 0.8896
Error 173291.1 11 15753.7
Total 595753.7 15
Table C.6 Analysis of Variance of Energy Rate
Source Sum
Sq. d.f. Mean Sq. F p
Temperature 229.523 1 229.523 8.01 0.0163
NMAS 11.902 1 11.902 0.42 0.5324
PG 26.522 1 26.522 0.93 0.3566
Loading rate 127.69 1 127.69 4.46 0.0584
Error 315.073 11 28.643
Total 710.71 15