quality of working life: parameters and evaluation in …
TRANSCRIPT
This paper may be copied, distributed, displayed, transmitted or adapted if provided, in a clear and explicit way, the name of the journal, the edition, the year and the pages on which the paper was originally published, but not suggesting that RAM endorses paper reuse. This licensing term should be made explicit in cases of reuse or distribution to third parties. It is not allowed the use for commercial purposes.Este artigo pode ser copiado, distribuído, exibido, transmitido ou adaptado desde que citados, de forma clara e explícita, o nome da revista, a edição, o ano e as páginas nas quais o artigo foi publicado originalmente, mas sem sugerir que a RAM endosse a reutilização do artigo. Esse termo de licenciamento deve ser explicitado para os casos de reutilização ou distribuição para terceiros. Não é permitido o uso para fins comerciais.
This is an open-access article distributed under the terms of the Creative Commons Attribution License.
QUALITY OF WORKING LIFE: PARAMETERS AND EVALUATION IN THE PUBLIC SERVICE
ISSN 1678-6971 (electronic version) • RAM, São Paulo, 20(3), eRAMG190134, 2019Human and Social Management, doi:10.1590/1678-6971/eRAMG190134
LEANDER L. KLEIN1
https://orcid.org/0000-0001-6075-6107
BRENO A. D. PEREIRA2
http://orcid.org/0000-0001-7387-5033
RICARDO B. LEMOS3
https://orcid.org/0000-0001-9804-2134
To cite this paper: Klein, L. L., Pereira, B. A. D., & Lemos, R. B. (2019). Quality of working life: Parameters and evaluation in the public service. Revista de Administração Mackenzie, 20(3). doi:10.15 90/1678-6971/eRAMG190134
Submission: Aug. 5, 2018. Acceptance: Oct. 31, 2018.
1 Universidade Federal de Santa Maria (UFSM), Palmeira das Missões, RS, Brazil.2 Universidade Federal de Santa Maria (UFSM), Santa Maria, RS, Brazil.3 Universidade Federal do Pampa (Unipampa), Bagé, RS, Brazil.
2
Leander L. Klein, Breno A. D. Pereira, Ricardo B. Lemos
ISSN 1678-6971 (electronic version) • RAM, São Paulo, 20(3), eRAMG190134, 2019doi:10.1590/1678-6971/eRAMG190134
ABSTRACT
Purpose: This study aims to analyze the parameters of the Quality of Working Life (QWL) evaluation in a public organization and the perception of the employees in relation to these factors.Originality/value: The article advances in the theoretical evaluation of QWL in a public context and expanding the presentation of parameters in the job environment. In practice, we present some behavior patterns in different groups of analysis. So, we deepen the understanding of assumptions and hypotheses already existing in theory and propose new ones regarding the standards of QWL.Design/methodology/approach: Ferreira’s (2011) model was taken as the basis for the development of empirical research. The method of this work is quantitative research, whose data collection was performed through the use of a questionnaire. The analysis of the data was performed mainly through the T and ANOVA tests.Findings: As the main results, it is possible to highlight the 9 factors obtained from the exploratory factorial analysis. In addition, there have been some different perceptions of groups of servers regarding these factors. From this, it is concluded that the evaluation of the QWL and its parameters is perceived differently between servers when they are grouped in groups with different characteristics.
KEYWORDS
Quality of working life. Evaluation. Parameters. Public service. Quanti-tative study.

Quality of working life: Parameters and evaluation in the public service
3
ISSN 1678-6971 (electronic version) • RAM, São Paulo, 20(3), eRAMG190134, 2019doi:10.1590/1678-6971/eRAMG190134
1. INTRODUCTION
The Quality of Working Life (QWL) was inserted in the organizational context and became an object of study in the academy in the early 1950s through the sociotechnical approach, but until now, the modern trends and challenges of society development determine the continued interest in the problem of the working life quality (Liliy et al., 2015). Employees are the “gears” of organizations with their skills, techniques, knowledge, and work achieving the good or service that enables organizations to go into their goals to the society and survive, and maintain a good working life is the base for better performance. The development of organizations depends on the people involved to reach their mission, goals, and results.
The fact is that new technologies, innovations in productive processes and the facility obtained for the exchange of knowledge generated greater competitiveness between the companies and, with that, there was a need for a restructuring of the productive processes, emphasizing the search for greater productivity. However, the productive environment was not able to absorb these changes without generating negative impacts on its employees. Both Campos (2016) and Ferreira (2016) emphasize that physical and psychological exhaustion, low self-esteem, pressure for results and dissatisfaction are inherent aspects of this new world of work, and thus the issue of QWL is highlighted and demands projects to seek solutions to these problems.
In the public sector, it is added to the foregoing collection of the company for better use of resources, better results, and transparency in the use of financial resources. In addition, people have become less passive regarding omissions in public services and activities. Siqueira and Mendes (2014) describe that in order to meet social demands, public organizations need to review and re-adjust procedures and management processes, especially in people management, which deals with the intellectual capital of institutions, since the way of working required, as well as interpersonal relationships, are no longer the same as it used to be.
The QWL addresses these issues while it is a comprehensive subject. Hereno and Fernandes (2013) conceptualize QWL as a field of study that includes living conditions in the work environment and encompasses aspects of well-being, health, physical, mental, social security and capacity to perform tasks with precision and good use of personal energy. Regarding the fields of study, Leite, Ferreira and Mendes (2009) mention that QWL is more used in

4
Leander L. Klein, Breno A. D. Pereira, Ricardo B. Lemos
ISSN 1678-6971 (electronic version) • RAM, São Paulo, 20(3), eRAMG190134, 2019doi:10.1590/1678-6971/eRAMG190134
the administration area, but it has already been studied in several other scientific fields such as engineering, medicine, ergonomics, ecology, psychology, economics, sociology, work psychodynamics, among others; all based on people, anchored in organizational psychology with humanistic thoughts. However, despite the extensive discussion and study of the issue of QWL, there is no common understanding of the factors that influence the formation and development of the QWL (Liliy et al., 2015). Along with that, Nanjundeswaraswamy and Swamy (2014) describe that there is a lack of awareness of QWL among employers and employees and other organizational groups, and argue that a QWL balance must be maintained effectively to ensure working potential to all employees and groups.
Considering these aspects and the apparent gap about the construction and parameters of the QWL, especially in terms of groups of one organization, this work has as objective to analyze what are the parameters of evaluation of the QWL in a public organization and the perception of the servants in relation to these factors.
The theme of QWL is a relevant issue on fostering employees’ commitment (Farid et al., 2015) and satisfaction (Albuquerque, Ferreira, Antloga, & Maia, 2015), to engage strategic human resource management (Jokinen and Heiskanen, 2013), to get greater working efficiency (Jahani et al., 2017), for involvement in group working arrangements or problem solving (Reddy and Reddy, 2013) and to reduce employee turnover intention (Mosadeghrad, 2013). Furthermore, there is a need for managers to rethink organizational practices, seeking to respond efficiently to the demands of the current situation, assuming a restructuring, mainly in terms of people management (Ferreira, Ferreira, Antloga, & Bergamaschi, 2009). This restructuring must aim at the well-being of public servants, but without putting apart the satisfaction of the citizen user with the provision of the service and the corresponding necessary effectiveness.
2. Quality of Working life
2.1 Concepts and early scholars
The QWL, as introduced earlier, is a comprehensive and under construction concept. There is not a single definition that encompasses all the elements of this object, especially in the different areas in which it is applied. For many authors, this is a subjective, dynamic and multifaceted
Quality of working life: Parameters and evaluation in the public service
5
ISSN 1678-6971 (electronic version) • RAM, São Paulo, 20(3), eRAMG190134, 2019doi:10.1590/1678-6971/eRAMG190134
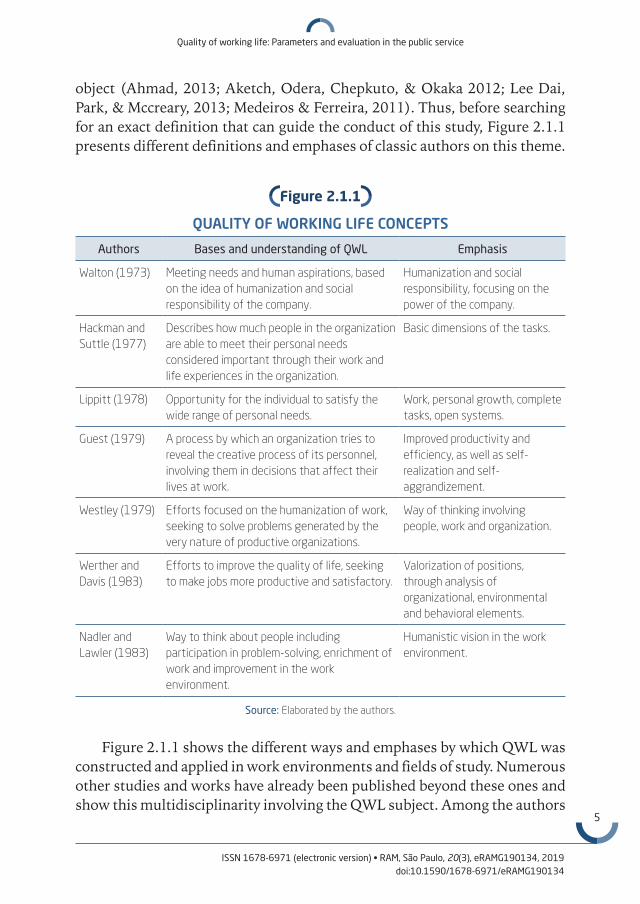
object (Ahmad, 2013; Aketch, Odera, Chepkuto, & Okaka 2012; Lee Dai, Park, & Mccreary, 2013; Medeiros & Ferreira, 2011). Thus, before searching for an exact definition that can guide the conduct of this study, Figure 2.1.1 presents different definitions and emphases of classic authors on this theme.
figure 2.1.1
QUALITY OF WORKING LIFE CONCEPTS
Authors Bases and understanding of QWL Emphasis
Walton (1973) Meeting needs and human aspirations, based on the idea of humanization and social responsibility of the company.
Humanization and social responsibility, focusing on the power of the company.
Hackman and Suttle (1977)
Describes how much people in the organization are able to meet their personal needs considered important through their work and life experiences in the organization.
Basic dimensions of the tasks.
Lippitt (1978) Opportunity for the individual to satisfy the wide range of personal needs.
Work, personal growth, complete tasks, open systems.
Guest (1979) A process by which an organization tries to reveal the creative process of its personnel, involving them in decisions that affect their lives at work.
Improved productivity and efficiency, as well as self-realization and self-aggrandizement.
Westley (1979) Efforts focused on the humanization of work, seeking to solve problems generated by the very nature of productive organizations.
Way of thinking involving people, work and organization.
Werther and Davis (1983)
Efforts to improve the quality of life, seeking to make jobs more productive and satisfactory.
Valorization of positions, through analysis of organizational, environmental and behavioral elements.
Nadler and Lawler (1983)
Way to think about people including participation in problem-solving, enrichment of work and improvement in the work environment.
Humanistic vision in the work environment.
Source: Elaborated by the authors.
Figure 2.1.1 shows the different ways and emphases by which QWL was constructed and applied in work environments and fields of study. Numerous other studies and works have already been published beyond these ones and show this multidisciplinarity involving the QWL subject. Among the authors
6
Leander L. Klein, Breno A. D. Pereira, Ricardo B. Lemos
ISSN 1678-6971 (electronic version) • RAM, São Paulo, 20(3), eRAMG190134, 2019doi:10.1590/1678-6971/eRAMG190134
mentioned in Figure 2.1.1, Walton (1973), has to be highlighted, he encouraged research on this subject. The author proposed in his investigations the approach of discussion about the balance between the personal and professional spheres and about the social role of the organization. Aquino and Fernandes (2013), and Limongi-França (2010) corroborates Walton when considering the importance of the quality of life to be referring to the human being in an integral way, in order to contemplate the biological, psychological, social and organizational domains.
For Ferreira (2016), the growing interest in QWL can be divided and based on three sets of guidelines for investigation of the topic:
• The social point of view: it brings together work in people’s lives and their diverse implications (economic, political, technological and cultural). It seeks to harmonize worker well-being and customer/citizen satisfaction without refraining from the imperatives of efficiency and effectiveness.
• The point of view of organizations: it uses and sees QWL as a way of understanding and combating or mitigating various problems existing in corporate environments.
• The academic point of view: it seeks to reflect on the role and field of intervention of the labor and health sciences, which is fundamental to the evolution of the classical QLT approach.
Regardless of how the QWL can be seen and divided to facilitate its understanding, it refers to the actions an employer makes, together with its employee, to contribute to the improvement of workers’ lives and their working environment. It is a combination of explicit and implicit benefits, tangible and intangible, that provide a good place to work (Royuela, Tamayo, & Suriñach, 2007).
According to Fernandes (1996), the QWL is a dynamic and contingent management of physical, technological and socio-psychological factors that affect culture and renew the organizational environment, reflecting the well-being of the worker and the productivity of companies, encompassing, besides legislative acts in favor of this worker, the service to human needs and aspirations, based on the idea of humanization of work and social responsibilities of the company. Thus, QWL can be defined as the search for the workers´ physical, mental and physical health in the performance of their duties. It can also be understood as the involvement of people, work and organizations in which the concern for the well-being of the worker and the efficiency of the organization are the most relevant aspects (Josiah, Odera, Chepkuto, & Okaka, 2012).

Quality of working life: Parameters and evaluation in the public service
7
ISSN 1678-6971 (electronic version) • RAM, São Paulo, 20(3), eRAMG190134, 2019doi:10.1590/1678-6971/eRAMG190134
Several characteristics inherent to public nature differentiate public sector organizations from private sector organizations when analyzed from the point of view of QWL programs. Public bureaucratic organizations are commonplace in the capitalist state since the modern world has been shaped and dominant until today. The Bureaucratic State creates social roles, norms, control, discipline, power, hierarchies, aiming at the growth and development of the State. For Weber (1978, p. 25), “bureaucratic administration is always observed under equal conditions and from a formal and technical perspective ... it is indispensable for meeting the needs of mass administration.”
In addition to the excess of bureaucratization, Prestes Motta and Bresser Pereira (1980) also comment on the tendency of the employees to resist the bureaucratic norms that impose a behavioral pattern. For the authors, this type of behavioral imposition is supported in the discipline, that is, in compliance with the rules of a rational-legal nature. However, this requirement of strict discipline on the part of the employees may conflict with their needs, with their values and beliefs, with the structure and norms of the primary social groups to which they belong.
2.2 Definitions and parameters in different groups
A variety of measures and dimensions of QWL were recently developed to measure the work-life issue in different contexts or groups, like for ‘healthy’ employees (Martel and Dupuis, 2006), particular occupations (nursing) (Brooks and Anderson, 2005; Silva et al., 2010; Kaya, 2011), cancer survivors (De Jong, Tamminga, Boer and Frings-Dresen, 2016), bank employees (Tamini, Yazdany and Bojd, 2011), between others. This specific areas and sites give us an understanding that QWL differs between groups and have different evaluations in different groups. Martel and Dupuis (2006) argued that QWL models consist of a complex set of organizational interventions or dimensions that drive a type of work life by the employees or group of employees. So these set of human considerations and groups take fundamental importance in QWL evaluation (Duyan et al., 2013). Beyond this, Sinha (2012) explains that the reason behind peoples’ different perception of QWL is different organizational experiences, various needs of the employees and job-related responses.
The fact is that the QWL is a precept of organizational management that is expressed by a set of norms, guidelines and practices within the framework of the conditions of the organization and socio-professional work relations, which aims to promote individual well-being and collective, in other words

8
Leander L. Klein, Breno A. D. Pereira, Ricardo B. Lemos
ISSN 1678-6971 (electronic version) • RAM, São Paulo, 20(3), eRAMG190134, 2019doi:10.1590/1678-6971/eRAMG190134
is the personal development of workers and the exercise of organizational citizenship in work environments (Ferreira, 2016). So, a set of independent variables affect QWL. Nanjundeswaraswamy and Swamy (2015) studied the demographic characteristic of employees such as designation, age, experience, gender, education and its relationship to QWL, and highlight the importance of specific opportunities to use and develop human capacities. The organization should be concerned with the employee in building and maintaining an organizational and working environment conducive to quality of life.
According to Sant’anna and Moraes (1999), it should be emphasized that the different models of QWL differ due to the dynamics of QWL approaches, varying according to the prevailing cultural values in each era and the prevailing socio-political-economic contexts. Ojedokun, Idemdia, and Desouza (2015) argue in favor of the study of QWL in specific groups to understand how it is related to employees’ commitment. Cordeiro and Pereira (2006) had studied different group’s job satisfaction delimited by socio-demographic variables to see how significant these variables are to understand this subject.
In the scope of the Brazilian public sector, these parameters or dimensions of QWL are little explored considering different groups of analysis and do not allow the understanding of factors that guide the QWL in different groups in one organization. In Brazil, one author who gained prominence with research on this subject was Ferreira, who published a model in 2011. His model is based on different indicators and structuring factors to evaluate the concept of QWL (as illustrated in Figure 2.2.1) and they were taken as the basis for the elaboration of our fieldwork instruments.
figure 2.2.1
STRUCTURING FACTORS FROM FERREIRA’S (2011) MODEL
Work organization
Socio-occupational relations of work
Recognition and professional
growth
Working conditions
Social work-life link
Source: Adapted from Ferreira (2011).
These structuring factors described in Figure 2.2.1 show the large constructs that we used in our study. The indicators and main variables are described as follows:
Quality of working life: Parameters and evaluation in the public service
9
ISSN 1678-6971 (electronic version) • RAM, São Paulo, 20(3), eRAMG190134, 2019doi:10.1590/1678-6971/eRAMG190134
• Working conditions: involve working conditions and organizational support like work equipment, raw material, physical space and organizational support such as information, remuneration, training and benefits policies.
• Work organization: these variables measure the adequacy of time, process and division of labor, as well as work management and standards of conduct that refer to supervision and inspection, hygiene skills and clothing.
• Socio-occupational relations of work: measure questions of hierarchical relationships, with peers and with the external public.
• Recognition and professional growth: embrace the evaluation of work recognition, commitment, dedication and professional growth, use of creativity, skills development, training, incentives, and career plans.
• Social work-life link: measure perceptions about pleasure and well-being at work, appreciation of time experienced in the organization, social usefulness, employer’s importance, personal and professional meaning, social life, work-home relationship, work-family relationship, work-friends relationship, and work-leisure relationship.
In his model, Ferreira analyzes QWL based on two analytical levels: analytical level of macro ergonomic diagnosis and micro ergonomic design. The macro ergonomic level refers to workers’ representations about the organizational context in which they are inserted. The micro ergonomic level, the understanding of the quality of life is deepened. If, to some extent, the macro-analytic level results in a broad “picture” of how workers cognitively represent the constituents of quality of life at the micro level, the model allows us to investigate the impacts produced by these factors and the ways which workers deal with the demands that arise from the contexts of their work activities (Ferreira, 2011). His model is published in a new edition (Ferreira, 2016).
3. MethoD of investigation
The method of this work consists of a survey type research carried out through the use of a questionnaire. The questionnaire was composed of fifty-six questions that allowed the evaluation of the servers’ perception of QWL. The questionnaire was elaborated based on the five structuring factors of Ferreira’s (2011) model, showed in Figure 2.2.1. Additionally, some questions were elaborated to ascertain the profile of the respondents.
10
Leander L. Klein, Breno A. D. Pereira, Ricardo B. Lemos
ISSN 1678-6971 (electronic version) • RAM, São Paulo, 20(3), eRAMG190134, 2019doi:10.1590/1678-6971/eRAMG190134
The research was carried out at a federal university in the interior of the state of Rio Grande do Sul and, for its accomplishment, it was stipulated as the population of this study the teaching staff and administrative technicians of that institution. The total of this population was composed, at the time of the research, of a group of 780 teachers and 670 administrative technicians. The questionnaires were sent to the servers in random order.
In relation to the sample, the same was calculated considering an error of 5%, therefore, the sample required for the representativeness of the population is 304 servers. However, as the questionnaires were sent to a much larger number of servers (due to the expectation of return is not great), 474 questionnaires were answered, which corresponds to a sample error of 4.59%.
For the measurement of the opinion of the servers, a five-point Likert-type scale was used, with which respondents could express their opinion regarding the assertions of the questionnaire as follows: 1. Totally disagree, 2. Partially disagree, 3. Indifferent, 4. Partially agree, and 5. Strongly agree.
Data analysis was performed using descriptive statistics and multivariate statistics. The software Microsoft Excel and Statistical Package for Social Sciences (SPSS 18.0) were used to organize, measure and perform the desired tests. With the tabulated data, the descriptive analysis of the characterization variables of the respondents was carried out in order to obtain the sample profile. Subsequently, the exploratory factorial analysis was performed to gather the data and obtain factors for analysis. Finally, T and ANOVA tests were performed for more specific analyzes on how the QWL guiding factors in the public organization studied were behaving.
4. analysis of results anD iMpliCations
This topic of results analysis is divided into three stages. Characterization aspects of the sample studied were initially described. In the second part, the procedures adopted in the application of the exploratory factor analysis relative to the fifty-six questions about QWL extracted from Ferreira’s model (2016) are explained and displayed. Finally, the obtained results from the application of T and ANOVA tests with the constructs found in the exploratory factorial were analyzed and discussed.
4.1 Characteristics and profile of the sample
The sample investigated, as previously mentioned, was composed of 474 respondents between teachers and administrative technicians of the

Quality of working life: Parameters and evaluation in the public service
11
ISSN 1678-6971 (electronic version) • RAM, São Paulo, 20(3), eRAMG190134, 2019doi:10.1590/1678-6971/eRAMG190134
institution where the study was conducted. It was observed some aspects that could specify and summarize the sample investigated. These aspects are presented in Figure 4.1.1.
figure 4.1.1
RESPONDENTS PROFILE
Variable Alternative Percentual
SexMale 50.80%
Female 49.20%
Age group
18 to 30 years 25.90%
31 to 40 years 44.90%
41 to 50 years 20.50%
Over 50 years 8.60%
Education level
Medium 4.40%
Graduate 17.10%
Specialization 31.00%
Master degree 18.80%
Doctorate degree 28.70%
University service time
Up to 6 months 16.50%
Up to 1 year 8.00%
Up to 3 years 19.40%
Up to 5 years 34.80%
Above 5 years 21.30%
Total time in the public service
Up to 6 months 9.30%
Up to 1 year 4.90%
Up to 3 years 15.00%
Up to 5 years 27.40%
Above 5 years 43.50%
Holds a post of university management
Yes 21.90%
No 78.10%
Source: Elaborated by the authors.
12
Leander L. Klein, Breno A. D. Pereira, Ricardo B. Lemos
ISSN 1678-6971 (electronic version) • RAM, São Paulo, 20(3), eRAMG190134, 2019doi:10.1590/1678-6971/eRAMG190134
The university in question in this study was created by Reuni, so the people from there have little time to work on it. This explains why almost 80% of the servers have up to 5 years of university work, as can be seen in Figure 4.1.1. Even so, another fact that draws attention to the profile of these respondents is the percentage of them who already have some qualification beyond (78.5%) and this is related to the different perceptions about QWL, as it will be specified below. In general, they are more educated and more critical people about QWL.
4.2 Description and analysis of obtained factors on QWl
This topic deals with the acquisition of factors on QWL from the data collected for research and resulting from the exploratory factorial analysis. The first step of the factorial analysis consisted of calculations regarding the adequacy of the factorial analysis for the data collected. The Bartlett and KMO (Kaiser-Meyer-Olkin) sphericity tests were performed, which are statistical tests that allow identifying the quality of the correlations between the variables, indicating if the researcher should proceed with the factorial analysis (Pestana & Gageiro, 2008). The results were as follows: 0.919 for the KMO and 0.000 for the Bartlett Sphericity test. Thus, both tests indicate the factor of the data and the application of the factorial analysis.
As a second step in the realization of the exploratory factorial, we performed the identification of the commonalities presented in each of the constituent questions of the research instrument. For Hair et al. (2009) variables with values lower than 0.5 for this measure should be removed from the instrument. For this reason, 6 questions were collected from the set of data collected for the subsequent factorial realization.
Varimax mode was used for rotation of the factor, and to specify the number of factors the criteria of Eigenvalue was adopted. Based on this criteria, factors with an eigenvalue greater than one were adopted as a measure of estimation. With these decisions for factorial rotation, we obtained nine factors that explain 65.68% of the total data variance.
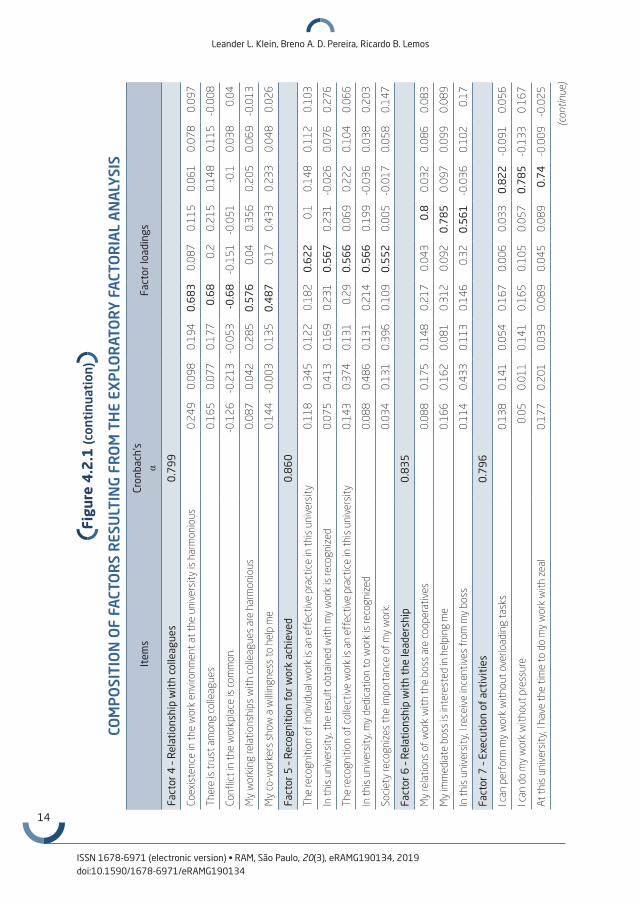
Nine factors were obtained as a result of the factorial, which is shown in Figure 4.2.1. In this table, Cronbach’s Alpha values are also exposed to each of the factors.

Quality of working life: Parameters and evaluation in the public service
13
ISSN 1678-6971 (electronic version) • RAM, São Paulo, 20(3), eRAMG190134, 2019doi:10.1590/1678-6971/eRAMG190134
Item
sCr
onba
ch’s
α
Fact
or lo
adin
gs
Fact
or 1
– Ph
ysic
al s
pace
0.8
60
The
wor
kpla
ce is
com
fort
able
0.8
19
0.18
90.
072
0.18
1-0
.01
0.06
50.
107
00.
131
The
wor
ksta
tion
is s
uita
ble
for t
he t
asks
0.8
11
0.13
10.
136
0.11
40.
019
0.06
70.
081
0.03
80.
053
The
phys
ical
spa
ce to
per
form
my
wor
k is
sat
isfa
ctor
y0.
756
0.15
40.
088
0.12
9-0
.068
0.14
10.
078
-0.0
350.
05
The
light
ing
leve
l is
suff
icie
nt to
car
ry o
ut t
he a
ctiv
ities
0.7
28
0.08
90.
108
0.11
70.
188
-0.0
540.
002
0.03
20.
103
The
room
tem
pera
ture
is c
omfo
rtab
le0
.69
30.
083
-0.0
590.
186
0.06
10.
025
0.05
8-0
.001
0.04
6
The
inst
rum
ents
of
labo
r are
suf
ficie
nt to
car
ry o
ut t
he t
asks
0.5
46
-0.0
020.
14-0
.16
0.24
30.
344
0.21
60.
045
-0.1
15
Cons
umpt
ion
mat
eria
l is
suff
icie
nt0
.50
7-0
.063
0.07
4-0
.105
0.41
50.
349
0.13
-0.0
11-0
.202
Fact
or 2
– O
ppor
tuni
ties
for
pro
fess
iona
l gro
wth
0.8
75
The
univ
ersi
ty o
ffer
s op
port
uniti
es fo
r pro
fess
iona
l gro
wth
0.12
20
.76
50.
221
-0.0
140.
235
0.05
40.
095
0.08
20.
072
The
pers
onal
dev
elop
men
t is
a re
al p
ossi
bilit
y in
the
uni
vers
ity0.
120
.74
70.
299
0.12
50.
151
0.10
10.
156
0.02
40.
103
Ther
e ar
e in
cent
ives
for c
aree
r gro
wth
0.17
50
.71
0.26
10.
049
0.19
90.
055
0.17
90.
087
-0.0
73
Man
agem
ent
beha
vior
is c
hara
cter
ized
by
dial
ogue
0.20
70
.57
30.
120.
223
0.11
0.28
0.10
10.
052
0.27
5
Reco
gniti
on b
y th
e in
stitu
tion
whe
re I
wor
k0.
145
0.5
35
0.30
70.
224
0.47
70.
117
0.04
-0.0
160.
191
Fact
or 3
– Jo
b sa
tisf
acti
on0
.88
2
At t
his
univ
ersi
ty, t
he a
ctiv
ities
I do
are
sou
rces
of
plea
sure
0.11
70.
184
0.7
56
0.15
30.
072
-0.0
020.
102
0.06
90.
226
The
time
I spe
nd a
t un
iver
sity
mak
es m
e ha
ppy
0.12
10.
268
0.7
35
0.24
60.
086
0.1
0.09
40.
001
0.15
7
I fee
l tha
t m
y w
ork
at t
his
univ
ersi
ty is
goo
d fo
r me
0.15
30.
241
0.7
10.
257
0.13
70.
109
0.18
-0.0
110.
193
I lik
e th
e in
stitu
tion
whe
re I
wor
k.0.
018
0.06
30
.69
7-0
.065
0.18
10.
112
-0.0
240.
141
-0.0
1
figu
re 4
.2.1
COM
PO
SITI
ON
OF
FACT
OR
S R
ESU
LTIN
G F
RO
M T
HE
ExP
LOR
ATO
RY
FA
CTO
RIA
L A
NA
LYSI
S
(con
tinue
)
14
Leander L. Klein, Breno A. D. Pereira, Ricardo B. Lemos
ISSN 1678-6971 (electronic version) • RAM, São Paulo, 20(3), eRAMG190134, 2019doi:10.1590/1678-6971/eRAMG190134
figu
re 4
.2.1
(con
tinu
atio
n)
COM
PO
SITI
ON
OF
FACT
OR
S R
ESU
LTIN
G F
RO
M T
HE
ExP
LOR
ATO
RY
FA
CTO
RIA
L A
NA
LYSI
S
(con
tinue
)
Item
sCr
onba
ch’s
α
Fact
or lo
adin
gs
Fact
or 4
– R
elat
ions
hip
wit
h co
lleag
ues
0.7
99
Coex
iste
nce
in t
he w
ork
envi
ronm
ent
at t
he u
nive
rsity
is h
arm
onio
us0.
249
0.09
80.
194
0.6
83
0.08
70.
115
0.06
10.
078
0.09
7
Ther
e is
tru
st a
mon
g co
lleag
ues
0.16
50.
077
0.17
70
.68
0.2
0.21
50.
148
0.11
5-0
.008
Conf
lict
in t
he w
orkp
lace
is c
omm
on.
-0.1
26-0
.213
-0.0
53-0
.68
-0.1
51-0
.051
-0.1
0.03
80.
04
My
wor
king
rela
tions
hips
with
col
leag
ues
are
harm
onio
us0.
087
0.04
20.
285
0.5
76
0.04
0.35
60.
205
0.06
9-0
.013
My
co-w
orke
rs s
how
a w
illin
gnes
s to
hel
p m
e0.
144
-0.0
030.
135
0.4
87
0.17
0.43
30.
233
0.04
80.
026
Fact
or 5
– R
ecog
niti
on f
or w
ork
achi
eved
0.8
60
The
reco
gniti
on o
f in
divi
dual
wor
k is
an
effe
ctiv
e pr
actic
e in
thi
s un
iver
sity
0.11
80.
345
0.12
20.
182
0.6
22
0.1
0.14
80.
112
0.10
3
In t
his
univ
ersi
ty, t
he re
sult
obta
ined
with
my
wor
k is
reco
gniz
ed0.
075
0.41
30.
169
0.23
10
.56
70.
231
-0.0
260.
076
0.27
6
The
reco
gniti
on o
f co
llect
ive
wor
k is
an
effe
ctiv
e pr
actic
e in
thi
s un
iver
sity
0.14
30.
374
0.13
10.
290
.56
60.
069
0.22
20.
104
0.06
6
In t
his
univ
ersi
ty, m
y de
dica
tion
to w
ork
is re
cogn
ized
0.08
80.
486
0.13
10.
214
0.5
66
0.19
9-0
.036
0.03
80.
203
Soci
ety
reco
gniz
es t
he im
port
ance
of
my
wor
k.0.
034
0.13
10.
396
0.10
90
.55
20.
005
-0.0
170.
058
0.14
7
Fact
or 6
– R
elat
ions
hip
wit
h th
e le
ader
ship
0.8
35
My
rela
tions
of
wor
k w
ith t
he b
oss
are
coop
erat
ives
0.08
80.
175
0.14
80.
217
0.04
30
.80.
032
0.08
60.
083
My
imm
edia
te b
oss
is in
tere
sted
in h
elpi
ng m
e0.
166
0.16
20.
081
0.31
20.
092
0.7
85
0.09
70.
099
0.08
9
In t
his
univ
ersi
ty, I
rece
ive
ince
ntiv
es f
rom
my
boss
0.11
40.
433
0.11
30.
146
0.32
0.5
61
-0.0
360.
102
0.17
Fact
or 7
– Ex
ecut
ion
of a
ctiv
itie
s0
.79
6
I can
per
form
my
wor
k w
ithou
t ov
erlo
adin
g ta
sks
0.13
80.
141
0.05
40.
167
0.00
60.
033
0.8
22
-0.0
910.
056
I can
do
my
wor
k w
ithou
t pr
essu
re0.
050.
011
0.14
10.
165
0.10
50.
057
0.7
85
-0.1
330.
167
At t
his
univ
ersi
ty, I
hav
e th
e tim
e to
do
my
wor
k w
ith z
eal
0.17
70.
201
0.03
90.
089
0.04
50.
089
0.7
4-0
.009
-0.0
25
Quality of working life: Parameters and evaluation in the public service
15
ISSN 1678-6971 (electronic version) • RAM, São Paulo, 20(3), eRAMG190134, 2019doi:10.1590/1678-6971/eRAMG190134
figu
re 4
.2.1
(con
clus
ion)
COM
PO
SITI
ON
OF
FACT
OR
S R
ESU
LTIN
G F
RO
M T
HE
ExP
LOR
ATO
RY
FA
CTO
RIA
L A
NA
LYSI
S
Item
sCr
onba
ch’s
α
Fact
or lo
adin
gs
Fact
or 8
– Pe
rfor
man
ce a
nd re
sult
s ev
alua
tion
0.6
82
In t
his
univ
ersi
ty, t
here
is a
str
ong
colle
ctio
n of
resu
lts-0
.005
-0.0
320.
012
-0.0
340.
055
-0.0
07-0
.124
0.7
67
0.02
2
Ther
e is
per
form
ance
mon
itorin
g0.
053
0.17
2-0
.04
0.04
70.
034
0.16
60.
175
0.6
98
0.09
1
The
norm
s to
car
ry o
ut t
he t
asks
are
rigi
d-0
.06
-0.0
12-0
.005
0.16
10.
102
-0.0
1-0
.092
0.6
85
-0.0
59
Ther
e is
a c
olle
ctio
n of
dea
dlin
es fo
r the
ful
fillm
ent
of t
he t
ask
0.07
0.10
80.
259
-0.0
23-0
.032
0.09
2-0
.128
0.6
54
-0.0
95
Fact
or 9
– Fr
eedo
m in
the
wor
k en
viro
nmen
t0
.68
8
I hav
e fr
eedo
m in
the
exe
cutio
n of
tas
ks0.
118
0.15
70.
214
0.04
50.
203
0.04
30.
131
-0.1
040
.75
6
I hav
e th
e po
ssib
ility
of
bein
g cr
eativ
e in
my
wor
k0.
033
0.09
80.
411
-0.1
330.
186
0.10
90.
070.
017
0.6
85
At t
his
univ
ersi
ty, I
hav
e fr
ee a
cces
s to
the
top
man
agem
ent
0.19
20.
484
0.03
0.11
40.
024
0.12
80.
038
0.05
20
.49
1
Sour
ce: E
labo
rate
d by
the
aut
hors
.

16
Leander L. Klein, Breno A. D. Pereira, Ricardo B. Lemos
ISSN 1678-6971 (electronic version) • RAM, São Paulo, 20(3), eRAMG190134, 2019doi:10.1590/1678-6971/eRAMG190134
Regarding the factors presented in Figure 4.2.1, Factor 1, called “Physical space”, is composed of 7 variables that refer to the physical conditions of the work environment, the instruments and materials available to it, for the execution of the activities. Many of the variables of this factor are in line with Walton’s (1973) study, which highlights the importance of a safe, healthy, and salubrious environment for QWL.
Factor 2 (Opportunities for Professional Growth), in turn, presents 5 variables related to the possibilities of personal development and career growth. Regarding the variables of this factor, personal development and professional growth are necessary for the individual to have the opportunity to satisfy their personal needs, being essential for the QWL (Lippitt, 1978).
Factor 3, called “Job Satisfaction” consists of four variables that evaluate how well the individual feels pleasure and is happy where he or she works. Given the set of variables of this factor, job satisfaction can be understood as a measure of how much people enjoy their work and value it as something that gives them pleasure (Spector, 2003).
The denomination of Factor 4 of “Relationship with Colleagues” is due to the fact that it is composed of 4 variables that evaluate the relationship of the servers with their co-workers. This factor is similar to what Silva and Ferreira (2013) called “an interpersonal relationship with co-workers” or containing statements associated with the quality of the relationships between employees in the work environment. This factor directs the quality in the work environment, involving people with whom the worker is involved in the execution of the work.
Factor 5, “Recognition for Work Achieved”, was so named because it is composed of 4 variables that evaluate how much the person is recognized by the effort, dedication and activities performed. The variables that guided the determination of this factor refer to the notion of recognition, and this has its importance emphasized already in precursory theories of motivation and human needs, such as Herzberg’s theory of hygienic factors and in Maslow’s pyramid, therefore its necessity in the study of QWL.
In turn, Factor 6 “Relationship with the Leadership” is composed of 3 variables that indicate how the relation of the servants with their leaders is. Fernandes (1996), in his study on QWL, similarly named a factor to identify satisfaction in the relationship between superior and subordinate. The said author named the factor “Relation Leader-Employee”. This is in line with this article and shows that the relationship of an individual to his or her leadership is an inherent factor in QWL since they are elements that interfere with the person´s daily life.
Quality of working life: Parameters and evaluation in the public service
17
ISSN 1678-6971 (electronic version) • RAM, São Paulo, 20(3), eRAMG190134, 2019doi:10.1590/1678-6971/eRAMG190134
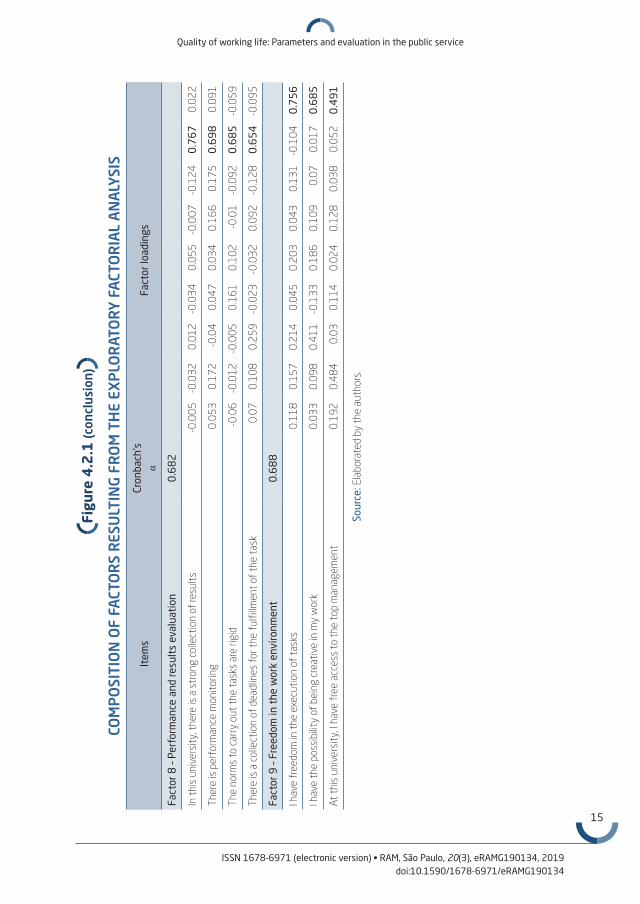
Factor 7, named “Execution of Activities”, is composed of three variables that evaluate the amount and time the server has to perform his/her activities. This factor interferes with the QWL as it assesses the amount of work to be performed and the time to perform these activities.
Factor 8, called “Performance and Results Evaluation”, consists of 4 variables that refer to the degree of collection and inspection by results in the work of the servers. Performance evaluation is a common practice in most companies, especially public educational institutions, as it is the case of this research. This evaluation aims to verify the most problematic aspects of the execution of one person´s activities, in order to improve the performance of his/her service and increase his/her performance. Werther and Davis (1983) studied this in the proposition of their model out to be established a suitable methodology for achievement and benchmarking of the desired performance.
Finally, Factor 9, “Freedom in the Work Environment”, is composed of 3 variables that refer to the autonomy of the server to perform his/her activities. This factor, in a specific way, involves and evaluates the autonomy during the execution of the tasks by an individual, and can be understood as the degree to which the task gives individuals the freedom to plan and execute their activities (Hackman and Suttle, 1977). This factor generates satisfaction and motivation for the worker because it is a stimulator to the accomplishment of the activities according to the knowledge of each person, besides providing opportunities of improvement coming from the individual himself in the workplace.
Specifically, the theoretical notes and explanations made for each factor justify the nomenclature given to them and point out the importance of each of them for the evaluation of QWL.In the following, the results will be described by the accomplishment and analysis of the specific tests carried out with these factors.
4.3 analysis of QWl factors
In this part of the article, a series of multivariate tests were performed with the factors obtained in the exploratory factorial analysis (section 4.2 of the article) and data of characteristics of the sample profile (section 4.1 of the article). The discussion about each of the tests will allow us to analyze the factors that guide QWL in a public organization, the objective of this article.
Initially, the T-test was performed for independent samples with the groups of men and women. With this test, we can check if there is a difference
18
Leander L. Klein, Breno A. D. Pereira, Ricardo B. Lemos
ISSN 1678-6971 (electronic version) • RAM, São Paulo, 20(3), eRAMG190134, 2019doi:10.1590/1678-6971/eRAMG190134
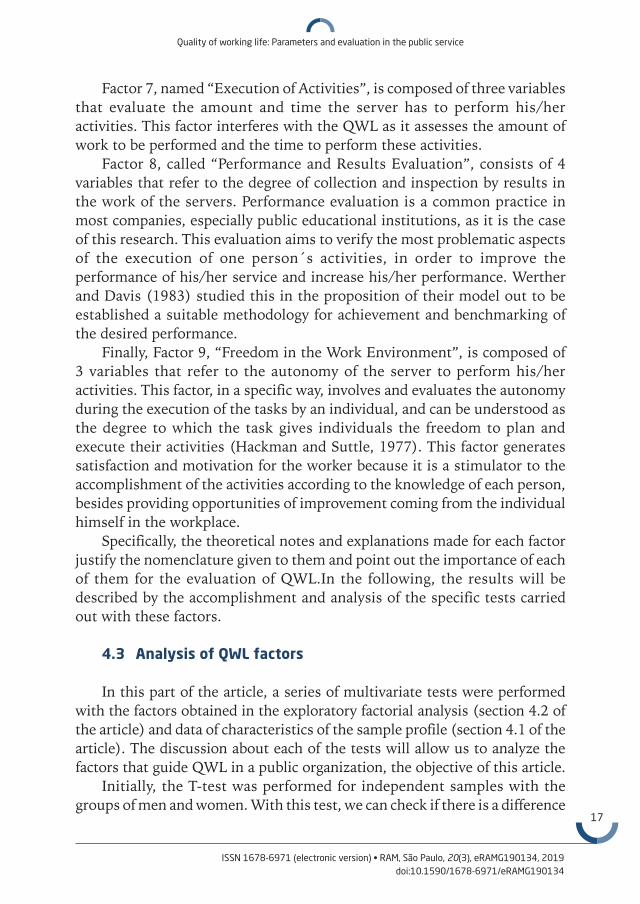
between the averages presented for some factors in relation to these two groups. The results of this test are presented in Figure 4.3.1.
figure 4.3.1
T-TEST FOR MEN AND WOMEN GROUPS
QWL FactorsMens Women T-Test
Average Deviation Average Deviation Value Sig
Physical space 3.39 1.05 3.50 0.99 -1.113 0.266
Opportunities for professional growth 3.18 1.10 3.37 1.00 -2.044 0.042
Job satisfaction 3.76 1.04 4.00 0.88 -2.852 0.005
Relationship with colleagues 3.70 0.92 3.87 0.76 -2.312 0.021
Recognition for work achieved 2.88 1.02 3.03 0.97 -1.628 0.104
Relationship with the leadship 3.73 0.97 3.91 1.00 -1.950 0.052
Execution of activities 3.64 1.01 3.68 1.02 -0.495 0.621
Performance and results evaluation 2.95 0.87 3.10 0.82 -1.937 0.053
Freedom in the work environment 3.82 0.91 3.80 0.91 0.228 0.820
Source: Elaborated by the authors.
Figure 4.3.1 shows that three factors (“Professional Growth Opportunity”, “Work Satisfaction” and “Relationship with colleagues”) present differences of significant averages for the two groups analyzed. In addition, the female group was found to have higher values for all three factors, which means that women have a more positive perception of them than men. More specifically, women attributed an average value of 3.37 for the factor “Professional Growth Opportunity”, while men, 3.18.
This result is related to the fact that, in recent years, women have sought academic and professional training at as high or even higher levels than men. Campos (2016) found this relationship in his work. He explains that women hold higher degrees than men when it comes to higher-level positions. This search for the recent professional improvement of women has generated them the highest perception of the opportunity for professional growth which, according to Bilgiç (1998), is explained by the expectation generated by higher levels of education.
As shown also in Figure 4.3.1, the responses of women were also higher for the factors of Job Satisfaction and Relations with Colleagues. On this difference for these two factors between men and women and the higher
Quality of working life: Parameters and evaluation in the public service
19
ISSN 1678-6971 (electronic version) • RAM, São Paulo, 20(3), eRAMG190134, 2019doi:10.1590/1678-6971/eRAMG190134
averages presented by the latter, an explanation can be found in the work of Moraes, Pereira, Souza, & Guzmão (2003), in which the authors address the gender implications of quality of life and stress at work. According to them, women perceive QWL better in relation to items and intrinsic characteristics of work, such as social life at work and social integration. Thus, women are generally more responsive and value their relationships with colleagues and their impact on job satisfaction.
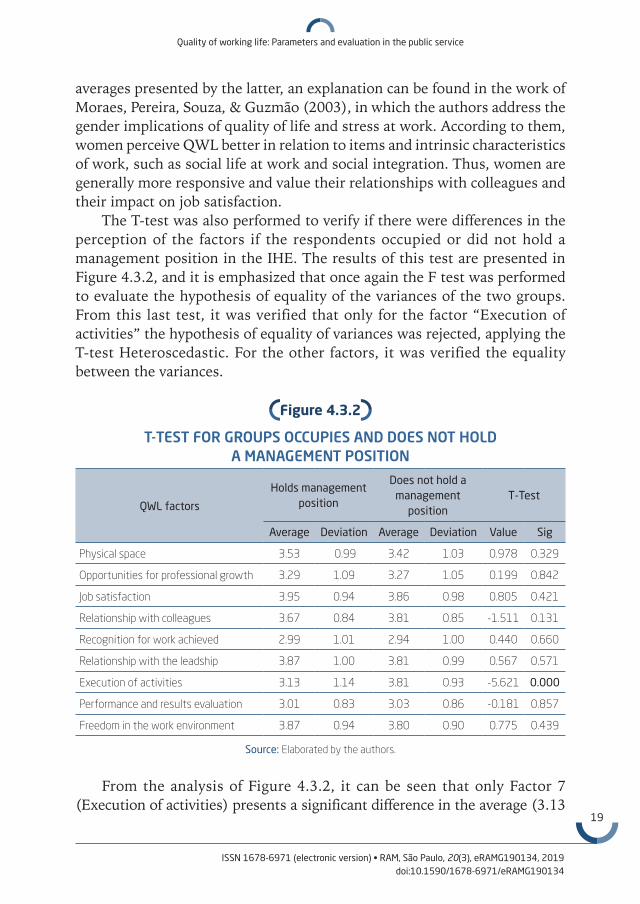
The T-test was also performed to verify if there were differences in the perception of the factors if the respondents occupied or did not hold a management position in the IHE. The results of this test are presented in Figure 4.3.2, and it is emphasized that once again the F test was performed to evaluate the hypothesis of equality of the variances of the two groups. From this last test, it was verified that only for the factor “Execution of activities” the hypothesis of equality of variances was rejected, applying the T-test Heteroscedastic. For the other factors, it was verified the equality between the variances.
figure 4.3.2
T-TEST FOR GROUPS OCCUPIES AND DOES NOT HOLD A MANAGEMENT POSITION
QWL factors
Holds management position
Does not hold a management
positionT-Test
Average Deviation Average Deviation Value Sig
Physical space 3.53 0.99 3.42 1.03 0.978 0.329
Opportunities for professional growth 3.29 1.09 3.27 1.05 0.199 0.842
Job satisfaction 3.95 0.94 3.86 0.98 0.805 0.421
Relationship with colleagues 3.67 0.84 3.81 0.85 -1.511 0.131
Recognition for work achieved 2.99 1.01 2.94 1.00 0.440 0.660
Relationship with the leadship 3.87 1.00 3.81 0.99 0.567 0.571
Execution of activities 3.13 1.14 3.81 0.93 -5.621 0.000
Performance and results evaluation 3.01 0.83 3.03 0.86 -0.181 0.857
Freedom in the work environment 3.87 0.94 3.80 0.90 0.775 0.439
Source: Elaborated by the authors.
From the analysis of Figure 4.3.2, it can be seen that only Factor 7 (Execution of activities) presents a significant difference in the average (3.13

20
Leander L. Klein, Breno A. D. Pereira, Ricardo B. Lemos
ISSN 1678-6971 (electronic version) • RAM, São Paulo, 20(3), eRAMG190134, 2019doi:10.1590/1678-6971/eRAMG190134
for those who hold management positions and 3.81 for those who do not hold management positions). An explanation for the difference of average of these two groups regarding this factor is in the variables that compose it, namely: 1. Execution of the work without overloading of tasks, 2. Performing the work without pressure and 3. Time to the job. These variables had a lower average for the respondents who hold a management position, that is, these people disagreed to a greater degree of these variables than the people who did not occupy a management position. This fact is understandable since individuals with management positions in IHE engage in activities of the organization, management and monitoring of the sector they work in, thus reducing the time to perform other routine activities that they performed before assuming the management position.
Another test was ANOVA, to verify the significance between the ranges in relation to the groups formed by the age group of the respondents. Figure 4.3.3 shows the obtained results for this test.
figure 4.3.3
ANOVA FOR AGE GROUPS
QWL factors
Mean age of respondents F Test
18 to 30 years
31 to 40 years
41 to 50 years
More than 50 years
Value Sig
Physical space 3.44 3.45 3.47 3.36 0.117 0.950
Opportunities for professional growth 3.19 3.21 3.42 3.50 1.722 0.162
Job satisfaction 3.68 3.90 4.02 4.10 3.186 0.024
Relationship with colleagues 3.83 3.81 3.66 3.76 0.886 0.448
Recognition for work achieved 2.95 2.89 3.05 3.03 0.708 0.548
Relationship with the leadship 3.78 3.77 3.96 3.85 0.876 0.454
Execution of activities 3.81 3.55 3.56 4.01 3.625 0.013
Performance and results evaluation 3.03 3.05 2.97 3.04 0.186 0.906
Freedom in the work environment 3.67 3.82 3.89 3.98 1.779 0.150
Source: Elaborated by the authors.
When analyzing Figure 4.3.3, it can be verified that two factors present significant differences in relation to the age range of the respondents, they are: “Satisfaction in the work and Execution of activities”. As for the first of these factors, it is observed that the higher the number of employees, the better their evaluation of the satisfaction items at work. This result is in line
Quality of working life: Parameters and evaluation in the public service
21
ISSN 1678-6971 (electronic version) • RAM, São Paulo, 20(3), eRAMG190134, 2019doi:10.1590/1678-6971/eRAMG190134
with the study by Herrera and Manrique (2008), who verified that the greater the age, the higher the job satisfaction. This relationship was also verified previously by Clark, Oswald, and Warr (1996), and Almeida and Figueiredo (2002), when concluding in their studies that individuals belonging to higher age groups demonstrated a higher level of satisfaction than that presented by people with a range of intermediate age. Part of the explanation for this fact can be found in this paper. The variables “In this university, the activities that I perform are sources of pleasure” and “The time I work in the university makes me happy”, which have the greatest importance in the formation of this factor, help to understand the perception of the respondents regarding their satisfaction in the job. That is, the older the people, the happier they are and feel happy to work at that institution, which impacts their job satisfaction.
Regarding the execution of the activities, a different fact occurs: in the age group “from 18 to 30 years” and “over 50”, there is a higher average of this factor than in the ranges “from 31 to 40 years” and “from 41 to 50 years”. In the literature on the subject, no explanation or similar result was found. However, when analyzing the variables that made up this “activity execution” factor, it was verified that the variable “in this university, I have the time to execute my work with zeal” also showed a significant difference between the age groups. If compared, this variable specifically denotes that a greater load of activities is assimilated by people between 31 and 50 years old, even if they are in a public job, where the activities are job-specific and do not presuppose a difference in the age of the people who occupy them.
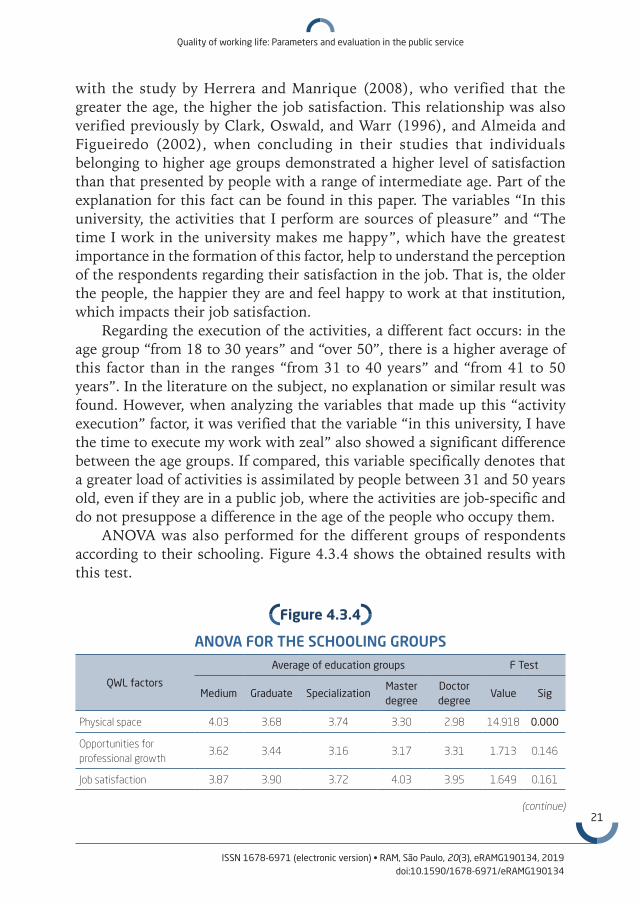
ANOVA was also performed for the different groups of respondents according to their schooling. Figure 4.3.4 shows the obtained results with this test.
figure 4.3.4
ANOVA FOR THE SCHOOLING GROUPS
QWL factors
Average of education groups F Test
Medium Graduate SpecializationMaster degree
Doctor degree
Value Sig
Physical space 4.03 3.68 3.74 3.30 2.98 14.918 0.000
Opportunities for professional growth
3.62 3.44 3.16 3.17 3.31 1.713 0.146
Job satisfaction 3.87 3.90 3.72 4.03 3.95 1.649 0.161
(continue)

22
Leander L. Klein, Breno A. D. Pereira, Ricardo B. Lemos
ISSN 1678-6971 (electronic version) • RAM, São Paulo, 20(3), eRAMG190134, 2019doi:10.1590/1678-6971/eRAMG190134
QWL factors
Average of education groups F Test
Medium Graduate SpecializationMaster degree
Doctor degree
Value Sig
Relationship with colleagues
4.08 4.14 3.91 3.67 3.47 10.973 0.000
Recognition for work achieved
3.31 3.09 2.98 2.85 2.84 1.752 0.137
Relationship with the leadship
4.14 4.06 3.91 3.76 3.57 4.495 0.001
Execution of activities 4.32 3.85 3.86 3.58 3.28 9.745 0.000
Performance and results evaluation
3.05 3.09 3.00 3.10 2.96 0.522 0.719
Freedom in the work environment
3.76 3.70 3.75 3.80 3.96 1.497 0.202
Source: Elaborated by the authors.
With the realization of the ANOVA for the groups formed by the respondents’” schooling, it was verified that in four factors there is a significant difference in the averages. Another fact that can be observed in Figure 4.3.4 is that all these factors, in which there is a significant difference in the average for the answers, decrease the higher the level of schooling. The first of these factors is Physical Space. Theoretically, no explanation was found for this difference in the average. However, when analyzing the issues of greater weight for the composition of this factor (see Crombach’s Alpha), there are aspects such as the comfort and adequacy of the environment to perform the activities, as well as the physical space itself. In relation to these aspects, it can be seen (according to the results in Figure 4.3.4) that satisfaction decreases as schooling levels increase. This is related to teaching, research and extension activities that are carried out by people with higher degrees in universities, where the perception of space limitation increases.
Regarding the relationship factors with the peers and the relationship with the bosses, the decrease in the average for the answers for those groups whose education is higher is linked to facts such as the search for power and the misuse of this by some individuals. In universities it is usual for professors to take management positions that give them power and influence in the social or institutional environment, but according to Batomé’s (1992) explanations, gaps in teacher training often lead them to act on others and
figure 4.3.4 (conclusion)
ANOVA FOR THE SCHOOLING GROUPS
Quality of working life: Parameters and evaluation in the public service
23
ISSN 1678-6971 (electronic version) • RAM, São Paulo, 20(3), eRAMG190134, 2019doi:10.1590/1678-6971/eRAMG190134
on the institution, way to consolidate issues in the short term and not what is worth in the long run. Moreover, many use the period in which they are in “charge” to carry out their “wills” and “attack or persecute” colleagues with whom they do not have a good relationship. Another aspect is related to some points explained in the work of Lemos (2011), as the multiplicity of tasks, the contradictions among training and the demands of the university system, work overload and its consequences, such as the absence of leisure, loss of control about the academic project and illness. All these factors lead to a level of personal tension that inflames the relationship between peers and bosses in educational institutions.
The discussion in the previous paragraph is also related to the difference of average verified in the activity execution factor. The multiplicity of activities aimed at teachers and the difficulty in having them to attend the activities. Teacher preparation is unequal in meeting the demands of university life since graduate training empowers him/her to be a university professor and a scientist (Lemos, 2011), and not a manager, boss, or another leading position, to which he was not prepared and instructed.
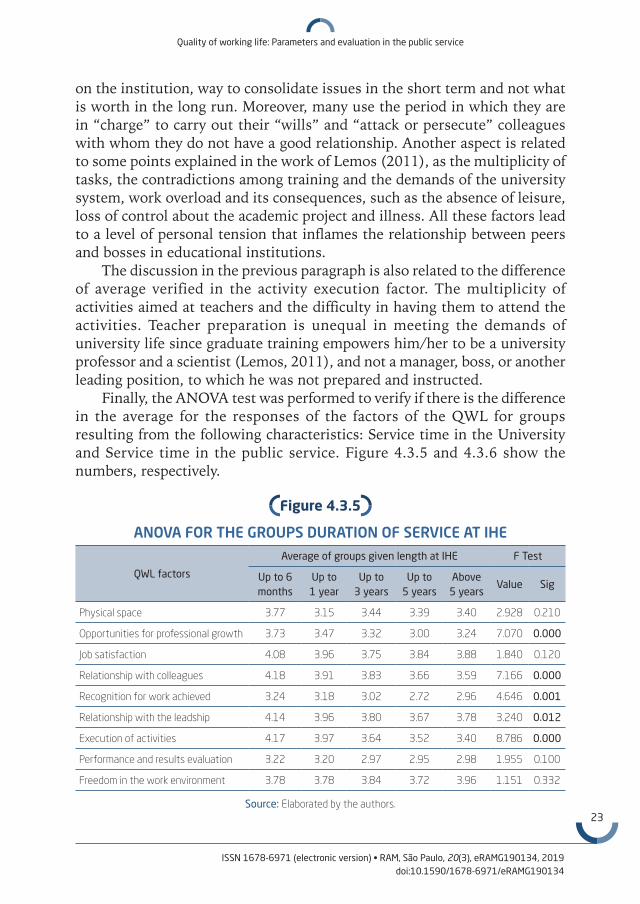
Finally, the ANOVA test was performed to verify if there is the difference in the average for the responses of the factors of the QWL for groups resulting from the following characteristics: Service time in the University and Service time in the public service. Figure 4.3.5 and 4.3.6 show the numbers, respectively.
figure 4.3.5
ANOVA FOR THE GROUPS DURATION OF SERVICE AT IHE
QWL factors
Average of groups given length at IHE F Test
Up to 6 months
Up to 1 year
Up to 3 years
Up to 5 years
Above 5 years
Value Sig
Physical space 3.77 3.15 3.44 3.39 3.40 2.928 0.210
Opportunities for professional growth 3.73 3.47 3.32 3.00 3.24 7.070 0.000
Job satisfaction 4.08 3.96 3.75 3.84 3.88 1.840 0.120
Relationship with colleagues 4.18 3.91 3.83 3.66 3.59 7.166 0.000
Recognition for work achieved 3.24 3.18 3.02 2.72 2.96 4.646 0.001
Relationship with the leadship 4.14 3.96 3.80 3.67 3.78 3.240 0.012
Execution of activities 4.17 3.97 3.64 3.52 3.40 8.786 0.000
Performance and results evaluation 3.22 3.20 2.97 2.95 2.98 1.955 0.100
Freedom in the work environment 3.78 3.78 3.84 3.72 3.96 1.151 0.332
Source: Elaborated by the authors.
24
Leander L. Klein, Breno A. D. Pereira, Ricardo B. Lemos
ISSN 1678-6971 (electronic version) • RAM, São Paulo, 20(3), eRAMG190134, 2019doi:10.1590/1678-6971/eRAMG190134
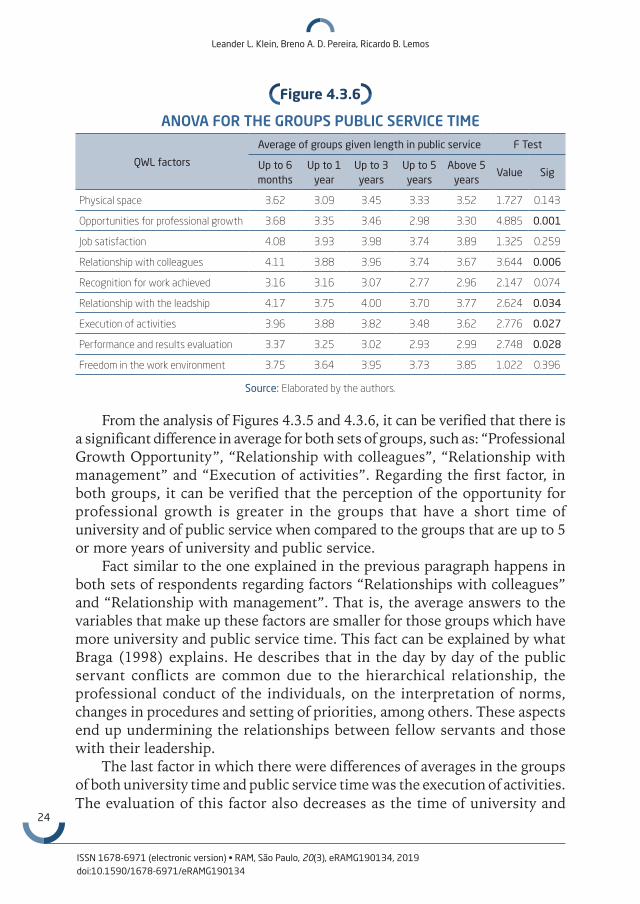
figure 4.3.6
ANOVA FOR THE GROUPS PUBLIC SERVICE TIME
QWL factors
Average of groups given length in public service F Test
Up to 6 months
Up to 1 year
Up to 3 years
Up to 5 years
Above 5 years
Value Sig
Physical space 3.62 3.09 3.45 3.33 3.52 1.727 0.143
Opportunities for professional growth 3.68 3.35 3.46 2.98 3.30 4.885 0.001
Job satisfaction 4.08 3.93 3.98 3.74 3.89 1.325 0.259
Relationship with colleagues 4.11 3.88 3.96 3.74 3.67 3.644 0.006
Recognition for work achieved 3.16 3.16 3.07 2.77 2.96 2.147 0.074
Relationship with the leadship 4.17 3.75 4.00 3.70 3.77 2.624 0.034
Execution of activities 3.96 3.88 3.82 3.48 3.62 2.776 0.027
Performance and results evaluation 3.37 3.25 3.02 2.93 2.99 2.748 0.028
Freedom in the work environment 3.75 3.64 3.95 3.73 3.85 1.022 0.396
Source: Elaborated by the authors.
From the analysis of Figures 4.3.5 and 4.3.6, it can be verified that there is a significant difference in average for both sets of groups, such as: “Professional Growth Opportunity”, “Relationship with colleagues”, “Relationship with management” and “Execution of activities”. Regarding the first factor, in both groups, it can be verified that the perception of the opportunity for professional growth is greater in the groups that have a short time of university and of public service when compared to the groups that are up to 5 or more years of university and public service.
Fact similar to the one explained in the previous paragraph happens in both sets of respondents regarding factors “Relationships with colleagues” and “Relationship with management”. That is, the average answers to the variables that make up these factors are smaller for those groups which have more university and public service time. This fact can be explained by what Braga (1998) explains. He describes that in the day by day of the public servant conflicts are common due to the hierarchical relationship, the professional conduct of the individuals, on the interpretation of norms, changes in procedures and setting of priorities, among others. These aspects end up undermining the relationships between fellow servants and those with their leadership.
The last factor in which there were differences of averages in the groups of both university time and public service time was the execution of activities. The evaluation of this factor also decreases as the time of university and

Quality of working life: Parameters and evaluation in the public service
25
ISSN 1678-6971 (electronic version) • RAM, São Paulo, 20(3), eRAMG190134, 2019doi:10.1590/1678-6971/eRAMG190134
public service increases. Analyzing the variables that compose this factor, it can be said that the higher the perception of the overload of tasks, the less time to perform the work and the pressure to perform the work increase. This can be explained by the fact that as time passes by many servers get into more activities than they can support.
One factor that showed a difference of average for the groups formed from the university time of the servers is the “Recognition by the work done”. In Figure 4.3.5, it can be checked that the perception of recognition by the work performed is greater for the group of individuals with little university time. The average responses for this factor decrease until the group of respondents who are up to 5 years of university. In other words, recognition for individual and collective work is more recognized in the perception of the most recent servants of the university studied.
Finally, the factor “performance evaluation and results” had a different average only for the groups formed from the service time of the respondents. In this, the averages are higher for the respondents with less public service time. Considering the variables that compose this factor, it can be said that the perception of collection by results and deadlines and performance monitoring is greater for servers with little public office time.
5. DisCussion of results anD ConClusions
This article aimed to analyze the parameters of the QWL in a public organization and the perception of the servers in relation to these factors. With the accomplishment of the work and from the results found, the factors that guided the analysis of QWL in the studied public university were delineated. In other words, these factors reveal aspects to be considered for understanding the work environment of the servers and that impact on their quality of life.
For a more specific analysis of these factors, the total number of respondents was divided into groups formed from social categories (characteristics) and the difference average in tests in which they were performed on the perception of these groups on the QWL factor. In general, it can be verified that in situations where there was a statistical difference in the groups’ “responses, the average for these responses decreased as the length of service or university time, as well as the respondents’ schooling increased. The averages for the responses were also lower for the group of men and for the group of people in management positions. It was also verified that this piece of information did not happen in the groups obtained from the age group of the respondents, for instance, in this situation the
26
Leander L. Klein, Breno A. D. Pereira, Ricardo B. Lemos
ISSN 1678-6971 (electronic version) • RAM, São Paulo, 20(3), eRAMG190134, 2019doi:10.1590/1678-6971/eRAMG190134
average for the answers increased with the age of the respondents for those factors in which were found the difference of averages.
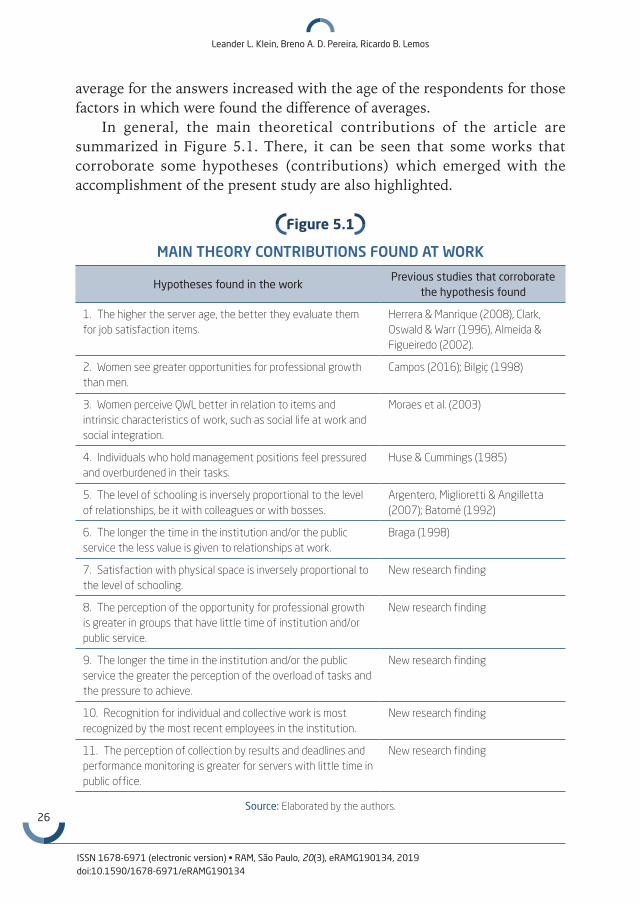
In general, the main theoretical contributions of the article are summarized in Figure 5.1. There, it can be seen that some works that corroborate some hypotheses (contributions) which emerged with the accomplishment of the present study are also highlighted.
figure 5.1
MAIN THEORY CONTRIBUTIONS FOUND AT WORK
Hypotheses found in the workPrevious studies that corroborate
the hypothesis found
1. The higher the server age, the better they evaluate them for job satisfaction items.
Herrera & Manrique (2008), Clark, Oswald & Warr (1996), Almeida & Figueiredo (2002).
2. Women see greater opportunities for professional growth than men.
Campos (2016); Bilgiç (1998)
3. Women perceive QWL better in relation to items and intrinsic characteristics of work, such as social life at work and social integration.
Moraes et al. (2003)
4. Individuals who hold management positions feel pressured and overburdened in their tasks.
Huse & Cummings (1985)
5. The level of schooling is inversely proportional to the level of relationships, be it with colleagues or with bosses.
Argentero, Miglioretti & Angilletta (2007); Batomé (1992)
6. The longer the time in the institution and/or the public service the less value is given to relationships at work.
Braga (1998)
7. Satisfaction with physical space is inversely proportional to the level of schooling.
New research finding
8. The perception of the opportunity for professional growth is greater in groups that have little time of institution and/or public service.
New research finding
9. The longer the time in the institution and/or the public service the greater the perception of the overload of tasks and the pressure to achieve.
New research finding
10. Recognition for individual and collective work is most recognized by the most recent employees in the institution.
New research finding
11. The perception of collection by results and deadlines and performance monitoring is greater for servers with little time in public office.
New research finding
Source: Elaborated by the authors.
Quality of working life: Parameters and evaluation in the public service
27
ISSN 1678-6971 (electronic version) • RAM, São Paulo, 20(3), eRAMG190134, 2019doi:10.1590/1678-6971/eRAMG190134
These results allow a breakthrough in the literature on the subject while allowing to diagnose differences in perception of different groups of respondents regarding factors and categories of analysis on QWL. These results should be considered in organizations that aim at more efficient management models that encompass the balance among the physical, emotional, social, intellectual and occupational health of their employees.
A QWL program should be constantly evaluated to correct errors and make continuous improvements. In many cases, in the private sector, the evaluation is done in a superficial, punctual and disjointed manner, resulting in very simplified results to comply with current legislation. In addition to the incomplete information that a poor evaluation may cause, non-evaluation is also common in the national public scenario.
There are different models of QWL assessment and some of the main authors include Walton (1973), Nadler and Lawler (1983), Hackman and Oldham (1974), Westley (1979), and Werther and Davis (1983). Therefore, it can be perceived the variety of QWL assessment models and ’it is perceptible how important the evaluation process is. Despite the existence of so many evaluation models, unlike the private sector, there is a clear need in the public sector for greater dissemination of methods, indicators, and tools. This could generate effective management practices and values aligned with working conditions in this sector. The diversification of indicators enables to deal with a greater number of factors that involve QWL, and so it’s increasingly possible to achieve consistent and reliable results that meet the intended objectives of the evaluation.
In practice, the results also allow the adoption of corrective measures for situations in which the average for the responses decreased and was statistically different between/among the groups. Adopting and implementing measures that correct and improve the working conditions of the servers and that add to their creative, labor and motivational capacity, will objectively impact on their quality of life and productivity as also in their work efficiency.
28
Leander L. Klein, Breno A. D. Pereira, Ricardo B. Lemos
ISSN 1678-6971 (electronic version) • RAM, São Paulo, 20(3), eRAMG190134, 2019doi:10.1590/1678-6971/eRAMG190134
QUALIDADE DE VIDA NO TRABALHO: PARÂMETROS E AVALIAÇÃO NO SERVIÇO PÚBLICO
RESUMO
Objetivo: Este estudo tem como objetivo analisar os parâmetros de ava-liação da qualidade de vida no trabalho (QVT) em uma organização pública e a percepção dos servidores em relação a esses fatores.Originalidade/valor: O artigo avança na avaliação teórica da QVT em um contexto público e amplia a apresentação de parâmetros no ambiente de trabalho. Na prática, apresentam-se padrões de comportamento em diferentes grupos de análise. Assim, aprofunda-se a compreensão de pressupostos e hipóteses já existentes em teoria e propõem-se novas no que diz respeito aos padrões de QVT.Design/metodologia/abordagem: Adotou-se o modelo de Ferreira (2011) como base para o desenvolvimento da pesquisa empírica. O método deste trabalho é uma pesquisa quantitativa, cuja coleta de dados foi rea-lizada por meio do uso de um questionário. A análise dos dados foi realizada fundamentalmente por meio dos testes T e ANOVA.Resultados: Como principal resultado, é possível destacar os noves fato-res obtidos a partir da análise fatorial exploratória. Além disso, houve percepções diferentes de grupos de servidores em relação a esses fato-res. A partir disso, conclui-se que a avaliação da QVT e de seus parâme-tros é percebida de forma diferenciada entre os servidores, quando agru-pados em grupos com características diferentes.
PALAVRAS-CHAVE
Qualidade de vida no trabalho. Avaliação. Parâmetros. Serviço público. Estudo quantitativo.
referenCes
Ahmad, S. (2013). Paradigms of quality of work life. Journal of Human Values, 19(1), 73–82.

Quality of working life: Parameters and evaluation in the public service
29
ISSN 1678-6971 (electronic version) • RAM, São Paulo, 20(3), eRAMG190134, 2019doi:10.1590/1678-6971/eRAMG190134
Aketch, J. R., Odera, O., Chepkuto, P., & Okaka, O. (2012). Effects of quality of work life on job performance: Theoretical perspectives and literature review. Current Research Journal of Social Science, 4(5), 383–388.
Albuquerque, V., Ferreira, M. C., Antloga, C. S., & Maia, M. (2015). Repre-sentações de qualidade de vida no trabalho em uma agência reguladora brasileira. Revista Subjetividades, 15(1), 286–300. doi:10.5020/23590777. 15.2.287-301
Almeida, L., & Figueiredo. E., (2002). Satisfação no trabalho: Um estudo num grupo de trabalhadores de organismo público. Liberdade, 2(1), 67–95.
Aquino, A. S., & Fernandes, A. C. P. (2013). Qualidade de vida no trabalho. Journal Health Science, 31(1), 53–58.
Argentero, P., Miglioretti, M., & Angilletta, J. (2007). Quality of work life in a cohort of Italian health workers. Giornale Italiano di Medicina del Lavoro ed Ergonomia, 29(1), 50–54.
Batomé, S. P. (1992). Autonomia universitária: Cooptação ou emancipação. Revista Universidade e Sociedade, 2(3), 19–32.
Bilgiç, R. (1998). The relationship between job satisfaction and personal characteristics of turkish workers. Journal of Interdisciplinary and Applied Psychology, 132(1), 549–557. doi:10.1080/00223989809599287
Braga, D. G. (1998). Conflitos, eficiência e democracia na gestão pública. Rio de Janeiro, RJ: Editora Fiocruz, pp. 193.
Brooks, B. A., & Anderson, M. A. (2005). Defining quality of nursing work life. Nursing Economics, 23(6), 319–326.
Campos, N. M. (2016). Qualidade de vida no trabalho dos servidores técnico administrativos do Instituto Federal Sul Rio Grandense lotados em Pelotas (Master’s thesis). Universidade Católica de Pelotas, Pelotas, RS.
Clark, A., Oswald, A., & Warr, P. (1996). Is job satisfaction U-shaped in age? Journal of Occupational and Organizational Psychology, 69, 57–81. doi:10.1111/ j.2044-8325.1996.tb00600.x
Cordeiro, S., & Pereira, F. (2006). Características do trabalho, variáveis sócio-demográficas como determinantes da satisfação no trabalho na mari-nha portuguesa. Revista Lusófona de Humanidades e Tecnologia, 1, 68–78. doi:10437/2576
De Jong, M., Tamminga, S. J., de Boer, A. G., & Frings-Dresen, M. H. (2016). Quality of working life of cancer survivors: Development of a cancer-specific questionnaire. Journal of Cancer Survivorship, 10(2), 394–405. doi:10.1007/s11764-015-0485-4

30
Leander L. Klein, Breno A. D. Pereira, Ricardo B. Lemos
ISSN 1678-6971 (electronic version) • RAM, São Paulo, 20(3), eRAMG190134, 2019doi:10.1590/1678-6971/eRAMG190134
Duyan, E. C., Aytac, S., Akyýldýz, N., & Van Laar, D. (2013). Measuring work related quality of life and affective well-being in Turkey. Mediterranean Journal of Social Sciences, 4, 105–116. doi:10.5901/mjss.2013.v4n1p105
Farid, H., Izadi, Z., Ismail, I. A., & Alipour, F. (2015). Relationship between quality of work life and organizational commitment among lecturers in a Malaysian public research university. The Social Science Journal, 52(1), 54–61. doi:10.1016/j.soscij.2014.09.003
Fernandes, E. C. (1996). Qualidade de vida no trabalho: Como medir para melho-rar. Salvador, BA: Casa da Qualidade.
Ferreira, M. C. (2016). Qualidade de vida no trabalho: Uma abordagem centrada no olhar dos trabalhadores (3rd ed.). Brasília, DF: Paralelo 15.
Ferreira, M. C. (2011). Qualidade de vida no trabalho: Uma abordagem centrada no olhar dos trabalhadores. Brasília: LPA Edições.
Ferreira, R. R., Ferreira, M. C., Antloga, C. S., & Bergamaschi, V. (2009). Concepção e implantação de um programa de qualidade de vida no tra-balho no setor público: O papel estratégico dos gestores. RAUSP, 44(2), 147–157.
Guest, R. H. (1979). Quality of work life: Learning from Tarrytown. Harvard Business Review, 57, 76–87.
Hackman, J. R., & Oldham, G. R. (1974). The job diagnostic survey: An instrument for the diagnosis of jobs and the evaluation of job redesign projects. Technical report n. 4, Department of Administrative Sciences of Yale University.
Hackman, J. R., & Suttle, J. L. (1977). Improving life at work: Behavioral science approaches to organizational change. Santa Monica, CA: Goodyear.
Hair J. R., Joseph, F., Black, W. C., Babin, B. J., Anderson, R. E., & Tatham, R. L. (2009). Análise multivariada de dados (6th. ed.). Porto Alegre: Bookman, pp. 682.
Herrera, A. G., & Manrique, A. F. G. (2008). Condiciones laborales y grado de satisfacción de profesionales de enfermería. Aquichan, 8(2), 243–256. doi:10.5294/150
Huse, E. F., & Cummings, T. F. (1985). Organization development and change (3rd ed.). St. Paul, UK: Ed. Minn.
Jahani, M. A., Mahmoudi, G., Yaminfirooz, M., & Shahrdami, Y. (2017). Structural model of the relationship between perceived organizational support and quality of working life of employees of the selected hospital of north of Iran. Ambient Science, 4(1), 23–27. doi:10.21276/ambi.2017.04.sp1.ra01

Quality of working life: Parameters and evaluation in the public service
31
ISSN 1678-6971 (electronic version) • RAM, São Paulo, 20(3), eRAMG190134, 2019doi:10.1590/1678-6971/eRAMG190134
Jokinen, E., & Heiskanen, T. (2013). Is the measured good quality of working life equivalent to strategically strong HRM system? Procedia-Social and behavioral sciences, 81, 131–141. doi:10.1016/j.sbspro.2013.06.401
Josiah, R. A., Odera, O., Chepkuto, P., & Okaka, O. (2012). Effects of quality of work life on job performance: Theoretical perspectives and literature review. Current Research Journal of Social Science, 4(5), 383–388.
Kaya, N. (2011). Evaluation of working life quality of nurses working in a University Hospital and the affecting factors (Master Thesis). Zonguldak Karaelmas University. Institution of Health Sciences, Department of Public Health. Zonguldak, TK.
Lee, Y. W., Dai, Y. T., Park, C. G., & Mccreary, L. L. (2013). Predicting quality of work life on nurses’ intention to leave. Journal of Nursing Scholarship, 45(2), 160–168. doi:10.1111/jnu.12017
Leite, J. V., Ferreira, M. C., & Mendes, A. M. (2009). Mudando a gestão da qualidade de vida no trabalho. Revista Psicologia, 9(2), 109–123.
Lemos, D. (2011). Trabalho docente nas universidades federais: Tensões e contradições. Caderno CRH, 24(1), 105–120. doi:10.1590/S0103-497920 11000400008
Liliy, S., Julia, K., Elena, K., Oksana, Y., & Anastasia, F. (2015). The higher education impact on the quality of young people working life. Procedia-Social and Behavioral Sciences, 191, 2412–2415. doi:10.1016/j.sbspro. 2015.04.589
Limongi-França, A. C. (2010). Qualidade de vida no trabalho – QVT: Conceitos e práticas as empresas da sociedade pós-industrial. São Paulo, SP: Atlas.
Lippitt, G. L. (1978). Quality of work life: Organization renewal in action. Training and Development Journal, 32(1), 19–28.
Martel, J. P., & Dupuis, G. (2006). Quality of work life: Theoretical and methodological problems and presentation of a new model and measuring instrument. Social Indicators Research, 77(2), 333–368. doi:10.1007/s11205-004-5368-4
Medeiros, L. F. R., & Ferreira, M. C. (2011). Qualidade de vida no trabalho: Uma revisão da produção científica de 1995-2012. Gestão Contemporânea, 1(2), 9–34.
Moraes, L. F. R., Pereira, L. Z., Souza, K. O., & Guzmão, L. V. N. (2003). Implicações do gênero na qualidade de vida e estresse no trabalho da Polícia Militar do Estado de Minas Gerais. Belo Horizonte, MG: NEACO/CEPEAD/FACE/UFMG.

32
Leander L. Klein, Breno A. D. Pereira, Ricardo B. Lemos
ISSN 1678-6971 (electronic version) • RAM, São Paulo, 20(3), eRAMG190134, 2019doi:10.1590/1678-6971/eRAMG190134
Mosadeghrad, A. M. (2013). Quality of working life: An antecedent to employee turnover intention. International journal of health policy and management, 1(1), 43. doi:10.15171/ijhpm.2013.07
Motta, P., & Bresser Pereira, L. C. (1980). Introdução à organização burocrática. São Paulo, SP: Brasiliense.
Nadler, D. A., & Lawler, E. E. (1983). Quality of work life: Perspectives and directions. Organization Dynamics, 7(11), 69–83.
Nanjundeswaraswamy, T. S., & Swamy, D. R. (2014). Relationship between quality of work life and demographical characteristics of SMEs employees. Pakistan Journal of Engineering, Technology & Science, 4(2), 125–144. doi:10.22555/pjets.v4i2.261
Ojedokun, O., Idemudia, E. S., & Desouza, M. (2015). Perceived external prestige as a mediator between quality of work life and organisational commitment of public sector employees in Ghana. SA Journal of Industrial Psychology, 41(1), 1–10. doi:10.4102/sajip.v41i1.1216
Pestana, M. H., & Gageiro, J. N. (2008). Análise de dados para ciências sociais: A complementaridade do SPSS (5th ed.). Lisboa, PT: Silabo.
Reddy, M. L, & Reddy, P. M. (2013). Quality of work life of employees: Emerging dimensions. Asian Journal of Management Research, 2(2), 827–839.
Royuela, V., Tamayo, J. L., & Suriñach, J. (2007). The institutional versus the academic definition of the quality of work life. What is the focus of the european commission? Research Institute of Applied Economics, Working Papers. Barcelona, Spain.
Sant’anna, A., & Moraes, L. F. (1999). Programas de qualidade de vida no trabalho: Um estudo de caso em empresa brasileira do setor de telecomu-nicações. Proceedings of Enanpad, Foz do Iguaçu.
Silva, C. A., & Ferreira, M. C. (2013). Dimensões e indicadores da quali-dade de vida e do bem-estar no trabalho. Psicologia: Teoria e Pesquisa, 29(3), 331–339. doi:10.1590/S0102-37722013000300011
Silva, A. A., Pacheco de Souza, J. M., Borges, F. N. S., & Fischer, F. M. (2010). Health-related quality of life and working conditions among nursing providers. Revista de Saúde Pública, 44(4), 718–25. doi:10.1590/S0034-89102010000400016
Sinha, C. (2012). Factors affectıng qualıty of work lıfe: Empirical evidence from Indian organizations. Australian Journal of Business and Management Research, 1(11), 31–40.
Siqueira, M., & Mendes, A. (2014). Gestão de pessoas no setor público e a reprodução do discurso do setor privado. Revista do Serviço Público, 60(3), 201–219.

Quality of working life: Parameters and evaluation in the public service
33
ISSN 1678-6971 (electronic version) • RAM, São Paulo, 20(3), eRAMG190134, 2019doi:10.1590/1678-6971/eRAMG190134
Spector, P. E. (2003). Psicologia nas organizações. São Paulo, SP: Saraiva.Tamini, B. K., Yazdany, B. O., & Bojd, F. B. (2011). Quality of work life as a
function of organizational commitment and job burnout of government and private bank employees in Zahedan city. The Social Sciences, 6(5), 368–374. doi:10.3923/sscience.2011.368.374
Walton, R. (1973). Quality of work life: What is it? Sloan Management Review, 15(1), 11–21.
Weber, M. (1978). Os fundamentos da organização burocrática: Uma cons-trução do tipo ideal. In Campos, E. (org.). Sociologia da burocracia (4th ed.). Rio de Janeiro, RJ: Zahar, pp. 15–28.
Werther, W. B. & Davis, K. (1983). Administração de pessoal e recursos humanos. São Paulo, SP: McGraw-Hill.
Westley, W. A. (1979). Problems and solutions in the quality of working life. Human Relations, 32(2), 113–123. doi:10.1177/001872677903200202
aCknoWleDgMents
The authors gratefully acknowledge the financial support from the Coordenação de Aperfeiçoamento de Pessoal de Nível Superior (CAPES). “The funders had no influence on the design of the study, on the collection and analysis of data, on the decision to publish and on the preparation of the article.”
author notes
Leander L. Klein, Programa de Pós-Graduação em Gestão de Organizações Públicas (PPGOP), Universidade Federal de Santa Maria (UFSM); Breno A. D. Pereira, Management, Universidade Federal do Rio Grande do Sul (UFRGS); & Ricardo B. Lemos, Programa de Pós-Graduação em Gestão de Organizações Públicas, Universidade Federal de Santa Maria (UFSM).
Leander L. Klein is now Professor of Management at Universidade Federal de Santa Maria (UFSM); Breno A. D. Pereira is now Teacher of Management at Universidade Federal de Santa Maria (UFSM); Ricardo B. Lemos is now Administrator in Coordination of promotion of extension actions at Universidade Federal do Pampa (Unipampa).
Correspondence concerning this article should be addressed to Leander L. Klein, Avenida Independência, 3751, Room 101 – Professor’s building, Vista Alegre, Palmeira das Missões, Rio Grande do Sul, Brazil, CEP: 98300-000.E-mail: [email protected]

34
Leander L. Klein, Breno A. D. Pereira, Ricardo B. Lemos
ISSN 1678-6971 (electronic version) • RAM, São Paulo, 20(3), eRAMG190134, 2019doi:10.1590/1678-6971/eRAMG190134
EDITORIAL BOARD
Editors-in-chiefJanette BrunsteinSilvio Popadiuk
Associated EditorLuciana Mourão Cerqueira e Silva
Technical SupportVitória Batista Santos Silva
EDITORIAL PRODUCTION
Publishing CoordinationIrina Migliari
CopyeditorIrina Migliari (English) Carlos Villarruel (Portuguese)
Language EditorDaniel de Almeida Leão (English)Irina Migliari (Portuguese)
Layout DesignerEmap
Graphic DesignerLibro