quality of the united states soybean crop: 2020
TRANSCRIPT
Quality of the United States
Soybean Crop: 2020
Seth Naeve and Jill Miller-Garvin
University of Minnesota
Soybean Outlook Conferences
November 17-19, 2020
Outline
• 2020 Weather highlights
• Historical protein and oil variation
• 2020 Soybean Survey results
– Protein and Oil
– Physical Characteristics
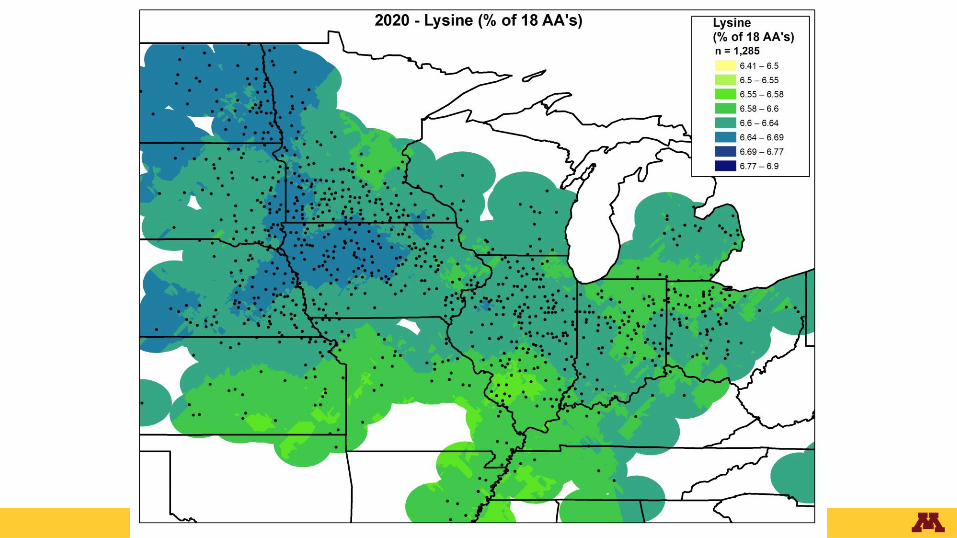
– Amino Acids
– Sucrose
CRITICAL WEATHER EVENTS
Environmental impacts on soybean
Protein and oil
• Location-specific environmental impacts (latitude, climate, and soil
type) affect long-term quality trends
• However, annual variation in weather patterns affects year-over-year
variation in soybean quality
• Rainfall patterns appear to have the greatest impact on soybean
quality
• Excessive rainfall early in the season appears to reduce protein
deposition in the seed
• Drought conditions during the seed-filling stages exacerbate this
condition

2020 Soybean Production
• Record early planting in Iowa and Minnesota
– Early in Illinois, Indiana, Nebraska, and Wisconsin
• Severe drought centered on western Iowa, but
extended across much of the central Corn Belt
• Extreme winds (derecho) passed through this area on
August 10, 2020
– 110-140 mph winds

www.droughtmonitor.unl.edu/

www.droughtmonitor.unl.edu/


QUALITY OF THE UNITED
STATES SOYBEAN CROP: 2020

HISTORICAL PROTEIN AND
OIL VARIATION


2020 SURVEY RESULTS

2020 Survey Methods• In August, sample kits were mailed to 5,800 soybean
producers based on soybean production by state
• By October 28, 2020,
1,285 samples were
returned for analysis

2020 Survey Methods - Protein and Oil
• Samples were analyzed for protein
and oil concentration by Near
Infrared Spectroscopy (NIRS) using
a Perten® diode array instrument
• Average protein and oil values were
determined by state
• Regional and US average values
were determined by weighting
averages based on estimated 2020
production

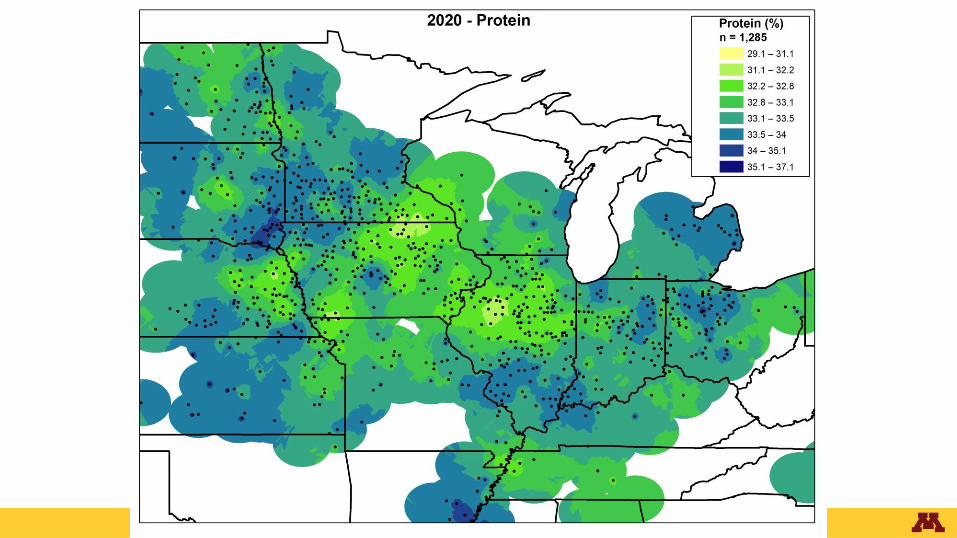
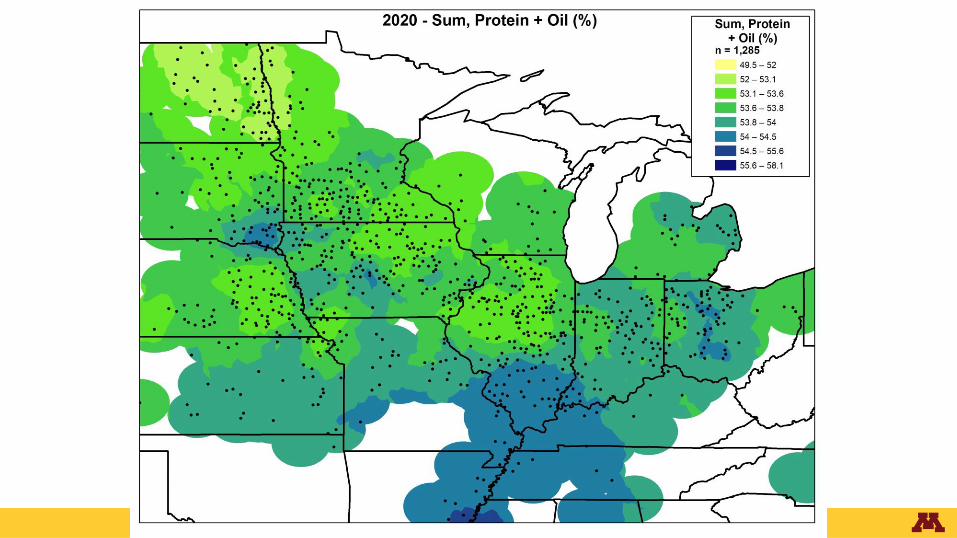
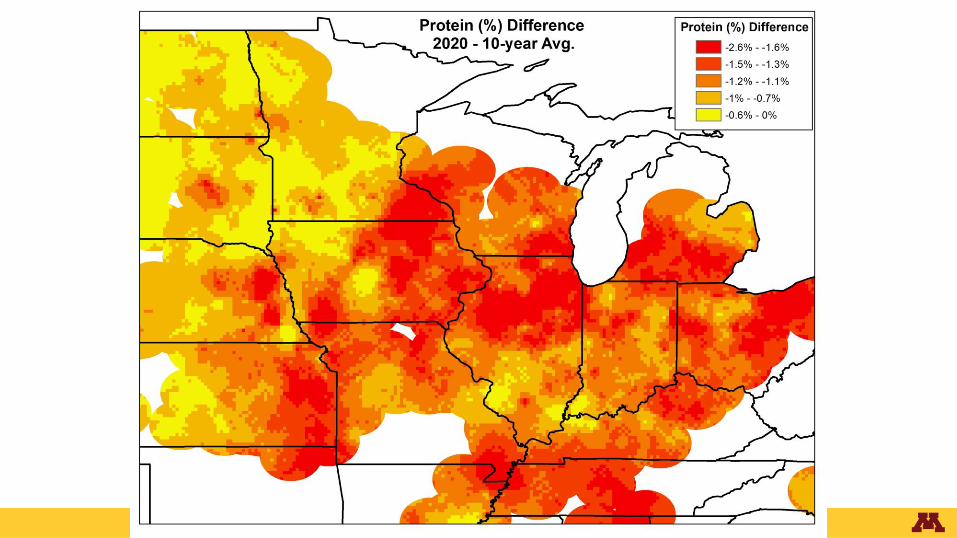
PROTEIN
AND OIL
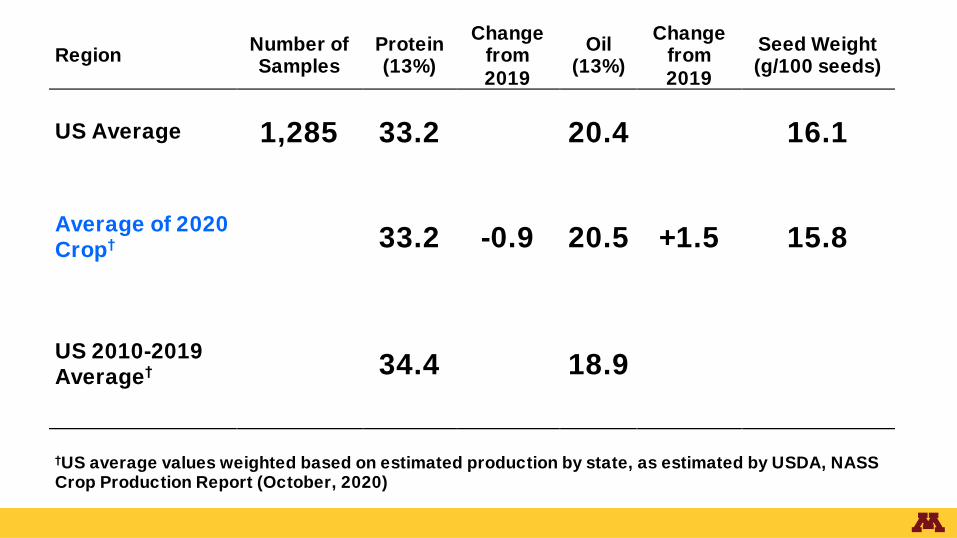
Region Number of Samples
Protein (13%)
Change from
2019
Oil (13%)
Change from
2019
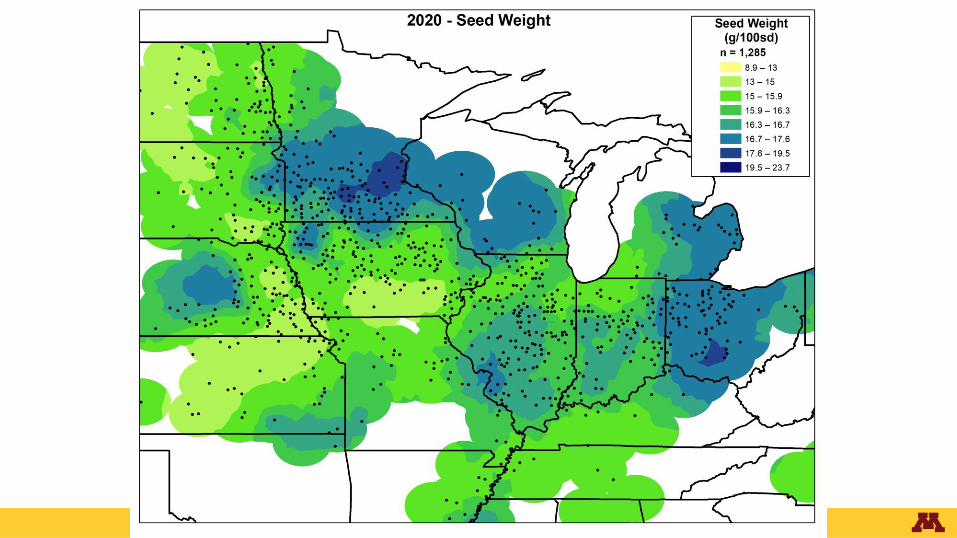
Seed Weight (g/100 seeds)
US Average 1,285 33.2 20.4 16.1
Average of 2020 Crop†
33.2 -0.9 20.5 +1.5 15.8
US 2010-2019 Average†
34.4 18.9
†US average values weighted based on estimated production by state, as estimated by USDA, NASS Crop Production Report (October, 2020)

State Protein and Oil: Relative to Total Production
Protein (%)32.0 32.5 33.0 33.5 34.0 34.5
Oil
(%)
19.0
19.5
20.0
20.5
21.0
21.5
22.0
Illinois
Indiana
Michigan
OhioWisconsin
Iowa
Kansas
Minnesota
Missouri
Nebraska
North Dakota
South Dakota
Arkansas
Kentucky
LouisianaMississippi
Oklahoma
Tennessee
Alabama
North Carolina
Maryland
New JerseyNew York
Pennsylvania
= 1 MMT
53%
54%


PHYSICAL CHARACTERISTICS


Better Measures of the Value of Soybeans
• Soybeans & soybean meal have been valued primarily on an
indirect measure of protein – ‘crude protein’
• Crude protein is probably not the best measure of a soybean
(or a soybean meal’s) value– Overestimates total amino acids (true protein) at higher protein levels
– No information on protein QUALITY (relative balance of amino acids)
• Both formal and informal feeding trials in destination countries
have repeatedly shown that meal from US soybeans performs
better than expected based on protein levels

BETTER MEASURES OF QUALITY:
AMINO ACIDS


BETTER MEASURES OF QUALITY:
SOLUBLE SUGARS

