quality of the aquatic environment of high andean rivers
TRANSCRIPT

Ingeniare. Revista chilena de ingeniería, vol. 27 Nº 3, 2019, pp. 396-409
Quality of the aquatic environment of high Andean rivers evaluated through environmental indicators: a case of the Cunas River, Peru
Calidad del ambiente acuático de ríos altoandinos evaluada mediante indicadores ambientales: un caso del río Cunas, Perú
María Custodio1* Erika Chávez2
Recibido: 09 de noviembre de 2017, aceptado 07 de agosto de 2018Recibido: November 09, 2017 Accepted: August 07, 2018.
ABSTRACT
The quality of the aquatic environment of the Cunas River was evaluated through environmental indicators, in two contrasting climatic periods. Anthropogenic pressures on the aquatic environment were identified, and the BOD5 load contributed by the wastewater was determined. Water samples and benthic macroinvertebrates were collected, and water quality and trophic status were determined. The BOD5 load contributed by wastewater from fish, livestock, and urban activities was 23,27kg/ day, 284,31 kg/day and 349,70 kg/day. The water quality of sectors S1, S2 and S3, according to the EPT, (Ephemeroptera, Plecoptera, Trichoptera), BMWP (Biological Monitoring Working Party) and H’ (Shannon-Wiener diversity index) was good, regular and poor, respectively. According to the INSF (National Sanitation Foundation Index of the United States of America), the S1 and S2 presented good water quality and the S3 average water quality. According to the chlorophyll a, the three sectors had low trophic levels. Therefore, the quality of the aquatic environment supports significant anthropogenic pressures that have an impact on water quality and trophic status.
Keywords: High andean aquatic environment, water quality indexes, diversity, benthic macroinvertebrates, trophic state.
RESUMEN
Se evaluó la calidad del ambiente acuático del río Cunas mediante indicadores ambientales, en dos periodos climáticos contrastantes. Se identificaron las presiones antropogénicas sobre el ambiente acuático y se determinó la carga de DBO5 aportada por las aguas residuales. Se colectaron muestras de agua y de macroinvertebrados bentónicos y se determinó la calidad del agua y el estado trófico. La carga de DBO5 que aportan las aguas residuales de las actividades piscícola, pecuaria y urbana fueron de 23,27 kg/día, 284,31 kg/día y 349,70 kg/día. La calidad de agua que presentaron los sectores S1, S2 y S3, según los índices EPT (Ephemeroptera, Plecoptera, Trichoptera), BMWP (Biological Monitoring Working Party) y el H’ (índice de diversidad de Shannon-Wiener), fue buena, regular y mala, respectivamente. Según el INSF (índice de la National Sanitation Foundation of the United States of America) los S1 y S2 presentaron calidad de agua buena y el S3 calidad de agua media. Según el indicador clorofila a, los tres sectores presentaron bajos niveles tróficos. Por lo tanto, la calidad del ambiente acuático soporta presiones antropogénicas significativas que repercuten en la calidad del agua y el estado trófico.
Palabras clave: Ambiente acuático altoandino, índices calidad de agua, diversidad, macroinvertebrados bentónicos, estado trófico.
1 Universidad Nacional del Centro del Perú. Instituto de Investigación en Alta Montaña. Av. Mariscal Castilla Nº 3989-4089.Huancayo-Perú. E-mail: [email protected]
2 Servicio de agua potable y alcantarillado municipal-SEDAM S.A. Huancayo, Perú. E-mail: [email protected]* Corresponding author: [email protected]

Custodio and Chávez: Quality of the aquatic environment of high Andean rivers evaluated through environmental…
397
INTRODUCTION
The increasing deterioration that inland aquatic ecosystems are experiencing as a result of natural and anthropogenic pressures, both on a global and watershed scale [1-3], requires a growing need to identify and quantify the various sources of pressure and their impacts on river flow and sediment discharge [4]. In recent decades, biotic indices have been developed to assess the effect of anthropogenic interventions on these ecosystems [5-6], highlighting those that rely on the use of bioindicators as they provide a rapid response and quantifiable against various perturbations of the medium [7]. Also, they allow a better understanding of the processes of alteration of the water quality [8].
Currently, new indices have been generated based on these indicators using computational methods, in order to reduce the intrinsic uncertainties and subjectivities of environmental problems [9]. However, in order to provide information on the historical state of a water body and not just at the moment of sampling, multi-metric indices have been developed using bio indicators [10]. Among the most frequently, used bio indicators in the assessment of water quality are the macroinvertebrate and benthic algal communities, as they have a wide geographic distribution and respond rapidly to environmental changes [11].
Other methods of bio indication of rivers are those that use the trophic macrophyte index (ITM), and the reference index (IR). The ITM allows evaluating the trophic state of running water; however, it is susceptible to small variations in phosphorus concentration. IR indicates the ecological status of the river, which is influenced not only by the trophic state but by all environmental factors of the community of reference [12]. Another method of rapid and efficient forecasting is the process-based model and the data assimilation technique, which improves the prediction of water quality indicators and thus facilitates efficient management of water resources.
Because of the events related to climate change, integrated spatiotemporal ecosystem models and indexes are useful tools for ecosystem management. In different parts of the world, multi-indices of biotic integrity have been
developed based on macroinvertebrates, as in Kenya, which has generated an index for its application in a tropical watershed [13]. In other regions, water quality is evaluated using benthic macroinvertebrate biodiversity indexes, considering relative abundance, Shannon index, Simpson index, and Pielou uniformity together with environmental variables [14]. Other indexes for monitoring surface water quality are the water quality index of the National Sanitation Foundation-INSF and the biotic index of benthic macroinvertebrates [15]. The INSF includes the indicators TDS, DO, pH, NO3-N, TP and temperature [16]. However, the Environmental Protection Agency has urged states to adopt numerical criteria for nutrients to protect water quality. In several states, the new numerical criteria have incorporated the nutrient criteria (nitrogen and phosphorus) and a biological criterion (chlorophyll a in lakes or benthic macroinvertebrates in rivers) [17].
It is well established that the natural flow regime of a river is a key determinant of ecological integrity and that frequent derivations of flows can be detrimental to biotic communities and even affect the structure of the river ecosystem [18]. The hydro ecological analysis to identify potential differences in the benthic community before and after impact provides valuable information for the provision of biologically derived environmental flows [19-20] and an essential input of hydrodynamic habitat models to facilitate scenario selection of optimal environmental flow to ensure the integrity of aquatic ecosystems downstream from anthropogenic activities that cause hydrological alterations [21-23]. Peru, is a country with a strategic location for continental water resources, has 71% of tropical glaciers in South America, 25% of aquatic ecosystems in the Amazon region and their basins represent 5% of sweet water of the world [23].
However, it becomes highly vulnerable to the effects of climate change because it affects the amount of water [24], given that in the last 40 years glaciers have recorded a surface loss of 42.64% over the 1970 inventory. Also, like many other countries, water pollution is one of the major environmental problems, not only because it limits the availability of water for human consumption, but it reduces the multiple uses of water [2].

Ingeniare. Revista chilena de ingeniería, vol. 27 Nº 3, 2019
398
In the sub basin of the Cunas River, productive activities are carried out -pisciculture, agriculture, and livestock-. As well, as secondary activities typical of urban centers and extractive activities. Increasing and intensifying these activities are exerting strong pressure on the aquatic environment, causing environmental problems such as degradation of water quality, decline, and loss of biodiversity –altering, reducing or suppressing aquatic habitats– and negatively impacting on human well-being and the health of aquatic ecosystems on a global scale as well as in watersheds. In this context and given the great importance of continental aquatic ecosystems, there is a need to apply tools to monitor the quality of these ecosystems in order to achieve sustainable management of these resources. The objective of the study was to evaluate the quality of the aquatic environment of the Cunas River through environmental indicators, in two contrasting climatic periods.
MATERIAL AND METHODS
Description of the study areaThe study area is located in the sub basin of the Cunas River in the central highlands of Peru, on the right bank of the Mantaro River basin, between
coordinates 11º 45 ‘and 12º 20’ south latitude; 75º 15 ‘and 75º 45’ west longitude. The drainage network of the Cunas River hydrograph system has a centripetal confluence, and its main channel describes the shape of the letter S, with west-east direction. It has a length of 101,80 km, starting from the highest level at 4 797 masl and the lowest at the river mouth at 3 190 masl. Three sampling sectors were defined in the Cunas River, S1 (San Juan de Jarpa), S2 (Chambará) and S3 (Chupaca), according to their representativeness of the area in terms of the influence of anthropogenic activity using the global positioning system (Figure 1). In each sampling sector, 10 stations were established so that the data collected allowed reducing the sampling error.
Record of anthropogenic pressures on the quality of the aquatic environment of the Cunas RiverThe identification of the anthropogenic pressures on the quality of the aquatic environment of the Cunas River was carried out prior to the area that included the study and recording of the anthropogenic activities and their respective sources of pressure. The magnitude of the pressures was determined from the flow of residual water to the river and the biological oxygen demand (BOD5), according to anthropogenic activity.
Figure 1. Location of the water sampling stations and benthic macroinvertebrates of the Cunas River, by sector.

Custodio and Chávez: Quality of the aquatic environment of high Andean rivers evaluated through environmental…
399
Collection and physical-chemical analysis of waterWater samples were collected during two stages. The first corresponded to the rainy season (February, March, and April) and the second to the dry season (May, June, and July) in 2016. In Both water samples were collected in the direction opposite to the flow of the stream from the surface of the river in bottles previously treated with a solution of hydrochloric acid in equal proportions with distilled water, according to the protocol of the Ministry of Health [25-26]. The indicators determined in situ by Hanna Instruments portable equipment were: dissolved oxygen, total dissolved solids, temperature, pH and turbidity. The biological oxygen demand (BOD5) was determined using the Respirometric method with the OxiDirect Lovibond equipment [27]. Nitrates and phosphates were determined with the PC-MultiDirect photometer.
Collection and analysis of benthic macro-invertebrate communitiesA length of 1000 meters was defined in each sampling area. Samples of benthic macroinvertebrates were collected using a Surber net of 0.09 m2 sampling surface area and a 250 μm opening mesh. The sampling points were established every 100 meters, and in each of them, the sample consisted of three replicates. The samples were fixed with alcohol of 70º for their respective taxonomic identification. For this, different taxonomic keys of benthic macroinvertebrates were used [28-29].
Determination of chlorophyll by fluorometryThe estimation of the algal biomass was performed at a wavelength of 470 nm based on the fluorescence values, which is the one emitted by chlorophyll without excitation by light [30]. Initially, the measurement parameters of the apparatus were set. Then the calibration of the fluorometer was performed with the standard solid, and the fluorescence emission was measured [31].
RESULTS AND DISCUSSION
Anthropogenic pressures in the aquatic environment of the Cunas RiverThe results show that the waters of the river Cunas in their route from the headwaters of watershed are derived for diverse anthropogenic activities. Furthermore, they receive wastewater discharges from fisheries, livestock, urban and turbine activities at
the Huarisca hydroelectric plant (Figure 2), causing fluctuations in water levels and spatial and temporal differences in water chemistry [32]. The results obtained from the evaluation of the anthropogenic pressures on the aquatic environment revealed that the fishery activity discharges to the river an average residual water of 35,33 L/s with a BOD5 load of 23,27 Kg/day. The livestock activity makes an average contribution of 3,57 L/s of wastewater with a BOD5 load of 284,31 Kg/day, and the urban activity makes an average contribution of 11,00 L/s of wastewater with a load of BOD5 of 349,70 Kg/day.
The difference in the BOD5 load that these activities contribute to the river is mainly due to the concentration of the BOD5 that each type of residual water presents. Thus, the waters produced by the fish activity had an average concentration of BOD5 of 7,57 mg/L, which is between the maximum permissible limits (MPL) and even for environmental quality standards (EQS) for the water of Sierra Rivers (<10 mg/L) [33]. Wastewater from livestock and urban activities had an average concentration of BOD5 of 892,33 mg/L and 368,33 mg/L, exceeding the MPL of effluents for surface water (50 mg/L and discharged to water bodies (100 mg/L of Peruvian legislation, , respectively, generating processes that impoverish and increasingly reduce the capacity of aquatic ecosystems to eliminate these wastes [2], which endangers the sustainability of food supply and the biodiversity.
Other pressures detected were the interruption of the natural channel of the river, presence of riparian defenses at both margins (by concrete platforms) and occupation of the marginal river bank for the development of agricultural activities and dispersed human settlements. The percentage of occupied marginal forest area for agricultural production and urbanization was 13,92% (7,04 ha) and 0,24% (0,12 ha), respectively. The elimination of riparian vegetation in much of the river is another of the identified pressures. This type of pressure reduces the thermal stability of the water column, increases the frequency of sediment and aquatic macrophytes, and facilitates the entry of contaminants into bodies of water [34]. Among the most important consequences of this pressure are the deterioration of water quality, and the reduction of biodiversity [35], due to the destruction of the habitat of many adult states of aquatic entomofauna.

Ingeniare. Revista chilena de ingeniería, vol. 27 Nº 3, 2019
400
Figure 2. Sources of pressure on the aquatic environment of the Cunas River. (a) Fish activity in the marginal strip of the river, (b) Discharge of wastewater from the livestock activity, (c) Discharge of municipal wastewater, (d) Extraction of water and discharge of wastewater from the washing activity of carrot, (e) Occupation of the marginal strip of the river Cunas by maize crops, (f) Discharge of water from the turbine of the hydroelectric plant of Huarisca.
a b
c d
e f

Custodio and Chávez: Quality of the aquatic environment of high Andean rivers evaluated through environmental…
401
Determination of water quality through the Index of the National Sanitation Foundation of the United States of America - INSFIn Table 1, the descriptive statistics of the physical-chemical and bacteriological indicators of the water quality of the Cunas River are presented, considering the sector and the sampling time. The pH of the water presented variations with averages ranging from 7,60 in the S1, in the dry season to 8,13 in the S3, during the rainy season, with values that did not exceed the RQSs of Peru (6,5 -9,0) and those of WHO (7,0-8,5). In both times, the data revealed that the pH tendency of water towards alkalinity would be related to the edaphic conditions through which the current flows, to the agricultural activity [36] and the discharges of residual waters that are carried out directly to the bed river [37]. Another factor no less important that would be contributing in the variation of the pH of the water would be the photosynthetic activity (CO2) that happens during the day [38].
The values of turbidity were higher in the rainy season, reaching a maximum value of 16 FTU (Formazine Turbidity Unit) in S3. This increase in water turbidity generates interference from light penetration and as a consequence, affects the normal development of aquatic biota and deterioration of water quality [39-40]. Also, soil erosion due to the extraction of sand and stone for the buildings and suspended solids of the wastewater in this sector of the river would be contributing to the increased turbidity caused by poor and stressful conditions for the aquatic life in the river. Similar behavior to turbidity was observed for conductivity and total dissolved solids of the water in the three sampling sectors.
The lowest dissolved oxygen concentrations were recorded at S3, at both sampling times. This decrease in oxygen concentration reveals that aquatic life is being disturbed both in its abundance and in its diversity [41]. Dissolved oxygen is undoubtedly
Table 1. Descriptive statistics of the physical-chemical and bacteriological indicators of the water quality of the Cunas river, according to the sector and time of sampling.
Indicator
S1 S2 S3
Dry Season
Minimum Maximum Average
Minimum Maximum Average
Minimum Maximum Average
pH (Unity) 7,40 7,80 7,60 7,70 8,00 7,80 6,50 8,10 7,10Turbidity (FTU) 0,42 1,80 0,94 0,30 0,98 0,59 13,50 15,00 14,50BOD5 (mg/L) 5,00 6,20 5,80 5,50 7,10 6,10 15,00 17,30 15,77Dissolved Oxigen (% saturation) 88, 0 90,0 89,0 77,0 78,5 77,8 60,0 65,0 61,67Temperature (ºC) 4,00 11,00 7,40 11,50 13,20 12,20 11,50 13,00 12,17Total dissolved solids (mg/L) 190,00 250,00 218,33 280,00 355,00 315,00 370,00 410,00 393,33Phosphate (mg/L) 0,00 0,06 0,02 0,00 0,16 0,06 0,08 0,35 0,20Nitrates (mg/L) 0,79 1,86 1,46 1,73 2,86 2,24 5,50 5,85 5,69Thermo-tolerant coliforms (NMP/100ml) 43,00 75,00 53,66 210,00 240,00 230,00 450,00 >1100 883,33
Rainy Season
pH (Unity) 7,20 8,00 7,70 7,50 8,30 7,93 7,80 8,50 8,13Turbidity (FTU) 5,00 5,10 5,03 8,00 9,30 8,60 11,00 16,00 13,7BOD5 (mg/L) 5,10 5,40 5,13 8,30 8,80 8,53 9,70 10,5 10,07Dissolved oxígen (% saturation) 89,50 90,10 91,33 89,5 90,1 89,9 50,00 55,50 52,05Temperature (ºC) 11,00 11,20 11,10 12,50 14, 0 13,50 13,00 15,00 13,83Total dissolved solids (mg/L) 262,00 298,00 282,50 218,00 303,00 265,33 290,00 345,00 203,45Phosphate (mg/L) 0,00 0,02 0,01 0,00 0,02 0,01 0,02 0,20 0,13Nitrates (mg/L) 0,00 0,02 0,01 1,02 2,12 1,40 3,50 5,00 4,33
Thermo-tolerant coliforms (NMP/100ml) 43,00 75,00 53,66 210,00 240,00 230,00 450,00 >1100 883,33
Ingeniare. Revista chilena de ingeniería, vol. 27 Nº 3, 2019
402
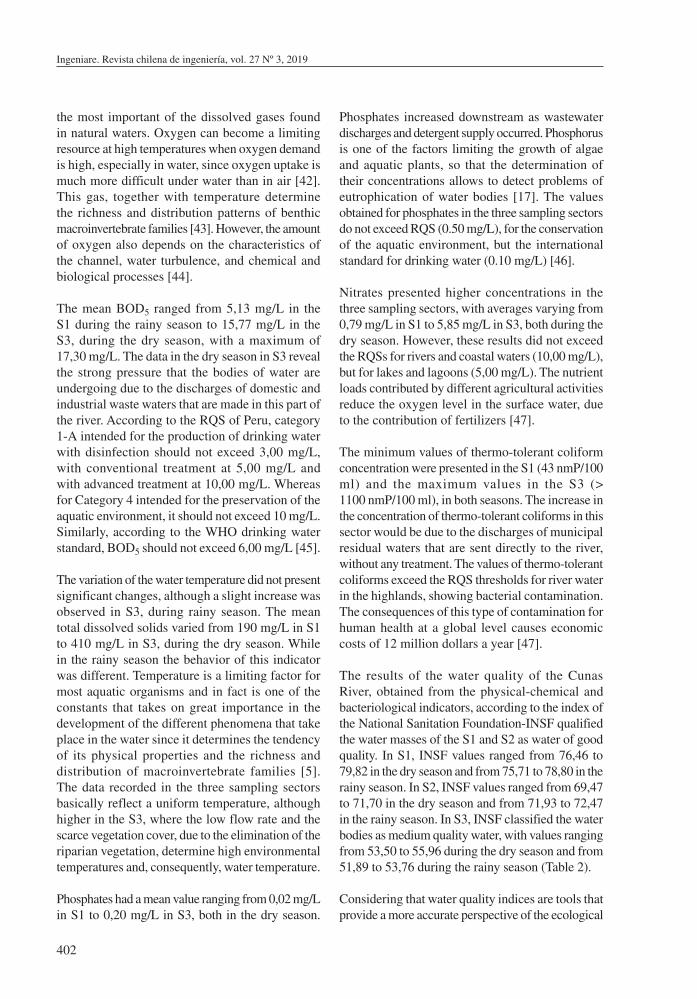
the most important of the dissolved gases found in natural waters. Oxygen can become a limiting resource at high temperatures when oxygen demand is high, especially in water, since oxygen uptake is much more difficult under water than in air [42]. This gas, together with temperature determine the richness and distribution patterns of benthic macroinvertebrate families [43]. However, the amount of oxygen also depends on the characteristics of the channel, water turbulence, and chemical and biological processes [44].
The mean BOD5 ranged from 5,13 mg/L in the S1 during the rainy season to 15,77 mg/L in the S3, during the dry season, with a maximum of 17,30 mg/L. The data in the dry season in S3 reveal the strong pressure that the bodies of water are undergoing due to the discharges of domestic and industrial waste waters that are made in this part of the river. According to the RQS of Peru, category 1-A intended for the production of drinking water with disinfection should not exceed 3,00 mg/L, with conventional treatment at 5,00 mg/L and with advanced treatment at 10,00 mg/L. Whereas for Category 4 intended for the preservation of the aquatic environment, it should not exceed 10 mg/L. Similarly, according to the WHO drinking water standard, BOD5 should not exceed 6,00 mg/L [45].
The variation of the water temperature did not present significant changes, although a slight increase was observed in S3, during rainy season. The mean total dissolved solids varied from 190 mg/L in S1 to 410 mg/L in S3, during the dry season. While in the rainy season the behavior of this indicator was different. Temperature is a limiting factor for most aquatic organisms and in fact is one of the constants that takes on great importance in the development of the different phenomena that take place in the water since it determines the tendency of its physical properties and the richness and distribution of macroinvertebrate families [5]. The data recorded in the three sampling sectors basically reflect a uniform temperature, although higher in the S3, where the low flow rate and the scarce vegetation cover, due to the elimination of the riparian vegetation, determine high environmental temperatures and, consequently, water temperature.
Phosphates had a mean value ranging from 0,02 mg/L in S1 to 0,20 mg/L in S3, both in the dry season.
Phosphates increased downstream as wastewater discharges and detergent supply occurred. Phosphorus is one of the factors limiting the growth of algae and aquatic plants, so that the determination of their concentrations allows to detect problems of eutrophication of water bodies [17]. The values obtained for phosphates in the three sampling sectors do not exceed RQS (0.50 mg/L), for the conservation of the aquatic environment, but the international standard for drinking water (0.10 mg/L) [46].
Nitrates presented higher concentrations in the three sampling sectors, with averages varying from 0,79 mg/L in S1 to 5,85 mg/L in S3, both during the dry season. However, these results did not exceed the RQSs for rivers and coastal waters (10,00 mg/L), but for lakes and lagoons (5,00 mg/L). The nutrient loads contributed by different agricultural activities reduce the oxygen level in the surface water, due to the contribution of fertilizers [47].
The minimum values of thermo-tolerant coliform concentration were presented in the S1 (43 nmP/100 ml) and the maximum values in the S3 (> 1100 nmP/100 ml), in both seasons. The increase in the concentration of thermo-tolerant coliforms in this sector would be due to the discharges of municipal residual waters that are sent directly to the river, without any treatment. The values of thermo-tolerant coliforms exceed the RQS thresholds for river water in the highlands, showing bacterial contamination. The consequences of this type of contamination for human health at a global level causes economic costs of 12 million dollars a year [47].
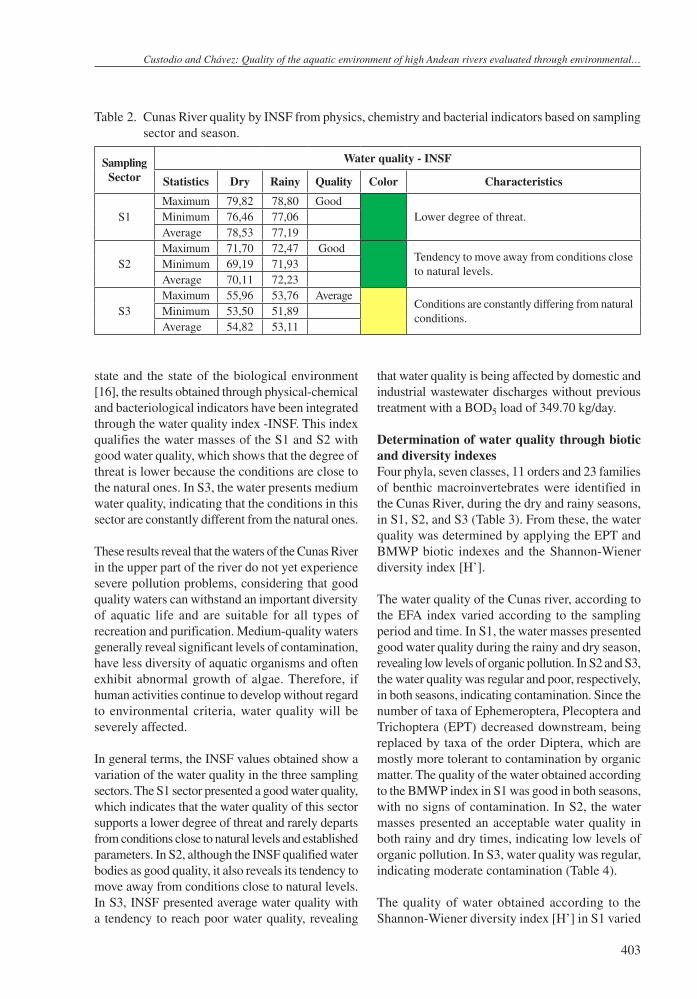
The results of the water quality of the Cunas River, obtained from the physical-chemical and bacteriological indicators, according to the index of the National Sanitation Foundation-INSF qualified the water masses of the S1 and S2 as water of good quality. In S1, INSF values ranged from 76,46 to 79,82 in the dry season and from 75,71 to 78,80 in the rainy season. In S2, INSF values ranged from 69,47 to 71,70 in the dry season and from 71,93 to 72,47 in the rainy season. In S3, INSF classified the water bodies as medium quality water, with values ranging from 53,50 to 55,96 during the dry season and from 51,89 to 53,76 during the rainy season (Table 2).
Considering that water quality indices are tools that provide a more accurate perspective of the ecological
Custodio and Chávez: Quality of the aquatic environment of high Andean rivers evaluated through environmental…
403
state and the state of the biological environment [16], the results obtained through physical-chemical and bacteriological indicators have been integrated through the water quality index -INSF. This index qualifies the water masses of the S1 and S2 with good water quality, which shows that the degree of threat is lower because the conditions are close to the natural ones. In S3, the water presents medium water quality, indicating that the conditions in this sector are constantly different from the natural ones.
These results reveal that the waters of the Cunas River in the upper part of the river do not yet experience severe pollution problems, considering that good quality waters can withstand an important diversity of aquatic life and are suitable for all types of recreation and purification. Medium-quality waters generally reveal significant levels of contamination, have less diversity of aquatic organisms and often exhibit abnormal growth of algae. Therefore, if human activities continue to develop without regard to environmental criteria, water quality will be severely affected.
In general terms, the INSF values obtained show a variation of the water quality in the three sampling sectors. The S1 sector presented a good water quality, which indicates that the water quality of this sector supports a lower degree of threat and rarely departs from conditions close to natural levels and established parameters. In S2, although the INSF qualified water bodies as good quality, it also reveals its tendency to move away from conditions close to natural levels. In S3, INSF presented average water quality with a tendency to reach poor water quality, revealing
that water quality is being affected by domestic and industrial wastewater discharges without previous treatment with a BOD5 load of 349.70 kg/day.
Determination of water quality through biotic and diversity indexesFour phyla, seven classes, 11 orders and 23 families of benthic macroinvertebrates were identified in the Cunas River, during the dry and rainy seasons, in S1, S2, and S3 (Table 3). From these, the water quality was determined by applying the EPT and BMWP biotic indexes and the Shannon-Wiener diversity index [H’].
The water quality of the Cunas river, according to the EFA index varied according to the sampling period and time. In S1, the water masses presented good water quality during the rainy and dry season, revealing low levels of organic pollution. In S2 and S3, the water quality was regular and poor, respectively, in both seasons, indicating contamination. Since the number of taxa of Ephemeroptera, Plecoptera and Trichoptera (EPT) decreased downstream, being replaced by taxa of the order Diptera, which are mostly more tolerant to contamination by organic matter. The quality of the water obtained according to the BMWP index in S1 was good in both seasons, with no signs of contamination. In S2, the water masses presented an acceptable water quality in both rainy and dry times, indicating low levels of organic pollution. In S3, water quality was regular, indicating moderate contamination (Table 4).
The quality of water obtained according to the Shannon-Wiener diversity index [H’] in S1 varied
Table 2. Cunas River quality by INSF from physics, chemistry and bacterial indicators based on sampling sector and season.
Sampling Sector
Water quality - INSF
Statistics Dry Rainy Quality Color Characteristics
S1Maximum 79,82 78,80 Good
Lower degree of threat.Minimum 76,46 77,06Average 78,53 77,19
S2Maximum 71,70 72,47 Good
Tendency to move away from conditions close to natural levels.
Minimum 69,19 71,93Average 70,11 72,23
S3Maximum 55,96 53,76 Average
Conditions are constantly differing from natural conditions.
Minimum 53,50 51,89Average 54,82 53,11

Ingeniare. Revista chilena de ingeniería, vol. 27 Nº 3, 2019
404
Table 3. Value of tolerance to the contamination of the benthic macroinvertebrate taxa of the Cunas River, collected during the dry season and rainy season.
Phylum Clase Order Family
Tolerancy value
Dry Rainy
S1 S2 S3 S1 S2 S3
Platyhelmintes Turbellaria Tricladida Dugesiidae 6 6 6 6 6 6
AnnelidaOligochaeta Tubificida Tubificidae 1 1 1 1 1 1Hirudinea Glossiphoniiformes Glossiphoniidae 5 5 0 0 5 0
Mollusca Gastropoda Basommatofora Lymnaeidae 0 0 0 0 7 7
Arthropoda
Crustacea Amphipoda Hyalellidae 7 0 0 7 0 0Arachnoidea Acari Hydrachnidiidae 0 0 0 0 0 3
Insecta
EphemeropteraBaetidade 7 7 0 7 0 0Leptophlebiidae 9 9 0 9 9 0
PlecopteraPerlidae 10 0 0 10 10 0Gripopterygidae 0 0 0 10 0 0
TrichopteraHydropsychidae 7 7 0 7 0 0Hydroptylidae 8 8 0 8 8 0Limnephilidae 8 8 8 0 0 0
Coleoptera
Elmidae 6 6 6 6 6 6Hydrophilidae 3 3 0 3 0 0Scirtidae 4 4 4 0 0 0Hydraenidae 8 8 0 8 0 0
Diptera
Ceratopogonidae 5 5 5 5 5 5Chironomidae 2 2 2 2 2 2Simuliidae 7 7 7 7 7 7Tipulidae 3 3 3 3 3 3Empididae 4 4 4 4 4 4Psychodidae 2 2 2 2 2 2
biotic index of families-BMWP 112 95 48 105 75 46
Table 4. Water quality of the Cunas River according to the EPT and BMWP indexes.
Sector Season EPT index BMWP index
Value (%) Quality Value Quality Color Meaning
S1Dry 57,27 Good 112 Good
Non contaminated waterRainy 64,76 Good 105 Good
S2Dry 26,04 Regular 95 Aceptable
Slightly contaminatedRainy 35,34 Regular 75 Aceptable
S3Dry 14,60 Bad 48 Regular
Water moderately contaminatedRainy 15,94 Bad 46 Regular
BMWP: Biological Monitoring Working Party.
from good to regular; from slightly to moderately polluted, from both in times of drought and rain. In S2, the water masses presented a regular water quality in both rainy and dry times, indicating organic pollution. In S3, the water quality was poor,
revealing that the waters are heavily contaminated (Table 5).
The results obtained from the biological quality of water using the BMWP, EPT, and H ‘indexes

Custodio and Chávez: Quality of the aquatic environment of high Andean rivers evaluated through environmental…
405
show that the structure of the macroinvertebrate communities follows a spatial pattern with specific environmental conditions [48-49]. The highest abundance of Ephemeroptera, Plecoptera, and Trichoptera was recorded in the sector of higher altitude (S1) compared to the registry of the individuals of the orders Tricladida, Tubificida and Glossiphoniiformes that follow the opposite pattern. The order Trichoptera constitutes an important component of the benthic communities and base of the trophic chain of aquatic ecosystems. The highest abundance of this order was recorded in S1, where the water quality is good. Other insects restricted to this sector are Plecoptera and Ephemeroptera, which are dependent on water quality, these individuals being the most demanding within the group of macroinvertebrates in water quality [10-11].
The order Diptera presents the largest abundance, being the Chironomidae family the most representative with a wide distribution spectrum, extending to all the zoogeographical regions including Antarctica [50]. However, the lower abundance of Chironomidae
recorded in S1 confirms the good water quality in this sector. Whereas, the greater abundance of these individuals recorded in the S3, reveals the contamination that their waters present, as well as the low levels of oxygen [14]. Additionally, the decrease in macroinvertebrate density is related not only to the decrease in water quality and food, but also to the interference of breathing mechanisms and other physiological and morphological characteristics [51].
The biological water quality gradient recorded along the Cunas River seems to respond to a combination of the effects derived from anthropic activities (aquaculture, agriculture and livestock, and domestic and industrial wastewater discharges) and natural variations experiment the environmental factors that condition the distribution and structure of the macroinvertebrate community.
Determination of the trophic status of the Cunas river using the chlorophyll indicator aThe results of the evaluation of the trophic state according to the concentration of chlorophyll a, varied according to the sector and time of sampling.
Table 6. Trophic state of the Cunas River, according to sector and sampling time.
Sampling sector Statistics
Medium chlorophyll a (µg/L) / Season Trophic state
Rainy Dry
S1Maximum 1,63 1,57
OligotrophicMinimum 0,75 1,32Average 1,34 1,46
S2Maximum 3,61 4,85
OligotrophicMinimum 2,90 2,97Average 3,14 3,60
S3Maximum 5,13 5,52
MesotrophicMinimum 4,88 4,75Average 4,96 5,01
Table 5. Water quality of the Cunas River according to the Shannon-Wiener diversity index [H’].
Sector Season H’ Quality Color Condition
S1Dry 2,02 Good Water slightly contaminatedRainy 1,88 Regular Water moderately contaminated
S2Dry 1,10 Regular
Water moderately contaminatedRainy 1,52 Regular
S3Dry 0,98 Bad
Water heavily contaminatedRainy 0,23 Bad

Ingeniare. Revista chilena de ingeniería, vol. 27 Nº 3, 2019
406
S1 and S2 presented average values of chlorophyll a low (oligotrophic) in both rainy and dry seasons. However, these results would be conditioned by the fact that phytoplankton is sensitive to water velocity and turbulence. In S3, chlorophyll a concentrations increased at both sampling times (Mesotrophic), which indicates the increase of the algal load in this sector due to the increase of organic matter (Table 6).
Chlorophyll a values obtained at both sampling times indicated that S1 and S2 presented a low trophic level (oligotrophic). This is due to the low algal load of these sectors due to the influence of altitude, temperature, stream velocity, riparian vegetation, substrate and light, among other factors [11]. However, the increase in the concentration of this pigment in the lower part of the Cunas (S3) river reveals the contamination generated by the discharge of wastewater into the river without prior treatment, with high organic matter content and nutrients that stimulate the growth and development of the perifiton [52]. This situation is reflected by the decrease in the abundance of benthic entomofauna, mainly of Ephemeroptera, Plecoptera and Trichoptera.
CONCLUSIONS
The results show that anthropogenic pressures are exerting strong pressure on the aquatic environment and the biological communities of the Cunas river. Whit an averege contributions varying from 3.57 L/s of livestock waste water (with an average concentration of BOD5 of 892, 33 mg/L and a load of BOD5 of 284.31 kg/day) at 11.00 L/s of urban waste water (with a mean BOD5 concentration of 368.33 mg/L and a BOD5 load of 349,70 kg/day), they are negatively affecting water quality as well as the structure and functioning of these communities. This situation is reflected by the decrease in the abundance of benthic entomofauna, mainly of Ephemeroptera, Plecoptera, and Trichoptera. Additionally, the results also reveal the importance of integrating environmental pressure indicators with state indicators in assessing the quality of the aquatic environment in the high Andean rivers.
ACKNOWLEDGEMENT
The authors thank the Research Institute of the National University of Central Peru for funding
the study and the Water Research Laboratory of the UNCP, for allowing us to use the equipment and materials to carry out the present study.
REFERENCES
[1] F. Rizo-Patrón V., A. Kumar, M.B. McCoy Colton, M. Springer and F.A. Trama. “Macroinvertebrate communities as bioindicators of water quality in conventional and organic irrigated rice fields in Guanacaste, Costa Rica”. Ecological Indicators. Vol. 29, pp. 68-78. 2013.
[2] J.L. Perrin, N. Raïs, N. Chahinian, P. Moulin and M. Ijjaali. “Water quality assessment of highly polluted rivers in a semi-arid Mediterranean zone Oued Fez and Sebou River (Morocco)”. Journal of Hydrology.Vol. 510, pp. 26-34. 2014.
[3] F.J. Chang, Y.H. Tsai, P.A. Chen, A. Coynel and G. Vachaud. “Modeling water quality in an urban river using hydrological factors-data driven approaches”. Journal of environmental management. Vol. 151, pp. 87-96. 2015.
[4] S.L. Yang, K.H. Xu, J.D. Milliman, H.F. Yang and C.S. Wu. “Decline of Yangtze River water and sediment discharge: Impact from natural and anthropogenic changes”. Scientific Reports. Vol. 5 Nº 1, pp. 12581. 2015.
[5] G.J. Pond, J.E. Bailey, B.M. Lowman and M.J. Whitman. “Calibration and validation of a regionally and seasonally stratified macroinvertebrate index for West Virginia wadeable streams”. Environmental Monitoring and Assessment. Vol. 185 Nº 2, pp. 1515-1540. 2013.
[6] M.A. Beketov, B.J. Kefford, R.B. Schafer and M. Liess. “Pesticides reduce regional biodiversity of stream invertebrates”. Proceedings of the National Academy of Sciences. Vol. 110 Nº 27, pp. 11039-11043. 2013.
[7] F. Kilonzo, F.O. Masese, A. Van Griensven, W. Bauwens, J. Obando and P.N.L. Lens. “Spatial-temporal variability in water quality and macro-invertebrate assemblages in the Upper Mara River basin, Kenya”. Physics and Chemistry of the Earth. Vol. 67-69, pp. 93-104. 2014.
[8] S.B. Dessu, A.M. Melesse, M.G. Bhat and M.E. McClain. “Assessment of water

Custodio and Chávez: Quality of the aquatic environment of high Andean rivers evaluated through environmental…
407
resources availability and demand in the Mara River Basin”. Catena. Vol. 115, pp. 104-114. 2014.
[9] C. Petus, V. Marieu, S. Novoa, G. Chust, N. Bruneau and J.M. Froidefond. “Monitoring spatio-temporal variability of the Adour River turbid plume (Bay of Biscay, France) with MODIS 250-m. Imagery”. Continental Shelf Research. Vol. 74, pp. 35-49. 2014.
[10] H.H. Nguyen, G. Everaert, W. Gabriels, T.H. Hoang and P.L.M. Goethals. “A multimetric macroinvertebrate index for assessing the water quality of the Cau river basin in Vietnam”. Limnologica. Vol. 45, pp. 16-23. 2014.
[11] E. Van Ael, W. De Cooman, R. Blust and L. Bervoets. “Use of a macroinvertebrate based biotic index to estimate critical metal concentrations for good ecological water quality”. Chemosphere. Vol. 119, pp. 138-144. 2015.
[12] D.G.F. Cunha, M. do C. Calijuri and M.C. Lamparelli. “A trophic state index for tropical/subtropical reservoirs (TSItsr)”. Ecological Engineering. Vol. 60, pp. 126-134. 2013.
[13] S. Wang, B. Fu, W. Liang, Y. Liu and Y. Wang. “Driving forces of changes in the water and sediment relationship in the Yellow River”. The Science of the total environment. Vol. 576, pp. 453-461. 2016.
[14] D. Narangarvuu, C. Bin Hsu, S.H. Shieh, F.C. Wu and P.S. Yang. “Macroinvertebrate assemblage patterns as indicators of water quality in the Xindian watershed, Taiwan”. Journal of Asia-Pacific Entomology. Vol. 17 Nº 3, pp. 505-513. 2014.
[15] F.O. Arimoro and R.B. Ikomi. “Ecological integrity of upper Warri River, Niger Delta using aquatic insects as bioindicators”. Ecological Indicators. Vol. 9 Nº 3, pp. 455-461. 2009.
[16] R. Wimbaningrum, S. Indriyani, C. Retna- ningdyah and E. Arisoesilaningsih. “Moni- toring water quality using biotic indices of benthic macroinvertebrates along surfaces water ecosystems in some tourism areas in East Java, Indonesia”. Journal of Indonesian Tourism and Development Studies. Vol. 4 Nº 2, pp. 81-90. 2016.
[17] D.B. McLaughlin and K.H. Reckhow. “A Bayesian network assessment of macroinvertebrate responses to nutrients and other factors in streams of the Eastern
Corn Belt Plains, Ohio, USA”. Ecological Modelling. Vol. 345, pp. 21-29. 2017.
[18] I. Muñoz, S. Sabater and C. Barata. “Evaluating Ecological Integrity in Multistressed Rivers: From the Currently Used Biotic Indices to Newly Developed Approaches Using Biofilms and Invertebrates”. In Emerging and priority pollutants in rivers. pp. 219-241. 2012.
[19] M.K. Das, M. Naskar, M.L. Mondal, P.K. Srivastava, S. Dey and A. Rej. “Influence of ecological factors on the patterns of fish species richness in tropical Indian rivers”.Acta Ichthyologica et Piscatoria. Vol. 42 Nº 1, pp. 47-58. 2012.
[20] A.H. Arthington, R.J. Rolls, D. Sternberg, S.J. Mackay and C. S. James. “Fish assemblages in subtropical rivers: low-flow hydrology dominates hydro-ecological relationships”.Hydrological Sciences Journal. Vol. 59 Nº 3-4, pp. 594-604. 2014.
[21] M. Gómez-Balandra, P. Saldaña-Fabela and S. Rodríguez. “EFA and the impacts on rivers ecological integrity”. iaia.org. pp. 13-16. 2013.
[22] C. Theodoropoulos, A. Vourka, A. Stamou, P. Rutschmann and N. Skoulikidis. “Response of freshwater macroinvertebrates to rainfall-induced high flows: A hydroecological approach”. Ecological Indicators. Vol. 73, pp. 432-442. 2017.
[23] L.E.H. Eda and W. Chen. “Integrated water resources management in Peru”. In Procedia Environmental Sciences. 2010. Vol. 2, pp. 340-348.
[24] T. Swiech, M.W. Ertsen and C.M. Pererya. “Estimating the impacts of a reservoir for improved water use in irrigation in the Yarabamba region, Peru”. Physics and Chemistry of the Earth. Vol. 47-48, pp. 64-75. 2012.
[25] F.D. Wilde and M.W. Sandstrom. “National Field Manual for the Collection of Water-Quality Data. Chapter A4. Collection of water samples”. http://water.usgs.gov/owq/FieldManual/chapter4/pdf/Chap4_v2.pdf. pp. 60. 2006.
[26] MINSA. “Protocolo monitoreo calidad sanitaria de los recursos hídricos superficiales”. 2007.
[27] S. Jouanneau. “Methods for assessing biochemical oxygen demand (BOD): A review”. Water Research. Vol. 49 Nº 1, pp. 62-82. 2014.

Ingeniare. Revista chilena de ingeniería, vol. 27 Nº 3, 2019
408
[28] L. Miguel-Chinchilla, D. Boix, S. Gascón and F.A. Comín. “Taxonomic and functional successional patterns in macroinvertebrates related to flying dispersal abilities: A case study from isolated manmade ponds at reclaimed opencast coal mines”. Hydrobiologia. Vol. 732 Nº 1, pp. 111-122. 2014.
[29] G. Marini, M. Pinna, A. Basset and G. Mancinelli. “Estimation of benthic macroinvertebrates taxonomic diversity: Testing the role of sampling effort in a mediterranean transitional water ecosystem”.Transitional Waters Bulletin. Vol. 7 Nº 2, pp. 28-40. 2013.
[30] V. Orr and L. Rehmann. “Improvement of the Nile Red fluorescence assay for determination of total lipid content in microalgae independent of chlorophyll content”. Journal of Applied Phycology. Vol. 27 Nº 6, pp. 2181-2189. 2014.
[31] S.B. Sjollema, S.A.M. Van Beusekom, H.G. Van Der Geest, P. Booij, D. de Zwart, A.D. Vethaak and W. Admiraal. “Laboratory algal bioassays using PAM fluorometry: Effects of test conditions on the determination of herbicide and field sample toxicity”. Environmental Toxicology and Chemistry. Vol. 33 Nº 5, pp. 1017-1022. 2014.
[32] F.S. Magbanua, N.Y.B. Mendoza, C.J.C. Uy, C.D. Matthaei and P.S. Ong. “Water physicochemistry and benthic macroinvertebrate communities in a tropical reservoir: The role of water level fluctuations and water depth”. Limnologica. Vol. 55, pp. 13-20. 2015.
[33] MINAM. Aprueban los Estándares Nacionales de Calidad Ambiental para Agua. Vol. 2, pp. 36. 2008.
[34] N. Cui, J. Wu, D. Xiang, S. Cheng and Q. Zhou. “A field study on seed bank and its potential applications in vegetation restoration of a polluted urban river in China”. Ecological Engineering. Vol. 60, pp. 37-44. 2013.
[35] R. Rivaes, P.M. Rodríguez-González, A. Albuquerque, A.N. Pinheiro, G. Egger and M.T. Ferreira. “Riparian vegetation responses to altered flow regimes driven by climate change in Mediterranean rivers”. Ecohydrology. Vol. 6 Nº 3, pp. 413-424. 2013.
[36] H. Doi, I. Katano, J.N. Negishi, S. Sanada and Y. Kayaba. “Effects of biodiversity, habitat structure and water quality on recreational use of rivers”. Ecosphere. Vol. 4 Nº 8, pp. 102. 2013.
[37] E. Páll, M. Niculae, T. Kiss, C.D. Şandru and M. Spînu. “Human impact on the microbiological water quality of the rivers”.Journal of Medical Microbiology. Vol. 62 Nº 11, pp. 1635-1640. 2013.
[38] A. Di Lascio, L. Rossi, P. Carlino, E. Calizza, D. Rossi and M.L. Costantini. “Stable isotope variation in macroinvertebrates indicates anthropogenic disturbance along an urban stretch of the river Tiber (Rome, Italy)”. Ecological Indicators. Vol. 28, pp. 107-114. 2013.
[39] G. Göransson, M. Larson and D. Bendz. “Variation in turbidity with precipitation and flow in a regulated river system-river Göta Älv, SW Sweden”. Hydrology and Earth System Sciences. Vol. 17 Nº 7, pp. 2529-2542. 2013.
[40] C.S. Lee, Y.C. Lee and H.M. Chiang. “Abrupt state change of river water quality (turbidity): Effect of extreme rainfalls and typhoons”. Science of the Total Environment. Vol. 557-558, pp. 91-101. 2016.
[41] P.A. Chambers, J.M. Culp, N.E. Glozier, K.J. Cash, F.J. Wrona and L. Noton. “Northern rivers ecosystem initiative: Nutrients and dissolved oxygen - Issues and impacts”.Environmental Monitoring and Assessment. Vol. 113 Nº 1-3, pp. 117-141. 2006.
[42] K.N. Hoefnagel and W.C.E.P. Verberk. “Is the temperature-size rule mediated by oxygen in aquatic ectotherms?”. Journal of Thermal Biology. Vol. 54, pp. 56-65. 2015.
[43] U. Pinto, B.L. Maheshwari and E.C. Morris. “Understanding the Relationships among Phytoplankton, Benthic Macroinvertebrates and Water Quality Variables in Peri-Urban River Systems”. Water Environment Research. Vol. 86 Nº 12, pp. 2279-2293. 2014.
[44] V. Minaya, M.E. McClain, O. Moog, F. Omengo and G.A. Singer. “Scale-dependent effects of rural activities on benthic macroinvertebrates and physico-chemical characteristics in headwater streams of the Mara River, Kenya”. Ecological Indicators. Vol. 32, pp. 116-122. 2013.

Custodio and Chávez: Quality of the aquatic environment of high Andean rivers evaluated through environmental…
409
[45] R.M. Danell. “The importance of biochemical oxygen demand (BOD) in the water analysis sector, Application”. Report AL 99001, AQUALYTIC. 1997.
[46] W. Funk, V. Dammann and G. Donnevert. “Quality assurance in analytical chemistry”. VCH. New York. 1995.
[47] B.A. Kiel and M. Bayani Cardenas. “Lateral hyporheic exchange throughout the Mississippi River network”. Nature Geoscience. Vol. 7 Nº 6, pp. 413-417. 2014.
[48] C.M. Aura, E. Kimani, S. Musa, R. Kundu and J.M. Njiru. “Spatio-temporal macroinvertebrate multi-index of biotic integrity (MMiBI) for a coastal river basin: a case study of River Tana, Kenya”. Ecohydrology & Hydrobiology. 2016.
[49] M.N. Damanik-Ambarita, K. Lock, P. Boets, G. Everaert, T.H.T. Nguyen, M.A. Eurie Forio, P.L.S. Musonge, N. Suhareva, E. Bennetsen, D. Landuyt, L.
Dominguez-Granda and P.L.M. Goethals. “Ecological water quality analysis of the Guayas river basin (Ecuador) based on macroinvertebrates indices”. Limnologica. Vol. 57, pp. 27-59. 2016.
[50] J.K. Mackie, E.T. Chester, T.G. Matthews and B.J. Robson. “Macroinvertebrate response to environmental flows in headwater streams in western Victoria, Australia”. Ecological Engineering. Vol. 53, pp. 100-105. 2013.
[51] M.L. Miserendino, M. Archangelsky, C. Brand and L.B. Epele. “Environmental changes and macroinvertebrate responses in Patagonian streams (Argentina) to ashfall from the Chaitén Volcano (May 2008)”. Science of the Total Environment. Vol. 424, pp. 202-212. 2012.
[52] M.G. Bojorge-garcía y E.A. Cantoral. “La importancia ecológica de las algas en los ríos The ecological importance of algae in rivers”. Vol. 26 Nº 1, pp. 1-8. 2016.