quality of service delivery survey presentation - melody niwamanya
TRANSCRIPT
National and Local Service Delivery Survey for Lesotho
Draft Report Presentation
Melody Niwamanya
FEI CONSULTING & EFICON CONSULTING2nd July 2015

Contents
1. Introduction
2. Methodology
3. Key Survey findings
4. Institutional Constraints
5. Challenges and Recommendations
6. Best practices and lessons learnt

INTRODUCTION
Introduction
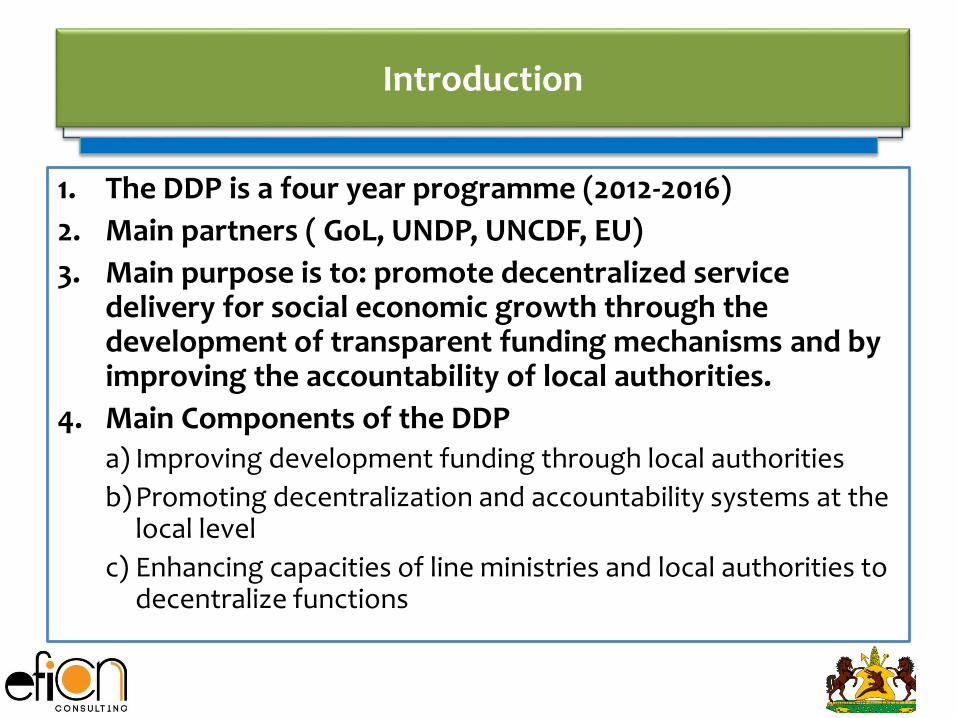
1. The DDP is a four year programme (2012-2016)
2. Main partners ( GoL, UNDP, UNCDF, EU)
3. Main purpose is to: promote decentralized service delivery for social economic growth through the development of transparent funding mechanisms and by improving the accountability of local authorities.
4. Main Components of the DDPa) Improving development funding through local authorities
b) Promoting decentralization and accountability systems at the local level
c) Enhancing capacities of line ministries and local authorities to decentralize functions
Introduction
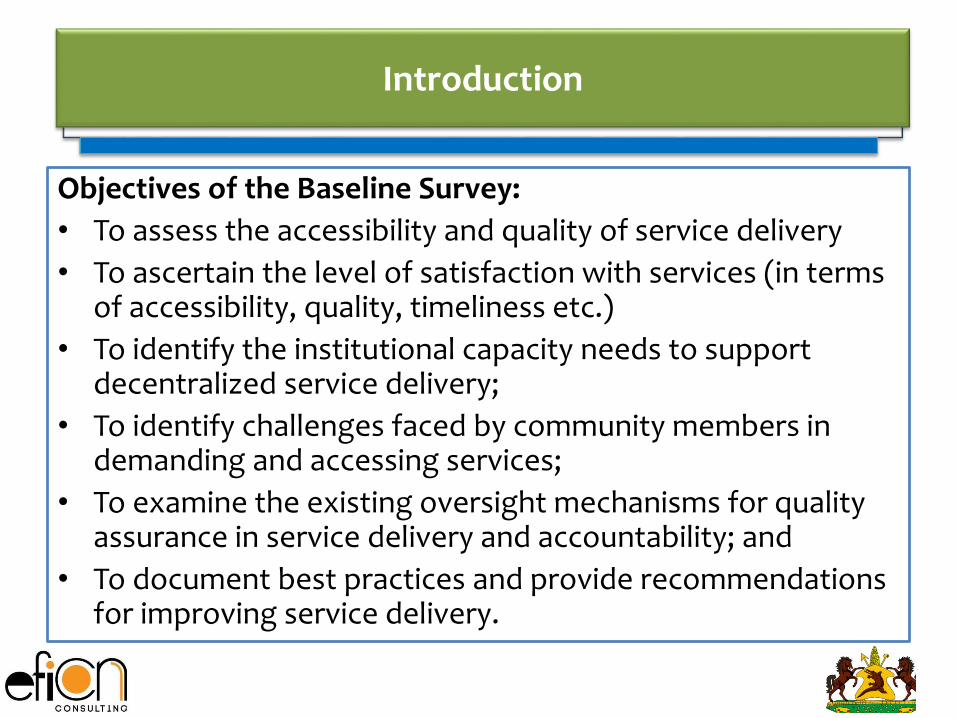
Objectives of the Baseline Survey:
• To assess the accessibility and quality of service delivery
• To ascertain the level of satisfaction with services (in terms of accessibility, quality, timeliness etc.)
• To identify the institutional capacity needs to support decentralized service delivery;
• To identify challenges faced by community members in demanding and accessing services;
• To examine the existing oversight mechanisms for quality assurance in service delivery and accountability; and
• To document best practices and provide recommendations for improving service delivery.

Service Areas1. Education2. Health3. Agriculture4. Energy5. Water & sanitation6. Roads7. Civil registry8. Forestry/lands9. Social protection and
child protection
6 districtsBotha- BotheMaseruMafetengMohale’s HoekQuthingThaba Tseka
Key Service MinistriesPublic Works and Transport, Roads DirectorateSocial DevelopmentForestryEnergy, Department of EnergyHealthWater, Department of Water Affairs, Water Commission Development PlanningEducationAgriculture & Food Security Civil Service Registry , Ministry of Home Affairs

METHODOLOGY
Approach and Methodology
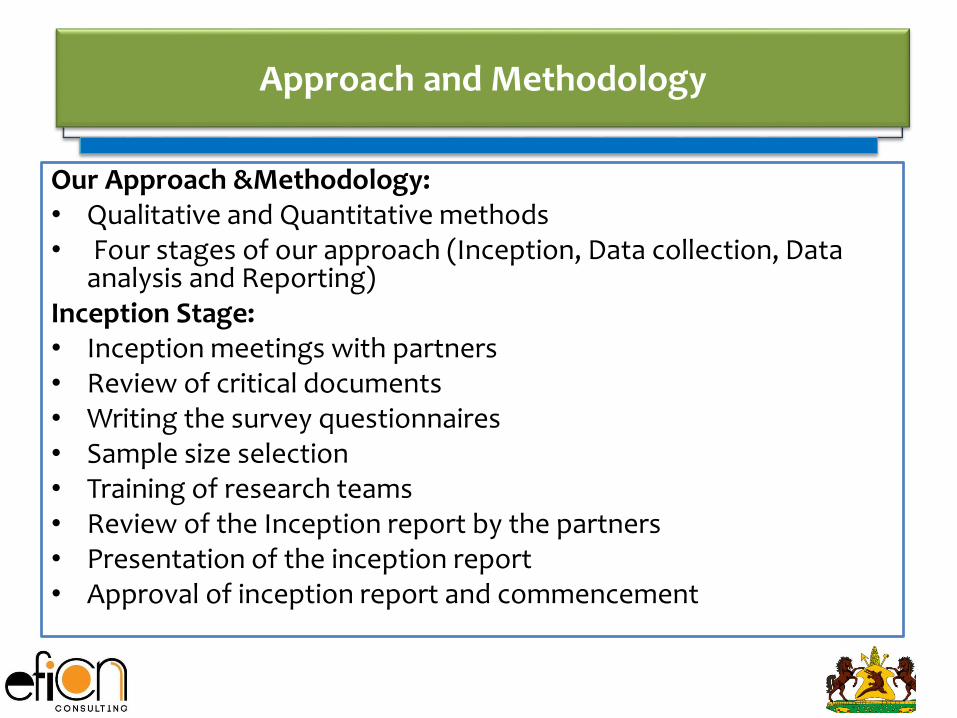
Our Approach &Methodology:• Qualitative and Quantitative methods• Four stages of our approach (Inception, Data collection, Data
analysis and Reporting)Inception Stage:• Inception meetings with partners• Review of critical documents• Writing the survey questionnaires• Sample size selection• Training of research teams• Review of the Inception report by the partners• Presentation of the inception report• Approval of inception report and commencement
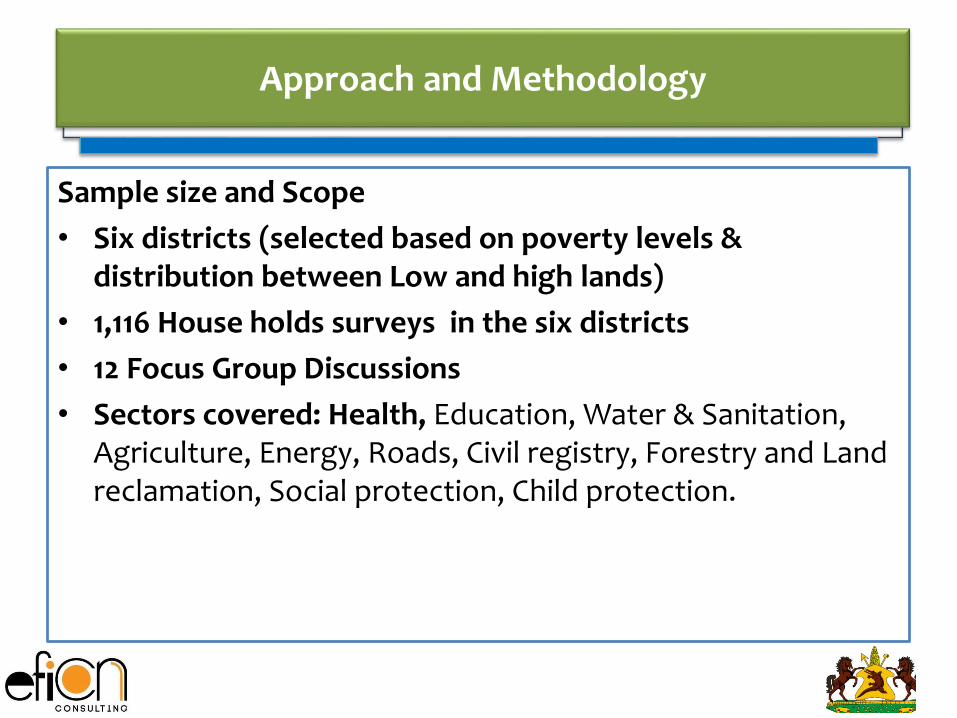
Approach and Methodology
Sample size and Scope
• Six districts (selected based on poverty levels & distribution between Low and high lands)
• 1,116 House holds surveys in the six districts
• 12 Focus Group Discussions
• Sectors covered: Health, Education, Water & Sanitation, Agriculture, Energy, Roads, Civil registry, Forestry and Land reclamation, Social protection, Child protection.

Data collection
• Household interviews
• Key informant interviews (KIIs)
• Focus group discussions, 2 per district, over 120 discussants
• Review of various reports
Data analysis
• Data cleaning
• Data entry using Epidata
• Data analysis using SPSS version 17
Report writing and presentation
KEY SURVEY FINDINGS

Findings- Education
Integrated Early Childhood Care and Development (IECCD)
• 63% of households had children between age of 3 and 5 years
• 59% of these households, had the children attending IECCD
• 47% in Urban and 73% in the rural areas
Main reasons for not sending children to IECCD
Not reasonable to at that age (28%)
No facilities for IECCD (227%)
Poor Care (26%)
No money to facilitate children to attend IECCD (17%)

Education
Quality of IECCD schools Less than 1% of the national budget is spent on IECCD
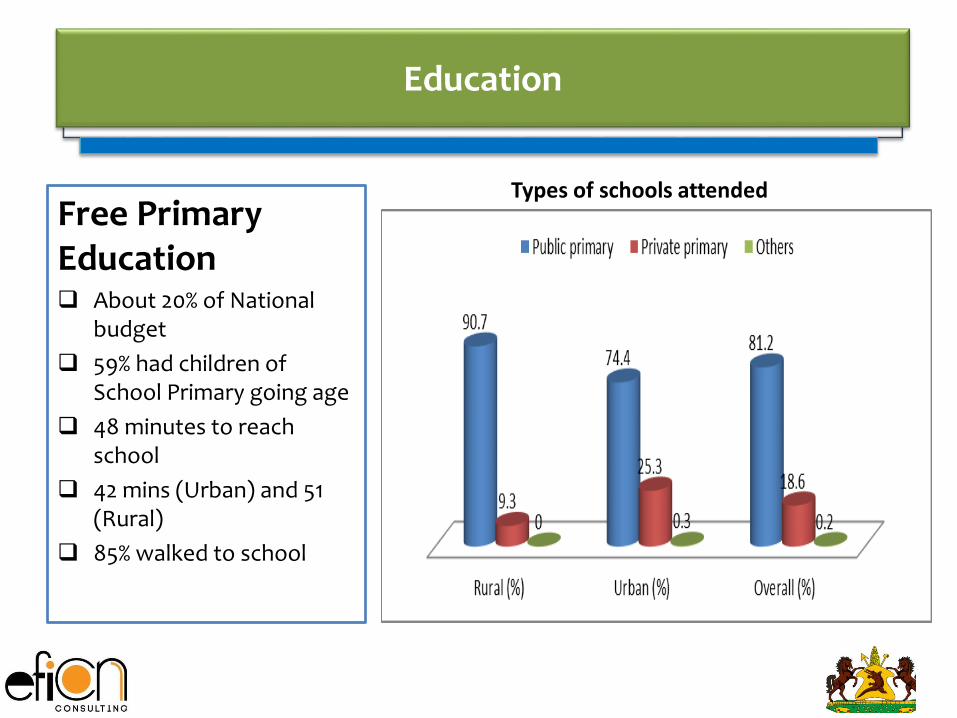
Education
Free Primary Education About 20% of National
budget
59% had children of School Primary going age
48 minutes to reach school
42 mins (Urban) and 51 (Rural)
85% walked to school
Types of schools attended

Education
• Quality of FPE

Education
Satisfaction with various aspects:Satisfied:
Quality of teachers (64%)
Quality of education (57%)
Taking care of children (51%)
Un satisfied:
school feeding (45%)
quality of infrastructure (33%)
distance to school (31.6%)
Quality of Education

Education
Factors limiting access to education services Inadequate service infrastructure (IECCD mainly)
Some parents cannot afford the IECCD 40 Maloti monthly facilitation for teachers
Shortage of food supply at the IECCDs and primary schools
Inadequate portions or poor food quality in FPE schools
Hidden costs that hinder FPE continuity
Long distances to schools ( 48 Minutes)

Health
Un satisfied clients Waiting time (31%
urban and 49% rural)
distance to health facilities (18% urban and 46% rural)
Emergency services (19% urban and 39% rural)
Those that Accessed Public health services in last 12 months

Health
Satisfaction with services (good or very good)
• 84% Urban
• 81% Rural
• All HIV AIDS counselling services (90% and above) ,
• TB treatment and support services (92%),
• Child immunisation services (90%)
Waiting time
• 50% waited between 1-4 hours) for services
• 29% waited for 5 to 12 hours for services
Perception on Quality of services
Health
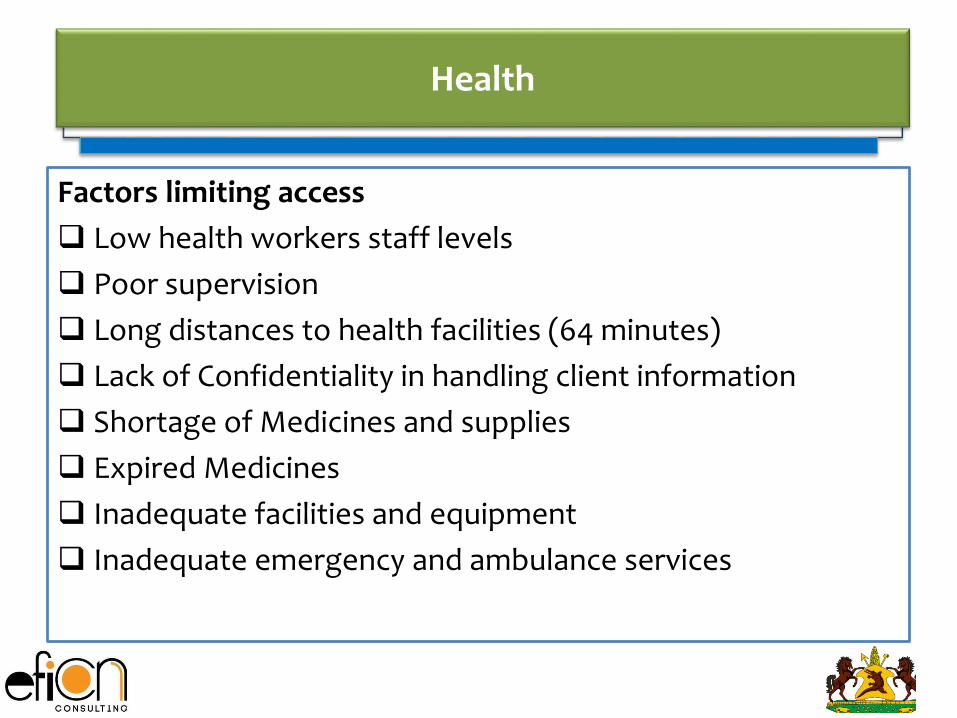
Factors limiting access
Low health workers staff levels
Poor supervision
Long distances to health facilities (64 minutes)
Lack of Confidentiality in handling client information
Shortage of Medicines and supplies
Expired Medicines
Inadequate facilities and equipment
Inadequate emergency and ambulance services

Water and Sanitation
• The most important natural resource in Lesotho!
• 77% have access to water sources (NDP 2012)
• 83% had access to water in the Rural areas (Survey)
• 88 % had access to water in the Urban areas (Survey)
• About 52% in the rural and 35% in Urban areas rated the water as being safe
• about 20% in the rural and 35% in the urban rated the water as being Unsafe
• About 16% in rural and 81% in urban paid money for the water they used
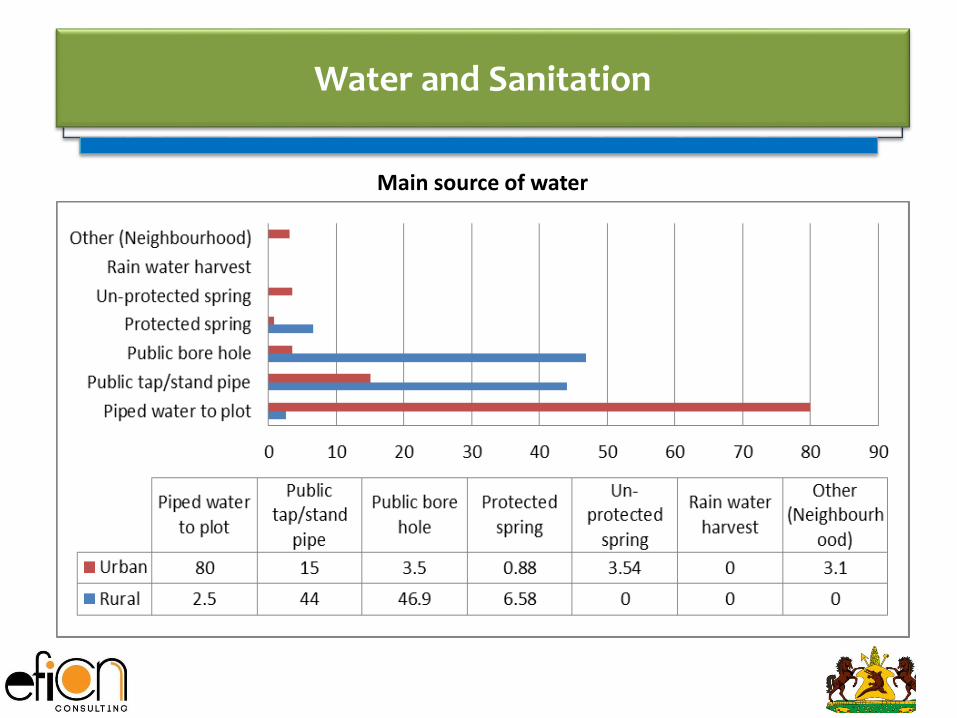
Water and Sanitation
Main source of water
Water and Sanitation
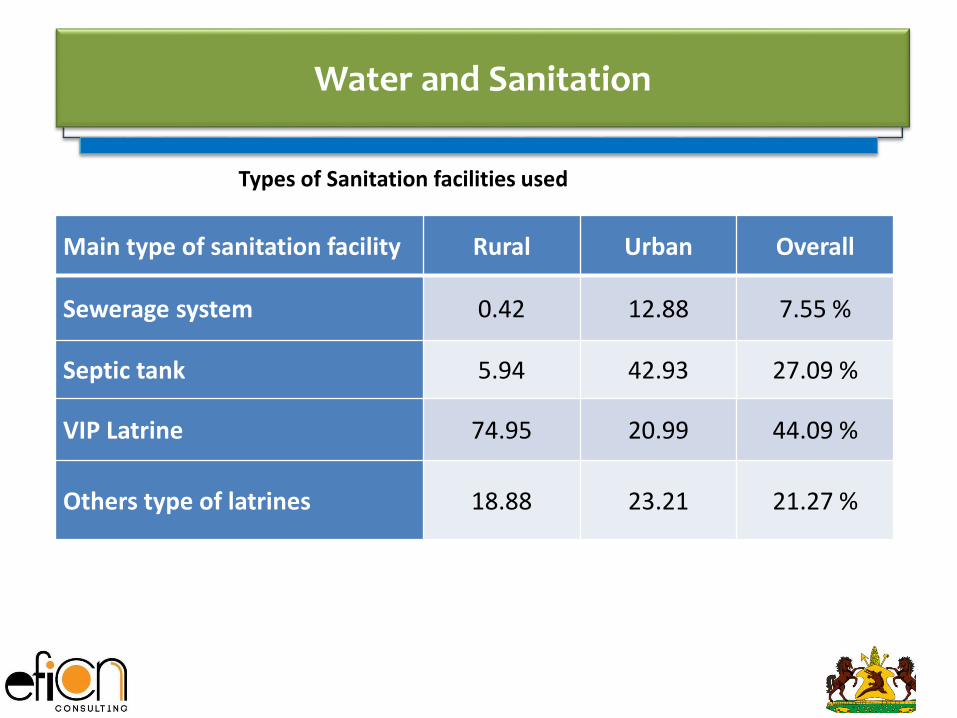
Main type of sanitation facility Rural Urban Overall
Sewerage system 0.42 12.88 7.55 %
Septic tank 5.94 42.93 27.09 %
VIP Latrine 74.95 20.99 44.09 %
Others type of latrines 18.88 23.21 21.27 %
Types of Sanitation facilities used

Water and Sanitation
Picture: Different types of Latrines
VIP Latrine Ordinary Latrine

Water and Sanitation
Factors limiting access to water and Sanitation services
• Contaminated or un-safe water
• Long Distances to water sources, takes over an hour on average
• Irregular Water supply especially in Urban areas
• Slow response to repair broken pipes and taps
• Increasing water costs by WASCO
• Poor community response to protection of water sources
• Poorly planned and built toilets
• Lack of pit latrine emptying facilities and resources
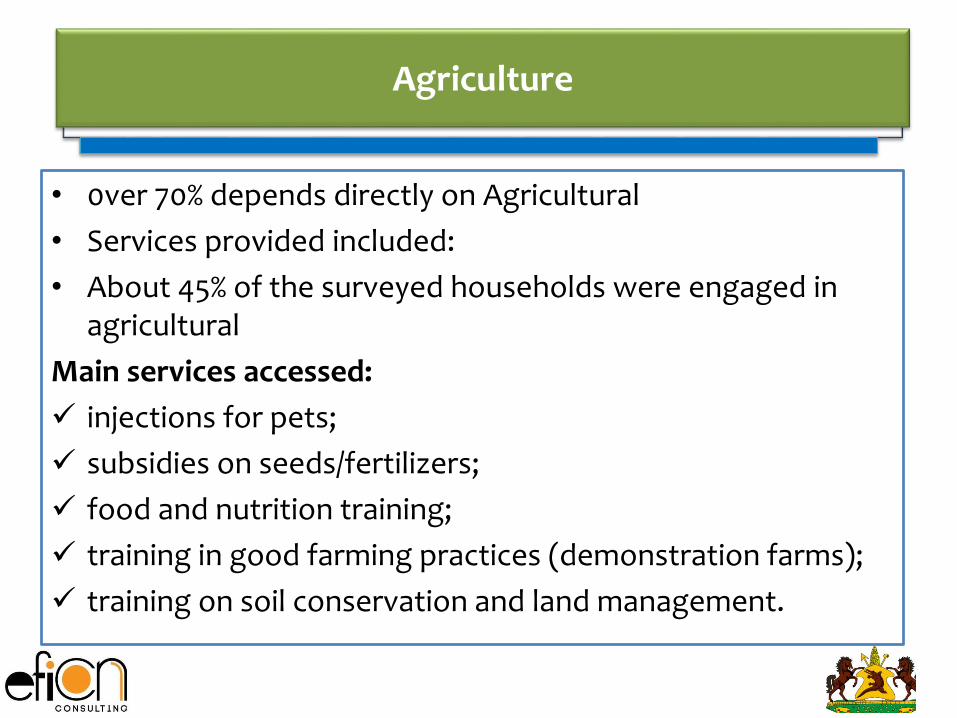
Agriculture
• 0ver 70% depends directly on Agricultural
• Services provided included:
• About 45% of the surveyed households were engaged in agricultural
Main services accessed:
injections for pets;
subsidies on seeds/fertilizers;
food and nutrition training;
training in good farming practices (demonstration farms);
training on soil conservation and land management.

Agriculture
Satisfaction with Agricultural services- Rural areas
Subsidy oninputs
Food andnutrition
sensitisation
GoodFarmingpracticestraining
Crop andLivestock
Marketing
Livestockprogramme
support
Managementof animal
theft
Satisfied 33 36 41 12 24 55
Neutral 13 26 18 40 30 6
Not satisfied 54 38 41 48 46 39
0
10
20
30
40
50
60
% p
erc
en
tage
Aspects of Agricultural services

Agriculture
Subsidy on inputsFood and nutrition
sensitisationGood Farming
practices trainingCrop and Livestock
Marketing
Livestockprogramme
support
Management ofanimal theft
Satisfied 14 14 18 3 8 19
Neutral 19 22 26 23 25 14
Not satisfied 67 64 56 74 66 67
0
10
20
30
40
50
60
70
80
% p
erc
en
tage
Aspects of Agricultural services
Satisfaction with Agricultural services- Urban Areas
Agriculture
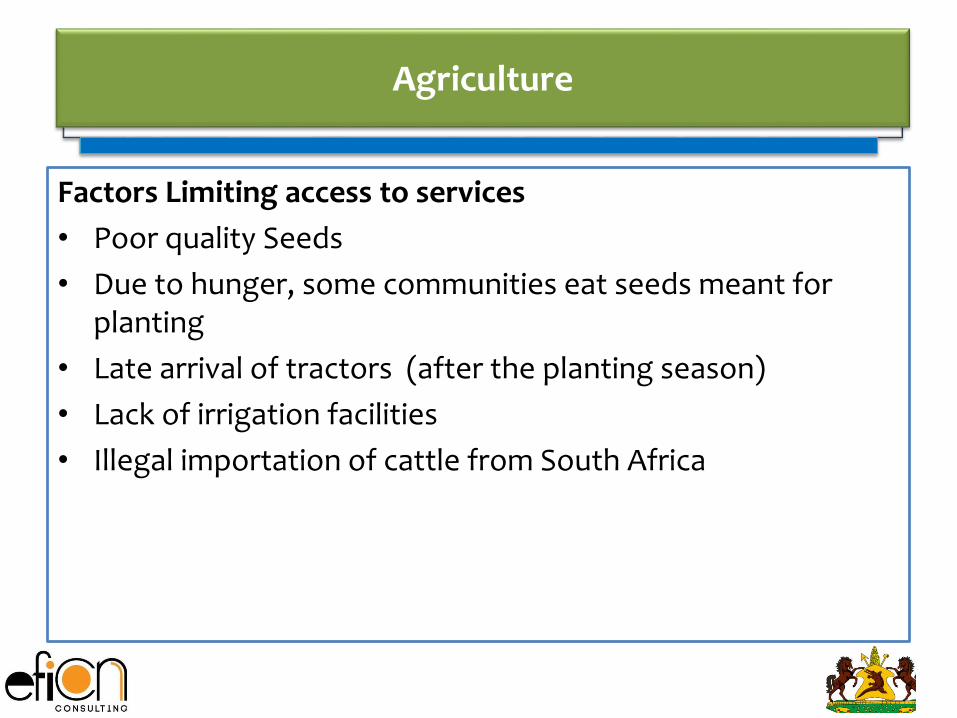
Factors Limiting access to services
• Poor quality Seeds
• Due to hunger, some communities eat seeds meant for planting
• Late arrival of tractors (after the planting season)
• Lack of irrigation facilities
• Illegal importation of cattle from South Africa

Civil Registry
Rural (%) Urban (%) Overall (%)
75
83 80
25
17 20
% percent
Accessed services in Civil registry
Yes No
Access to Civil registry services

Civil Registry
Rural (%) Urban (%)
Services1
day
2-5
day
2 w
eeks
1
mo
nth
>1
mo
nth
1 d
ay
2-5
day
2 w
eeks
1
mo
nth
Mo
re
than
1
mo
nth
Birth certificate 44.4 32.8 3.9 8.7 10.3 23.3 40.0 18.7 11.8 6.1
Death certificate 66.2 28.1 4.3 0.7 0.7 53.2 29.5 13.7 3.2 0.5
Marriage certificate
60.6 29.4 7.3 1.8 0.9 82.8 7.7 7.7 1.0 1.0
National ID 47.9 36.4 4.9 1.0 9.8 40.0 38.2 11.7 8.0 2.1
Passport 15.9 17.8 3.8 40.6 21.9 16.8 13.7 5.0 45.7 18.8
AVERAGE 47 28.9 4.84
10.56
8.72 43.2 25.8 11.4 13.94
5.7
Time taken to access the different services
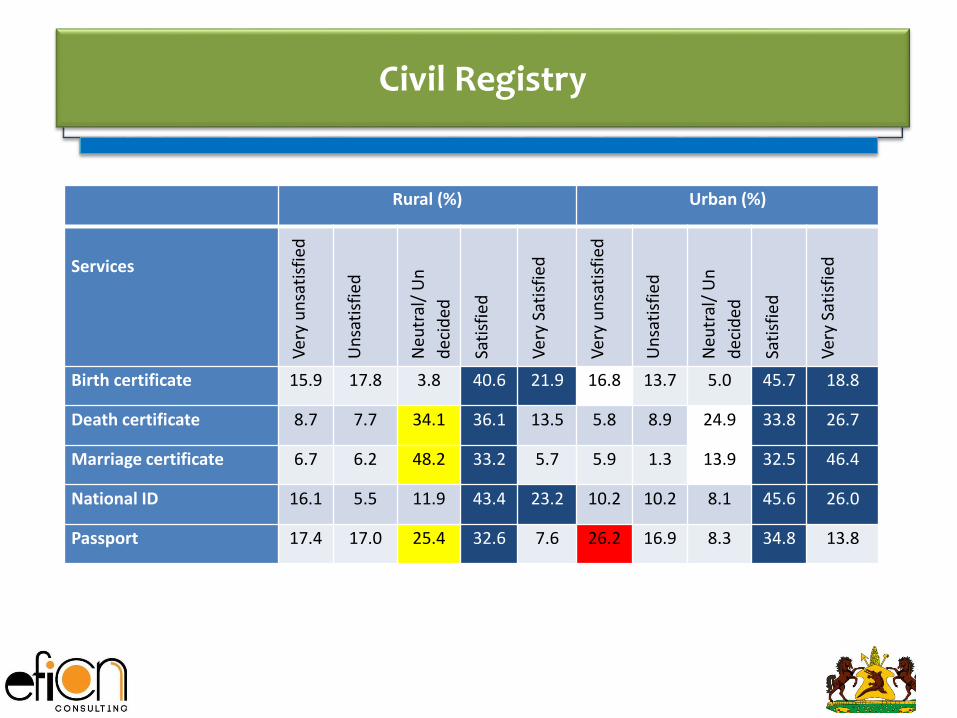
Civil Registry
Rural (%) Urban (%)
Services
Ver
y u
nsa
tisf
ied
Un
sati
sfie
d
Neu
tral
/ U
n
dec
ided
Sati
sfie
d
Ver
y Sa
tisf
ied
Ver
y u
nsa
tisf
ied
Un
sati
sfie
d
Neu
tral
/ U
n
dec
ided
Sati
sfie
d
Ver
y Sa
tisf
ied
Birth certificate 15.9 17.8 3.8 40.6 21.9 16.8 13.7 5.0 45.7 18.8
Death certificate 8.7 7.7 34.1 36.1 13.5 5.8 8.9 24.9 33.8 26.7
Marriage certificate 6.7 6.2 48.2 33.2 5.7 5.9 1.3 13.9 32.5 46.4
National ID 16.1 5.5 11.9 43.4 23.2 10.2 10.2 8.1 45.6 26.0
Passport 17.4 17.0 25.4 32.6 7.6 26.2 16.9 8.3 34.8 13.8

Civil Registry
• Awareness of Grievance handling
Civil Registry
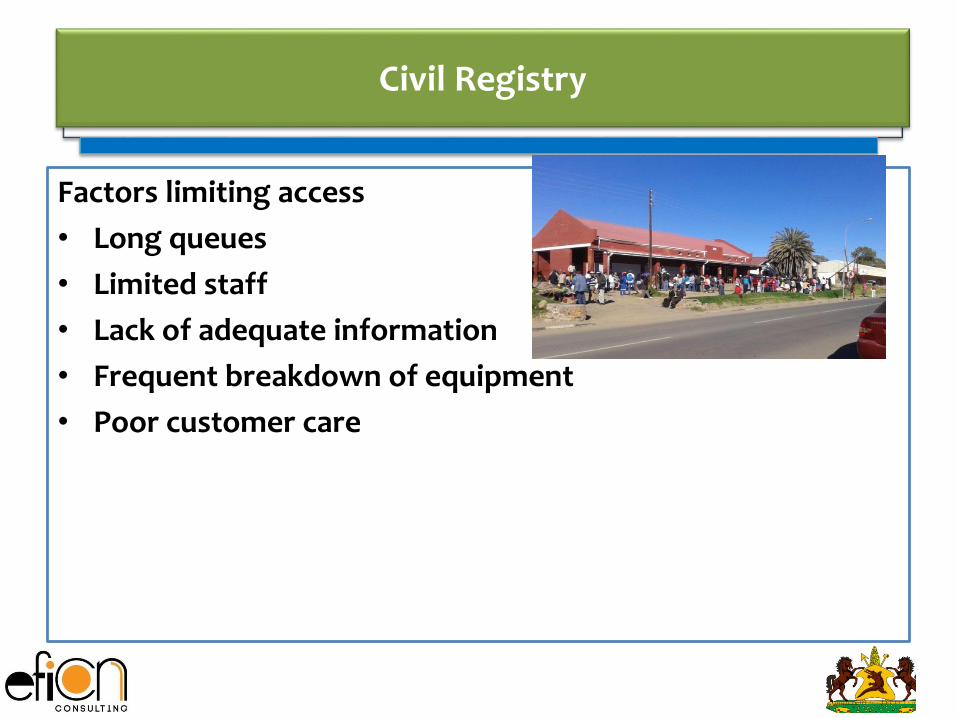
Factors limiting access
• Long queues
• Limited staff
• Lack of adequate information
• Frequent breakdown of equipment
• Poor customer care

Social Protection
• House hold’s Access to various services

Social protection
Satisfied clients %
Child Grants Programme
Free Primary Education
Public Assistance
OVC Bursary
Old Age Pension
Agricultural inputs
Public Works
School Feeding
68.2
50.8
55.6
41.6
66.8
51.5
24.4
14.7
53.6
83.7
48.9
61
75.5
24
55.9
42.8
% of satisfied clients with services
Urban Rural

Social Protection
Old age pension
Child protection services/Child Grants Programme
OVC Bursary
Public Assistance (poor Families-destitute)
69.6
15.4
9.1
7.2
69.2
10.1
14.9
11.2
Satisfaction with regularity of payment %
Urban Rural
Satisfaction with regularity of payment

Awareness of grievance handling mechanisms

Factors limiting access
A high age limit for Old age pension (70 years)
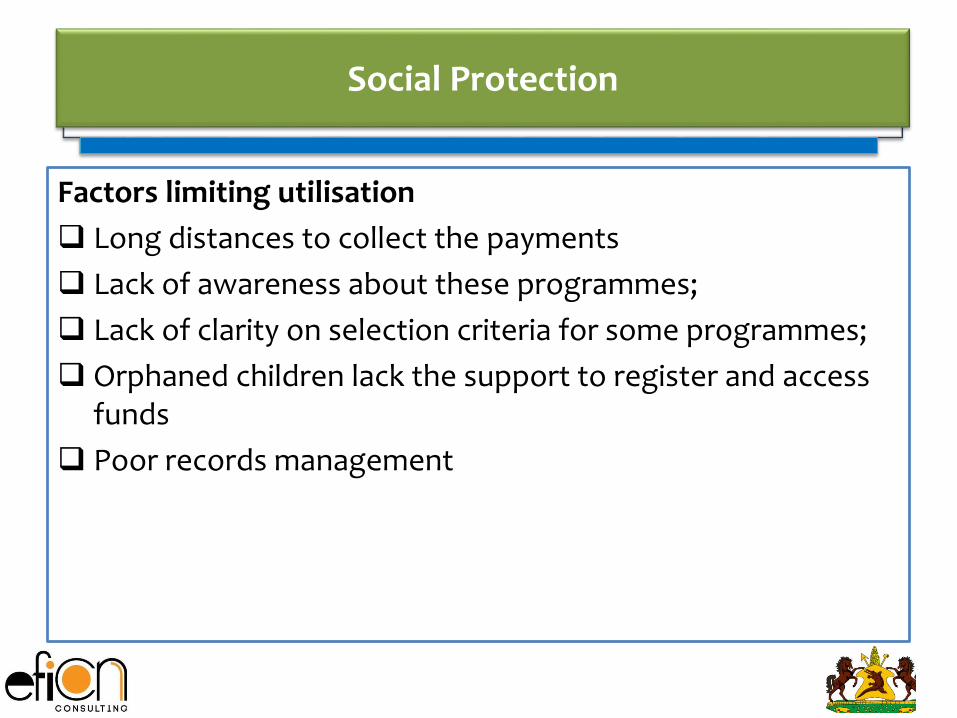
Social Protection
Factors limiting utilisation
Long distances to collect the payments
Lack of awareness about these programmes;
Lack of clarity on selection criteria for some programmes;
Orphaned children lack the support to register and access funds
Poor records management
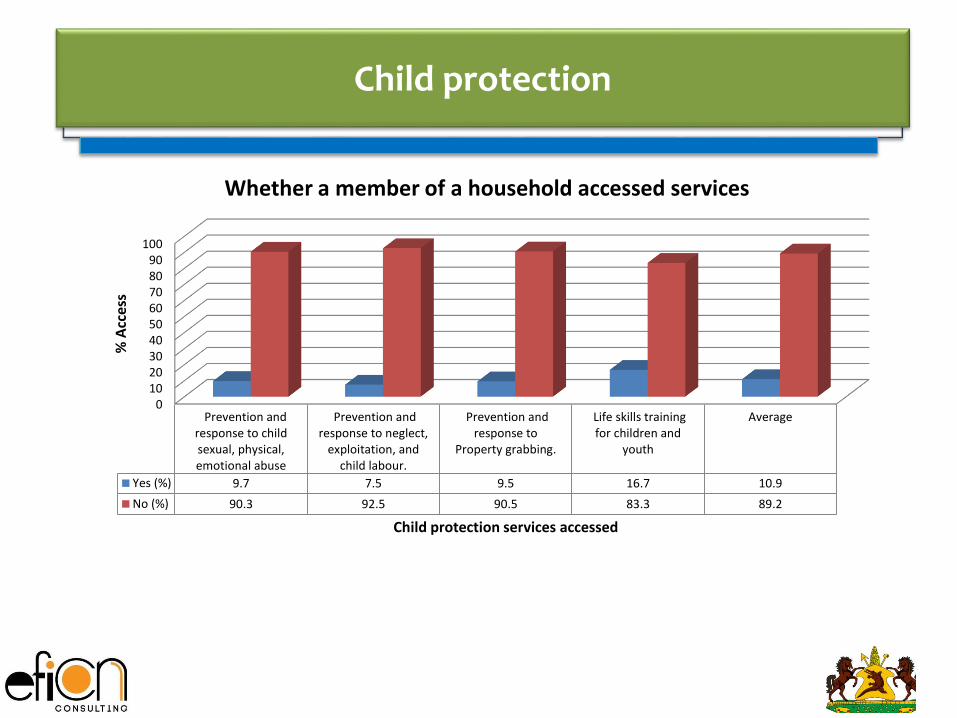
Child protection
0102030405060708090
100
Prevention andresponse to childsexual, physical,emotional abuse
Prevention andresponse to neglect,
exploitation, andchild labour.
Prevention andresponse to
Property grabbing.
Life skills trainingfor children and
youth
Average
Yes (%) 9.7 7.5 9.5 16.7 10.9
No (%) 90.3 92.5 90.5 83.3 89.2
% A
cces
s
Child protection services accessed
Whether a member of a household accessed services

Child Protection
Prevention and responseto child sexual, physical,
emotional abuse
Prevention and responseto neglect, exploitation,
and child labor.
Prevention and responseto Property grabbing.
Life skills training forchildren and youth
7670 66.6
37.4
78.2 82.4 80.886.4%
P
e
r
c
e
n
t
% Satisfied with child protection services
Rural Urban

Child Protection
Factors Limiting Access• Corruption in the handling of cases
• Lack of Information on Justice dispensation process
• Lack of Witness protection services
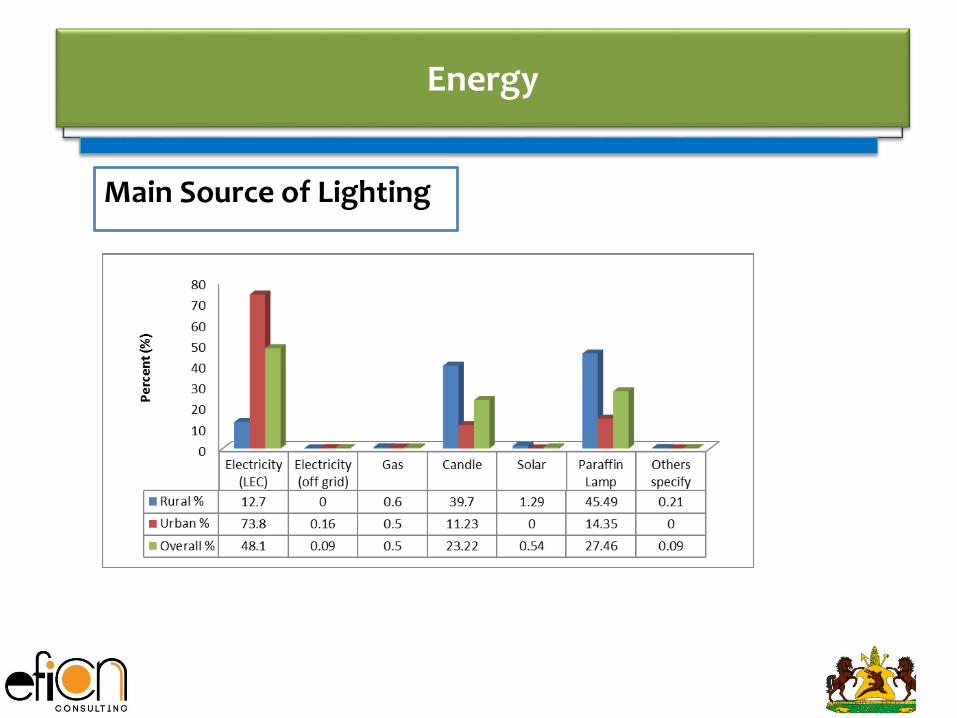
Energy
Main Source of Lighting

Main source of heating
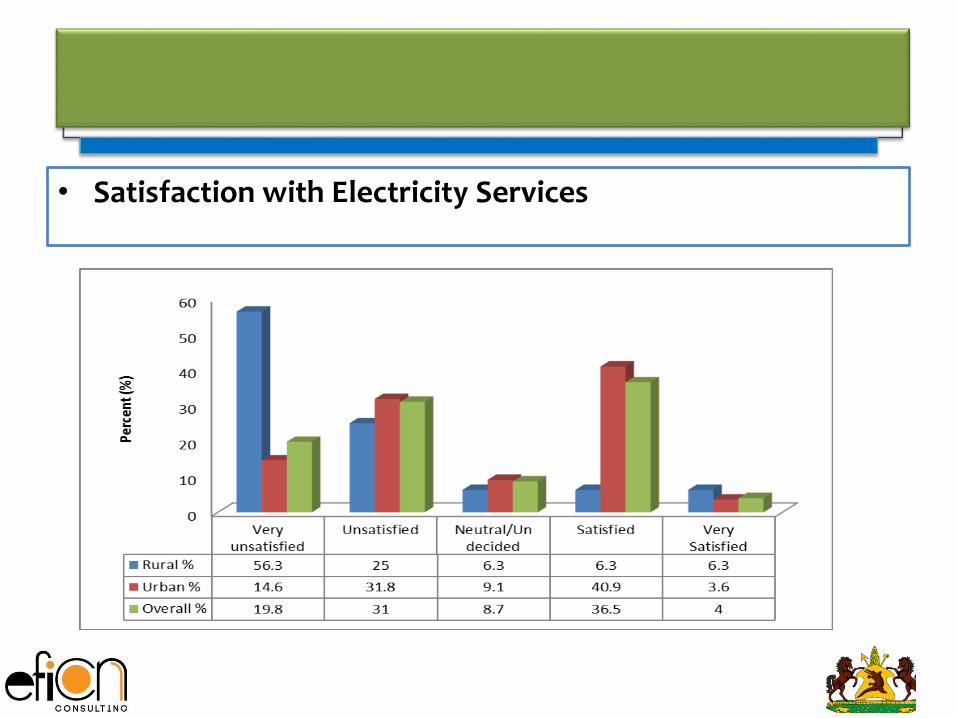
• Satisfaction with Electricity Services

Factors limiting accessibility
• Bio mass fuel sources are dwindling
• Limited affordable alternatives

Road Infrastructure
• Main means of transportation
1.8 0.4
45.9
9.9
42
19
0.2
40.8
1.4
38.6
11.7
0.3
43
5
40
Rural Urban Overall
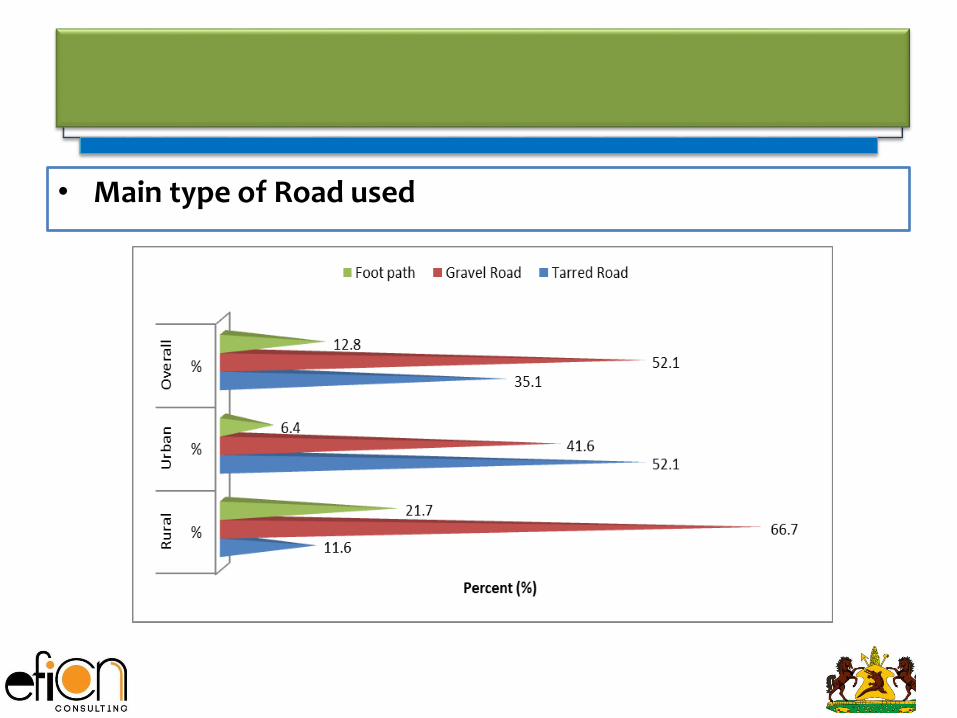
• Main type of Road used
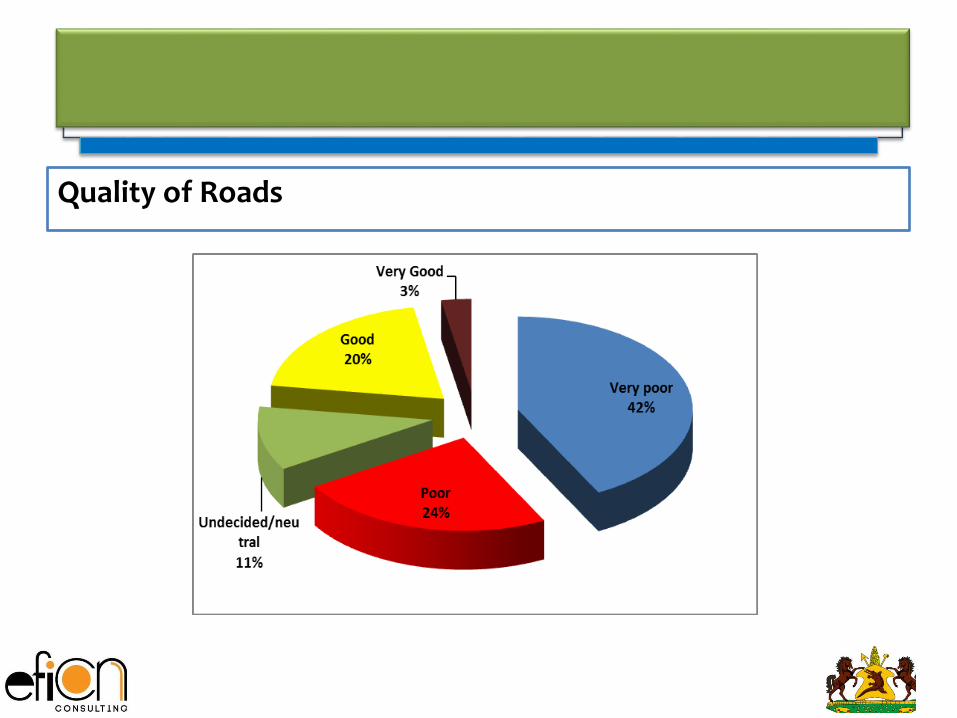
Quality of Roads
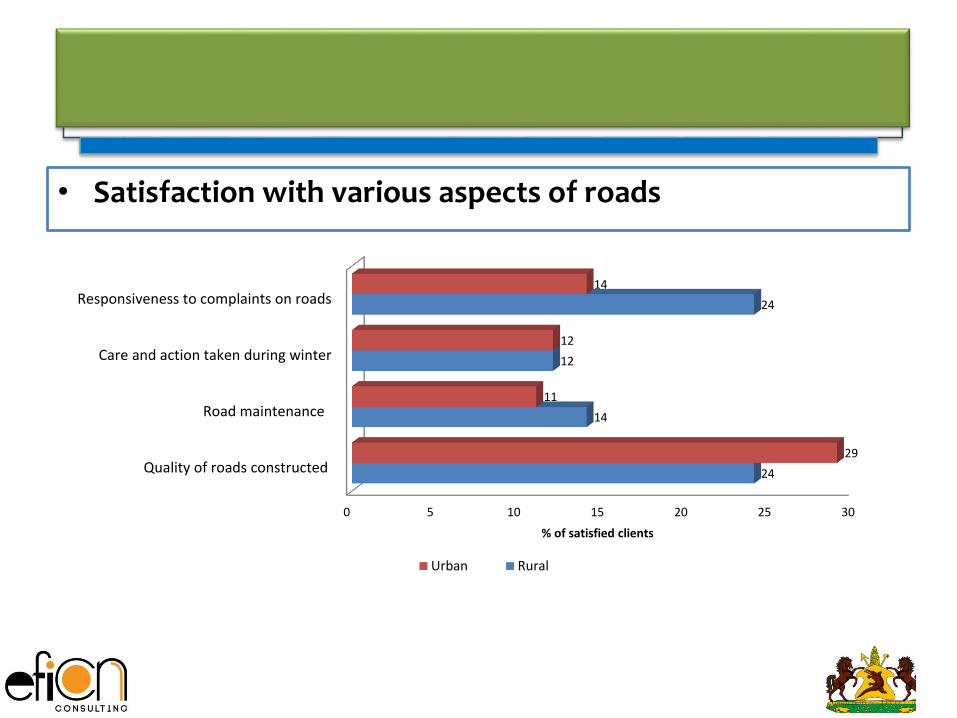
• Satisfaction with various aspects of roads
0 5 10 15 20 25 30
Quality of roads constructed
Road maintenance
Care and action taken during winter
Responsiveness to complaints on roads
24
14
12
24
29
11
12
14
% of satisfied clients
Urban Rural
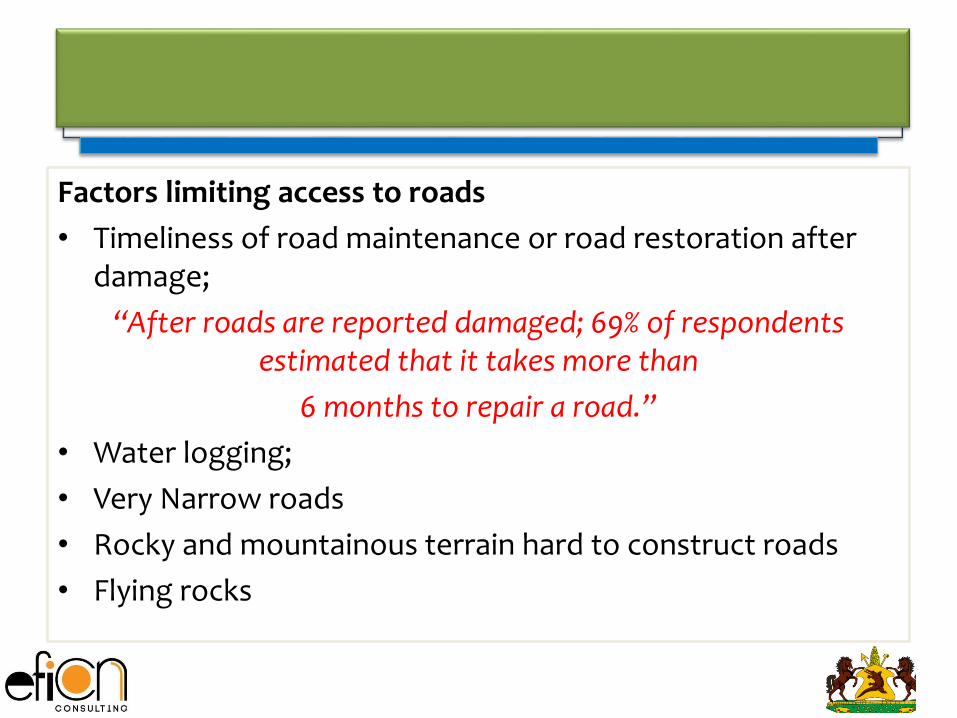
Factors limiting access to roads
• Timeliness of road maintenance or road restoration after damage;
“After roads are reported damaged; 69% of respondents estimated that it takes more than
6 months to repair a road.”
• Water logging;
• Very Narrow roads
• Rocky and mountainous terrain hard to construct roads
• Flying rocks

Forestry and Land reclamation
Awareness of services
Tree planting-
Water conservation
Proper range management
Control of soil erosion
Water harvesting infrastructures
49.7
54.7
46.7
52.3
56.6
10.2
25.3
15.3
14.6
21.8
40.1
20
37.9
33.1
21.6
Percent (%)
Yes Neutral No

• Satisfaction with service aspects
Tree planting-
Water conservation
Proper range management
Control of soil erosion
Water harvesting infrastructures
5.9
3.6
12
1.6
4.5
0.7
0.6
2
3.3
2.1
% Percentage
Service Aspects
Urban Rural
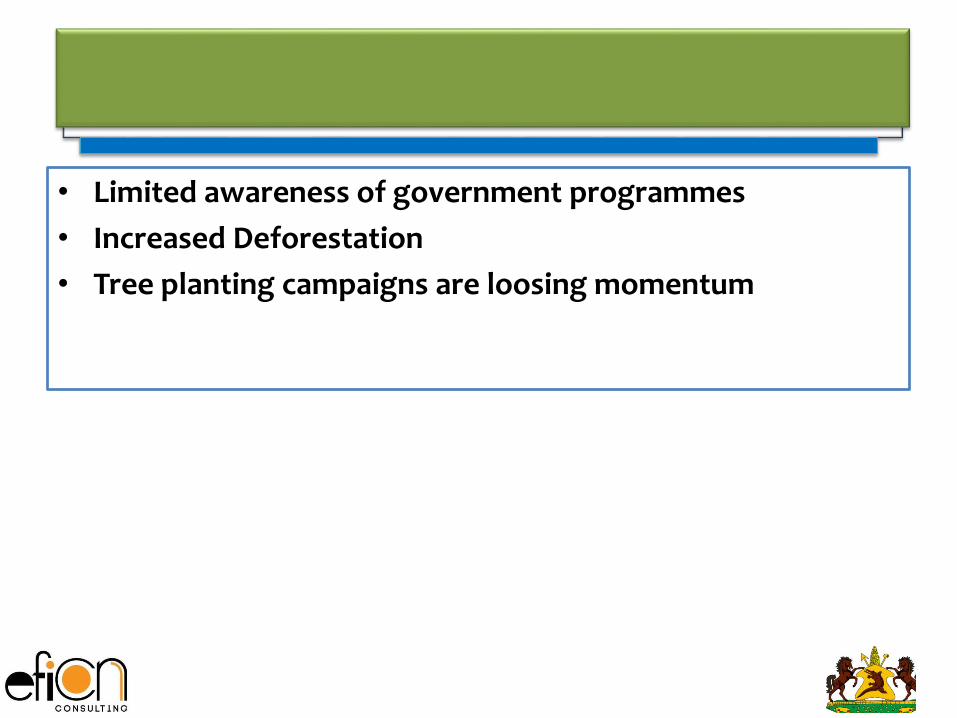
• Limited awareness of government programmes
• Increased Deforestation
• Tree planting campaigns are loosing momentum

INSTITUTIONAL CONSTRAINTS

General findings
• Planning Framework and capacity are still weak in particular sector and district planning processes are disjointed making it difficult to support service delivery in local governments appropriately
• Areas of disharmony between sector based legislation and policies with decentralisation framework; many of sector based legislation pre-date the LG Act or the Decentralisation Policy for example, under forestry, water, roads, forestry
• Roles between CG and LGs have not been very clear or understood and LGs do not often have the capacity to execute their roles affecting programme supervision. Ministries continue to undertake most of programme supervision
• The distinction between roles of chiefs and local politicians provided in the Decentralisation Policy, is yet to be fully acknowledged. Conflicts between Chiefs and local politicians (councillors) were cited widely as a hindrance to services delivery.

General Findings Continue ..
• Management of local government budgets affects service delivery; budgets of LGs are scattered across deconcentrated units; transfer of funds is often slow and unpredictable. LGs find it difficult to finance recurrent operations involving maintenance and supervision.
• Continued delay to form technical structures under LGs is a major limitation to the execution and supervision of service delivery operations
• Capacity of coordinating institutions is key: concerns that role of MLGC in the facilitating the relations with LGs was not properly played

Water
The water supply function is assigned to LGs • Need harmonisation of laws between LG Act and Water Act to
minimise risk in the management of water resources; • Improve coordination of actors in relation to the access and
management of water resources; waste disposal, land mgt, etc.• Capacity, both at the Water Commission / Water Affairs Dept. to
supervise the development and management of water sources within communities is limited.
• Capacity of LGs for the management of integrated water catchment areas – these are degrading rapidly as they are poorly protected
• Easier sources of water are drying up, due to Climate change effects, making the unit cost for service delivery high.
• Contributions from local populations do not always come readily (due to affordability or cooperation issues) under the water committees so maintenance and operations of systems, e.g. provision electricity of fuel for pumps, is often impacted.
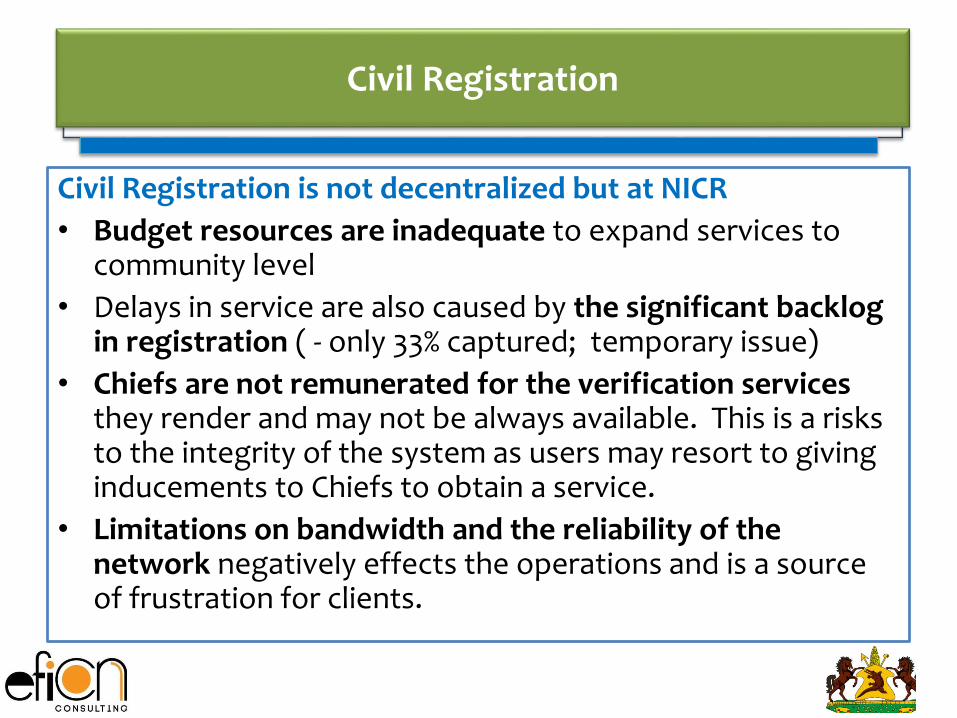
Civil Registration
Civil Registration is not decentralized but at NICR
• Budget resources are inadequate to expand services to community level
• Delays in service are also caused by the significant backlog in registration ( - only 33% captured; temporary issue)
• Chiefs are not remunerated for the verification services they render and may not be always available. This is a risks to the integrity of the system as users may resort to giving inducements to Chiefs to obtain a service.
• Limitations on bandwidth and the reliability of the network negatively effects the operations and is a source of frustration for clients.

Roads
Roads Directorate is for management of all roads; LGs are development and maintenance of access roads
• Capacity of Roads Directorate (RD) for technical support and enforcement of standards and quality assurance is not enough to cover the entire country
• Districts / LGs budgets are often small and not adequate for maintenance of community roads and are often delayed and are un-predictable.
• Although contractors are being trained, they often have limited resources (financial, technical staff, and equipment) and inadequate implementation experience and capacity.
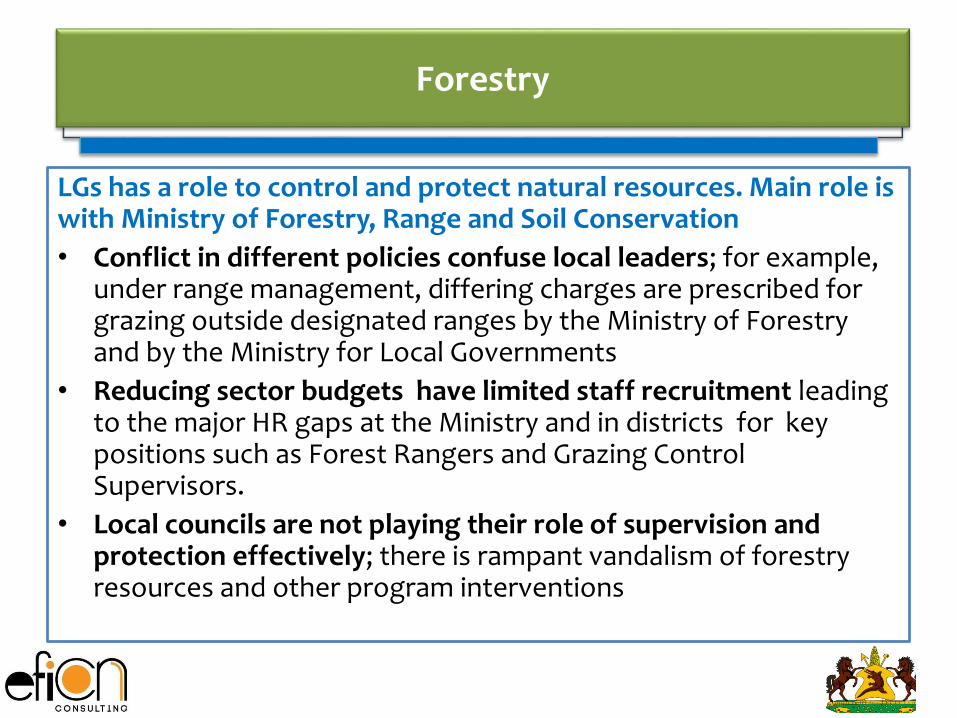
Forestry
LGs has a role to control and protect natural resources. Main role is with Ministry of Forestry, Range and Soil Conservation
• Conflict in different policies confuse local leaders; for example, under range management, differing charges are prescribed for grazing outside designated ranges by the Ministry of Forestry and by the Ministry for Local Governments
• Reducing sector budgets have limited staff recruitment leading to the major HR gaps at the Ministry and in districts for key positions such as Forest Rangers and Grazing Control Supervisors.
• Local councils are not playing their role of supervision and protection effectively; there is rampant vandalism of forestry resources and other program interventions

Agriculture
Ministry of Agriculture is central. Agriculture Functions to LGs are broad.
• Wide spread capacity gaps limiting ability to monitor farmers and farmer programmes; districts do not have staff of their own
• Information flow from districts to the national level however has remained a major challenge; for example reporting on the breakout of epidemics / disease.
• Commitment to agriculture programs by farmers is not always assured; cases of the diversion of inputs (seeds) / medication are cited
• Major weakness in the extension and monitoring services; as a result, production does not always meet expected yields because farmers do not often put enough effort into looking after their gardens.
• Subsidies have created a dependence syndrome; inputs provided by Government are often taken for granted, leading to the inefficient utilisation of resources by farmers.

Energy
Energy function is not decentralized - assigned to Energy Ministry
• Limited funding makes it difficult to extend the national grid to communities. Only 35% of households are connected.
• Lesotho is a net importer of electricity. High dependency on external sources (South Africa) is a risk in the pricing of electricity and limits the opportunities to reduce the costs of electricity as the FGDs wanted.
• Private companies often have limited capital for investments and are unable to significantly participate in the distribution / supply of energy.
• Poor standards control is affecting reliability of the energy services; uncontrolled energy related products are found everywhere on the market affecting the services
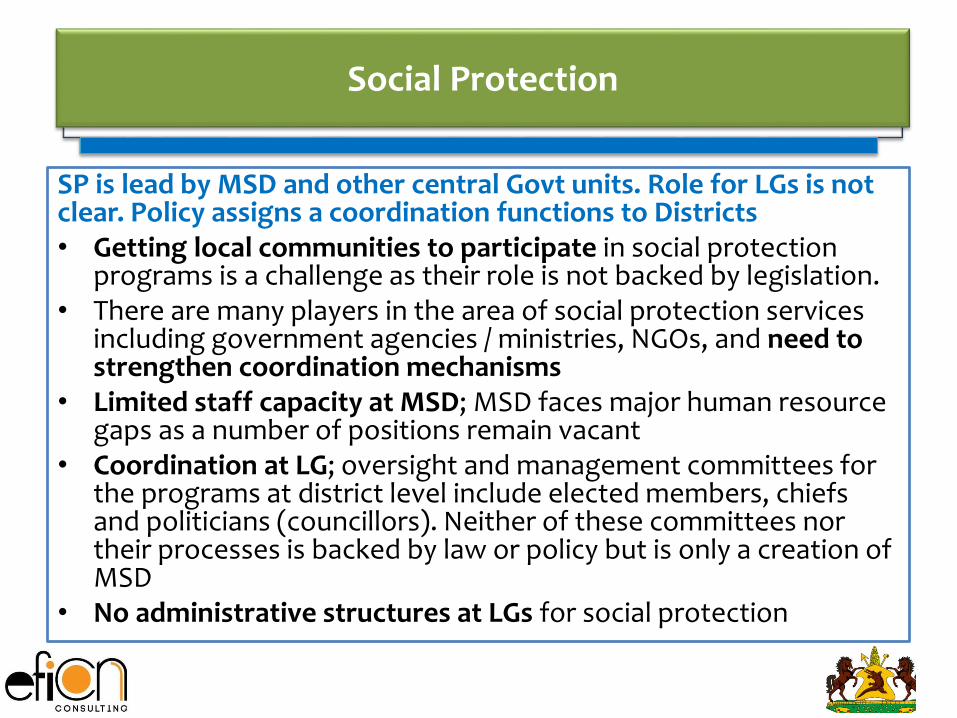
Social Protection
SP is lead by MSD and other central Govt units. Role for LGs is not clear. Policy assigns a coordination functions to Districts• Getting local communities to participate in social protection
programs is a challenge as their role is not backed by legislation.• There are many players in the area of social protection services
including government agencies / ministries, NGOs, and need to strengthen coordination mechanisms
• Limited staff capacity at MSD; MSD faces major human resource gaps as a number of positions remain vacant
• Coordination at LG; oversight and management committees for the programs at district level include elected members, chiefs and politicians (councillors). Neither of these committees nor their processes is backed by law or policy but is only a creation of MSD
• No administrative structures at LGs for social protection

Education
LGs has role primary and secondary education – but not devolved yet; LGs provide location and participate in governance of schools • Resources are insufficient to maintain / expand school
infrastructure as demand grows. • Some teachers above 60 years are still kept and some are un-
trainable. Retiring them from the system requires a lot of funds (retirement packages) which are not available.
• Members of schools boards are volunteers with tenure of 3 years. It is difficult to obtain the required commitment of members without some form of compensation.
• Capacity for supervision / inspection of schools is low. As a result, rural schools in particular tend to start the academic term late due to high absenteeism and find it difficult to complete the curriculum on time

KEY CHALLENGES / RECOMMENDATIONS
General Challenges
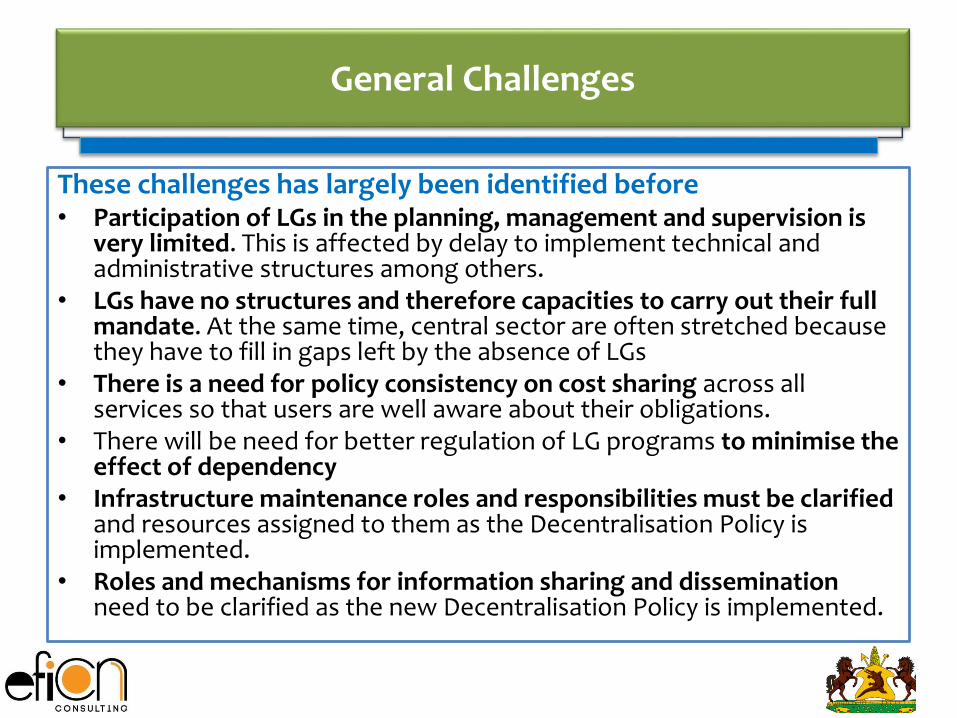
These challenges has largely been identified before• Participation of LGs in the planning, management and supervision is
very limited. This is affected by delay to implement technical and administrative structures among others.
• LGs have no structures and therefore capacities to carry out their full mandate. At the same time, central sector are often stretched because they have to fill in gaps left by the absence of LGs
• There is a need for policy consistency on cost sharing across all services so that users are well aware about their obligations.
• There will be need for better regulation of LG programs to minimise the effect of dependency
• Infrastructure maintenance roles and responsibilities must be clarified and resources assigned to them as the Decentralisation Policy is implemented.
• Roles and mechanisms for information sharing and dissemination need to be clarified as the new Decentralisation Policy is implemented.
Key Recommendations
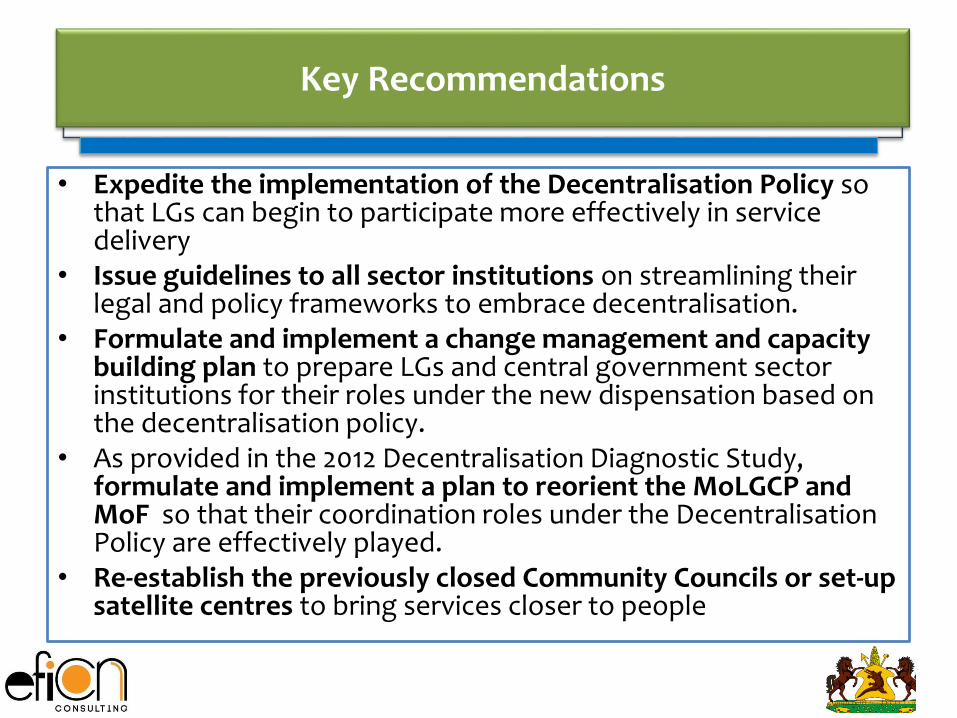
• Expedite the implementation of the Decentralisation Policy so that LGs can begin to participate more effectively in service delivery
• Issue guidelines to all sector institutions on streamlining their legal and policy frameworks to embrace decentralisation.
• Formulate and implement a change management and capacity building plan to prepare LGs and central government sector institutions for their roles under the new dispensation based on the decentralisation policy.
• As provided in the 2012 Decentralisation Diagnostic Study, formulate and implement a plan to reorient the MoLGCP and MoF so that their coordination roles under the Decentralisation Policy are effectively played.
• Re-establish the previously closed Community Councils or set-up satellite centres to bring services closer to people

THANK YOU - Q&A