quality of life & environmental · pdf file2014 performance report quality of life &...
TRANSCRIPT

QUALITY OF LIFE & ENVIRONMENTAL STEWARDSHIP
2 0 1 4 P E R F O R M A N C E R E P O R T
F L O R I D A D E P A R T M E N T O F T R A N S P O R T A T I O N

2014 PERFORMANCE REPORT Quality of Life & Environmental Stewardship
FDOTPERFORMS.ORG 4-1
QUALITY OF LIFE and ENVIRONMENTAL STEWARDSHIP
This report is part of the Performance-Based Planning and Programming Process
used by the Florida Department of Transportation (FDOT). For a description of
that process, updates to this report and other transportation performance
reporting initiatives of FDOT, go to FDOTPerforms.org.
INTRODUCTION
The Florida Department of Transportation’s (FDOT) decision-making
process considers the varied impacts of alternative transportation
investments. Transportation and environmental professionals use data
and analytical tools to evaluate the environmental effects of
transportation project alternatives.
FDOT’s environmental review process considers the physical, social,
cultural, natural, and human issues associated with each transportation
project. This results in avoided or mitigated impacts, public input, and
ultimately project advancement with environmental permits.
For maximum effectiveness, transportation planning should mesh with
land use, development, and environmental resource planning.
Transportation decisions should be made with attention to enriching
quality of life while ensuring responsible stewardship of the natural,
physical, and human environment.
2014 PERFORMANCE HIGHLIGHTS
FDOT delivers capital investments in transportation through the Work
Program as stewards of financial resources and of our state’s many
environmental and community assets. Key performance highlights
include:
Between 2002 and 2013, air quality in Florida continued to improve.
Maximum concentrations, measured by the statewide air monitoring
network, of carbon monoxide (CO) decreased by 65 percent, nitrogen
dioxide (NO2) by 25 percent, ozone (O3) by 15 percent, and fine
particles (PM2.5) by 32 percent.
Between 2003 and 2014, 617 transportation projects were screened
through the Efficient Transportation Decision Making (ETDM) process
which identifies and evaluates potential environmental impacts and
opportunities to avoid or mitigate such impacts.

2014 PERFORMANCE REPORT Quality of Life & Environmental Stewardship
FDOTPERFORMS.ORG 4-2
FDOT increased the tonnage of recycled pavement from about 570
thousand tons in 2005 to over 940 thousand tons in 2013—an
approximately 65 percent increase in less than a decade.
By 2014, FDOT had 1,023 alternative fuel vehicles in its vehicle fleet.
Ten years earlier FDOT’s fleet had only 335 alternative fuel vehicles.
This three-fold increase translates into fuel savings and improved air
quality.
FDOT takes seriously its leadership platform for environmental
stewardship. Through 2014 FDOT installed 515 noise barriers with an
equivalent mileage length of 165 miles. This is a significant financial
investment in noise mitigation and community quality of life.
Over the past 15 years, Florida advanced more than 1,400
transportation alternative / transportation enhancement projects such
as trails, bicycle, and pedestrian facilities.
Six of Florida’s 24 Scenic Highways (1,499 miles), have been designated
National Scenic Byways and one (the Florida Keys Scenic Highway) has
been awarded the special All-American Road designation. In 2004
Florida had 485 miles of designated Scenic Highways—the three-fold
increase by 2014 underscores the state’s natural beauty.
In 2013 nearly 50 million trips were provided to transportation
disadvantaged people across Florida. These trips provide vital access
to medical services, employment, and education. They also helped by
providing access to job training, day care facilities, and nutritional and
other life sustaining activities.
An Aging Road User Survey is conducted every year (with 2011 as the
baseline). Based on the survey, more aging road users have heard of
the Safe Mobility for Life Coalition (11 percent in 2013 as compared to
10 percent in 2012). Fifteen percent of survey respondents are
preparing for when they can no longer safely drive.

2014 PERFORMANCE REPORT Quality of Life & Environmental Stewardship
FDOTPERFORMS.ORG 4-3
AIR QUALITY
FDOT has identified a core measure related to the quality of life and
environmental stewardship of the transportation system, which is a
primary goal of FDOT. FDOT has a long-standing commitment to
maintaining air quality attainment levels.
Air quality is FDOT’s core measure for quality of life and environmental
stewardship. How we move people and goods can impact air quality.
Fortunately, vehicles are now far less polluting than in the past.
Technology has played a major role in the reduction of transportation-
related air pollution. Public transportation, bicycle/pedestrian
transportation, intermodal freight movement, transportation system and
demand management, and congestion reduction also help to improve air
quality. Because of its leadership role for Florida’s transportation system,
FDOT is committed to doing what it can to ensure clean air.
Motor vehicle pollutant emissions from the combustion of fuel have long
been tied to air quality. The primary air pollutants associated with
highway motor vehicles are carbon monoxide (CO), nitrogen oxides (NOX),
and volatile organic compounds (VOC), and to a lesser degree particulate
matter (PM10 and PM2.5). Emissions of NOX and VOC also contribute to the
formation of ozone, the primary component of what is commonly referred
to as smog. As shown in Figure 1, vehicle emission standards and
continued improvement in traffic flow have reduced fleet-wide pollutant
emissions over the past several decades. Further reductions are expected
with the implementation of the U.S. Environmental Protection Agency’s
Tier 3 Standards for passenger cars and trucks, even as the number of
vehicles on the road increases.
Florida is in compliance with the CO, NO2, O3, PM2.5, and PM10 National Ambient Air Quality Standards.
Figure 1: Emissions Trends for Highway Vehicles (Relative to 2002)
48%
0%
25%
50%
75%
100%
125%
2002 2013
CO
48%
2002 2013
NOx
54%
2002 2013
VOC
56%
0%
25%
50%
75%
100%
125%
2002 2013
PM2.5
67%
2002 2013
PM10
2012
101%
2002 2013
CO2
CORE MEASURE

2014 PERFORMANCE REPORT Quality of Life & Environmental Stewardship
FDOTPERFORMS.ORG 4-4
KEY STRATEGIES TO IMPROVE
AIR QUALITY
FDOT will pursue its targets related to the core measure of air quality
through these actions:
Congestion reduction and mitigation
Improved and expanded public transportation and increased use if
bicycle and pedestrian modes
SUPPORTING MEASURES AND
INFORMATION
In addition to its air quality core measure, FDOT has identified a supporting
measure:
Carbon Dioxide – CO2
Carbon Dioxide (CO2)
The combustion of fuel in motor vehicles results in the release of carbon
dioxide (CO2). Given the large number of motor vehicles on the road, a
significant portion of the total statewide CO2 emissions are from this
source. Figure 2 shows transportation related CO2 emissions in Florida
from 2002 through 2012. CO2 emissions from motor vehicles can be
reduced through vehicle fuel efficiency improvements, increased use of
public transportation, and traffic flow improvements.
CO2 emissions from motor vehicles can be reduced through vehicle fuel efficiency improvements, increased use of public transportation, and traffic flow improvements.
Figure 2: CO2 Emissions from Florida Transportation Sector
(Relative to 2002)
2002
1.00
Peak2006
1.152012
1.01%
0.0
0.5
1.0
1.5
2002 2003 2004 2005 2006 2007 2008 2009 2010 2011 2012
CO2
SUPPORTING MEASURE

2014 PERFORMANCE REPORT Quality of Life & Environmental Stewardship
FDOTPERFORMS.ORG 4-5
ENVIRONMENTAL INITIATIVES
FDOT has identified additional supporting measures and indicators of
progress that provide further detail and context about the performance of
Florida’s transportation system. For environmental initiatives, the
supporting measures are:
Project Screenings
Recycled Pavement
Alternative Fuel Vehicles
SUPPORTING MEASURES AND
INFORMATION
As a leading Florida employer, FDOT strives to be resource efficient in
terms of finances, processes, materials usage, and environmental
stewardship responsibilities. The following sections highlight three varied
initiatives that reflect environmental stewardship by FDOT relating to
transportation project delivery, resource recycling, and fleet management.
Project Screenings
FDOT strives to reconcile transportation improvements with surrounding
environmental assets as effectively and efficiently as possible. FDOT has
made significant progress through our Efficient Transportation Decision-
Making Process (ETDM) project screening. ETDM occurs in planning and
Project Development & Environment (PD&E) process as an integral part of
project delivery. Collaborating with environmental resource agencies
these processes help to avoid, minimize, and mitigate potential
environmental effects of proposed transportation projects. It also helps
preserve and enhance Florida’s natural, physical, cultural, and social
environment as FDOT develops, implements, and maintains transportation
facilities as cost-effectively as possible.
Process improvements have also translated into project improvements.
Such improvements range from early identification of environmental
concerns (leading to avoidance or minimization of potential impacts to
resources that preserve important historic assets) to adding project
features such as roadway lighting schemes that minimize impacts to
protected wildlife species. Mobility that respects the environment will
enhance and protect Florida’s unique quality of life for the long-term.
SUPPORTING MEASURE

2014 PERFORMANCE REPORT Quality of Life & Environmental Stewardship
FDOTPERFORMS.ORG 4-6
FDOT works with environmental resource agencies to create linkages
between land use, transportation, cultural, and environmental planning
initiatives. Along with agency-specific data, comments from the agencies
and the public are used to augment identification of and subsequently
avoid or minimize potential impacts to natural and cultural resources. As
shown in Figure 3, between 2003 and 2014, 617 transportation project
screenings occurred through the ETDM process.
Between 2003 and 2014, 617 projects have been screened through FDOT’s ETDM process.
Figure 3: Projects Screened Through ETDM
0
100
200
300
400
500
600
700
2003 2004 2005 2006 2007 2008 2009 2010 2011 2012 2013 2014
Cumulative through 2014:
617 projects

2014 PERFORMANCE REPORT Quality of Life & Environmental Stewardship
FDOTPERFORMS.ORG 4-7
Recycled Pavement
Roadway construction and reconstruction are increasingly using recycled
materials for cost savings and environmental benefits. The estimated
annual amount of recycled asphalt pavement has increased over 65
percent since 2005. As Figure 4 shows, in 2013 nearly 941 tons of recycled
asphalt pavement were applied to Florida highways. This was about a 13
percent increase over the prior year and the highest annual tonnage since
FDOT started tracking this measure in 2005. In addition, steel, concrete,
fill and other materials are occasionally recycled in construction projects.
Recycled asphalt pavement has increased over 65 percent since 2005.
Figure 4: Tons of FDOT Recycled Pavement
Alternative Fuel Vehicles
As an environmental steward, FDOT strives to be environmentally
responsible in its business practices and operations. As shown in Figure 5,
by 2014 FDOT had 1,023 alternative fuel vehicles in its fleet. By
comparison, ten years earlier the FDOT fleet had 335 alternative fuel
vehicles. This three-fold increase translates into fuel savings and
demonstrates FDOT’s active leadership as a major Florida employer for
improving air quality. The vast majority of FDOT’s alternative fuel vehicles
can be powered by either gasoline or ethanol.
FDOT has over 1,000 alternative fuel vehicles in its fleet.
Figure 5: Alternative Fuel Vehicles in FDOT Fleet
2005
569
2013
941
0
250
500
750
1,000
2005 2006 2007 2008 2009 2010 2011 2012 2013
0
200
400
600
800
1,000
1,200
1997 2000 2005 2010 2015
Cumulative through 2015 Model Year: 1,023
SUPPORTING MEASURE
SUPPORTING MEASURE
2014 PERFORMANCE REPORT Quality of Life & Environmental Stewardship
FDOTPERFORMS.ORG 4-8
ENVIRONMENTAL AND WILDLIFE PROTECTION
FDOT has identified supporting measures and other indicators of progress
that provide further detail and context about the performance of the
transportation system. For environmental and wildlife protection, they are:
Miles of Noise Walls
Wildlife Crossings
SUPPORTING MEASURES AND
INFORMATION
FDOT continues to improve the transportation system in ways that
demonstrate care for Florida’s unique wildlife resources as well as the
needs of people. This section highlights FDOT’s noise wall investments to
mitigate highway noise (typically associated with projects that expand
capacity) and consideration of wildlife crossings which has resulted in
approaches to facilitate the movement of wildlife safely over, under or
around transportation facilities.
Miles of Noise Walls
FDOT has made strides mitigating noise impacts where it has been warranted,
reasonable, and feasible to do so. All proposed highway capacity
improvement projects are evaluated for potential noise impacts. Where noise
impacts are predicted, mitigation normally in the form of noise walls, is
considered.
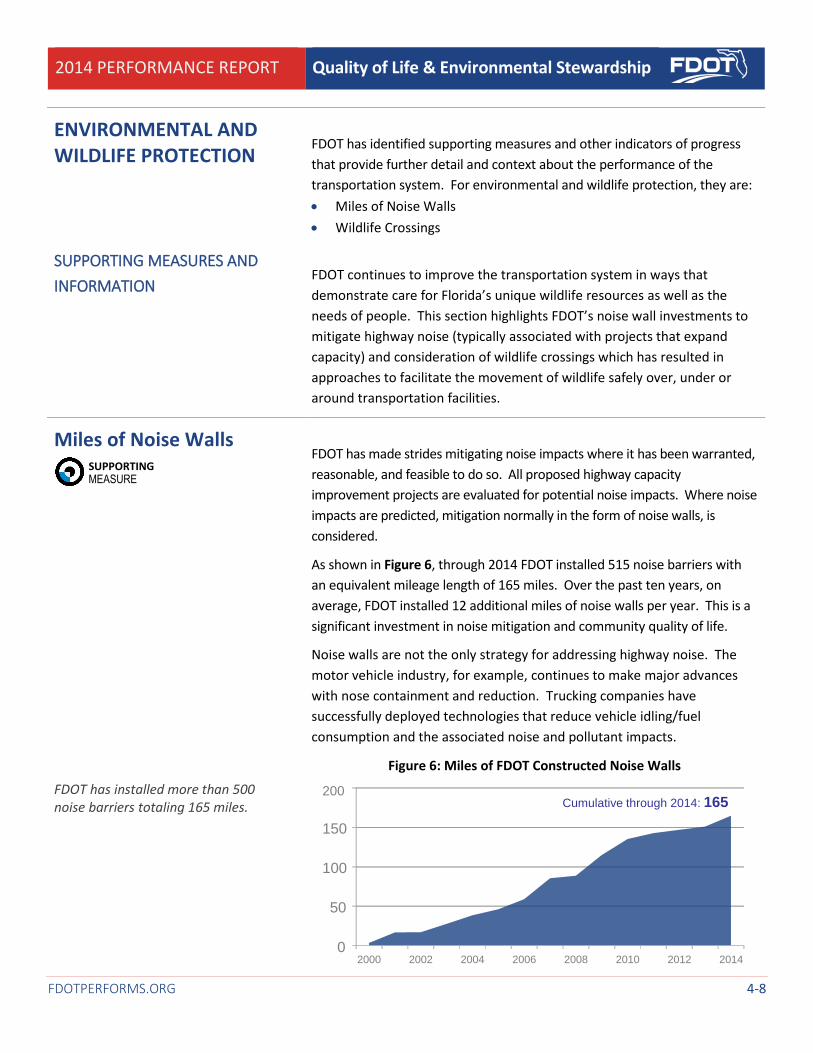
As shown in Figure 6, through 2014 FDOT installed 515 noise barriers with
an equivalent mileage length of 165 miles. Over the past ten years, on
average, FDOT installed 12 additional miles of noise walls per year. This is a
significant investment in noise mitigation and community quality of life.
Noise walls are not the only strategy for addressing highway noise. The
motor vehicle industry, for example, continues to make major advances
with nose containment and reduction. Trucking companies have
successfully deployed technologies that reduce vehicle idling/fuel
consumption and the associated noise and pollutant impacts.
FDOT has installed more than 500 noise barriers totaling 165 miles.
Figure 6: Miles of FDOT Constructed Noise Walls
0
50
100
150
200
2000 2002 2004 2006 2008 2010 2012 2014
Cumulative through 2014: 165
SUPPORTING MEASURE

2014 PERFORMANCE REPORT Quality of Life & Environmental Stewardship
FDOTPERFORMS.ORG 4-9
Wildlife Crossings
Florida’s natural beauty and quality of life have much to do with its vast
diversity of wildlife. The state is recognized as a national leader in
developing wildlife crossing structures. FDOT has provided safe crossings
for a wide range of indigenous Florida wildlife. Its innovative program
includes numerous types of crossings including:
Pipe and culvert systems
Modified box culverts with ledges for wildlife
Modification of existing bridges to provide dry passage on wood or
earthen shelves along edges
Other methods to enhance motor vehicle/wildlife safety, such as the
installation and ongoing evaluation of a Radio-Activated Detection
System on a portion of U.S. 41 to warn motorists of the potential
presence of the Florida Panther
FDOT has provided safe crossings for of a wide range of indigenous Florida wildlife.
FDOT routinely seeks out and evaluates innovative approaches to wildlife
species protection for potential application to state transportation
facilities.
FDOT established guidelines for statewide consistency in determining the
appropriateness of wildlife crossings/exclusionary devices. The guidelines
also help to provide consistency in the criteria to be considered when
designing transportation projects.
SUPPORTING MEASURE

2014 PERFORMANCE REPORT Quality of Life & Environmental Stewardship
FDOTPERFORMS.ORG 4-10
VIBRANT AND ATTRACTIVE COMMUNITIES
FDOT has identified supporting measures that provide further detail and
context about the performance of the transportation system for vibrant and
attractive communities, they are:
Designated Scenic Highways
Roadside Attractiveness
Roadsides Kept Litter Free
Transportation Alternatives/Transportation Enhancements
Transportation Disadvantaged Trips
SUPPORTING MEASURES AND
INFORMATION
This section provides examples of the range of FDOT programs and activities
that promote vibrant and attractive communities. We make a consistent
effort to keep roadsides litter free as well as pleasing to the eye through
various landscaping and beautification efforts. Some of our roadways
traverse scenic vistas and have so been designated as scenic highways.
Further, FDOT invests in transportation alternative/enhancement projects
that provide tremendous community benefits. Finally, our support of
transportation disadvantaged trips helps many people connect with their
communities who otherwise would have limited or no mobility options.
Highway Beautification
It is the policy of FDOT to conserve, protect, restore, and enhance Florida’s
natural resources and scenic beauty. The state strives to have the nation’s
most beautiful highways with safe roadsides that are durable, and
ecologically and economically sustainable.
FDOT is implementing roadside beautification projects using large trees, and
few if any shrubs. With thoughtful site specific design, this approach will
produce a high visual impact with a distinctive sense of place at a low design,
construction, and maintenance cost. Tall trees generously and safely placed
at the most highly traveled interchanges and gateways into and through
Florida communities (the state’s most visible landscapes) create a welcoming
and enjoyable experience, a first and lasting impression of the state and
individual communities.
As FDOT’s highest priority roadside landscapes are completed, beautification
can be routinely integrated into the processes used to plan, design,
construct, and maintain roadways—roadways that accommodate bold
performing landscapes that enhance private enterprise and public health,
safety, and welfare. Roadside landscape projects, in addition to being
aesthetically pleasing, can mimic natural processes that manage stormwater,
filter air, shade pedestrians, conserve energy, and provide wildlife habitat.

2014 PERFORMANCE REPORT Quality of Life & Environmental Stewardship
FDOTPERFORMS.ORG 4-11
Designated Scenic Highways
FDOT’s Scenic Highways Program promotes Florida as an attractive
destination for travelers, with cultural, historical, archeological,
recreational, natural and scenic qualities. As shown in Figure 7, among the
24 Florida Scenic Highways (a total of 1,499 miles), six have received
National Scenic Byway designation and one (the Florida Keys Scenic
Highway) was awarded the special All-American Road designation. For
more information go to www.floridascenichighways.com.
Florida’s designated scenic highways promote a heightened awareness of
the state’s exceptional resources and unique history through educational
and visual experiences. FDOT’s Scenic Highways Program was established
to showcase outstanding cultural, historic, archaeological, recreational,
natural and scenic resources along the state’s highway system. The
program promotes awareness of unique resources valued by Florida
residents and visitors. It also focuses on community-based support while
seeking to promote regional economic benefits that may result from scenic
highway designations.
Scenic highway designation is only awarded to transportation routes with
unique assets that enhance the experience of travelers, including scenic
vistas and portals to other unique community features. To be considered
for designation a community must demonstrate why a route is truly
significant, exceptional and distinctive, and how their proposed route will
complement the current set of designated scenic highways.
Of Florida’s 24 Scenic Highways, six have received National Scenic Byway designation, while one was awarded the special All-American Road designation.
Figure 7: Miles of Designated Scenic Highways
Cumulative through 2014: 1,499
0
500
1,000
1,500
1998 2000 2002 2004 2006 2008 2010 2012 2014
SUPPORTING MEASURE

2014 PERFORMANCE REPORT Quality of Life & Environmental Stewardship
FDOTPERFORMS.ORG 4-12
CUSTOMER SATISFACTION
SURVEYS
Since 2000, FDOT has periodically surveyed Florida residents, visitors,
commercial drivers, and public officials about our transportation products
and services. The survey results help FDOT track its progress in improving
customer satisfaction.
FDOT conducted its most recent biennial customer satisfaction surveys in
2014. More than 6,830 FDOT customers responded, including Florida
residents (3,189), visitors to Florida (403), public officials (432), and
commercial drivers (2,806).
More than 6,830 customers provided
feedback through FDOT’s most recent
customer satisfaction survey.
The following highlights from the customer satisfaction survey provides
resident and visitor impressions of the quality of Florida’s roadsides. For a
complete review of FDOT’s customer survey results, please visit the Florida
Customer Satisfaction Survey webpage at:
www.dot.state.fl.us/planning/customers. For customer satisfaction,
FDOT’s supporting measures are:
Roadside Attractiveness
Roadside Kept Litter Free

2014 PERFORMANCE REPORT Quality of Life & Environmental Stewardship
FDOTPERFORMS.ORG 4-13
Roadside Attractiveness
FDOT realizes that the travel experience itself has significant value for
transportation system users, particularly in light of Florida’s great natural
beauty. This focus on enhancing the Florida travel experience is
opportunity laden and provides an important reminder that
performance—at its core—is very much in the eye of the traveler/system
user.
As shown in Figure 8, the perception of surveyed Florida residents on
roadside attractiveness for the State Highway System (SHS) decreased
between 2000 and 2014 from 72 percent to 68 percent. Conversely,
visitors indicated an improved perception of roadside conditions with 92
percent agreeing that SHS roadsides are attractive. The large difference in
perception between residents and visitors suggests that Florida’s roadside
conditions are probably better than in many other states.
92 percent of Florida visitors feel that State Highway System roadsides are attractive.
Figure 8: Percent of Residents and Visitors that Feel the Roadside on the State Highway System are Attractive
2004
71%
2014
68%
2004
81%
0%
20%
40%
60%
80%
100%
2004 2005 2006 2007 2008 2009 2010 2011 2012 2013 2014
Visitors
Residents
2014
92%
SUPPORTING MEASURE

2014 PERFORMANCE REPORT Quality of Life & Environmental Stewardship
FDOTPERFORMS.ORG 4-14
Roadside Kept Litter Free
FDOT manages an Adopt-A-Highway program and installs signage to
discourage litter. In addition to the Adopt-A-Highway and its volunteer
resources, FDOT maintenance crews routinely remove highway litter.
Various county-level efforts to discourage litter are also undertaken.
Under the Adopt-A-Highway Program volunteers enter into a two-year
agreement with FDOT, agreeing to conduct litter removal at regularly
scheduled intervals. Many miles of highway are adopted statewide by various
organizations, allowing civic-minded people to make a difference in their
communities. This eases the load of FDOT work crews, enabling them to
devote more time to other road maintenance and special highway projects.
Volunteers enter into a two-year agreement with FDOT, agreeing to conduct litter removal at regularly scheduled intervals.
Volunteers agree to:
"Adopt" a two-mile section of a state highway
Dedicate two years to the program
Follow specified DOT safety regulations
Remove litter a minimum of four times each year
FDOT agrees to:
Assist with safety meetings
Provide safety vests and litter bags
Pick up litter at specified locations
Post Adopt-A-Highway signs commending organizations at the beginning and end of their sections.
A litter-free roadway is a highly ambitious goal with littering occurring
daily. As shown in Figure 9, over 93 percent of visitors to Florida perceive
SHS roads to be litter free, while 72 percent of Florida residents have a
similar perception. This is a high positive rating when considered in light
of the aspirational goal of being “litter-free.”
Over 93 percent of Florida’s visitors feel that State Highway System roads are litter free.
Figure 9: Percent of Residents and Visitors that Feel the Roadside on the State Highway System are Litter Free
2000
78% 2014
72%
2004
84%
0%
20%
40%
60%
80%
100%
2004 2005 2006 2007 2008 2009 2010 2011 2012 2013 2014
Visitors
Residents
201493%
SUPPORTING MEASURE

2014 PERFORMANCE REPORT Quality of Life & Environmental Stewardship
FDOTPERFORMS.ORG 4-15
FDOT, in partnership with the Federal Highway Administration, has
launched a multi-year litter prevention education campaign against
roadside litter. The message “DRIVE IT HOME…Keep Our Paradise Litter
Free” is promoted across the state on billboards, TVs, radios, buses and
social media. Sports and entertainment celebrities have been tapped to
promote the message and challenges have been created to tackle the little
problem.

2014 PERFORMANCE REPORT Quality of Life & Environmental Stewardship
FDOTPERFORMS.ORG 4-16
Transportation Alternatives/ Enhancements
Community visions and values are being supported through
implementation of projects under the federally-funded Transportation
Alternatives (TA) program (formerly the Transportation Enhancement,
Recreational Trails, and Safe Routes to School programs). FDOT currently
receives an average allocation of federal funding of about $50 million per
year under the program. TA projects can be community-based projects
that expand travel choices and enhance the transportation experience by
improving the cultural, historic, aesthetic and environmental aspects of
the transportation system. They can expand travel choice, strengthen the
local economy, improve the quality of life, and protect the environment.
On- and off-road pedestrian and bicycle facilities, improved access to
public transportation, community improvement activities, environmental
mitigation, recreational trails, and safe routes to school projects are
examples of TA projects.
FDOT has collaborated with numerous local governments over the past
two decades to provide opportunities to enhance community visions and
interests through TE and now TA projects. As shown in Figure 10, since
2000, these coordination efforts have resulted in the completion of 1,406
TA and TE projects totaling more than $562 million. This is a tremendous
investment contributing to quality of life across Florida.
FDOT has programed over a half billion dollars for Transportation Alternatives and Transportation Enhancement projects since 2000.
Figure 10: Transportation Alternatives & Transportation Enhancement
Project Funding
$M
$150M
$300M
$450M
$600M
2000 2002 2004 2006 2008 2010 2012 2014
Cumulative through 2014: $562M
SUPPORTING MEASURE

2014 PERFORMANCE REPORT Quality of Life & Environmental Stewardship
FDOTPERFORMS.ORG 4-17
Transportation Disadvantaged Trips
Lack of transportation is often cited as one of the greatest barriers to
community engagement for people with mobility challenges. The
transportation disadvantaged (TD) are those that are unable to transport
themselves or purchase transportation because of physical or mental
disability, income status, or age. The provision of transportation services is
their means for accessing employment, health care, education, and
participation in community and religious events and activities. These
services include both fixed route and demand response transportation.
Transportation disadvantaged trips fall into five categories:
Medical
Employment
Education / Training / Day Care
Nutritional
Life Sustaining / Other
As shown in Figure 11, in 2013 nearly 50 million transportation
disadvantaged trips were provided across Florida. The growth in trips
provided to transportation disadvantaged citizens has remained relatively
flat over the 12 year period between 2001 and 2013, however, during this
same period Florida’s population grew slightly more than 18 percent.
Approximately 50 million transportation disadvantaged trips are provided each year.
Figure 11: Transportation Disadvantaged Trips (millions)
2001
51.5M2013
49.6M
0
15M
30M
45M
60M
2001 2002 2003 2004 2005 2006 2007 2008 2009 2010 2011 2012 2013
SUPPORTING MEASURE

2014 PERFORMANCE REPORT Quality of Life & Environmental Stewardship
FDOTPERFORMS.ORG 4-18
According to the Florida Commission for the Transportation
Disadvantaged, medical trips are the top purpose for people riding the
Coordinated Transportation System. Medical trips account for 36 percent
of all trips followed by nutritional trips at 21 percent; education, training
and day care trips at 20 percent; trips to other life-sustaining activities at
14 percent; and employment trips at 9 percent. FDOT’s Secretary is an ex-
officio member of the Commission.
HEALTHY COMMUNITIES
In addition to its core and supporting measures, FDOT has identified
several topics that provide further context about the performance of
Florida’s transportation system for healthy communities, these topics are:
Safe Mobility for Life
Public Health and Transportation
Safe Mobility for Life Program
FDOT participates in the Safe Mobility for Life Program (formerly The Elder
Road Use Program) which promotes transportation safety for seniors.
Recent progress is particularly significant in light of Florida’s large and
growing senior population:
An Aging Road User Survey is conducted every year (2011 is the
baseline)
More aging road users have heard of the Safe Mobility for Life
Coalition (11 percent in 2013 as compared to 10 percent in 2012)
15 percent of survey respondents are preparing for when they can no
longer safely or comfortably drive

2014 PERFORMANCE REPORT Quality of Life & Environmental Stewardship
FDOTPERFORMS.ORG 4-19
Public Health and Transportation
The U.S. Department of Transportation and other agencies and
stakeholder organizations are focusing on the connection between public
health and transportation, recognizing that community design and active
transportation (e.g., walking and bicycling) can contribute to wellness and
reduced costs associated with chronic disease. See the following website
www.fhwa.dot.gov/planning/health_in_transportation/.
The Federal Highway Administration (FHWA) and Federal Transit
Administration (FTA) promote health through their policies and programs.
FHWA, FTA and FDOT have made significant investments in transit
infrastructure; bicycle and pedestrian plans, coordinators, and facilities;
Safe Routes to School programs; road safety; air quality improvements and
congestion reduction; and the management and operations of regional
transportation systems. FDOT is an active participant in these funding
programs.