quality of ground water around vadnais lake and in lambert ... · lambert creek watershed (fig. 2),...
TRANSCRIPT

QUALITY OF GROUND WATER AROUND VADNAIS LAKE
AND IN LAMBERT CREEK WATERSHED, AND
INTERACTION OF GROUND WATER WITH VADNAIS LAKE,
RAMSEY COUNTY, MINNESOTA
By James R Ruhl__________________________________
U.S. Geological SurveyWater-Resources Investigations Report 94-4062
Prepared in cooperation with the St. Paul Water Utility and the Vadnais Lake Area Watershed Management Organization
Mounds View, Minnesota 1994

U.S. DEPARTMENT OF THE INTERIOR
Bruce Babbitt, Secretary
U.S. GEOLOGICAL SURVEY
Gordon P. Eaton, Director
For additional information write to:
District Chief U.S. Geological Survey 2280 Woodale Drive Mounds View, MN 55112
Copies of this report can be purchased from:
U.S. Geological SurveyEarth Science Information CenterOpen-File Reports SectionBox 25286, MS 517Denver Federal CenterDenver, CO 80225

CONTENTS
Abstract.................................................................................................................................................................. 1Introduction........................................................................................................................................^ 1
Purpose and scope............................................................................................................................................ 2Previous studies................................................................................................................................................ 2Environmental setting...................................................................................................................................... 2Methods of investigation.................................................................................................................................. 6
Hydrogeology......................................................................................................................................................... 7Hydraulic properties......................................................................................................................................... 11Ground-water flow........................................................................................................................................... 11
Quality of ground water in glacial deposits........................................................................................................... 13Physical and chemical properties..................................................................................................................... 13Major and minor constituents........................................................................................................................... 17Volatile organic compounds............................................................................................................................. 19Nutrients...........................................................^ 19
Interaction of Vadnais Lake with ground water..................................................................................................... 22Estimation of seepage between Vadnais Lake and ground water in adjacent glacial deposits........................ 22Estimation of seepage between Vadnais Lake and ground water in the lakebed............................................. 24Evaluation of the two methods to estimate seepage between Vadnais Lake and the ground water................ 29Role of lake/ground-water interaction in the water quality of Vadnais Lake.................................................. 30
Summary................................................................................................................................................................ 31References cited................................................................^ 32Supplemental Information Section......................................................................................................................... 35
ILLUSTRATIONS
1-7. Maps showing:
1. Location of the Vadnais Lake and Lambert Creek watershed study area......................... 3
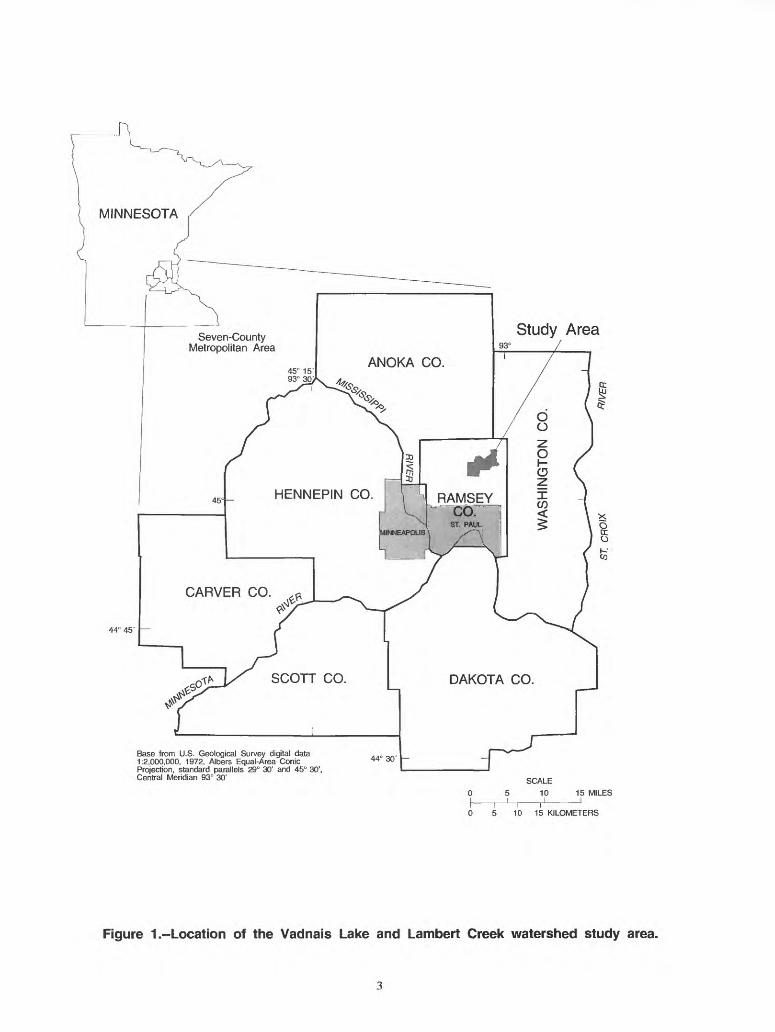
2. St. Paul Water Utility supply network.............................................................................. 4
3. Monitoring well locations, location of core samples from the wetlands, and location of minipiezometer sampling sites, in the Lambert Geek watershed study area.......................................................................................................................... 5
4. Thickness of unconsolidated-glacial and post-glacial deposits in the VadnaisLake and Lambert Creek watershed study area................................................................ 8
5. Bedrock geology in the Vadnais Lake and Lambert Creek watershed studyarea.................................................................................................................................... 9
6. Surficial geology in the Vadnais Lake and Lambert Creek watershed studyarea.................................................................................................................................... 10
7. Water-table surface and ground-water flow directions in glacial and post-glacial deposits in the Vadnais Lake and Lambert Creek watershed study area, October 1990..................................................................................................................... 12
111

ILLUSTRATIONS-Continued
8-9. Diagrams showing:
8. Percentage distribution of major ions in ground water from monitoring wellsin the Vadnais Lake and Lambert Creek watershed study area........................................ 18
9. Graph showing phosphorus content of peat in wetlands of Lambert Creek watershed........... 23
10. Map showing numbered shoreline and lakebed sections of Vadnais Lake used incalculation of lake/ground-water seepage............................................................................... 25
11. Hydrograph showing water-level fluctuations in monitoring wells that surroundVadnais Lake and the stage of Vadnais Lake during July 1,1990 through June 30,1991..... 26
12. Graph showing hydraulic gradient from lakebed to the lake measured at threedistances from shore and the assumed relation between hydraulic gradient and distancefrom shore................................................................................................................................ 28
13-27. Graphs showing water-level measurements for:
13. Monitoring well A............................................................................................................. 45
14. Monitoring well B............................................................................................................. 46
15. Monitoring well C............................................................................................................. 47
16. Monitoring well D............................................................................................................. 48
17. Monitoring well E............................................................................................................. 49
18. Monitoring well F............................................................................................................. 50
19. Monitoring well G............................................................................................................. 51
20. Monitoring well H............................................................................................................. 52
21. Monitoring well I.............................................................................................................. 53
22. Monitoring well J.............................................................................................................. 54
23. Monitoring well K............................................................................................................. 55
24. Monitoring well L............................................................................................................. 56
25. Monitoring well M............................................................................................................ 57
26. Monitoring well N............................................................................................................. 58
27. Monitoring well O............................................................................................................. 59
IV

TABLES
Table 1. Surface components of water budget for Vadnais Lake during warm weather periods of 1988 and 1989............................................................................................................
2. Field-measured water-quality properties and other data for ground-water samples collected from monitoring wells around Vadnais Lake and in Lambert Creek watershed study area................................................................................................................ 14
3. Major and minor constituents in ground-water samples collected from monitoringwells around Vadnais Lake and in Lambert Creek watershed study area............................... 15
4. Nutrients in ground-water samples collected from monitoring wells aroundVadnais Lake and in Lambert Creek watershed study area.................................................... 20
5. Annual seepage rates through a 10-feet deep vertical plane along shoreline sections of Vadnais Lake that were calculated from hydraulic conductivities and gradients determined from data collected in nearby glacial-drift monitoring wells during July 1990 through June 1991.......................................................................................................... 27
6. Annual seepage rates through lakebed sections in Vadnais Lake that were calculated from hydraulic conductivities and gradients measured in the lakebed during July 1991...................................................................................................................... 29
7. Geologic logs of monitoring well boreholes............................................................................ 36
8. Geologic logs of Vadnais Lake core samples.......................................................................... 41
9. Geologic logs of wetland cores collected from Lambert Creek watershed............................. 42
CONVERSION FACTORS, VERTICAL DATUM, AND ABBREVIATIONS
Multiply inch-pound unit Bv To obtain SI unit
inch (in.) 25.4 millimeter
foot (ft) .3048 meter
foot squared per day (ft2/d) .09290 meter squared per day
mile2 (mi2) 2.590 square kilometer
cubic foot per second (ft3/s) .02832 cubic meter per second
gallon (gal) 3.785 liter
gallon per minute (gal/min) .06309 liter per second
acre .4047 hectare
degrees Fahrenheit (°F) 5/9 x (°F) - 32) degrees Celsius
Sea Level: In this report, sea level refers to the National Geodetic Vertical Datum of 1929 (NGVD of 1929) geodetic datum derived from a general adjustment of the first-order level nets of both the United States and Canada, formerly called Sea Level Datum of 1929.

DEFINITION OF TERMS AND WELL LOCATION SCHEME (From Skougstad and others, p. 4,1979)
Dissolved. Pertainingtn the material inarepresentativp.wfltftrsampletharpas<^xthrniigha04S-mirmmptftrmftrnhranp
filter. This is a convenient operational definition used by Federal agencies that collect water data. Determinations of dissolved constituents are made on subsamples of the filtrate.
Suspended Total. The total amount of a given constituent in the part of a representative water sample that is retained on a 0.45-micrometer membrane filter. This term is used only when the analytical procedure assures measurement of at least 95 percent of the constituent determined.
The total amountofthegiven constituentin arepresentative water sample.regardlessoftheconstituent'sphysical or chemical form. This term is used only when the analytical procedure assures measurement of at least 95 percent of the constituent present in both the dissolved and suspended phases of the sample.
Total Recoverable. The amount of a given constituent that is in solution after a representative water sample has been digested by a method (usually using a dilute acid solution) that results in dissolution of only readily soluble substances. Complete dissolution of all paniculate matter is not achieved by the digestion treatment, and thus the determination represents something less than the total amount (less than 95 percent) of the constituent present in the dissolved and suspended phases of the sample.
R. 22 W. R. 20 W.
T. 32 N.
T. 30 N.
T. 28 N.
030N22W30ABA
The well numbering system used in this report indicates the location of wells within a rectangular subdivision of land defined by three numbers that indicate township, range, and section, respectively, and letters that designate successively smaller subdivisions of the section. Thus, the well designated as 30N.22W.30ABA is located to the nearest 10 acres in township 30 north, range 22 west, section 30, in the NE 1/4 of the NW 1/4 of the NE 1/4.
VI

QUALITY OF GROUND WATER AROUND VADNAIS LAKE AND IN
LAMBERT CREEK WATERSHED, AND INTERACTION OF GROUND WATER
WITH VADNAIS LAKE, RAMSEY COUNTY, MINNESOTA
By James F. Ruhl
AbstractVadnais Lake is located in northern Ramsey County, Minnesota. The lake is managed by the St. Paul Water Utility
for storage of municipal water supplies that are provided to residents of St. Paul and surrounding communities. In recent years, algal blooms in Vadnais Lake have caused taste and odor problems in St. Paul's municipal water supply. This problem has potentially been exacerbated by phosphorus enrichment of the lake from surface-water transport and from nutrient recycling between the lake and bottom sediments. Phosphorus loading in Vadnais Lake has been linked to increased algal growth. Surface-water drainage from supply lakes and, during wet years, from wetlands in Lambert Creek watershed, which extends over about 20 square miles east of the lake, is known to be a significant source of phosphorus. The role of ground water in the phosphorus budget of the lake was unknown. The results of this study indicate that ground-water transport of phosphorus into Vadnais Lake is a small part of the phosphorus budget of the lake.
Seepage into and out of Vadnais Lake was estimated by the following methods: (1) interpretation of the hydraulic conductivities of glacial deposits around the lake and of the hydraulic gradients between ground water in these deposits and the lake; and (2) interpretation of the hydraulic conductivities of lakebed materials and of the hydraulic gradients between ground water in the lakebed and the lake. The estimated net annual seepage out of the lake determined by the second method of 9.56 x 107 feet3 per year was greater by an order of magnitude than the value determined by the first method, which was 7.63 x 106 feet3 per year.
The net seepage out of Vadnais Lake was a small part of the lake water budget. Inflow to the lake is mostly streamflow from Sucker Creek, which is water from the Mississippi River routed through a series of lakes. Outflow from the lake is mostly withdrawals by the St Paul Water Utility. The net seepage out of the lake between spring and winter was from less than 1 to about 4 percent of the total loss attributed to withdrawals and evaporation.
The quality of the ground water in the study area was similar to the quality measured in shallow glacial-drift aquifers throughout Minnesota. Calcium magnesium bicarbonate water was the dominant type. Concentrations of volatile organic compounds in ground-water samples were below detection limits. The concentration of total phosphorus in ground-water samples generally was below 0.15 milligrams per liter.
The results of the seepage analysis and ground-water quality evaluation indicate that the effect of the quality of the surrounding ground water on the quality of Vadnais Lake probably was small. Ground water that discharged to the lake generally had lower concentrations of calcium, magnesium, bicarbonate, and total dissolved solids than the lake. The mixing of ground water with the lake slightly diluted the lake with respect to these constituents.
IntroductionVadnais Lake is located in northern Ramsey County,
Minnesota. The lake is managed by the St Paul Water Utility (SPWU) for storage of municipal water supplies that are provided to residents of St. Paul and surrounding communities. In recent years drinking water supplied from Vadnais Lake has had unpleasant tastes and odors during spring and summer because of algal blooms. These problems probably are linked to eutrophication of
Vadnais Lake. Phosphorus loading to Vadnais Lake is a particular concern of the SPWU because enrichment of the lake in this nutrient has created conditions potentially favorable for the growth of algae.
During 1989-90, in an effort to better define the source of phosphorus to the lake, the U.S. Geological Survey, in cooperation with the SPWU and the Vadnais Lake Area Watershed Management Organization (VLAWMO), studied the role of ground water on the quality of Vadnais
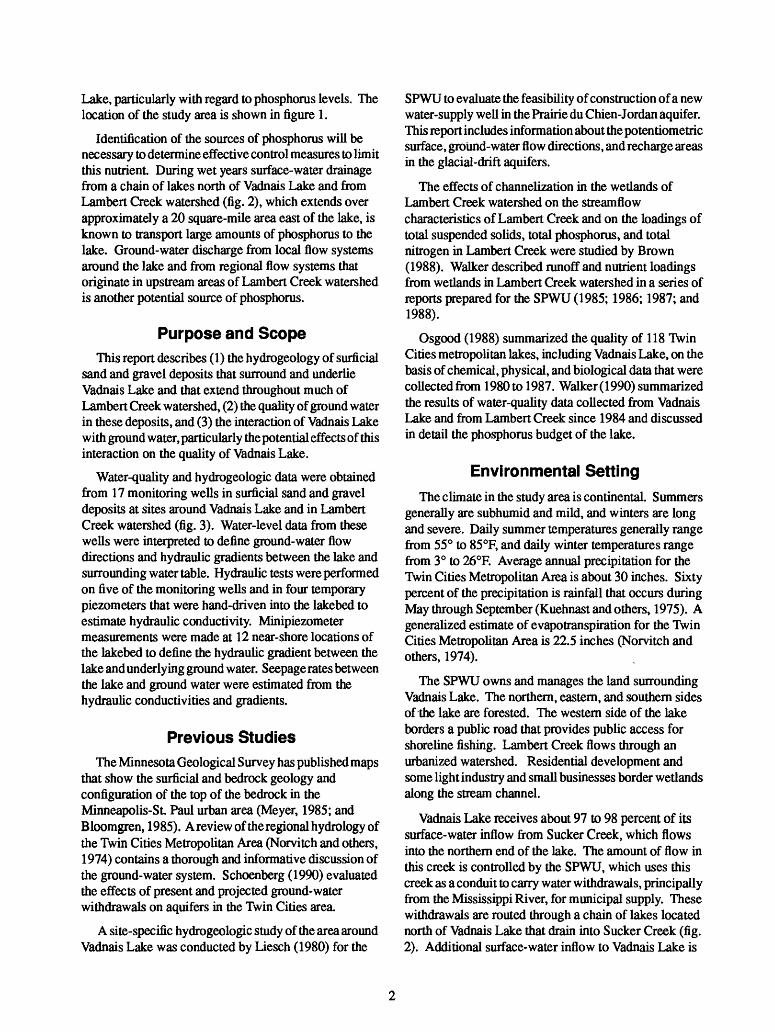
Lake, particularly with regard to phosphorus levels. The location of the study area is shown in figure 1.
Identification of the sources of phosphorus will be necessary to determine effective control measures to limit this nutrient During wet years surface-water drainage from a chain of lakes north of Vadnais Lake and from Lambert Creek watershed (fig. 2), which extends over approximately a 20 square-mile area east of the lake, is known to transport large amounts of phosphorus to the lake. Ground-water discharge from local flow systems around the lake and from regional flow systems that originate in upstream areas of Lambert Creek watershed is another potential source of phosphorus.
Purpose and ScopeThis report describes (1) the hydrogeology of surficial
sand and gravel deposits that surround and underlie Vadnais Lake and that extend throughout much of Lambert Creek watershed, (2) the quality of ground water in these deposits, and (3) the interaction of Vadnais Lake with ground water, particularly the potential effects of this interaction on the quality of Vadnais Lake.
Water-quality and hydrogeologic data were obtained from 17 monitoring wells in surficial sand and gravel deposits at sites around Vadnais Lake and in Lambert Creek watershed (fig. 3). Water-level data from these wells were interpreted to define ground-water flow directions and hydraulic gradients between the lake and surrounding water table. Hydraulic tests were performed on five of the monitoring wells and in four temporary piezometers that were hand-driven into the lakebed to estimate hydraulic conductivity. Minipiezometer measurements were made at 12 near-shore locations of the lakebed to define the hydraulic gradient between the lake and underlying ground water. Seepage rates between the lake and ground water were estimated from the hydraulic conductivities and gradients.
Previous StudiesThe Minnesota Geological Survey has published maps
that show the surficial and bedrock geology and configuration of the top of the bedrock in the Minneapolis-St. Paul urban area (Meyer, 1985; and Bloomgren, 1985). A review of the regional hydrology of the Twin Cities Metropolitan Area (Norvitch and others, 1974) contains a thorough and informative discussion of the ground-water system. Schoenberg (1990) evaluated the effects of present and projected ground-water withdrawals on aquifers in the Twin Cities area.
A site-specific hydrogeologic study of the area around Vadnais Lake was conducted by Liesch (1980) for the
SPWU to evaluate the feasibility of construction of a new water-supply well in the Prairie du Chien-Jordan aquifer. This report includes information about the potentiometric surface, ground-water flow directions, and recharge areas in the glacial-drift aquifers.
The effects of channelization in the wetlands of Lambert Creek watershed on the streamflow characteristics of Lambert Creek and on the loadings of total suspended solids, total phosphorus, and total nitrogen in Lambert Creek were studied by Brown (1988). Walker described runoff and nutrient loadings from wetlands in Lambert Creek watershed in a series of reports prepared for the SPWU (1985; 1986; 1987; and 1988).
Osgood (1988) summarized the quality of 118 Twin Cities metropolitan lakes, including Vadnais Lake, on the basis of chemical, physical, and biological data that were collected from 1980 to 1987. Walker (1990) summarized the results of water-quality data collected from Vadnais Lake and from Lambert Creek since 1984 and discussed in detail the phosphorus budget of the lake.
Environmental SettingThe climate in the study area is continental. Summers
generally are subhumid and mild, and winters are long and severe. Daily summer temperatures generally range from 55° to 85°F, and daily winter temperatures range from 3° to 26°R Average annual precipitation for the Twin Cities Metropolitan Area is about 30 inches. Sixty percent of the precipitation is rainfall that occurs during May through September (Kuehnast and others, 1975). A generalized estimate of evapotranspiration for the Twin Cities Metropolitan Area is 22.5 inches (Norvitch and others, 1974).
The SPWU owns and manages the land surrounding Vadnais Lake. The northern, eastern, and southern sides of the lake are forested. The western side of the lake borders a public road that provides public access for shoreline fishing. Lambert Creek flows through an urbanized watershed. Residential development and some light industry and small businesses border wetlands along the stream channel.
Vadnais Lake receives about 97 to 98 percent of its surface-water inflow from Sucker Creek, which flows into the northern end of the lake. The amount of flow in this creek is controlled by the SPWU, which uses this creek as a conduit to carry water withdrawals, principally from the Mississippi River, for municipal supply. These withdrawals are routed through a chain of lakes located north of Vadnais Lake that drain into Sucker Creek (fig. 2). Additional surface-water inflow to Vadnais Lake is
II (5'
c (5 (D
0) a 3
0) 55' 0)
(D 0) D
Q. r- 0) I o w 0) 1-+ a
93° 05' 93°
45° 10'
45° 05'
GeorgeWatchLake
Charles Lake
Aquaduct 6.45 miles from Mississippi River
BaldEagleLake
Vadnais Lake
is creek Boundary of Lambert Creek watershed
Base from U.S. Geological Survey digital data, 1:100,000, 1985 Universal Transverse Mercator projection, Zone 15
3 MILES
3 KILOMETERS
EXPLANATION BOUNDARY OF LAMBERT CREEK WATERSHED
A SUPPLY WELL
Figure 2.--SI. Paul Water Utility supply network.

45° 02' 30"
Base map from U.S. Geological Survey White Bear Lake West. 1:24,000, 1967. Photorevised 1972 & 1980.
EXPLANATION
BOUNDARY OF LAMBERT CREEK WATERSHED
0 N* MONITORING WELLLetter indicates well designation (Indicates nested well site)
.1 WETLAND CORE SAMPLE LOCATION AND CORE SAMPLE NUMBER
T LAKE-BED MINIPIEZOMETER SAMPLE 2 LOCATION AND SITE NUMBER
(Indicates lake-bed core site)
1 MILE
/2 1 KILOMETER
Figure 3.--Monitoring well locations, location of core samples from the wetlands, and location of minipiezometer sampling sites, in the Lambert Creek watershed study area.

from Lambert Creek watershed; however, this drainage is significantly smaller than the inflow from Sucker Creek. During April to September in 1988 and 1989, inflow to Vadnais Lake from Lambert Creek was about one percent of the inflow from Sucker Creek. About 97 percent of the water that leaves Vadnais Lake is withdrawn by the SPWU for municipal supply. Precipitation and evaporation are small in comparison to both the inflow from Sucker Creek and withdrawals by the SI WU (table 1).
Table 1 .-Surface components of water budget forVadnais Lake during warm weather periods of
1988 and 1989 (data from Walker, 1990)
1988 1989April - April -
September September
INFLOW COMPONENTS
Sucker Creek 1,415 1,261
Lambert Creek 8.8 17
Vadnais Creek 1.4 0.7 (gaged)
Vadnais Creek 0.7 2.1 (ungaged)
Precipitation 23 19.8
TOTAL INFLOW 1,448.9 1,300.6
OUTFLOW COMPONENTS
Withdrawals by St. 1,388 1,226 Paul Water Utility
Evaporation 42 37
TOTAL 1,430 1,263 OUTFLOW
NET RETENTION 18.9 37.6
The phosphorus load concentration to Vadnais Lake from surface-water inflow is influenced by climatic factors and the amount of this nutrient in the Mississippi River. The annual total load of phosphorus to Vadnais Lake during the period 1984 to 1989 ranged from about 2,250x 103 to3,160x 103 kilograms (Walker, 1990). The amount of this phosphorus retained in the water column or in the bottom sediments ranged from 27 to 54 percent Inflow from Sucker Creek is the source of approximately
two-thirds of this phosphorus, and runoff from Lambert Creek and some smaller local watersheds are the source of the remainder. During dry years (1987-89), when runoff from Lambert Creek was insignificant, the phosphorus load from this watershed also was insignificant.
Methods of InvestigationHydrogeologic data were collected during the drilling
of the boreholes used to install the monitoring wells (fig. 3). Holes were drilled with 6-inch hollow-stem augers. Geologic descriptions of the surficial glacial drift were recorded at each drilling site based on examination of the borehole cuttings (Supplemental Information Section, table 7). Additionally, geologic descriptions of the bed materials in Vadnais Lake were made from inspection of three cores that ranged in length from four to six feet (fig. 3) (Supplemental Information Section, table 8).
The horizontal hydraulic conductivity of the sand and gravel deposits along the shoreline of Vadnais Lake was estimated from the results of slug tests performed on monitoring wells A, B, C, E, and G (fig. 3). The procedures used to do these tests involved a quick addition of water to the wells followed by measurement of the rate of water-level decline with a pressure transducer. The slug test data were analyzed by the methods described by Bouwer and Rice (1976) and Bouwer (1989).
Descriptions of the thickness, color, texture, and organic content of peat deposits in Lambert Creek watershed wetlands were made from cores collected from three sites each on Goose Lake, Sobota Slough, and Rice Lake (fig. 3) (Supplemental Information Section, table 9). A total of nine cores were collected along two sides and near the center of each wetland. The cores extended from the frozen upper surface of the peat, or in open-water sites from the mucky bottom of the lakebed, down to the underlying mineral deposits (except in cores 2,4, and 9, which terminated in organic material). The cores were logged and samples were collected from the cores at the top and at depths of one and two meters below the top for nutrient analysis at the U.S. Geological Survey water- quality laboratory. A sample from a core collected at Goose Lake was delivered to the University of Minnesota Limnological Research Center for analysis to determine the age of the sediments based on pollen dating.
A synoptic measurement of water-levels in wells, surface-water bodies, and wetlands was conducted in October 1990 to determine water-table elevations in the study area. Surface-water elevations in the ponds, wetlands and Lambert Creek were determined by elevation surveys completed from established
benchmarks. These potentiometric surface data were interpreted to define lateral, near-surface ground-water- flow directions, and the relation of the level of Vadnais Lake to the surrounding water table. The hydraulic gradient between the lake and ground water combined with the estimated hydraulic conductivity of the sand and gravel deposits beneath and around the lake were analyzed to estimate the seepage into and out of the lake.
The vertical hydraulic gradient between Vadnais Lake and ground water in the underlying lakebed was measured using a hydraulic potentiomanometer (minipiezometer). The minipiezometer is a manometer attached by water-tight flexible tubing to a screened- tipped probe that can be hand-driven into bed materials of surface-water bodies (Winter and others, 1988). The minipiezometer was pushed approximately two feet into the bed of Vadnais Lake at distances of 15 to 25 feet from shore at 12 sites (fig. 3).
The hydraulic conductivity of the lakebed was estimated by both variable- and constant-head tests (Lee and Cherry, 1978) at four lakebed sites. The variable- head tests were performed on temporary piezometers by the same methods used on the permanent monitoring wells. The temporary piezometers consisted of short lengths of 1.25-inch inside diameter steel pipe attached to 6-inch long drive-point screens. The temporary piezometers were installed at minipiezometer sites 1,4,6, and 9 (fig. 3). The constant-head tests were performed at the same sites as the variable-head tests with a 3-foot length of 0.5-inch inside diameter hard plastic tubing that was perforated along 6 inches of one end. The perforated end was wrapped with nylon mesh and inserted approximately 2 feet into the lakebed. The other end, which protruded into the lake, was attached to a large balloon filled with a known volume of water. The change in the volume of water, which either increased or decreased depending on the hydraulic gradient, was measured during two or three time periods that ranged from 2 to 40 minutes. The volume of water in the balloon was never permitted to become large enough to stretch the balloon and create back pressure. The calculations used to compute the estimates of hydraulic conductivity were done using equations derived by Hvorslev (1951).
Approximately 40 ground-water samples were collected from the 17 monitoring wells and processed in the field according to standard procedures (Mark Have and Lan Tornes, U. S. Geological Survey, written commun., 1985) and then analyzed at the U.S. Geological Survey's National Water-Quality Laboratory (NWQL) to determine concentrations of nutrients, major constituents, selected minor constituents, and volatile organic compounds. Field analyses of the samples were
done to measure specific conductance, pH, temperature, dissolved oxygen, and alkalinity. Additionally, four ground-water samples were collected at minipiezometer sites 1,3,6, and 9 and analyzed for total phosphorus and dissolved ortho-phosphate by the water-quality laboratory operated by the SPWU. Two duplicate samples were sent to the U.S. Geological Survey NWQL where concentrations of total phosphorus and dissolved ortho-phosphate were measured and compared to the results reported by the SPWU laboratory to verify quality assurance.
HydrogeologyBedrock underlies unconsolidated-glacial drift and
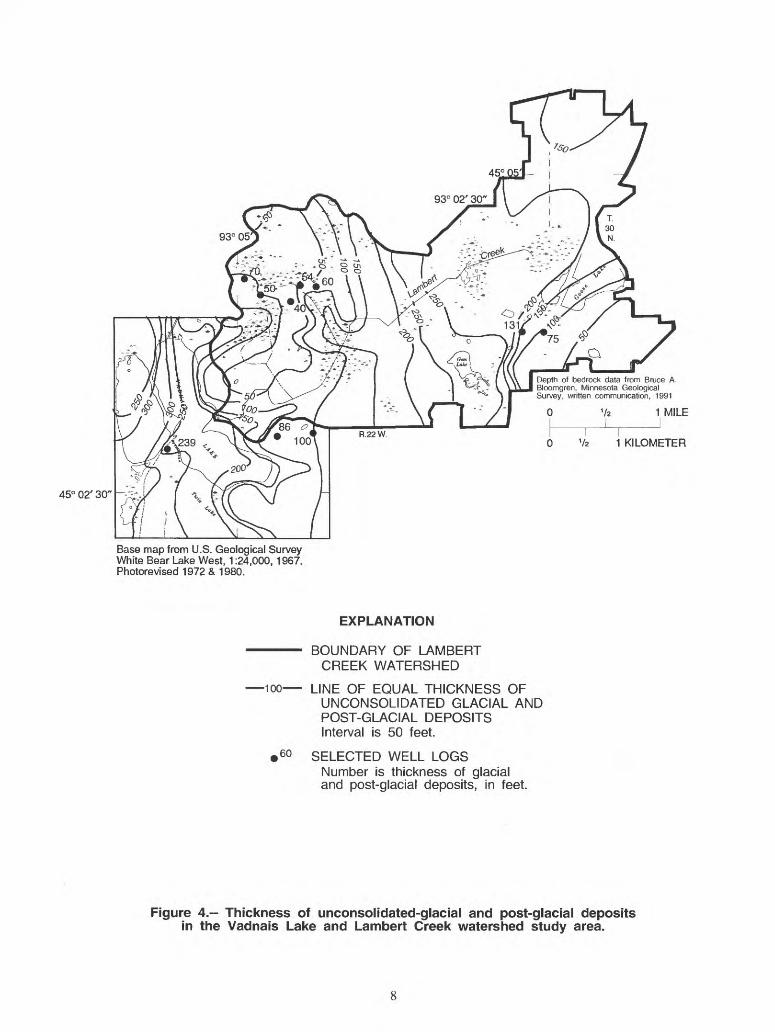
post-glacial organic and beach deposits that form the present land surface in the study area. The depth to the bedrock ranges from 40 feet in an area about one mile east of the northern half of Vadnais Lake to 300 feet in the southwestern part of the study area (fig. 4). The bedrock units, from oldest to youngest, are the Prairie du Chien Group, St. Peter Sandstone, and the Glenwood and Platteville Formations (fig. 5).
The Prairie du Chien Group consists of two dolomitic formations that are interbedded with layers of shale. The St. Peter Sandstone consists of fine- to medium-grained quartzose sandstone and a basal siltstone bed in the Twin Cities area. The Glenwood Formation is predominantly shale with some argillaceous sandstone, and the Platteville Formation is a dolomitic limestone that contains some shale layers.
The drift was deposited by the Des Moines lobe during the Wisconsin glaciation, which ended approximately 10,000 years ago. It mostly consists of till, which is an unstratified, unsorted mixture of clay, silt, sand, gravel, and boulders (fig. 6). Lacustrine deposits of mostly sand and silt with interbedded layers of silty clay are also part of the drift. (Most of the monitoring wells installed for this study were completed in these lacustrine deposits.) Ice-contact deposits, also of glacial origin, mostly are present along the shoreline of Vadnais Lake. These deposits mainly consist of sand and gravel mixed with till and silt.
Organic deposits in wetlands along Lambert Creek commonly are present in the eastern part of the study area (fig. 6). These deposits accumulated in poorly drained areas to form peat. The thickness of the peat ranges from about 10 to 25 feet (Supplemental Information Section, table 9). The age of the organic deposits, based on pollen analysis of a core sample from peat sediments in the bottom of the western part of Goose Lake, is 5,000 to 9,000 years (Linda C.K. Shane, Limnological Research Center, written commun., 1990). During the first half of
45° 02' 30"
Depth of bedrock data from Bruce A Bloomgren, Minnesota Geological Survey, written communication, 1991
1 MILE
1 KILOMETER
Base map from U.S. Geological Survey White Bear Lake West, 1:24,000,1967. Photorevised 1972 & 1980.
EXPLANATION
BOUNDARY OF LAMBERT CREEK WATERSHED
-100 LINE OF EQUAL THICKNESS OFUNCONSOLIDATED GLACIAL AND POST-GLACIAL DEPOSITS Interval is 50 feet.
60 SELECTED WELL LOGSNumber is thickness of glacial and post-glacial deposits, in feet.
Figure 4.- Thickness of unconsolidated-glacial and post-glacial deposits in the Vadnais Lake and Lambert Creek watershed study area.

45° 02' 30"
1 MILE
1 KILOMETER
Base map from U.S. Geological Survey White Bear Lake West, 1:24,000,1967. Photorevised 1972 & 1980.
EXPLANATION
GLENWOOD AND PLATTEVILLE FORMATIONS
ST. PETER SANDSTONE
PRAIRIE DU CHIEN GROUP
BOUNDARY OF LAMBERT CREEK WATERSHED
Figure 5.-Bedrock geology in the Vadnais Lake and Lambert Creekwatershed study area.

45° 02' 30"
Geology from Meyer, 1985
0 Va 1 MILE
V2 1 KILOMETER
Base map from U.S. Geological Survey White Bear Lake West, 1:24,000, 1967. Photorevised 1972 & 1980.
EXPLANATION
GLACIAL DEPOSIT
Lacustrine clay and silt
Lacustrine sand and silt
Outwash deposits
Ice-contact deposits
Glacial till
Sand-capped glacial till
Glacial till of mixed composition
POST-GLACIAL DEPOSITS
Organic deposits drained and filled
Organic deposits
Beach Deposits
BOUNDARY OF LAMBERT CREEK WATERSHED
Figure 6.-Surficial geology in the Vadnais Lake and Lambert Creekwatershed study area.
10

this century some of the wetland areas were drained and filled with artificial materials.
Hydraulic PropertiesThe surficial glacial-drift materials in the study area
that transmit ground water most readily are the outwash, ice-contact, and lacustrine deposits that mostly consist of sand and gravel. The till generally does not transmit much water and commonly acts as a confining unit. The hydraulic conductivities of the lacustrine sand and gravel deposits, estimated from slug tests on monitoring wells B, C, E, and G, ranged from 0.45 ft/day (feet per day) (monitoring well E) to 11 ft/day (monitoring well G). These estimates typify the lower range of hydraulic conductivities measured in silty sand (Freeze and Cherry, 1979, p. 29). Monitoring well E is located very near the contact of lacustrine sand and glacial till. The low hydraulic conductivity of monitoring well E was possibly due to the presence of till in the material immediately surrounding the well screen. The log for monitoring well E indicates the presence of clay from a depth of 6 feet to the bottom of the well (Supplemental Information Section, table 7).
Although no field data are available to estimate hydraulic conductivity of the glacial till, values in the literature provide a basis for estimation. The hydraulic conductivity of glacial till ranges from approximately 10'7 to 10'1 ft/day (Freeze and Cherry, 1979, p. 29). The hydraulic conductivity of till depends on the grain size variability; poorly sorted till has low hydraulic conductivity. Data from the logs of several test holes in the till indicate that these deposits are poorly sorted and are predominantly composed of clay and silt; hence the conductivity of these deposits is likely to be in the lower part of the range given above.
The permeability of organic deposits in peatlands is highly variable. The hydraulic conductivity of North American peatlands ranges from less than 3.4 x 10~2 to as much as 4.25 ft/day, depending on the degree of decomposition of the organic material (Verry and Boelter, 1979). Fibrous peat in the early stages of decomposition is similar in permeability to a low productivity aquifer, such as a silty-sand formation, which exhibits hydraulic conductivity within the range of 10"2 to 102 ft/day. Because decomposition of organic matter generally increases with depth, the hydraulic conductivity tends to decrease with depth. Cores from peat in wetlands of the study area indicated that the organic material in the upper 5 feet generally is slightly fibrous and that it is less fibrous and progressively more decomposed with depth. Ground-water flow through the wetlands, therefore, is likely to be predominantly in the upper few feet
The bedrock units that underlie the study area act as both aquifers and confining units on a regional scale. The Glenwood and Platteville Formations are confining units, although solution cavities and fractures in the limestone of the Platteville Formation yield small quantities of water to wells in some areas. The St. Peter Sandstone and Prairie du Chien Group are both aquifers; however, the Prairie du Chien Group is a more significant source of ground water.
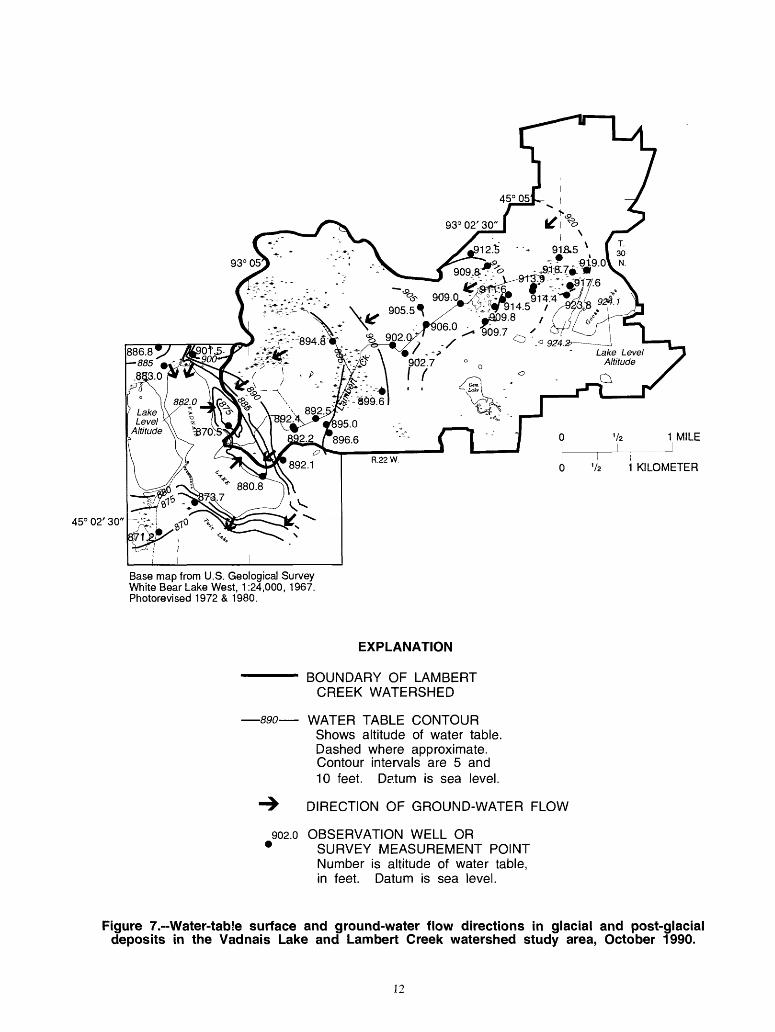
Ground-Water FlowWater-table elevation data collected in October 1990
show a decrease of approximately 53 feet between Goose Lake, in the eastern pan of the study area, and monitoring well H in the southwestern part. This decrease in water- table elevation represents a hydraulic gradient of approximately 12 ft/mi (feet per mile) across the study area. These water-table elevation data indicate that the direction of shallow ground-water movement through the surficial glacial and peat deposits in the study area was generally southwest toward Vadnais Lake (fig. 7). A depression in the water table along the northeastern side of Vadnais Lake, however, indicates a local reversal to this direction of flow. The cause of this depression was undetermined. Water-table levels were below the lake surface on the northeastern side of the lake where monitoring wells D and E are located. The water-level data from these wells show that seepage from the northeastern side of the lake was east to northeast towards the water-table depression.
Water-level data collected from nested wells at sites N and O indicate that the direction of vertical ground-water flow in the surficial drift at these sites was downward (Supplemental Information Section, fig. 26 and 27). Water-level data collected from these wells show a decline in hydraulic head of about 15 feet from screened depths of 9 feet to 32 feet, respectively, for monitoring wells N (shallow) and N (deep), and a decline of about 2 to 4 feet from screened depths of 6 feet to 48 feet, respectively, for monitoring wells O (shallow) and O (deep).
The water-table elevation data provide a basis to estimate local ground-water-flow directions and to gain some insight about the interaction between ground water in the glacial drift and water in adjacent wetlands. Water- table elevations in the monitoring wells were about several tenths of a foot to as much as one foot higher than point measurements of the water-table surface elevation in adjacent wetlands (fig. 7). These data indicate that ground water discharged into the wetlands from surrounding glacial deposits. The regional ground-water flow direction in the study area indicates that ground
11
45° 02' 30"
1 MILE
1 KILOMETER
Base map from U.S. Geological Survey White Bear Lake West, 1:24,000, 1967. Photorevised 1972 & 1980.
EXPLANATION
BOUNDARY OF LAMBERT CREEK WATERSHED
890 WATER TABLE CONTOURShows altitude of water table. Dashed where approximate. Contour intervals are 5 and 10 feet. Datum is sea level.
DIRECTION OF GROUND-WATER FLOW
902.0 OBSERVATION WELL ORSURVEY MEASUREMENT POINT Number is altitude of water table, in feet. Datum is sea level.
Figure 7.--Water-tab!e surface and ground-water flow directions in glacial and post-glacial deposits in the Vadnais Lake and Lambert Creek watershed study area, October 1990.
12

water moved from upgradient to downgradient wetlands through glacial drift that separates the wetlands.
Most of the surface and near-surface water in the wetlands probably drains into Lambert Creek, which is an excavated channel that drains surface runoff from the wetlands. Ground-water flow in the wetlands, therefore, probably constitutes a series of local, multi-directional flow systems that are likely to include reversals to the southwest flow direction. Some water in the wetlands possibly percolates into the ground-water and moves several miles from the wetlands through regional flow systems. Wetlands with large storage capacities typically reduce surface runoff because water that otherwise contributes to surface runoff is redirected into evapotranspiration or ground-water recharge.
Channelization of Lambert Creek has reduced the storage capacity of the wetlands drained by this creek (Brown, 1988); therefore, the capability of these wetlands to retain overland runoff following storm and snowmelt is reduced. Large storms, particularly if they occur when antecedent moisture conditions are high, are potentially significant sources of the discharge from these wetlands during a typical year. Walker (1990) reported that 51 percent of the total runoff from Lambert Creek watershed in 1989 was from snowmelt and rainfall that occurred during approximately a three-week period in early spring. Ground-water discharge to these wetlands is the source of baseflow in Lambert Creek during dry periods.
Wetlands that exhibit the hydrologic features of those in the study area are ground-water-slope wetlands (Novitzki, 1979). These wetlands form in depressions that intersect the surrounding water table. The distinguishing characteristics of these wetlands are continuous ground-water inflow and sufficient surface- water drainage that prevents or limits the build-up of open-water ponds. Wetlands of this type are common in the headwaters area of watersheds, which is the case for those wetlands in the upstream part of Lambert Creek watershed.
Quality of Ground Water in Glacial Deposits
The quality of the ground water in the study area potentially affects the quality of Vadnais Lake. This evaluation addresses the suitability of the ground water for drinking because the lake is used for storage of municipal water supply. This evaluation also focuses on the nutrient content of the ground water because of the impact of elevated phosphorus levels on the growth of algae in Vadnais Lake.
Physical and Chemical PropertiesSpecific conductance, commonly expressed in
microsiemens per centimeter (jiS/cm) at 25° C, measures the capacity of water to conduct an electrical current. This property depends on the concentrations of dissolved ions. Because nearly all major and minor dissolved constituents in ground water are in ionic form, specific conductance generally indicates the total dissolved solids content The specific conductance of ground water typically ranges from tens of fiS/cm in shallow ground water recharged by fresh rain water to several hundreds of thousands of (iS/cm in highly saline brines generally found in the deep zones of the ground-water system.
High specific conductances were measured in water from monitoring wells F, H, I, K, N (deep), N (shallow), and O (shallow) (table 2). Values exceeded the 95th percentile for specific conductance (835 p.S/cm) determined from a state-wide analysis of water-quality data for shallow glacial-drift aquifers (Ruhl, 1987). These high values indicate that the water contained large amounts of dissolved ions. The sums of the dissolved constituents in the water, expressed as the dissolved solids in table 3, generally correlated with the specific conductances reported in table 2. Water with the highest dissolved solids was collected from monitoring well K, where sodium and chloride ions were present at concentrations that were generally an order of magnitude greater than values measured in water from the other monitoring wells. Monitoring well K is within 50 feet of the intersection of two roads that probably have been treated with road salt during snow and ice conditions. These applications of road salt are a potential source of sodium and chloride.
The pH is a measure of the hydrogen-ion activity and defines the acidity of a solution. The pH of natural waters is a useful indicator of the equilibrium status of reactions in the water. Most ground water has a pH in the range of 6.0to8.5. Criteria established by the U. S. Environmental Protection Agency (USEPA) for drinkjif: water is 6.5 to 8.5 (USEPA, 1988a). The data in table 2 show that the pH measured in water from monitoring wells in the study area generally met these criteria, which represent secondary maximum contaminant levels tha I are intended to be used as guidelines rather than enforceable standards. (Secondary contaminants affect aesthetic properties, such as taste and odor of water rather than human health). The values of pH were at the lower limit in water from monitoring wells C and H and slightly above the upper limit in water from monitoring well J.
Alkalinity is the capacity of water to neutralize acid. This property is attributed mostly to the concentration of bicarbonate, and it is commonly reported as an equivalent
13

Table 2.--Field-measured water-quality properties and other data for ground-water samples collected from monitoring wells around Vadnais Lake and in Lambert Creek watershed study area
[mg/L, milligrams per liter; nS/cm, microsiemens per centimeter at 25 degrees Celsius; °C, degrees Celsius;-, not determined; <, less than]
Site (see figure 3)
WELL A
WELLB
WELLC
WELLD
WELLE
WELLF
WELLG
WELLH
WELL I
WELLJ
WELLK
WELLL
WELLM
WELLN(shaUow)
WELL N (deep)
WELL O (shallow)
WELL O (deep)
Station name
Q30N22W30BABA
030N22W30BADC
Q30N22W30ABAC
030N22W30DAD
030N22W32BAC
Q30N22W32BADA
Q30N22W31ACDB
Q30N22W31DCBB
Q30N22W29DBDD
030N22W29DDAC
Q30N22W28BAAA
030N22W22DBB
030N22W22DBB
030N22W22ABD
030N22W22ABD
Q30N22W23BBC
Q30N22W23BBC
Date sampled
08-31-8905-31-9002-06-91
08-24-8906-01-9002-12-91
06-01-9002-06-91
~
08-24-8906-06-9002-06-91
06-08-9002-12-91
08-31-8906-06-9001-18-91
08-31-8905-30-9002-12-91
08-24-8905-31-9001-18-91
08-24-8905-31-90
08-24-8905-30-9001-18-9101-18-91
09-10-9009-13-90
09-11-90
09-11-9001-18-91
09-11-90
09-13-90
09-10-9002-12-91
Depth below land surface (water level)
(feet)
9.08.18.5
7.85.97.0
4.94.6
-
9.08.89.2
33.433.5
9.49.49.3
15.317.217.3
7.26.96.8
9.59.1
11.09.8
10.79.1
20.6--
0.6
7.68.5
24.5
5.9
8.69.2
Specific conductance
(US/cm)
327371371
289183258
235325
-
463454490
9251,325
685773
~
1,4901,6601,520
7531,0261,045
355416
2,1002,260
325516
735762
316
1,2361,190
889
915
111781
pH (standard
units)
7.27.47.3
7.47.47.4
6.66.5
-
8.17.57.5
7.87.4
6.87.17.0
6.26.46.6
6.87.06.7
8.68.9
7.27.16.98.6
8.28.0
8.3
7.47.0
7.9
8.3
7.37.0
Water Oxygen, temperature dissolved
(°C) (mg/L)
11.67.8 1.67.8
14.29.9 7.25.0
12.2 2.95.1
16.39.3 .79.4
11.09.3
11.98.8 <.l8.2
11.910.2 1.39.6
16.510.7 <.l6.9
12.29.1 3.3
12.410.0 3.410.08.7
-~
-
..
7.3
~
~
-
8.9
Alkalinity (mg/L as CaCO3)
142109109
762777
77121
--
235214
394345
322362-
620-
642
410499-
147148
269252-~
--
~
~-
-
-
~
319
14

Table 3.--Major and minor constituents in ground-water samples collected from monitoring wells around Vadnais Lake and in Lambert Creek watershed study area
[mg/L, milligrams per liter; (ig/L, micrograms per liter; -, not determined; <, less than]
Site (see figure 3)
WELL A
WELLB
WELLC
WELLD
WELLE
WELLF
WELLG
WELLH
WELL I
WELLJ
WELLK
WELLL
WELLM
WELL N (shallow)
WELL N (deep)
WELL O (shallow)
WELL 0 (deep)
Date
08-31-89
05-31-90
02-06-91
08-24-89
06-01-90
02-12-91
06-01-90
02-06-91
-
06-06-90
02-06-91
06-08-90
02-12-91
08-31-89
06-06-90
08-31-89
05-30-90
02-12-91
08-24-89
05-31-90
08-24-89
05-31-90
08-24-89
05-30-90
09-10-90
09-13-90
02-12-91
09-11-90
09-11-90
09-11-90
09-13-90
09-10-90 02-12-91
Hardness (mg/L as CaC03)
130130
--
130
61~
68-
~
230~
500-
380
400
540-
~
400570
140160
190
240
370
360~
160
550
110
170
250
Calcium, dissolved
(mg/L as Ca)
4036~
37
17~
17~
~
60~
120~
87
92
140-
-
110
160
4146
60
74
100
100--
44
160
30
41
66
Magnesium, dissolved
(mg/L as Mg)
8.39.3~
8.2
4.4~
6.1-
~
19~
48-
40
42
47-
~
3141
8.710
10
14
29
28~
11
37
8.8
16
21
Sodium, dissolved (mg/L as
Na)
1624-
7.0
5.0~
10~
~
7.4-
51~
12
12
120~
~
2.52.4
5.5
5.5
370
390
15
15--
6.4
42
150
130
59
Potassium, dissolved
(mg/L as K)
1.3
1.2~
2.1
1.4~
2.5-
-
.90--
2.1~
1.4
1.2
1.1-
-
3.0
2.8
2223
2.3
1.8
1.2
1.2-
1.7
2.5
3.9
15
3.8
Bicarbonate, (mg/L as HC03)
173133
133
93
33
94
94148
~
287261
481
421
393
442
756-
783
500
609
173158
328
307
~
-
249
~
~
~
~
389
Carbonate, (mg/LasCO3)
00
0
0
0
0
00
-
00
0
0
0
0
0-0
00
3
11
0
0
«-0
~~"-
0
15

Table 3.--Major and minor constituents in ground-water samples collected from monitoring wells around VadnaisLake and in Lambert Creek watershed study area-Continued
Site (see fig. 3)
WELL A
WELLB
WELLC
WELLD
WELLE
WELLF
WELLG
WELLH
WELL I
WELLJ
WELLK
WELLL .
WELLM
WELLN(shaUow)
WELL N (deep)
WELL O (shallow)
WELL O (deep)
Date
08-31-89
05-31-90
02-06-91
08-24-89
06-01-90
02-12-91
06-01-90
02-06-91
-
06-06-90
02-06-91
06-08-90
02-12-91
08-31-89
06-06-90
08-31-89
05-30-90
02-12-91
08-24-89
05-31-90
08-24-89
05-31-90
08-24-89
05-30-90
09-10-90
09-13-90
02-12-91
09-11-90
09-11-90
09-11-90
09-13-90
09-10-90
02-12-91
Sulfate, dissolved (mg/Las
S04)
6.0
5.7~
65
38-
18~
-
1.3-
95-
52
48
17-
~
20
90
11
10
29
24
210
200~
1.7
71
<1.0
15
2.3~
Chloride, dissolved (mg/Las
d)
8.3
48-
6.8
6.5~
13~
-
13-
110~
17
18
160
150-
1.3
7.3
13
33
480
580
8.2
10-
6.4
110
67
71
65~
Silica, Fluoride, dissolved dissolved (mg/L as
(mg/L as F) SiOj)
0.1 20
<.l 16~
19
<.l 20-
<.l 8.9~
-
.4 26--
<.l 27-
.1 27
<.l 26
.2 64
~
.2 33
.1 29
.1 25
<.l 23
.2 14
<.l 14
.4 30
.2 28-
.4 27
.6 27
.2 25
.1 8.3
.5 35~
Solids dissolved sum
of constituents
(mg/L)
185
206-
191
109~
122-
-
269-
690~
430
457
921-
~
447
632
214
239
1,130
1,250
~
-
-
~
~
~
-
~
-
Iron, dissolved (u,g/Las
Fe)
9
22
130
13
54
-
39
11
270
280
8,300
2,400
1,100
5
<3
20
20
8
5
53
3,100
1,800
28
5,300-
Manganese, dissolved
(u,g/L as Mn)
390
170
1,400
150
290
~
91
880
1,100
670
7,600
2,000
2,700
14
3
140
30
34
33
760
1,100
110
360
320~
16

concentration of calcium carbonate. Ground water in glacial deposits that were transported into Minnesota by glaciers from the northwest and deposited across much of the western and central parts of the state tend to be slightly alkaline. These glacial materials contain abundant calcareous minerals that are sources of alkalinity. The median alkalinity determined from analyses of water from shallow glacial-drift wells throughout Minnesota is 200 mg/L (Ruhl, 1987).
Data from this study shows that alkalinity was higher than the state-wide median in water from 8 of 12 monitoring wells (table 2). The highest alkalinities, which were measured in water from monitoring well H, were slightly more than 3 times the state-wide median. The generally elevated alkalinities reflect the origin of the glacial drift in the study area, which is predominantly calcareous-rich material from the northwest.
Information about equilibrium conditions in natural water can be gained from measurement of the tendency of water to oxidize or to reduce dissolved ions, which is a property of the water that reflects its oxidation-reduction potential. Although the oxidation-reduction potential was not measured directly in this study, the dissolved oxygen concentration, which is an indirect measure of this property (Freeze and Cherry, 1979, p. 141), was measured. Oxidizing conditions appeared to be prevalent in the ground water. The dissolved oxygen concentration was as high as 7.2 mg/L in water collected from seven monitoring wells where measurable amounts were determined (table 2). Oxidation of many types of reduced constituents is possible in ground water with dissolved oxygen concentrations as low as 0.01 mg/L (Freeze and Cherry, 1979, p. 140).
The hardness of water, which affects its aesthetic value for household use, is defined as the capacity to consume soap. The ions that react with soap to form insoluble compounds are mostly calcium and magnesium. Because hardness depends on more than one constituent, this property is expressed as an equivalent concentration of calcium carbonate. A commonly used hardness classification scheme defines very hard water to be more than 180 mg/L, hard water to be in the range of 121 to 180 mg/L, moderately hard water to be in the range of 61 to 120 mg/L, and soft water to be less than 61 mg/L (Durfor and Becker, 1964, p. 27). The data in table 3 shows that the ground water generally was hard to very hard.
Major and Minor ConstituentsThe major constituents in natural water, except silica
(SiO^, are in ionic form. The dominant dissolved constituents in the shallow glacial-drift ground-water system in most of Minnesota are sodium (Na),
magnesium (Mg), calcium (Ca), chloride (Cl), sulfate (SO4), and bicarbonate (HCO3); minor constituents include carbonate (CO3), fluoride (F), potassium (K), iron (Fe), and manganese (Mn) (Ruhl, 1987; Winter, 1974). In the United States, the concentrations of the major constituents listed above generally exceed 5 mg/L, and the concentrations of minor constituents commonly are in the range of 0.01 to 10 mg/L (Davis and De Wiest, 1966).
The dominant ions in most of the ground water samples analyzed in this study were calcium, magnesium, and bicarbonate. Figure 8 shows the proportions of major ions in the ground-water samples. Each site identifier in the Piper diagram defines the proportion of major cations and anions in the ground-water sample as a percentage of the total milliequivalents of cations and anions. The percentage distribution determines the water type. Most of the monitoring well-site identifiers in the Piper diagram are in the left sector, which represents calcium bicarbonate type water. Water from monitoring well L in the upper sector was a calcium sulfate type water, and water from monitoring well B was a border-line-type between calcium sulfate and calcium bicarbonate. Water from well K in the right sector was a sodium chloride type water. Water from wells O (shallow) and N (deep) in the bottom sector were sodium potassium bicarbonate type water.
Water from monitoring wells (A, B, C, E, F, G and H), which surround Vadnais Lake, was calcium bicarbonate type water, except water from monitoring well B, which was borderline calcium bicarbonate type water. Types other than calcium bicarbonate were collected from monitoring wells L, K, O (shallow), and N (deep), which are located away from the lake in the upstream part of Lambert Creek watershed. These data indicate that the ground water that discharged into or received recharge from Vadnais Lake was calcium bicarbonate type water.
Sulfate and chloride are the only major constituents with established drinking water criteria, which is 250 mg/L (USEPA, 1988a). These criteria are secondary maximum contaminant levels. Both sulfate and chloride concentrations in the ground-water samples were below their respective criteria, except for the chloride concentrations of 480 and 580 mg/L measured in water from monitoring well K, where road salt is a possible source of sodium chloride (table 3).
S econdary contaminant levels of 300 and 50 (4g/L have been established for the minor constituents iron and manganese, respectively (USEPA, 1988a). The concentrations of these constituents in water from many of the monitoring wells (5 of 16 for iron and 14 of 16 for manganese) exceeded their respective secondary maximum contaminant levels (table 3). These
17

CALCIUM CHLORIDE_PERCENT _
(in milliequivalents per liter)
EXPLANATION
Diagram shows water types of individual samples identified by monitoring well letter designation shown in figure 3.
-S Indicates a shallow well
-D Indicates a deep well
Figure 8.--Percentage distribution of major ions in ground water from monitoring wells in the Vadnais Lake and Lambert Creek watershed study area.
18

concentrations of iron and manganese are common in shallow glacial-drift aquifers throughout Minnesota (Ruhl, 1987).
Volatile Organic CompoundsVolatile organic compounds were analyzed in water
from monitoring wells B, H, I, and K. The presence of these compounds in ground water, even at very low concentrations, indicates contamination. Maximum contaminant levels have been established for only a small fraction of all the organic compounds in the environment (USEPA, 1988b). Many of these compounds are synthetic. The primary maximum contaminant levels established for organic compounds are health-based, enforceable standards.
The concentrations of all the organic compounds analyzed in this study were below the detection limit of 3 Hg/L. About one-third of these organic compounds have established primary maximum contaminant levels (USEPA, 1988b). (The detection limit of 3 pg/L was below these respective maximum contaminant levels.) The analyzed compounds are listed as follows: methylchloride, methylene chloride, chloroform, carbon tetrachloride, methylbromide, bromoform, dichlorobromomethane, chlorodibromomethane, trichlorofluoromethane, dichlorodifluoromethane, chloroethane, 1,1-dichloroethane, 1,2-dichloroethane, 1,1,1-trichloroethane, 1,1,2-trichloroethane, 1,1,2,2- tetrachloroethane, 1,2-dibromoethane, vinyl chloride, 1,1 -dichloroethylene, trichloroethylene, tetrachloroethylene, 1,2-dichloropropane, trans-1,3- dichloropropene, cis-l,3-dichloropropene, benzene, ethyl benzene, toluene, styrene, chlorobenzene, 1,2- dichlorobenzene, 1,3-dichlorobenzene, and 1,4- dichlorobenzene.
NutrientsNitrogen and phosphorus are nutrients essential for
plant and animal growth. Enrichment of surface water with these nutrients tends to increase biological productivity that results in growth of algae. The availability of phosphorus nutrients generally is the limiting factor that determines biological productivity of surface water (Hem, 1985, p. 128).
Nitrogen is present in water as nitrite (NO^ and nitrate (NO3) anions, which are the oxidized forms, as ammonium (NIL;) cations, which is the reduced form, and as part of organic solutes in an intermediate oxidation- reduction state. The anionic species generally are highly mobile in the ground-water system and are fairly stable over a wide range of conditions. Ammonium cations, on the other hand, tend to adsorb onto minerals, and therefore
are not very mobile. Ammonium cations readily react in oxidizing environments to form nitrate. Large concentrations of organic nitrogen are likely to be the result of contamination from sewage or some other kind of organic waste. Where contamination is absent, the amount of dissolved organic nitrogen is likely to be less than the amount of dissolved inorganic nitrogen (Freeze and Cherry, 1979, p. 86).
Nitrate is the most significant nutrient that directly affects the suitability of water for drinking, and it has become the most common contaminant in ground water (Freeze and Cherry, 1979, p. 413). The presence of NO3 in excess of 10 mg/L as nitrogen exceeds the primary maximum contaminant level (USEPA, 1988b). Application of fertilizers and disposal of sewage sludge on or beneath the land surface are known sources of NO^ in ground water (Freeze and Cherry, 1979, p. 413).
The N(>3 levels in ground-water samples collected for this study were all below the primary contaminant level (table 4). The lowest NO$ concentrations, which were less than 0.10 mg/L as nitrogen, were in water from wells in the upstream part of Lambert Creek watershed (wells M, N (deep), N (shallow), and O (deep)). These concentrations were as much as an order of magnitude less than the values measured in water from wells in the downstream part of the watershed. Nitrite, which is a slightly more reduced form of nitrogen than NO3 nitrogen, was present at concentrations at least one order of magnitude below the concentrations for NO$ in water from all the wells. The small concentrations of NC>2 relative to NO3 indicate that the oxidation-reduction potential in the ground water was more strongly oxidizing than reducing.
The concentrations of NHj, which is the reduced form of nitrogen, were nearly two to as much as 300 times higher in water from wells (except L) in the upstream part of the watershed (wells M, N (deep), N (shallow), O (shallow), and O (deep)) than in water from wells (except H and I) in the downstream part (wells A, B, C, D, E, F, G, J, and K). The NIL, concentrations in water from the upstream wells exceeded both the NO3 and NC>2 concentrations. The NH4 concentrations in water from the downstream wells generally were similar to the NO2 concentrations and considerably lower than the NCXj concentrations. These data indicate that ground water in the upstream part of Lambert Creek watershed had stronger reducing conditions than ground water in the downstream part
Phosphorus is similar to nitrogen in its wide range of oxidation states. Orthophosphate (PO4), which is the fully oxidized inorganic state, is the final dissociation product of phosphoric acid (H3PO4). Four solute species
19
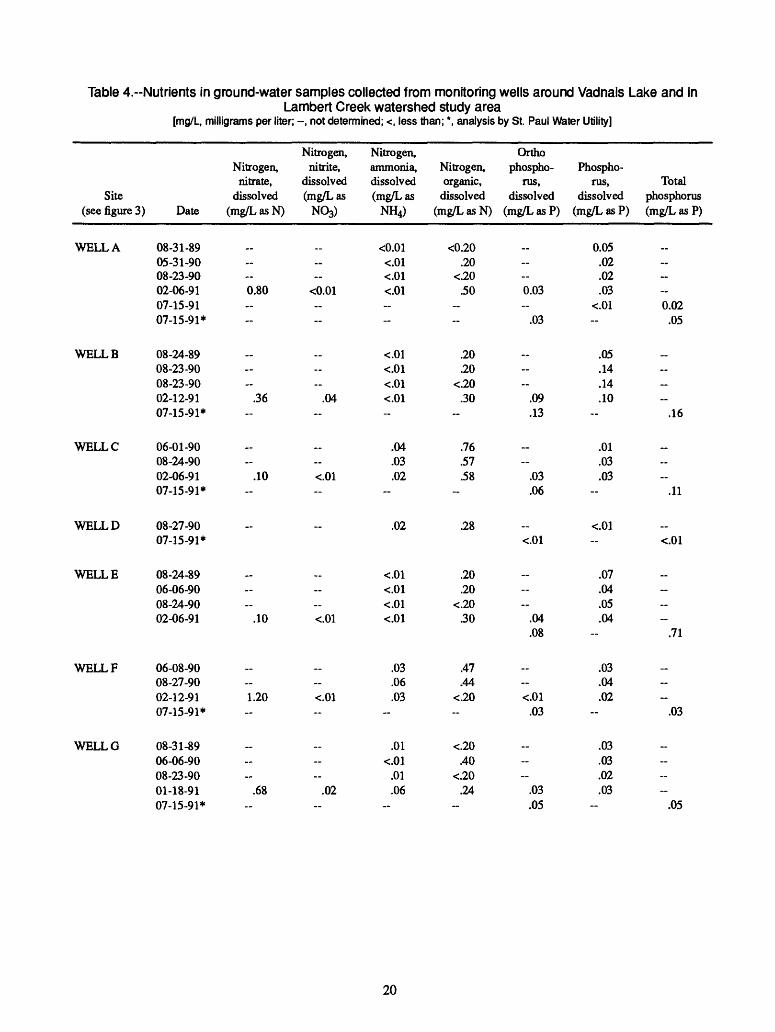
Table 4.--Nutrients in ground-water samples collected from monitoring wells around Vadnais Lake and inLambert Creek watershed study area
[mg/L, milligrams per liter; -, not determined; <, less than; *, analysis by St. Paul Water Utility]
Site (see figure 3)
WELL A
WELLB
WELLC
WELLD
WELLE
WELLF
WELLG
Nitrogen, Nitrogen, nitrite,
nitrate, dissolved dissolved (mg/L as
Date (mg/L as N) NC^)
08-31-8905-31-9008-23-9002-06-91 0.80 <0.0107-15-9107-15-91*
08-24-8908-23-9008-23-9002-12-91 .36 .0407-15-91*
06-01-9008-24-9002-06-91 .10 <.0107-15-91*
08-27-9007-15-91*
08-24-8906-06-9008-24-9002-06-91 .10 <.01
06-08-9008-27-9002-12-91 1.20 <.0107-15-91*
08-31-8906-06-9008-23-9001-18-91 .68 .0207-15-91*
Nitrogen, ammonia, dissolved (mg/L as
NH4)
<0.01<.01<.01<.01
<.01<.01<.01<.01-
.04
.03
.02
.02
<.01<.01<.01<.01
.03
.06
.03-
.01<.01
.01
.06
Nitrogen, organic,
dissolved (mg/L as N)
<0.20.20
<.20.50
-
.20
.20<.20
.30-
.76
.57
.58-
.28
.20
.20<.20
.30
.47
.44<.20~
<.20.40
<.20.24
Ortho phospho
rus, dissolved
(mg/L as P)
0.03
.03
.09
.13
__
.03
.06
<.01
_
.04
.08
.. <.01
.03
_ -
.03
.05
Phospho rus,
dissolved (mg/L as P)
0.05.02.02.03
<.01~
.05
.14
.14
.10-
.01
.03
.03
<.01--
.07
.04
.05
.04
.03
.04
.02
.03
.03
.02
.03
Total phosphorus (mg/L as P)
0.02
.05
.16
.11
_<.01
_
.71
.03
_ --
.05
20
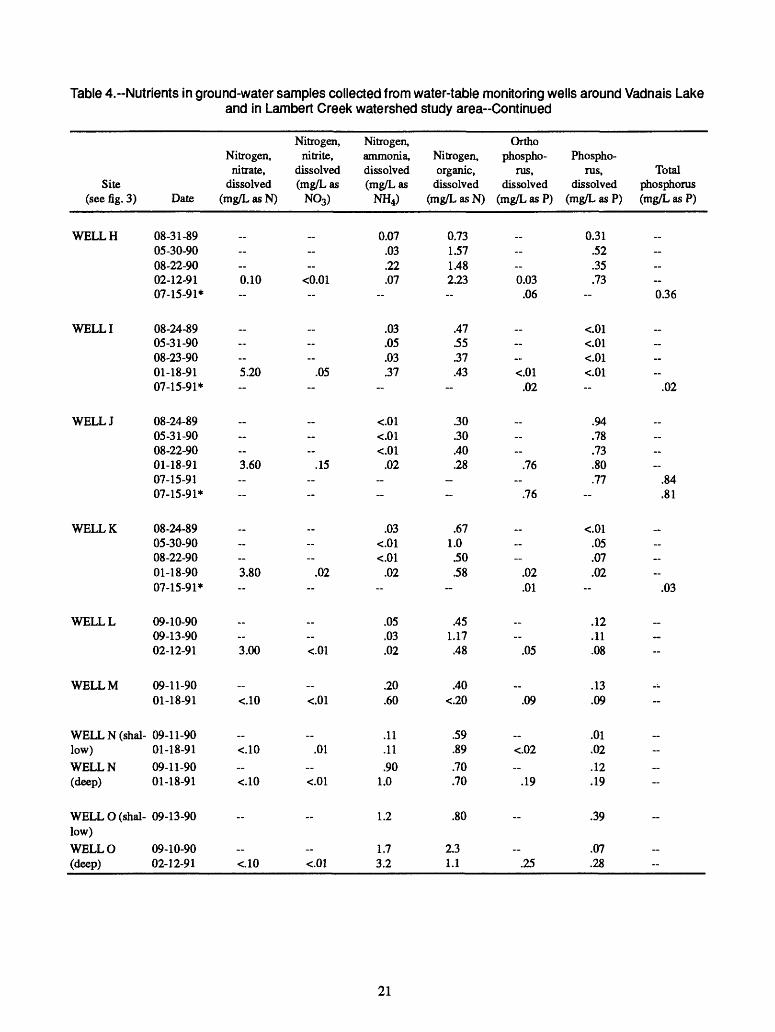
Table 4.--Nutrients in ground-water samples collected from water-table monitoring wells around Vadnais Lakeand in Lambert Creek watershed study area-Continued
Site (see fig. 3)
WELLH
WELL I
WELLJ
WELLK
WELLL
WELLM
WELL N (shallow)WELLN(deep)
WELL 0 (shallow)WELLO(deep)
Nitrogen, Nitrogen, nitrite,
nitrate, dissolved dissolved (mg/L as
Date (mg/L as N) NO3)
08-31-8905-30-9008-22-9002-12-91 0.10 <0.0107-15-91*
08-24-8905-31-9008-23-9001-18-91 5.20 .0507-15-91*
08-24-8905-31-9008-22-9001-18-91 3.60 .1507-15-9107-15-91*
08-24-8905-30-9008-22-9001-18-90 3.80 .0207-15-91*
09-10-9009-13-9002-12-91 3.00 <.01
09-11-9001-18-91 <.10 <.01
09-11-9001-18-91 <.10 .0109-11-9001-18-91 <.10 <.01
09-13-90
09-10-9002-12-91 <.10 <.01
Nitrogen, ammonia, dissolved (mg/L as
NH4)
0.07.03.22.07
~
.03
.05
.03
.37-
<.01<.01<.01
.02 ~
.03<.01<.01
.02-
.05
.03
.02
.20
.60
.11
.11
.901.0
1.2
1.73.2
Nitrogen, organic,
dissolved (mg/L as N)
0.731.571.482.23-
.47
.55
.37
.43-
.30
.30
.40
.28 -
.671.0.50.58
-
.451.17
.48
.40<.20
.59
.89
.70
.70
.80
2.31.1
Ortho phospho
rus, dissolved
(mg/L as P)
0.03
.06
<.01
.02
.76
.76
..
.02
.01
.05
...09
_<.02
.19
_.
.25
Phospho rus,
dissolved (mg/L as P)
0.31.52.35.73
<.01<.01<.01<.01~
.94
.78
.73
.80
.77~
<.01.05.07.02
-
.12
.11
.08
.13
.09
.01
.02
.12
.19
.39
.07
.28
Total phosphorus (mg/L as P)
0.36
.02
.84
.81
.03
-
-
_~ ~
._
~
21

of H3PC>4 are possible depending on the pH; HsPO^ H2PC>4, HPO4, and PO4. These inorganic states of phosphorus generally have low solubility in natural water. Orthophosphate is significant because of its reactivity both geochemically in ground-water systems and biologically in surface water. Natural sources of inorganic phosphorus in ground water are apatite minerals, which predominantly consist of calcium phosphate.
Organic phosphate species are synthesized by plants and animals. A significant anthropogenic source of organic phosphorus is domestic and industrial sewage effluent. Additionally, synthetic organic compounds, such as insecticides that contain reduced forms of organic phosphorus, are released into the environment The amount of organic phosphorus in ground water generally is small unless it is introduced by recharge from wetlands or by leachates from waste materials and agricultural chemicals.
The phosphorus fractions in table 4 are dissolved orthophosphorus, which represents the inorganic phosphorus in a filtered sample; dissolved phosphorus, which represents both the inorganic and organic phosphorus in a filtered sample; and the total phosphorus, which is all the phosphorus in an unfiItered sample. The total phosphorus includes both inorganic and organic phosphorus, and both dissolved and paniculate fractions.
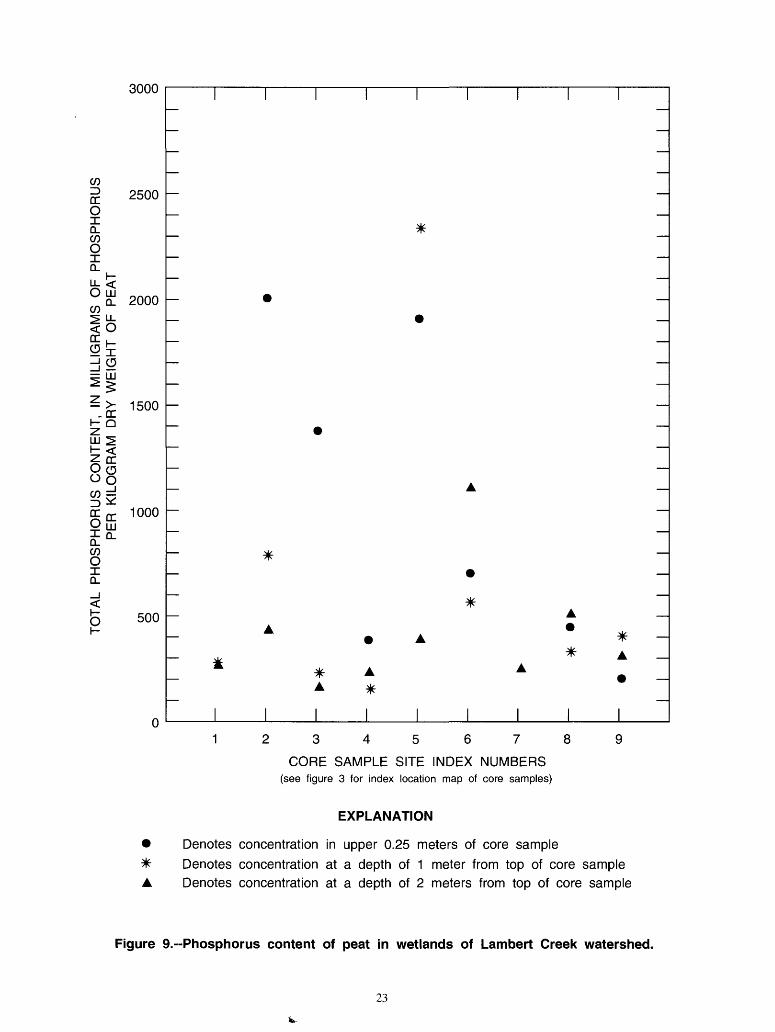
Concentrations of dissolved phosphorus in ground- water samples from the study area generally were below 0.15 mg/L, which is similar to the levels observed elsewhere in shallow glacial aquifers (Myette, 1984; Miller, 1981). The concentrations of dissolved phosphorus in water from wells H, O (shallow), and particularly J, however, were notably higher than 0.15 mg/L (table 4). The dissolved phosphorus in five ground- water samples from well J that were collected between late summer of 1989 and mid-summer of 1991 ranged from 0.73 to 0.94 mg/L. Phosphorus-rich water in wetlands along Lambert Creek that moves short distances of several hundred yards or less along local ground-water flow paths toward monitoring well J is a potential source of the elevated levels. Total phosphorus concentrations in water from Lambert Creek at locations near monitoring well J ranged from 0.10 to 1.27 mg/L (Walker, 1990). Oxidation of organic compounds in the peat that results in the release of phosphorus is possibly a significant source of the phosphorus in water from Lambert Creek. The amount of total phosphorus per unit dry weight of organic matter in wetlands along Lambert Creek ranged from about 150 to 2,350 mg/kg (fig. 9).
Interaction of Vadnais Lake with Ground Water
The hydrologic regime of a lake generally depends on the interaction with the surrounding ground-water system. The nature of this interaction can be used to classify lakes on a continuum between two end points. Surface-water dominated lakes have inflowing and outflowing streams that are considerably more significant in the lake water budgets than either the ground-water inflow or outflow. In ground-water-dominated lakes the ground-water inflow and outflow are significant components of the lake water budgets. Seepage lakes are ground-water dominated lakes where ground water flows in one side and lake water flows out into the ground-water system on the other side. Ground water flows into seepage lakes along both local flow paths that follow near-surface routes from points near the lake and along intermediate and regional flow paths that follow deeper routes in the ground-water system from points possibly many miles from the lake.
This evaluation discusses the hydrologic regime of Vadnais Lake. More specifically, rates of water flow through the near-shore zone of the lakebed are estimated, and potential effects of the lake/ground-water interaction on the quality of the lake are addressed. Two approaches used to quantify flow rates are discussed. The first relies on interpretation of hydrogeologic data collected from monitoring wells around the lake to define hydraulic conductivities and gradients in the surrounding glacial deposits. The second uses estimates of the hydraulic conductivities and gradients measured in the lakebed. Field data needed to describe potential lake/ground-water interaction in the deeper, central part of the lake are unavailable.
Estimation of Seepage BetweenVadnais Lake and Ground Water in
Adjacent Glacial DepositsThe seepage flow between the lake and ground water
was calculated by the following equation that is derived from the Darcy flux equation (Freeze and Cherry, 1979, p. 16):
q = KIA, where
q=seepage flow (f^/day) between the lake and ground water;
K = horizontal hydraulic conductivity (ft/day) of the glacial sand and gravel deposits that surround Vadnais Lake;
I = hydraulic gradient (a dimensionless factor); and
22
3000
C/Dz>DCOQ_ 03 O
Q_
C/3 O
Q_
2500
2000C/3
|o
3s^ m
^_> 1500
LU ^
§§ §2^ orO m
1000
500
A _
123456789
CORE SAMPLE SITE INDEX NUMBERS(see figure 3 for index location map of core samples)
EXPLANATION
Denotes concentration in upper 0.25 meters of core sampleDenotes concentration at a depth of 1 meter from top of core sampleDenotes concentration at a depth of 2 meters from top of core sample
Figure 9.--Phosphorus content of peat in wetlands of Lambert Creek watershed.
23

A = the cross-sectional area (ft2) normal to the flow direction.
Hereafter in this report the seepage q is either ground- water discharge into the lake and is a positive quantity referred to as seepage into the lake, or it is ground-water recharge from the lake and is a negative quantity referred to as seepage out of the lake.
The seepage into and out of Vadnais Lake was assumed to be restricted to the near shore because of the assumed increase in low-permeability lakebed sediments toward the center of the lake. McBride and Pfannkuch (1975) used theoretical simulations to show that in cases where the width of a lake exceeds the thickness of adjacent high- permeability deposits, conditions that apply to Vadnais Lake, seepage into or out of the lake tends to be concentrated near the shore, and that seepage decreases exponentially with distance from shore. Lee (1977) provided additional evidence for predominant near-shore seepage in a field study of seepage into Lake Mendota in Madison, Wisconsin.
In this study, seepage into and out of Vadnais Lake was assumed to be limited to an area along the shoreline that extended into the lake to where water depth was 10 feet The lakebed zone, where seepage was assumed to occur, is an area along the shoreline that generally extends 200 to 400 feet into the lake (fig. 10). These distances are about 10 to 20 percent of the width of the lake. The thickness of the saturated sand and gravel at the water table ranges from about 5 to as much as 10 feet around the shoreline of the lake (Supplemental Information Section, table 7).
Monthly seepage was calculated and summed to determine net annual seepage between the lake and ground water for each of six sections of lake shore, shown in figure 10, from July 1,1990 through June 30,1991. These calculations assumed horizontal ground-water flow through a vertical plane along each shoreline section that extended from the water surface of the lake to a depth of 10 feet The estimated flow rates for each section were then summed to determine net annual seepage for the entire lake. Lake-shore sections 1 through 5 were delineated on the basis of the locations of the monitoring wells used to estimate hydraulic gradients between the lake and ground water. Section 6 extends along a narrow area of shoreline that separates Vadnais Lake from an adjacent shallow lake that was used to calculate the hydraulic gradient between the two lakes.
Estimates of the hydraulic conductivity and hydraulic gradient of glacial sand and gravel around Vadnais Lake were used to calculate fluxes into and out of the lake. The hydraulic conductivities for shoreline sections 1,2,4, and 5 were obtained from slug tests performed on monitoring
wells B, C, E, and G, respectively. The hydraulic conductivities for shoreline sections 3 and 6 were assumed to be the means of the hydraulic conductivities determined for adjacent shoreline sections. The hydraulic gradients were calculated by dividing the difference in water-level elevations of the lake and of these monitoring wells (plus monitoring well D) by the lateral distance between them. The hydrograph in figure 11 shows the differences in water-level elevations between the lake and these monitoring wells. Estimates of the annual fluxes for the shoreline sections and net totals for the entire lake are given in table 5. These results show that ground water seeps into Vadnais Lake along shoreline sections 1 and 2, and that lake water seeps out into the ground water along sections 3,4,5, and 6. The annual net effect of this estimated lake/ground-water interaction was a lake-water outflow of 7.63 x 10⁶ f^/yr into the ground water. The amount of error in these estimates, however, is potentially significant for several reasons.
First, this method assumes that the lithology and the hydraulic properties of the near-shore lakebed and of the surficial glacial deposits surrounding the lake are the same. The hydraulic conductivities measured in these deposits by the slug tests were used to calculate flow in both the glacial deposits and the lakebed. This assumption will introduce some error to the results because cores from the lakebed show that silt, clay, and some organic material is present within the upper four feet (Supplemental Information Section, table 8). The permeability of the lakebed, therefore, probably is less than that of the glacial deposits where silt and clay appear to be less prevalent (Supplemental Information Section, table 7).
The second reason for potential error is that the hydraulic conductivity values are based on measurements at only four wells. These wells are completed in silty sand that is typical of the glacial deposits around Vadnais Lake. These types of deposits have hydraulic conductivities that range from approximately 10"2 to 102 ft/d (Freeze and Cherry, 1979, p. 29). The hydraulic conductivities determined from the slug tests represent point measurements of the permeability of very small zones of glacial deposits that are within an approximate radius of two feet of the well screen. The four measurements of the horizont?! hydraulic conductivity could be insufficient to describe the variability of this property.
Estimation of Seepage BetweenVadnais Lake
and Ground Water in the LakebedThe seepage between Vadnais Lake and underlying
ground water in the lakebed was estimated by the Darcy
24

93° 5' 93° 4'30'
45° 3'30'
45° 3'
Hydraulic Gradient Transect Site
45° 2'30" L
SCALE
0 300 600 900 1200 FEET
100 200 300 METERS
EXPLANATION
LAKEBED SECTION ASSUMED TO HAVE UNIFORM HYDRAULIC GRADIENT BETWEEN THE LAKE AND GROUND WATER Number is lake-bed section number and shoreline segment number
40- LINE OF EQUAL LAKE DEPTH Interval is 10 feet
MONITORING WELL Letter indicates well designation
LAKEBED MINIPIEZOMETER SAMPLE LOCATION AND SITE NUMBER
Figure 10.--Numbered shoreline and lakebed sections of Vadnais Lake used in calculation of lake/ground-water seepage.
25

_ 22. 3
(0 0)
i
ff* _ £
(D
2.
(0 i
i-h 5
70)
C«s
a(D
C
«
0> Ia?
W
Q.
_.
» i
-§ Q.
3
C
CO
(O £
c_ w
c
^^«<
" JJ
D
-"*
O m
O
3C
Q
.
(D
F*
0
C
-i
O(D
C
CO 3
r* Q
.
ALT
ITU
DE
A
BO
VE
S
EA
LE
VE
L,
IN
FE
ET
3 I
^ ff
CD
-<CO
_
CD
CDD
<
CO
9.
S- <
P_ m
c o
xQ
. ?
-0CD
_
I-
O
3 fj
»s CO
CD
O
pCD CD
O
p
ju CO :y CD
Q.
I o
oo -sj o
00
-sj
Ui
00
00 o
00
00
CJl
00
CD o00
CD
U
i
CD
O
O
CD
O
U
l
CD
C
D
OO
CD
C
D
\\
\i
i i
i i
\\
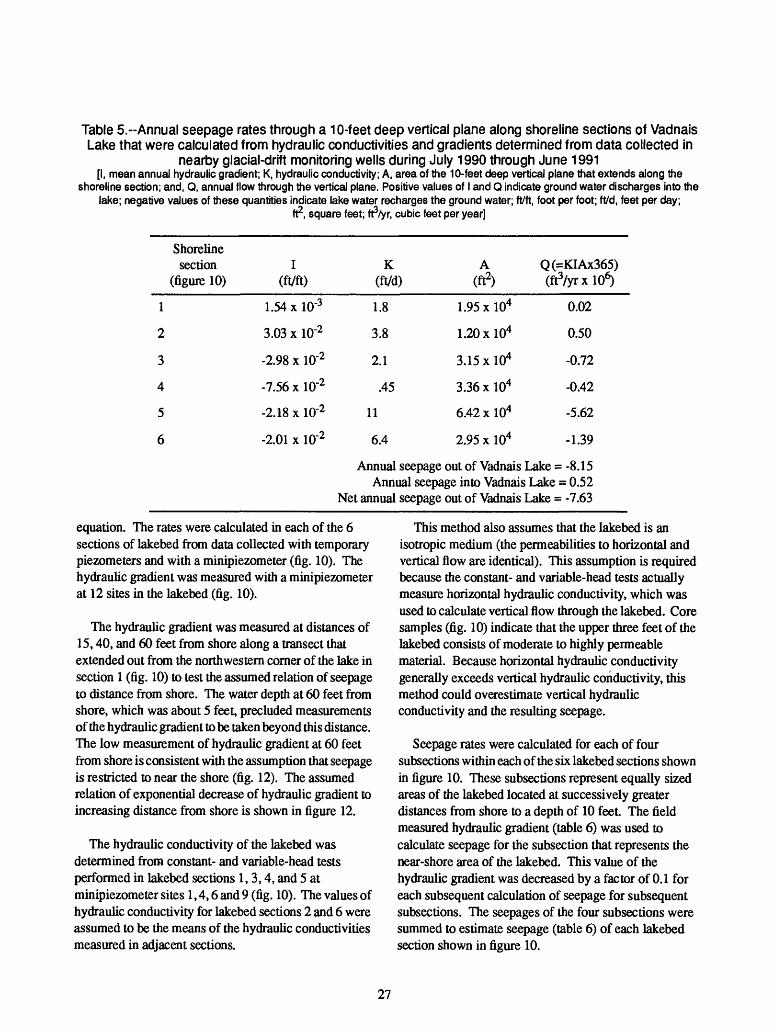
Table 5.--Annual seepage rates through a 10-feet deep vertical plane along shoreline sections of Vadnais Lake that were calculated from hydraulic conductivities and gradients determined from data collected in
nearby glacial-drift monitoring wells during July 1990 through June 1991[I, mean annual hydraulic gradient; K, hydraulic conductivity; A, area of the 10-feet deep vertical plane that extends along the
shoreline section; and, Q, annual flow through the vertical plane. Positive values of I and Q indicate ground water discharges into thelake; negative values of these quantities indicate lake water recharges the ground water; ft/ft, foot per foot; ft/d, feet per day;
ft2, square feet; tf/yr, cubic feet per year]
Shoreline section
(figure 10)
1
2
3
4
5
6
I (ft/ft)
1.54 x 10'3
3.03 x 10'2
-2.98 x 10'2
-7.56 x 10'2
-2.18xlO-2
-2.01 x ID'2
K (ft/d)
1.8
3.8
2.1
.45
11
6.4
A(ft2)
1.95 xlO4
1.20 xlO4
3.15 xlO4
3.36 xlO4
6.42 xlO4
2.95 x 10⁴
Q(=KIAx365) (ftVxlO6)
0.02
0.50
-0.72
-0.42
-5.62
-1.39
Annual seepage out of Vadnais Lake = -8.15Annual seepage into Vadnais Lake = 0.52
Net annual seepage out of Vadnais Lake = -7.63
equation. The rates were calculated in each of the 6 sections of lakebed from data collected with temporary piezometers and with a minipiezometer (fig. 10). The hydraulic gradient was measured with a minipiezometer at 12 sites in the lakebed (fig. 10).
The hydraulic gradient was measured at distances of 15,40, and 60 feet from shore along a transect that extended out from the northwestern corner of the lake in section 1 (fig. 10) to test the assumed relation of seepage to distance from shore. The water depth at 60 feet from shore, which was about 5 feet, precluded measurements of the hydraulic gradient to be taken beyond this distance. The low measurement of hydraulic gradient at 60 feet from shore is consistent with the assumption that seepage is restricted to near the shore (fig. 12). The assumed relation of exponential decrease of hydraulic gradient to increasing distance from shore is shown in figure 12.
The hydraulic conductivity of the lakebed was determined from constant- and variable-head tests performed in lakebed sections 1,3,4, and 5 at minipiezometer sites 1,4,6 and 9 (fig. 10). The values of hydraulic conductivity for lakebed sections 2 and 6 were assumed to be the means of the hydraulic conductivities measured in adjacent sections.
This method also assumes that the lakebed is an isotropic medium (the permeabilities to horizontal and vertical flow are identical). This assumption is required because the constant- and variable-head tests actually measure horizontal hydraulic conductivity, which was used to calculate vertical flow through the lakebed. Core samples (fig. 10) indicate that the upper three feet of the lakebed consists of moderate to highly permeable material. Because horizontal hydraulic conductivity generally exceeds vertical hydraulic conductivity, this method could overestimate vertical hydraulic conductivity and the resulting seepage.
Seepage rates were calculated for each of four subsections within each of the six lakebed sections shown in figure 10. These subsections represent equally sized areas of the lakebed located at successively greater distances from shore to a depth of 10 feet The field measured hydraulic gradient (table 6) was used to calculate seepage for the subsection that represents the near-shore area of the lakebed. This value of the hydraulic gradient was decreased by a factor of 0.1 for each subsequent calculation of seepage for subsequent subsections. The seepages of the four subsections were summed to estimate seepage (table 6) of each lakebed section shown in figure 10.
27

0.01
0.009
0.008
0.007
0.006
0.005
CO COLU_iO 0.004tozLU1 Q
z 0.003LUQ <cc oo _i ID <g 0.002
0.001\
10 20 80 9030 40 50 60 70
DISTANCE FROM SHORE, IN FEET
EXPLANATION
Dashed line indicates assumed relation between hydraulic gradient and distance from shore for lakebed section 1 shown in figure 10.
^ Hydraulic gradient measurement made inlakebed section 1 (see figure 10). Positive number indicates highest head is in lakebed.
Figure 12.--Hydraulic gradient from lakebed to the lake measured at three distances from shore and the assumed relation between hydraulic gradient and distance from shore.
28

Table 6.--Annual seepage rates through lakebed sections in Vadnais Lake that were calculated from hydraulic conductivities and gradients measured in the lakebed during July 1991
[I, the effective hydraulic gradient3 for each entire lakebed section; K, hydraulic conductivity; A, the plan-view area of the lakebed section; and, Q, annual flow through the lakebed section. Positive values of I and Q indicate ground water discharges into the lake; negative values of these quantities indicate that the lake recharges the ground water; ft/ft, foot per foot; ft/d, feet per day; ft2 , square
feet; ft^/yr, cubic feet per year]
Lakebed section
(figure 10)
1
2
3
4
5
6
I (ft/ft)
2.51 x 10'3
-2.97 x 10'3
-4.80 x 10'3
-1.40 x 10'2
-3.75 x 10'2
-3.91 x 10'2
K (ft/d)
11.8
6.6
1.4
2.0
2.0
6.9
A (ft2)
5.01 x 10⁵
4.55 x 10⁵
9.54 x 10⁵
8.05 x 10⁵
1.04 x 10⁶
5.91 x 10⁵
Q(=KIAx365) (ftVxlO6)
5.42
-3.26
-2.34
-8.23
-28.5
-58.2
Annual seepage out of Vadnais Lake = -101Annual seepage into Vadnais Lake = 5.42Net seepage out of Vadnais Lake = -95.6
a The effective hydraulic gradient represents a single value for the section that yields a seepage rate equal to that obtained by summation of seepage rates described below.
The data in table 6 indicate seepage out of the lake in five of the six lakebed sections. These sections extend along all but the northwestern side of the lake. The estimated net annual seepage out of the lake was 9.56 x 107 ft3 . The highest rates of seepage out of the lake were estimated to be along the southern and western sides of the lake (lakebed sections 5 and 6). The downward hydraulic gradients and resultant ground-water recharge estimated for most of the shoreline, particularly on the southwestern side of the lake, could be affected by pumpage from high capacity wells on that side (fig. 2).
These wells, which are owned and operated by the SPWU, are completed in the Prairie du Chien-Jordan aquifer, the uppermost bedrock unit. In 1991 the wells were pumped continuously throughout the summer at rates that ranged from approximately 2,000 to 4,000 gal/rnin (Tom Johnson, St. Paul Water Utility, oral commun., 1991). The water levels measured in these wells during July of 1991 were approximately 100 feet lower than the surface of Vadnais Lake. Geologic data from the drillers' logs of these wells show that the upper surface of the Prairie du Chien-Jordan aquifer is approximately 225 feet below the surface of Vadnais Lake. The downward hydraulic gradient between the lake and ground water in this aquifer was about 4.5 x 10" 1 .
The potential sources of error in these estimated fluxes are similar to those described for the first approach. One measurement of the hydraulic gradient was used in each section to calculate annual seepage. Extrapolation over a one-year period with a single value for this time- dependent variable is certain to introduce some error to the results because these gradients were unlikely to remain constant Additionally, the potential spatial variability of the hydraulic gradient introduces another source of error to the results because the seepage estimates for each lakebed section were extrapolated from a single point measurement of this property.
Evaluation of the Two Methods toEstimate Seepage Between Vadnais
Lake and the Ground Water
Net seepage out of the lake estimated by the first method (based on hydrogeologic data from monitoring wells around the lake) was about 8 percent of that estimated by the second method (based on hydrogeologic data collected in the lakebed). Both methods indicated seepage out of the lake along most of the shoreline except in the northern part of the north-south arm of the lake. The seepage into the lake determined by the second method
29
was about ten times higher than the results obtained by the first method.
Estimated net seepages out of the lake derived as the residual of other independently measured components of the lake water budget (table 1) agreed more closely with results of the second method than with those of the first The surface-water components of the lake's water budget, which include changes in lake storage and withdrawals by the SPWU from April through September 1988 and 1989 have been published by Walker (1990). Net retentions of 1.89 x 10⁷ and 3.76 x 107 ft3 were determined for each of two six-month periods in 1988 and 1989, respectively, from measurements of surface-water inflow, precipitation, evaporation (assumed to include transpiration), and reported withdrawals by the SPWU (table 1). Increases in lake storage, which is the volume of water equal to the change in lake stage times the area of the lake, were 4.94 x 10⁶ and 1.45 x 106 ft3 of water, respectively, for these six-month periods of 1988 and 1989 (Walker, 1990, p. 11).
A lake water-balance equation that accounts for the lake water budget components and the changes in storage determined from lake stage readings is:
(surface inflow - surface outflow) + net seepage = change in storage.
The difference between the surface inflow and outflow components is the net retention given in table 1. The solution of this equation for the six-month periods from April to September 1988 and 1989 are as follows:
1988: (1.89 x 107 ft3) + (net seepage) = (4.94 x 106ft3),net seepage = -1.40 x 107 ft3 ;
1989 (3.76 x 107 ft3) + (net seepage) = (1.45 x 106ft3),net seepage = -3.62 x 107 ft3 .
The net seepages determined by the lake water-balance equation represent seepage out of the lake because the values are negative. Comparison of these water balance values to estimates of the semi-annual net seepages (one half the annual net values given in tables 5 and 6) determined by the two methods used in this study show that the result of the first method (3.82 x 106 ft3) was about 27 percent of the 1988 value and about 11 percent of the 1989 value. The result from the second method (4.78 x 107 ft3) was about 3.4 times higher than the 1988 value and about 1.3 times higher than the 1989 value.
The net lake/ground-water interaction appeared to be a small component of the overall water budget of Vadnais Lake. This is particularly true based on results from the first method, which indicate that the semi-annual net
seepage out of the lake (3.82 x 106 ft3) is less than one percent of the total semi-annual outflows due to evaporation and withdrawals (table 1). Results from the second method indicate that the semi-annual net seepage out of the lake (4.78 x 107 ft3) ranged from 3.3 to 3.8 percent of the total semi-annual outflows in table 1.
Pumpage from SPWU wells along the southwestern shore could influence the seepage out of Vadnais Lake. Cones of depression in the potentiometric surface around these wells, which are screened in the Prairie du Chien- Jordan aquifer, could induce increased downward vertical flow from the overlying drift. This condition could increase leakage from the lake to the drift Pumpage data for these wells compiled for 1990 indicate that the total pumpage during October through March was approximately three times greater than the pumpage during April through September (SPWU, 1990). Pumpage from these wells generally is greater during the winter months than during the summer months (Dave Schuler, St. Paul Water Utility, oral commun., 1991). This pumpage schedule could contribute to greater seepage out of the lake and an increased role of ground- water interaction in the overall water budget of the lake during cold-weather months.
Role of Lake/Ground-Water Interactionin the
Water Quality of Vadnais LakeOne of the implications of the estimated seepage
component in the water budget of Vadnais Lake is that the quality of the lake probably was not affected by the quality of the surrounding ground water. Water-quality data suggest that the lake may be slightly diluted by seepage into the lake with respect to some constituents. Concentrations in lake water ranged from 44.4 to 45.7 mg/L for calcium, 12.2 to 12.9 mg/L for magnesium, 180 to 185 mg/L for bicarbonate, and 214 to 229 mg/L for the total dissolved solids (Dave Schuler, St. Paul Water Utility, oral commun., 1991). Concentrations of calcium, magnesium, and bicarbonate in water from monitoring wells A, B, and C, which are upgradient from the lake, were lower than in water from the lake.
Seepage out of the lake appeared to be slightly enriched in phosphorus within the bottom sediments. The total phosphorus concentration in water from the lake in June 1991 ranged from 0.03 to 0.05 mg/L (Dave Schuler, St Paul Water Utility, oral commun., 1991). Analyses of seepage out of the lake collected with the minipiezometer from lakebed sections 3,4, and 5 showed total phosphorus concentrations of 0.70,0.10, and 0.06 mg/L, respectively (Dave Schuler, St Paul Water Utility, oral commun., 1991).
30
SummaryVadnais Lake, in northern Ramsey County, is managed
by the St. Paul Water Utility for municipal water supply. During the past few years algal blooms in the lake have created taste and odor problems for the users of this water supply. S urface-water transport of algae and phosphorus to the lake have been identified as causes of this problem (Walker, 1990). Sucker Creek and Lambert Creek have been determined to be significant sources of phosphorus transport to the lake. Transport of dissolved phosphorus into the lake by ground-water seepage was also deemed to be possible. Results of this study indicate that ground water was not an important source of phosphorus to the lake.
Vadnais Lake is primarily a surface-water dominated lake that receives most of its inflow from Sucker Creek. The source of most of the flow in Sucker Creek are withdrawals from the Mississippi River that are diverted and routed through a series of upstream supply lakes by the SPWU. Additional surface-water inflow is from Lambert Creek, which drains a watershed of approximately 20 square miles to the east of Vadnais Lake.
Lambert Creek flows along an excavated channel that passes through a series of wetlands. These wetlands consist of post-glacial organic deposits called peat. Surrounding and underlying the peat is glacial drift that ranges from about 40 to 300 feet in thickness. Much of the glacial drift is till; the remainder is mostly lacustrine sand and silt and smaller ice-contact and outwash deposits. Below the glacial drift are the Platteville and Glenwood Formations, the St. Peter Sandstone, and the Prairie du Chien Group.
Glacial deposits in the study area that have the highest permeabilities are those that consist predominantly of lacustrine sand and gravel. The hydraulic conductivities of these deposits range from 0.45 to 11 ft/day, which typify the hydraulic conductivity of silty sand. Glacial deposits of mostly silt and clay, which are present in till, are significantly less permeable than the sand and gravel. The permeability of the peat in the wetlands is highly variable, depending on the degree of decomposition. Fibrous peat in the early stages of decomposition may transmit water as readily as silty sand and gravel.
The general direction of near-surface ground-water flow in the study area generally is southwest from the upstream part of Lambert Creek watershed towards Vadnais Lake. Ground water in glacial deposits adjacent to wetlands, however, can move short distances of several hundred yards along local flow directions. Additionally, a water-table depression along the northeastern side of
Vadnais Lake indicates an anomalous reversal to the general southwest flow direction where ground-water movement is from the lake towards the depression. Vertical ground-water flow in the glacial deposits generally is downward.
Ground water in 17 monitoring wells completed in the glacial deposits that underlie the study area generally met drinking water criteria established by the U.S. Environmental Protection Agency. The concentrations of major ions were typical of ground water in shallow glacial-drift aquifers throughout Minnesota. The principal dissolved constituents were calcium, magnesium, and bicarbonate. Sodium and chloride were locally present in greater than background concentrations. Analyses for volatile organic compounds indicated that the concentrations of these substances were below their detection limits. The concentrations of nitrogen and phosphorus nutrients appeared to be similar to background levels measured elsewhere in Minnesota except for high amounts of phosphorus measured in water from monitoring well J located approximately one mile east of Vadnais Lake. The source of this elevated phosphorus concentration is unknown, although movement of phosphorus-enriched water from a nearby wetland toward the well is possible. Other than well J, the concentration of total phosphorus in water from the monitoring wells generally was below 0.15 milligrams per liter.
The ground-water component of the water budget of Vadnais Lake appeared to be small relative to surface- water inflow and withdrawals by the SPWU. Hydraulic conductivities and gradients determined in surrounding glacial deposits indicated that net seepage out of the lake to the ground water was 7.63 x 106 ft3/yr. Hydraulic conductivities and gradients measured in the lakebed indicated a net seepage out of the lake of 9.56 x 107 ft3/yr. Results of the first method were about 8 percent of the results for the second method.
Both methods indicated seepage into the lake along the northern end. Both methods also indicated seepage out of the lakebed along the eastern, southern, and western shorelines. The net seepage out of the lake between spring and winter was from less than 1 to about 4 percent of the total loss attributed to withdrawals and evaporation. The amount of error in these estimates of lake/ground- water seepage is potentially large.
One implication of these estimates of lake/ground- water seepage is that the influence of the quality of the ground water on the quality of the lake was insignificant Ground-water seepage into the lake very slightly diluted the lake in calcium, magnesium, bicarbonate, and total dissolved solids by mixing. Seepage out of the lake was
31

possibly enriched with phosphorus in some parts of the lakebed.
References CitedBloomgren, B.A., 1985, Bedrock geologic map and
topographic maps of the Minneapolis-SL Paul urban area, Minnesota: Minnesota Geological Survey, Miscellaneous Map M-57,2 sheets.
Bouwer, Herman, 1989, The Bouwer and Rice slug test - an update, Ground Water, v. 27, no. 3, p. 304.
Bouwer, Herman, and Rice, R.C., 1976, A slug test for determining hydraulic conductivity of unconfined aquifers with completely or partially penetrating wells, Water Resources Research, v. 12, no. 3, p.423.
Brown, R.G., 1988, Effects of wetland channelization on runoff and loading, Wetlands, v. 8, p. 123.
Davis, S.N., and De Wiest, R.J.M., 1966,Hydrogeology, New York, New York, John Wiley & Sons, 463 p.
Durfor, C.N., and Becker, Edith, 1964, Public water supplies of the 100 largest cities in the United States, 1962: U.S. Geological Survey Water- Supply Paper 1812, 364 p.
Freeze, R.A., and Cherry, J.A., 1979, Groundwater, Englewood Cliffs, New Jersey, Prentice-Hall, Inc., 604 p.
Hem, J.D., 1985, Study and interpretation of the chemical characteristics of natural water: U.S. Geological Survey Water Supply Paper 2254, 263 p.
Hvorslev, MJ., 1951, Time lag and soil permeability in groundwater observations: U.S. Army Corps Eng. Waterways Experimental Bulletin 36,55 p.
Kuehnast, E.L., Baker, D.G., and Enz, J.W., 1975, Climate of Minnesota Part VHI--Precipitation patterns in the Minneapolis-SL Paul Metropolitan Area and surrounding counties: Minnesota Agricultural Experiment Station Technical Bulletin 301,37 p.
Lee, D.R., 1977, A device for measuring seepage flux in lakes and estuaries, Limnology and Oceanography, v. 22, p. 140-147.
Lee, D.R., and Cherry, J.A., 1978, A field exercise on ground-water flow using seepage meters and minipiezometers, Journal of Geological Education, v. 27, p. 6-10.
Liesch, B.A., 1980, Ground water investigation Vadnais Lake area, Bruce A. Liesch Associates, Inc., Minneapolis, Minnesota, 18 p.
McBride, M.S., and Pfannkuch, H.O., 1975, The distribution of seepage within lakes, U.S. Geological Survey Journal of Research, v. 3, p. 505-512.
Meyer, G.N., 1985, Quaternary geologic map of the Minneapolis-SL Paul urban area, Minnesota: Minnesota Geological Survey, Miscellaneous Map M-54,1 sheet.
Miller, R.T., 1981, Hydrologic data for the Pelican River Sand-Plain aquifer, western Minnesota: U.S. Geological Survey Open-File Report 80-695, 86 p.
Myette, C.F., 1984, Ground-water-quality appraisal of sand-plain aquifers in Hubbard, Morrison, Otter Tail, and Wadena Counties, Minnesota: U.S. Geological Survey Water-Resources Investigations Report 84-4080,49 p.
Norvitch, R.F., Ross, T.G., and Brietkrietz, A., 1974, Water Resources outlook for the Minneapolis-SL Paul Metropolitan Area: Metropolitan Council of the Twin Cities, 219 p.
Novitzki, R.P., 1979, Hydrology of Wisconsin Wetlands: Wisconsin Geological and Natural History Survey, Information Circular 40,22 p.
Osgood, R.A., 1988, The limnology, ecology and management of Twin Cities Metropolitan Area lakes, Metropolitan Council of the Twin Cities Area, 119 p.
Ruhl, J.F., 1987, Hydrogeologic and water-quality characteristics of glacial-drift aquifers in Minnesota: U.S. Geological Survey Water Resources Investigations Report 87-4 224,3 sheets.
Saint Paul Water Utility, 1990 Annual Record of Statistics, p. 22.
Schoenberg, M.E., 1990, Effects of present andprojected ground-water withdrawals on the Twin Cities aquifer system, Minnesota: Water- Resources Investigations Report 90-4001,165 p.
Skougstad, M.W., Fishman, M.J., Friedman, L.C., Erdmann, D.E., and Duncan, S.S., eds., 1979, Methods for determination of inorganic substances in water and fluvial sediments: U. S. Geological Survey Techniques of Water-Resources Investigations, Book 5, Chapter Al, 1,006 p.
32

United States Environmental Protection Agency, 1988a, Secondary maximum contaminant levels (section 143.3 of part 143, National secondary drinking- water regulations): U.S. Code of Federal Regulations, Title 40, Parts 100 to 149, revised as of July 1,1988, p. 608.
United States Environmental Protection Agency, 1988b, National revised primary drinking water regulations: Maximum contaminant levels (subpart G of part 141, National interim primary drinking-water regulations): U.S. Code of Federal Regulations, Title 40, Parts 100 to 149, revised as of July 1,1988, p. 586.
Verry, E.S., and Boelter, D.H., 1979, Peatland hydrology, in Greeson, P.E., Clark, J.R., and Clark, J.E., eds., Wetland Functions and Values- The State of Our Understanding: American Water Resources Association, Minneapolis, Minnesota, p. 389.
Walker, W.W., 1985, Analysis of 1984 monitoring data from the Vadnais Lake diagnostic study, prepared for the Board of Water Commissioners, St. Paul, Minnesota, p. 149.
___1986, Analysis of 1985 monitoring data from theVadnais Lake diagnostic study, prepared for the Board of Water Commissioners, St. Paul, Minnesota, p. 78.
___1987, Analysis of 1986 monitoring data from the Vadnais Lake diagnostic study, prepared for the Board of Water Commissioners, St. Paul, Minnesota, p. 114.
___1988, Analysis of 1987 monitoring data from the Vadnais Lake diagnostic study, prepared for the Board of Water Commissioners, St. Paul, Minnesota, p. 125.
___1990, Analysis of 1988 and 1989 monitoring data from the Vadnais Lakes diagnostic study, prepared for the Board of Water Commissioners, St Paul, Minnesota, p. 94.
Winter, T.C., 1974, The natural quality of ground water in Minnesota: Minnesota Department of Natural Resources, Division of Waters, Bulletin 26,25 p.
___1976, Numerical simulation analysis of the interaction of lakes and ground water: U.S. Geological Survey Professional Paper 1001,45 p.
Winter, T.C., LaBaugh, J.W., and Rosenberry, D.O., 1988, The design and use of a hydraulic potentiomanometer for direct measurement of differences in hydraulic head between groundwater and surface water, Limnology and Oceanography, v. 33, p. 1209.
33

34

Supplemental Information Section
35

Table 7.-Geologic logs of monitoring well boreholes around Vadnais Lake and in Lambert Creek watershed
Color
Monitoring Well: A Location: 30.22.30BABLand surface altitude: 894.6 feet above sea level
Formation Log
Mineral soil
Medium to fine sand
Screened interval
Monitoring Well: B Location: 30.22.30BADLand surface altitude: 890.1 feet above sea level
Formation Log
Organic material
Medium to fine sand
Screened interval
Monitoring Well: C Location: 30.22.30ABALand surface altitude: 906.0 feet above sea level
Formation Log
Fill
Medium to fine sand
Clay
Screened interval
Monitoring Well: D Location: 30.22.30DADLand surface altitude: 903.4 feet above sea level
Formation Log
Mineral soil
Till Brown
Sand and gravel Reddish brown
Gravel
Sandy till Red
Medium sand and gravel Red
Screened interval
Depth, in feet below land
surface
0-1
1-16
13-16
0-1.5
1.5-11
8-11
0-1
1-10
10-11
8-11
0-1
1-6
6-9
9-10
10-29
29-33
30-33
Thickness (feet)
i
15
3
1.5
9.5
3
1
9
1
3
1
5
3
1
19
4
3
36

Table 7.-Geologic logs of monitoring well boreholes around Vadnais Lake and in Lambert Creekwatershed-Continued
Color
Monitoring Well: E Location: 30.22.32BAC Land surface altitude: 890.8 feet above sea level
Formation Log
Fine sand
Gravel
Clay and medium to coarse sand
Screened interval
Monitoring Well: F Location: 30.22.32BAD Land surface altitude: 924.1 feet above sea level
Formation Log
Sandy soil Brown
Medium to fine sand Brown
Fine sand and clay Brown
Fine sand Brown
Silt and clay Brown and gray
Medium sand Brown and gray
Screened interval
Monitoring Well: G Location: 30.22.33ACD Land surface altitude: 881.9 feet above sea level
Formation Log
Sand and gravel Reddish brown
Sand and organic material Black
Fine sand
Fine sand and clay
Fine to medium sand
Sandy clay
Screened interval
Depth, in feet below land
surface
0-5
5-6
6-25
22-25
0-2
2-14
14-17
17-20
20-28
28-47
44-47
0-3
3-5
5-6
6-7
7-15
15-17
14-17
Thickness (feet)
5
1
19
3
2
12
3
3
8
19
3
3
2
1
1
8
2
3
37
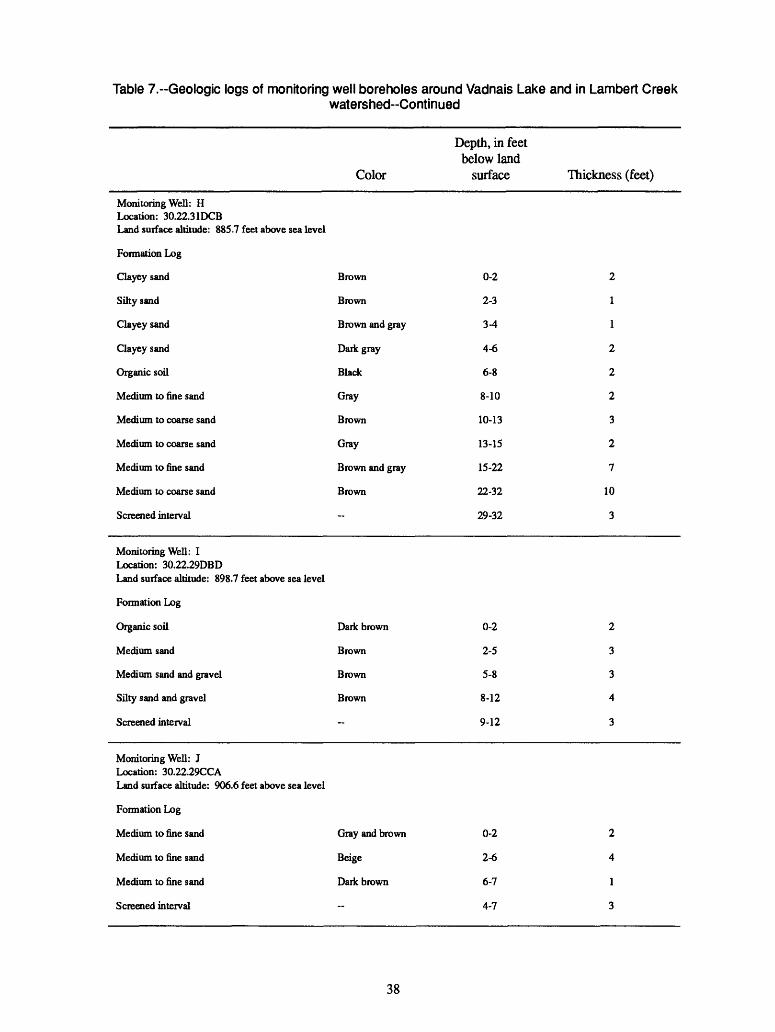
Table 7.--Geologic logs of monitoring well boreholes around Vadnais Lake and in Lambert Creekwatershed-Continued
Monitoring Well: H Location: 30.22.3 1DCBLand surface altitude: 885.7 feet above sea level
Formation Log
Clayey sand
Silty sand
Clayey sand
Clayey sand
Organic soil
Medium to fine sand
Medium to coarse sand
Medium to coarse sand
Medium to fine sand
Medium to coarse sand
Screened interval
Monitoring Well: I Location: 30.22.29DBDLand surface altitude: 898.7 feet above sea level
Formation Log
Organic soil
Medium sand
Medium sand and gravel
Silty sand and gravel
Screened interval
Monitoring Well: J Location: 30.22.29CCALand surface altitude: 906.6 feet above sea level
Formation Log
Medium to fine sand
Medium to fine sand
Medium to fine sand
Screened interval
Color
Brown
Brown
Brown and gray
Dark gray
Black
Gray
Brown
Gray
Brown and gray
Brown
~
Dark brown
Brown
Brown
Brown
--
Gray and brown
Beige
Dark brown
Depth, in feet below land
surface
0-2
2-3
3-4
4-6
6-8
8-10
10-13
13-15
15-22
22-32
29-32
0-2
2-5
5-8
8-12
9-12
0-2
2-6
6-7
4-7
Thickness (feet)
2
l
1
2
2
2
3
2
7
10
3
2
3
3
4
3
2
4
1
3
38
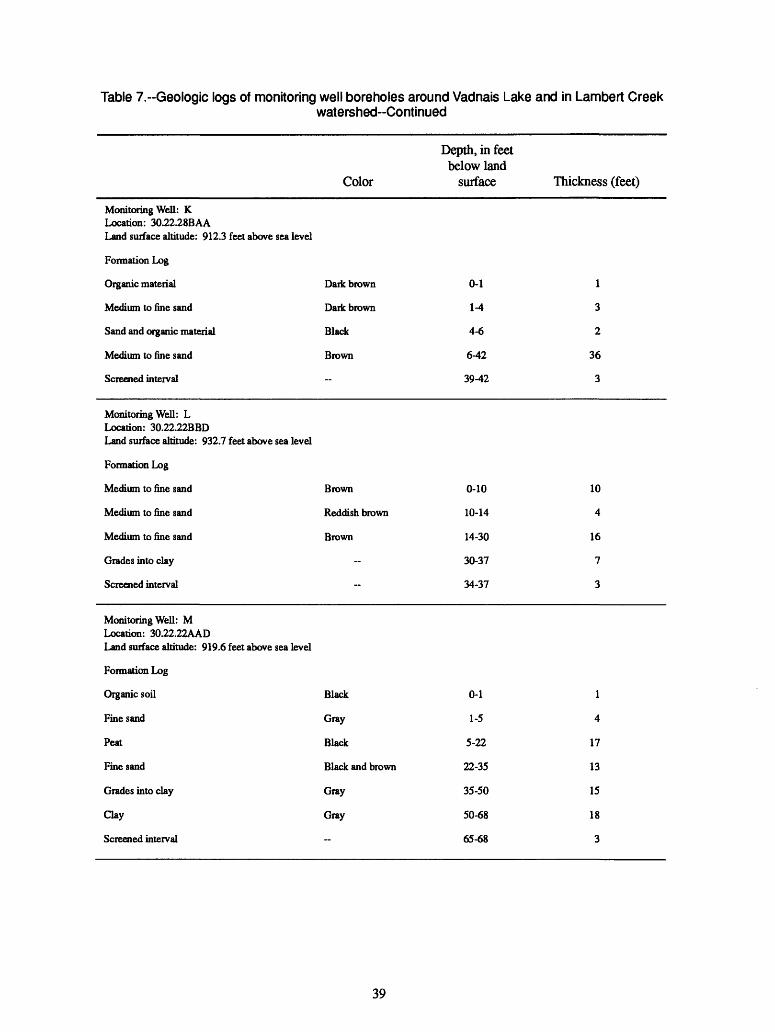
Table 7.--Geologic logs of monitoring well boreholes around Vadnais Lake and in Lambert Creekwatershed-Continued
Monitoring Well: K Location: 30.22.28BAALand surface altitude: 912.3 feet above sea level
Formation Log
Organic material
Medium to fine sand
Sand and organic material
Medium to fine sand
Screened interval
Monitoring Well: L Location: 30.22.22BBDLand surface altitude: 932.7 feet above sea level
Formation Log
Medium to fine sand
Medium to fine sand
Medium to fine sand
Grades into clay
Screened interval
Monitoring Well: M Location: 30.22.22AADLand surface altitude: 919.6 feet above sea level
Formation Log
Organic soil
Fine sand
Peat
Fine sand
Grades into clay
Clay
Screened interval
Color
Dark brown
Dark brown
Black
Brown
--
Brown
Reddish brown
Brown
-
--
Black
Gray
Black
Black and brown
Gray
Gray
Depth, in feet below land
surface
0-1
1-4
4-6
6-42
39-42
0-10
10-14
14-30
30-37
34-37
0-1
1-5
5-22
22-35
35-50
50-68
65-68
Thickness (feet)
l
3
2
36
3
10
4
16
7
3
1
4
17
13
15
18
3
39

Table 7.-Geologic logs of monitoring well boreholes around Vadnais Lake and in Lambert Creekwatershed-Continued
Color
Monitoring Well: N (shallow) Location: 30.22.22DBALand surface altitude: 922.6 feet above sea level
Formation Log
Silt with organic material Dark brown
Medium to fine sand Brown
Screened interval
Monitoring Well: N(deep) Location: 30.22.22DBALand surface altitude: 922.6 feet above sea level
Formation Log
Silt with organic material Dark brown
Silt and fine sand Brown
Fine sand Brown
Grades into clay Gray
Medium to fine sand Red
Clay
Screened interval
Monitoring Well: O (shallow) Location: 30.22.23CBBLand surface altitude: 929.2 feet above sea level
Formation Log
Fine sand Brown
Screened interval
Monitoring Well: O(deep) Location: 30.22.23CBBLand surface altitude: 929.2 feet above sea level
Formation Log
Fine sand Brown
Very fine sand Gray
Gravel Gray
Clay Gray
Screened interval
Depth, in feet below land
surface
0-5
5-9
6-9
0-5
5-17
17-19
19-29
29-31
31-32
29-32
0-6
3-6
0-28
28-42
42-46
46-48
45-48
Thickness (feet)
5
4
3
5
12
2
10
2
1
3
6
3
28
14
4
2
3
40

Table 8.-Geologic logs of Vadnais Lake core samples (Core sample numbers correspond to minipiezometersite numbers shown on figures 3 and 10)
Depth, in feetbelow land
surface
Core Sample 1
Brown medium sand
Gray, clean, fine to medium sand
Peat
Gray, clean, fine to medium sand
Gray, clean, fine to medium sand, thin organic lamina present
Gray, fine to medium sand with organic layers
Light gray, medium sand with scattered coarse sand
Light gray, silly medium sand
Light gray, fine to medium silty sand
Brown, medium to coarse sand
Gray, medium sand
Brown, medium to coarse sand
Gray, medium sand with scattered coarse sand
Core Sample 3
Brown, clean medium sand
Brown, clean medium sand, silty
Brown, clayey coarse sand with pebbles
Reddish brown, clean medium sand with clay and silt lamina
Gray, coarse sand
Reddish-brown, medium sand
Brown, silty clay
Brown, silty clay with sand lenses
Brown, silty clay
Brown, silty clay with sand lenses
Core Sample 6
Dark gray, medium to coarse sand with pebbles and organic matter
Light gray, medium to coarse sand with scattered pebbles
Light brown, mostly brown clay and silt with coarse sand
Brown, coarse sand with scattered fine gravel
Black, medium-grained inorganic material
Reddish brown clay with silty sand __ ___________
0-1.2
1.2-2.0
2.0 - 2.1
2.1-2.7
2.7-3.1
3.1-3.4
3.4 - 3.7
3.7 - 4.1
4.1-4.3
4.3 - 4.4
4.4 - 4.6
4.6 - 4.8
4.8-6.0
0-0.4
0.4 - 0.7
0.7 - 1.3
1.3-2.1
2.1-2.7
2.7-2.9
2.9-3.2
3.2-3.4
3.4-3.6
3.6 - 4.0
0-0.8
0.8 - 2.0
2.0-2.2
2.2-2.4
2.4 - 2.8
2.8 - 4.0
41
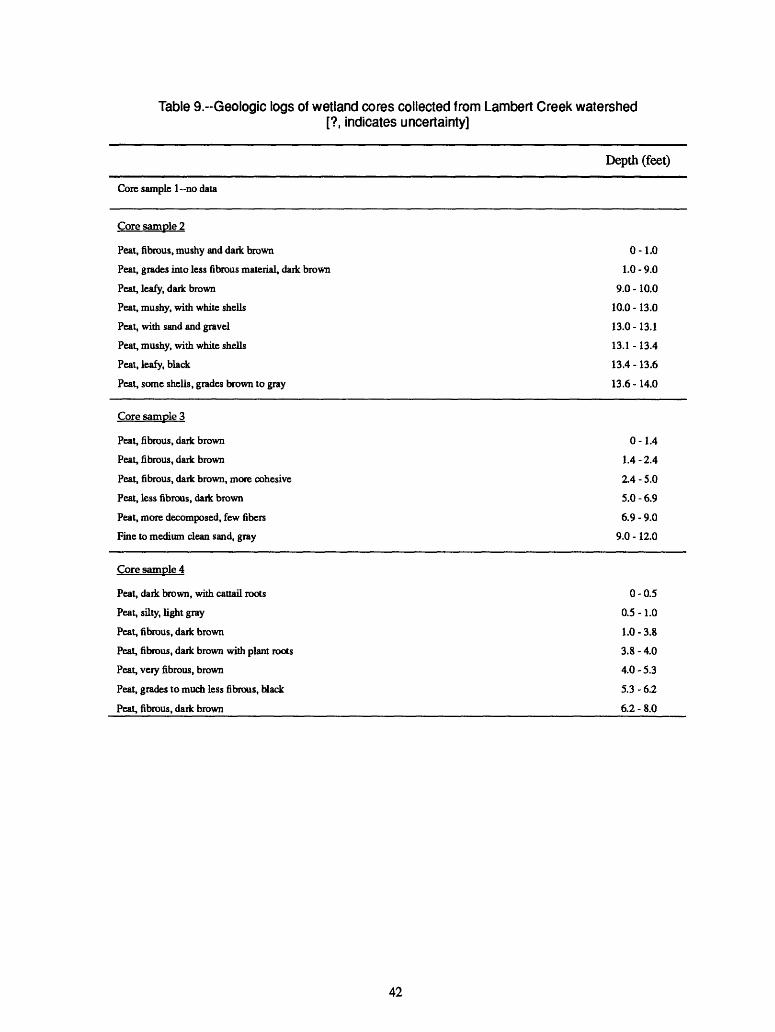
Table 9.--Geologic logs of wetland cores collected from Lambert Creek watershed[?, indicates uncertainty]
Depth (feet)
Core sample I no data
Core sample 2
Peat, fibrous, mushy and dark brown
Peat, grades into less fibrous material, dark brown
Peat, leafy, dark brown
Peat, mushy, with white shells
Peat, with sand and gravel
Peat, mushy, with white shells
Peat, leafy, black
Peat, some shells, grades brown to gray
0-1.0
1.0 - 9.0
9.0-10.0
10.0 -13.0
13.0-13.1
13.1 -13.4
13.4 -13.6
13.6 -14.0
Core sample 3
Peat, fibrous, dark brown
Peat, fibrous, dark brown
Peat, fibrous, dark brown, more cohesive
Peat, less fibrous, dark brown
Peat, more decomposed, few fibers
Fine to medium dean sand, gray
0-1.4
1.4-2.4
2.4-5.0
5.0 - 6.9
6.9-9.0
9.0 -12.0
Core sample 4
Peat, dark brown, with cattail roots
Peat, silty, light gray
Peat, fibrous, dark brown
Peat, fibrous, dark brown with plant roots
Peat, very fibrous, brown
Peat, grades to much less fibrous, black
Peat, fibrous, dark brown
0-0.5
0.5 - 1.0
1.0 - 3.8
3.8 - 4.0
4.0-5.3
5.3 - 6.2
6.2 - 8.0
42

Table 9.--Geologic logs of wetland cores collected from Lambert Creek watershed-Continued
Depth (feet)
Core sample 5
Peat, with cattail loots, dark brown
Peat, with smaller roots, decomposed, black
Peat, without roots, black
Peat, dark brown
Peat, non-fibrous, dark brown to green
Peat, with some plant parts, dark brown and slightly green
Peat, slightly fibrous, dark brown
Peat, with shells, dark brown to green
Peat, with some plant seeds, dark brown
Peat, with seeds and shells, yellow to dark brown
Peat, with leaves and seeds, firm but breaks apart easily, dark brown
Peat, with leaves and seeds, firm but breaks apart easily, dark brown to yellow
Peat, homogeneous, dark brown, breaks apart
Peat, homogeneous, dark brown
Silty day, gray
Clay, gray
0-1.0
1.0 - 2.0
2.0 - 4.0
7.5-9.0
9.0-11.0
11.0-14.0
14.0 -15.4
15.4 -17.8
17.8 -18.0
18.0-18.5
18.5 -19.1
19.1 -19.5
19.5-21.0
21.0-23.5
23.5-25.0
25.0 - 28.0
Core sample 6
Peat, fibrous, brown
Peat, less fibrous, with seeds, dark brown
Peat, less fibrous, with seeds, black
Peat, with shell fragments and some silt, dark brown
Peat, with some sand and silt
Peat, with some fine sand, light brown
Sand, medium-fine, light brown
Peat, black
Peat, with some sand, black
Sand, with some peat, light brown
Silt, fine sand, yellow to brown
0-0.8
0.8 - 3.8
3.8 - 4.8
4.8-5.5
5.5 - 6.3
6.3 - 8.0
8.0 - 8.4
8.4 - 8.5
8.5 - 8.6
8.6 - 8.9
8.9 - 9.4
Core sample 7
Peat, with roots
Peat, with smaller roots, dark brown
Peat, with some sand and seeds, slightly fibrous
Silt, with some shell fragments, light gray
Clay, gray
Sand, fine to very fine, clean, light brown
Silt, with some shell fragments and day
0-2.5
2.5 - 4.5
4.5-5.5
5.5-75.
7.5-8.1
8.1-8.6
8.6 - 9.5
43
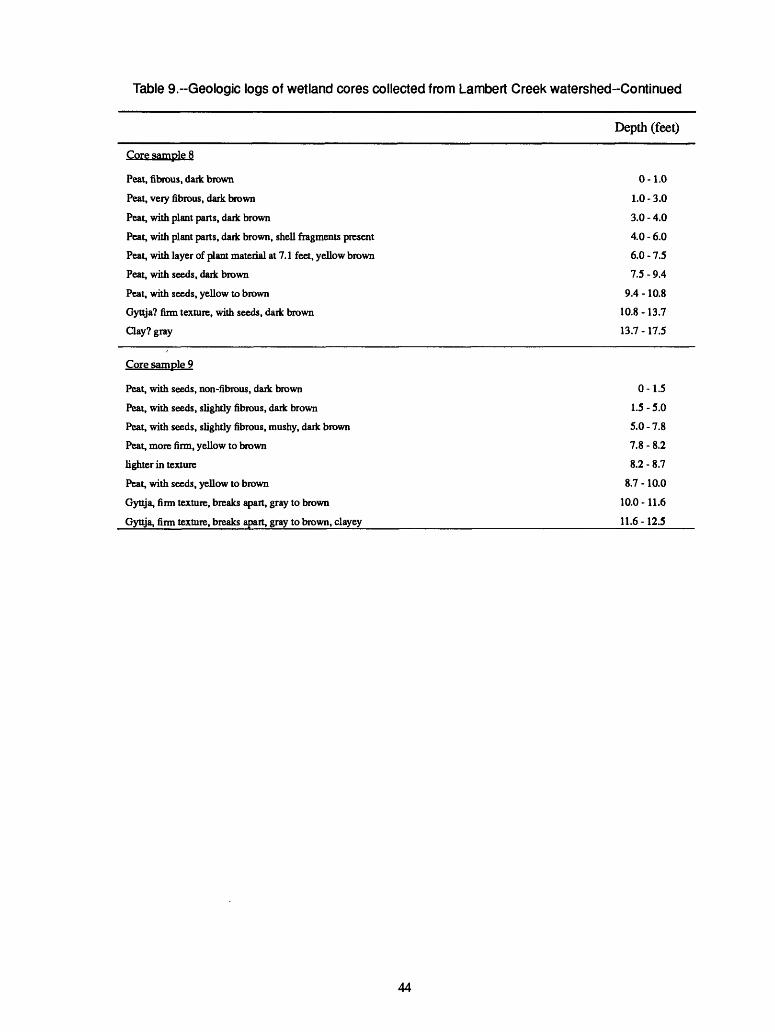
Table 9.--Geologic logs of wetland cores collected from Lambert Creek watershed-Continued
Depth (feet)
Core sample 8
Peat, fibrous, dark brown 0-1.0
Peat, very fibrous, dark brown 1.0 - 3.0
Peat, with plant pans, dark brown 3.0 - 4.0
Peat, with plant pans, dark brown, shell fragments present 4.0 - 6.0
Peat, with layer of plant material at 7.1 feet, yellow brown 6.0 - 7.5
Peat, with seeds, dark brown 1.5 - 9.4
Peat, with seeds, yellow to brown 9.4 -10.8
Gyttja? firm texture, with seeds, dark brown 10.8 -13.7
day? gray 13.7 -17.5
Core sample 9
Peat, with seeds, non-fibrous, dark brown 0 -1.5
Peat, with seeds, slightly fibrous, dark brown 1.5 - 5.0
Peat, with seeds, slightly fibrous, mushy, dark brown 5.0 - 7.8
Peat, more firm, yellow to brown 7.8 - 8.2
lighter in texture 8.2 - 8.7
Peat, with seeds, yellow to brown 8.7 -10.0
Gyttja, firm texture, breaks apart, gray to brown 10.0 -11.6
Gyttja, firm texture, breaks apart, gray to brown, clayey________________________________11.6 -12.5
44

0.0
LJJ O
LL DCID CO
QZ <
O _iLJJ CO
LU LJJ LL
LJJ
LJJ_l
DC LJJ
2.0
4.0
6.0
8.0
10.0JFMAMJJASONDJFMAMJ JASONDJFMAMJ
1989 1990 1991
EXPLANATIONWater-level measurement
Figure 13.--Water-level measurements for monitoring well A. (Elevation of land surface datum, in feet, above sea level is 894.6.)
45

0.0
2.0
LJJo £a:z>C/)
Q 4.0
gLJJm
LJJLJJu_
LJJ
LJJ
a:LJJ
6.0
8.0
10.0
1 1 1 1 1 1 1 1 1 1 1 1 1 1 1 1 1 1 1 1 1
^ "?|\"^
I I I I I I I I I I I I I I I I I I I I I I I I I I I I IJFMAMJJASONDJFMAMJ JASONDJFMAMJ
1989 1990 1991
EXPLANATIONWater-level measurement
Figure 14.-Water-level measurements for monitoring well B. (Elevation of land-surface datum, in feet, above sea level is 890.1.)
46

WA
TE
R
LEV
EL,
IN
F
EE
T
BE
LOW
LA
ND
S
UR
FA
CE
D
AT
UM
O
00
O)
4^
hO
C2!
b
b
b
b
b
c
(Q 1 (D _^
T|
5T L
>
3 <
Q
. fi)
9
1?
£ -
si
§ c-
il
* *
1*
^ °
- ^
Si
m
z^'
a
®
X
,_,
3 3
7 -o
o
-J.
S>
®
C
C_
<D
3.
<
&O
M
CD
7r*
w
J
TI
a
o*
3
H
^CT
"^
^
??§3
§i
<D
O
^
^w
3
CD
_^
=*
So
m
CD
^
2.
§
CD
c_m
3
~
0
5 <Q
>- 5
w
» =
O
go
z
o
^
<*>
^-,
b-^
°
o m sr
c
(D 1 o'
^3
>
CD
^
CD *
c_
1 1
1 1
1 1
1 1
1 1
1 1
1 1
1 1
1 1
1
-
-
*
_
*
-
-
1*1
-
-
*
-
I
*
I
N
L"
~
~-
*
-
^
i
I i
I I
i I
I I
i I
i r"
i
I I
I I
i
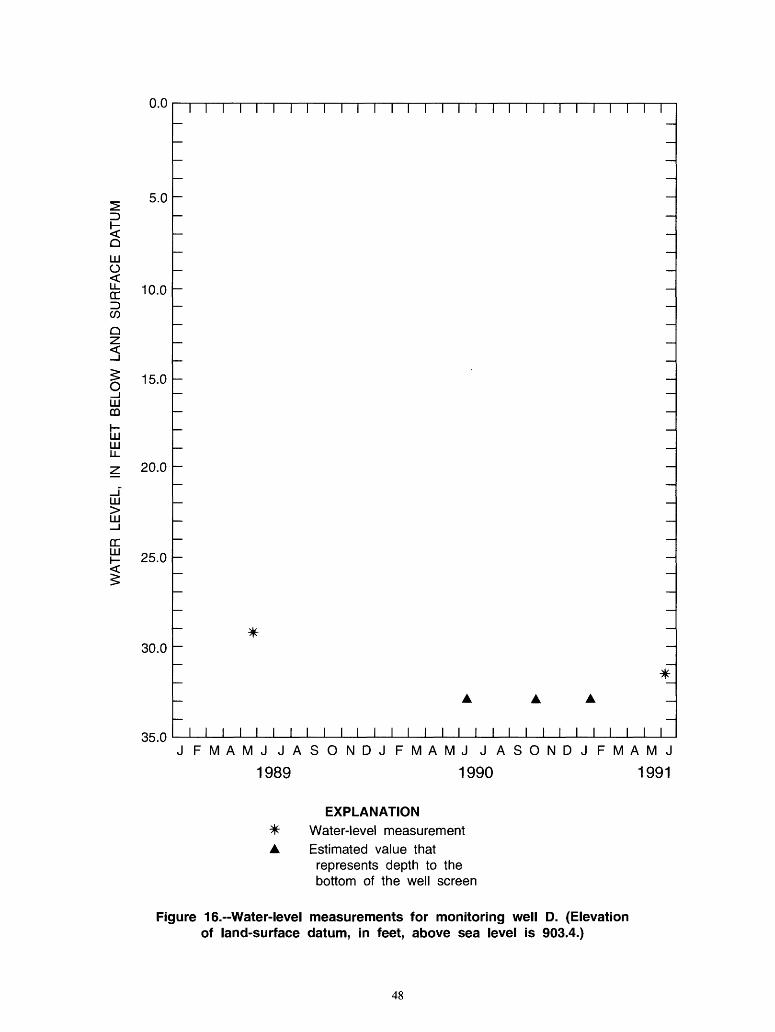
0.0
Q
LLJ O
=3 CO
Q Z
LU CD
LU LU U_
10.0
15.0
Z 20.0
LU
LU
o:25.0
30.0
35.0
I \ \ I T
A A
I I I I I I I I I I I I I I I I I I I I I I I I I I I I
J FMAMJ JASONDJ FMAMJ JASONDJ FMAMJ
1989 1990 1991
EXPLANATION
* Water-level measurement A Estimated value that
represents depth to thebottom of the well screen
Figure 16.-Water-level measurements for monitoring well D. (Elevation of land-surface datum, in feet, above sea level is 903.4.)
48

0.0
^ 3.0z>< oLU O< LL DC ID V)
O 6.0
LU CO
LU LU
LU
LU_J
DC LU
9.0
12.0
15.0JFMAMJJASONDJFMAMJ JASONDJFMAMJ
1989 1990 1991
EXPLANATIONWater-level measurement
Figure 17.--Water-level measurements for monitoring well E. (Elevation of land-surface datum, in feet, above sea level is 890.8.)
49
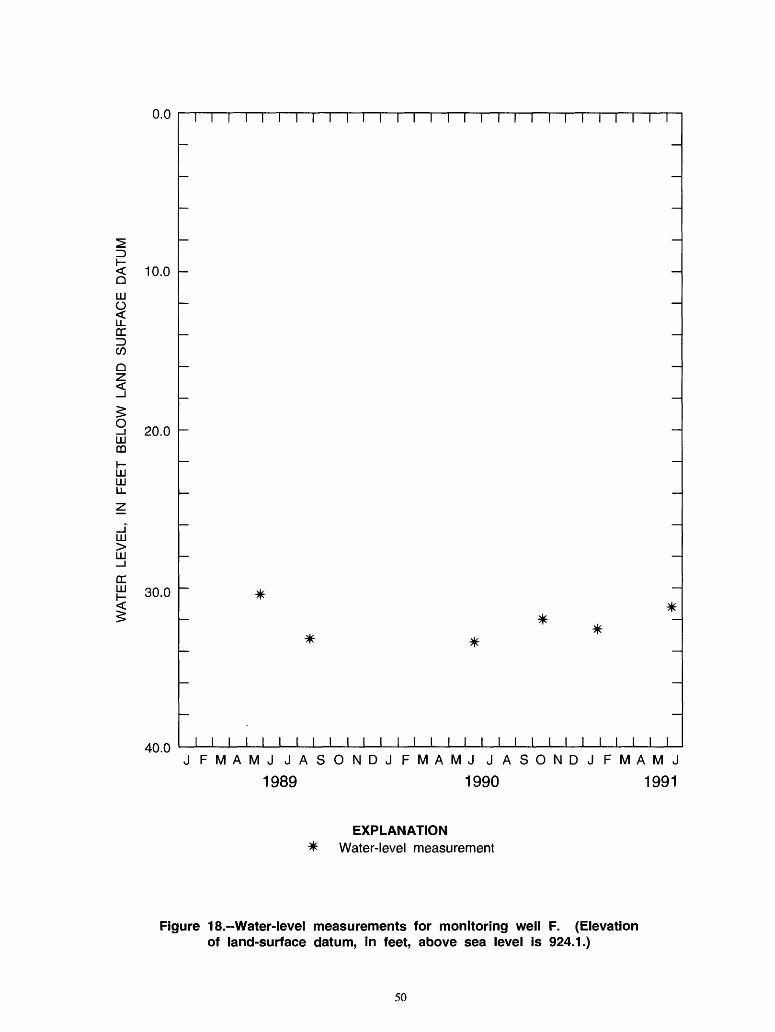
0.0
10.0
LLJo2cc=>0)
Q
9 20.0CD
LU LU LL
LU >LU
CC30.0
40.0
1 I I I I I I I I I 1 I I I I I
JFMAMJJASONDJFMAMJ JASONDJFMAMJ
1989 1990 1991
EXPLANATIONWater-level measurement
Figure 18.--Water-level measurements for monitoring well F. (Elevation of land-surface datum, in feet, above sea level is 924.1.)
50

0.0
LUoLL DC=>
QZ <
LU CD
LU LU
LU
LU_l
DC LU
2.0
4.0
6.0
8.0
10.0
I I I I I I T
J FMAMJ JASONDJ FMAMJ JASONDJ FMAMJ
1989 1990 1991
EXPLANATIONWater-level measurement
Figure 19.--Water-level measurements for monitoring well G. (Elevation of land-surface datum, in feet, above sea level is 881.9.)
51

WA
TE
R
LEV
EL,
IN
F
EE
T
BE
LOW
LA
ND
S
UR
FA
CE
D
AT
UM
Tl
(5* c ii Q
. j»
c
7
8
2.
g. 3 ii 1.3
=
3-*
i ^
CD a w
o) o"
O"
""*
CD
OW
2.
*i CD
(Q
-1 _.
<DW
=
oo Z
5-
°f 0) o' 3
* ^ £
mCD
X
7
TJcb~
r<
>55L
Z
3
HS
ow
z
c CD CD
PO
_».
-».
o
cn
o
cn
c b
b
b
b
cc_ ~n ^
> ^£
c-
§ - 0) 0 -z. D c_ ~n ^ > ^
S
<-C
D
c_0
C/D 0 -z. D c_ ~n ^
_^
>C
D ^
CD L
c_
1 1
1 1
1 1
1 1
1 1
1 1
1 1
1 1
1 1
1
-
-
"" ~
*
-
-
I
*
I
-
~
J£
~
#
*
~~
~~
~
1 1
1 1
1 1
* 1
1 1
1 1
1 1
1 1
1 1
1 1
~
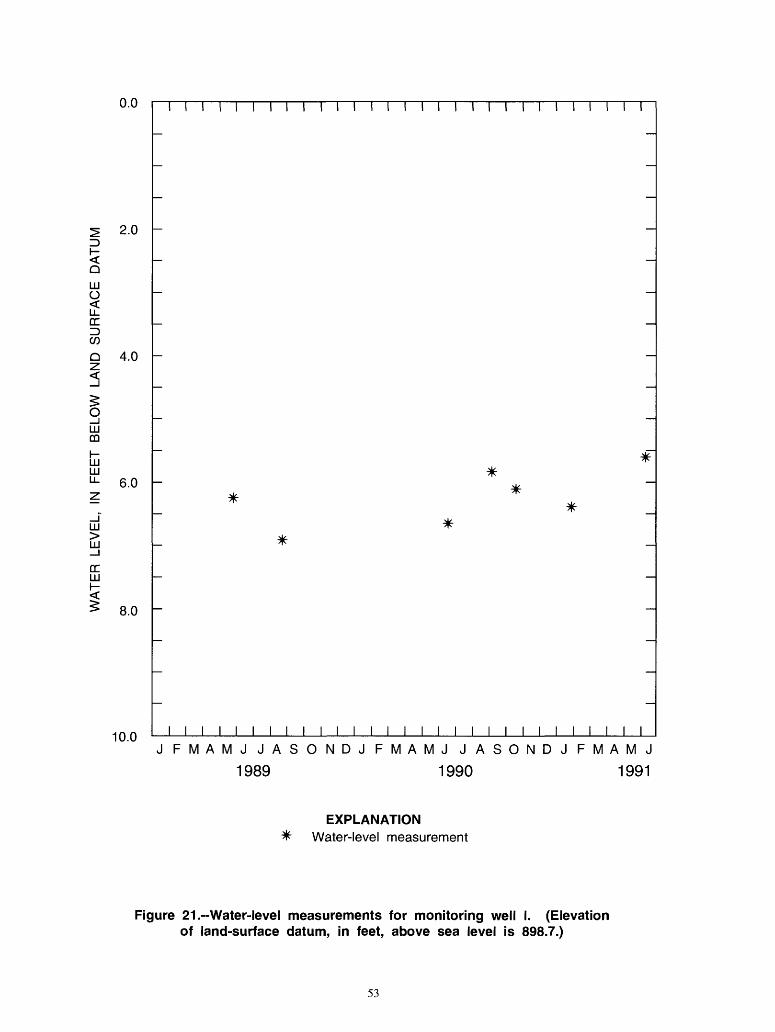
0.0
2.0
LLJ O
LLCE=>
Q 4.0z <
LLJ CD
LJJ LLJ"- 6.0
LJJ
LJJ_J
CE LJJh-
^ 8.0
10.0
I I I I I I
J FMAMJ JASONDJ FMAMJ JASONDJ FMAMJ
1989 1990 1991
EXPLANATIONWater-level measurement
Figure 21.-Water-level measurements for monitoring well I. (Elevation of land-surface datum, in feet, above sea level is 898.7.)
53

0.0
2.0
Q
LU O
LL.o:C/}
Q2 <
gLJJ CD
LJJ LU LL
LU
LJJ_l
o:LLJ
4.0
6.0
8.0
10.0
12.0
1 I I I I I I I I I I I I I I I I I T
J FMAMJ JASONDJ FMAMJ JASONDJ FMAMJ
1989 1990 1991
EXPLANATIONWater-level measurement
Figure 22.--Water-level measurements for monitoring well J. (Elevation of land-surface datum, in feet, above sea level is 906.6.)
54

0.0
Q
LU O <u_ cc=)C/D
Q
LU CO
LU LU U_
LU
LU_l
CC LU
5.0
10.0
15.0
1 I I I I I I I I I I I I I I I I I I I I I I I I I I I I
J FMAMJ JASONDJ FMAMJ JASONDJ FMAMJ
1989 1990 1991
EXPLANATIONDenotes water-level measurement
Figure 23.--Water-level measurements for monitoring well K. (Elevation of land-surface datum, in feet, above seallevel is 912.3.)
55

WA
TE
R
LEV
EL,
IN
F
EE
T
BE
LOW
LA
ND
S
UR
FA
CE
D
AT
UM
CO
N>
N>
->
->
o
en
o
en
o
en
c Z!
bbbbbbc
c (0
c_
9| <
~n
CX
0)
to
(D
=
7
i £
a g
*
^
ft|
>i
B :>
-3
t m
- »
CD
X
^
3
3
7_
13
(0
3
< ^
o>
o"
3 H
rf
or
i
CD s
co
o
03
O
co
;i i
° -(/
)=
qS
o
%_ 5
- 3-
>
sr£
w<o
r~
w
N> ki^
O
^"^
<o"
"*
~Z.
o 3
D
1 1
1 1
1 1
1 1
1 1
1 1
1 1
1 1
1 1
1 1
1 1
1 1
1 1
1 1
1 |
-
-
- -
-
* *-
-
*
1 1
1 1
1 1
1 1
1 1
1 1
1 1
1 1
1 1
1 1
1 1
1 1
1 1
1 1
1

0.0
1Q
LU O < LL DC D CO
gLU CO
LU LU LL
LU
LU_l
DC LU
1.0
2.0
3.0
4.0
5.0 I I I I I
JFMAMJ JASOND
1990
EXPLANATIONWater-level measurement
Figure 25.--Water-level measurements for monitoring well M. (Elevation of land-surface datum, in feet, above sea level is 919.6.)
57

WA
TE
R
LEV
EL,
IN
F
EE
T
BE
LOW
LA
ND
S
UR
FA
CE
D
AT
UM
co
oro
m b
ro
o ben
b
o
bon
b
p
b
fS
f2.
ft
3 _.
z M
(A
O>
to a
':
w 2
3?
m?
(D
2.
0)
3F
* 3
§2 3 to
a- * (D
»
1
3
£9-
S(A
<«
C
-h
Si
Q-i a | II (Q
(D Q) ^
C
T (A
O
3"
(A
<
(D
>S
0)
Tl
^ ^
o
o3
3
mS-
^
x
^ ^
(D
(D
CD
:r(D
P
"O
=
5® CD
0)
1 1
11
1 1
11
1 1
1 1
11
1 1
1
1 1
1

WATER LEVEL, IN
FEET BELOW LAND SURFACE DATUM
CD 1 o>'
(0 10
CD jo
Q)
3 Q.
O 'a CD
CD ^ ^ ^ m CD
Q)
i-+ 5' 3 o 5" 3 Q.
0) 1 O
CD a. 0) i-* C 3 5'
sf CD a 0) o- § CD 0) CD 0)
-n
(5*
C 3 ro
;sl
"l 0) ? 1 CD <
^2.
^
CD
0)
^w
g-1
i.i
§.§
cE
ff
^2*
(DO
=
3 °
i o
=;
(D
Q
^
° s
5'
(Q 2. " O *</> 3- Si o" .5,
O
00
O5
4^
K>
Cb
b
b
b
b
c
c_ Tl
^
^If
>
^ 0 3 m
_
i ?
(Q
>
* !
- "
=
5
«o i
g t
0)
IT
0) 0
>
" '
U) O z o
1 1
1 1
1 1
1 1
1 1
1 1
1 1
1 1
1 1
1 1
* *
- -
- -
^ *
^ *
^ *
1 1
1 1
1 1
1 1
1 1
1 1
1 1
1 1
1 1
1