quality methods investigation at
TRANSCRIPT

Quality Methods Investigation
at
Volvo Cars AB Torslanda
Kvalitetsmetoder Undersökning På Volvo Cars AB Torslanda
Madeleine – Sahar Latifi Setareh – Stella Latifi
Examensarbetet omfattar 20 poäng och ingår som ett obligatoriskt moment i Högskoleingenjörsexamen i
Industriell Ekonomi-Affärsingenjör specialisering i Maskinteknik 140 poäng Nr 8/2007

2
Quality Methods Investigation
at
Volvo Cars AB Torslanda
Madeleine – Sahar Latifi Setareh – Stella Latifi
Place Volvo Cars AB Torslanda
Supervisors Jerker Johnsson Jimi Österhlom
Examinator Jerker Johnsson
University of Borås
University of Borås Institution for Engineering School
Thesis for Graduation in Industrial Engineering/Mechanical Engineering
06/2007
3
Acknowledgement This is a 20-credit thesis within Quality Improvement at Volvo Cars Torslanda, which is done from 2007.01.20 to 2007.06.10. This project is done at TC 10 department at Volvo Cars Torslanda. We hereby would like to thank all people who somehow helped us to achieve this result. First, we would like to thank Jerker Johnsson as a supervisor from University of Borås for his unconditional help and accessibility during this project and the whole education period. Jonas Stray’s efforts are also acknowledged for his support during our whole education that helped us reach this stage. We appreciate the Institution for Engineering School for its support and friendly environment they made which let us enjoy every moment of our studies. We hereby thank Jimi Österholm as our supervisor at Volvo Cars Torslanda for his presence and his great leadership also his right knowledge for this project. We shall thank all people at TC 10 and TC 11 departments specially Gerhard Johansson for his attention and great helps in order to reach the right information during this project. We thank Bengt Wilhelmson for having the task defined also Robert Jacobsson for his high attention for this project and his great help and support.We would like to take this opportunity to thank Behzad Movassagh at Volvo Cars Torslanda who made it possible for us to do this project at Volvo Cars Torslanda. His friendly help is highly appreciated. In the end, we would like to thank our family and friends who supported us during the whole education and this thesis. Special thank to our beloved mother whom we have always felt the support from the first day of our existence even though she is not here anymore to see this success. May her soul be in peace forever.

4
Early Definitions CCC: “Change of Consequence Class” aimed to change the consequence classes on screw units. FPS: Ford Production System. MP-area: “Marriage Point”. In this area, the car hangs on a mobile lift. PID: The IT department had a software that been called PID which was capable of series communication. PLC: Programmable Logic Control. PS: “Produktions Styrning” (Production control). PS-VCOM: PC (Personal Computer) is left today and calls under the name PS-VCOM. SBS: In the beginning of 2002, the production technicians brought up a concept in order to make the operations more effective. This project is called SBS (Sekvens Balanserings systems). TBH: A manufacturin line In TC. TC: One factory among other factories in VCT. TCID: Tracking Control and Identification. VCC: Volvo Cars Corporation. VCMS: Volvo Cars Manufacturing System. VCOM: communication software. A digital based network that exchanges information over Ethernet (Volvo internal network). VCT: Volvo Cars Torslanda.

5
Abstract Three different manufacturing lines are chosen to be investigated and different solutions are suggested which are all beneficial for the company. All three lines are considered from the Lean manufacturing point of view. The most common failures in the factory are caused by the system called Poka-Yoke. The three chosen line are being investigated from this aspect of view as well and different solutions are given in this project. The existing systems at these lines are compared to the FPS, which finds its roots back in Lean Production. The FPS is described in this project in a specific chapter. The readers can also find the history behind the FPS and Lean production and the comparison between the FPS and Toyota Production System in this project. The authors have also gone through different construction arrangement by the side of these three lines and have come up with some solutions from the Lean manufacturing point of view in order to make the VCT manufacturing one step closer to the FPS. One can claim that the main goal of this project is to show the connection between the FPS and Volvo manufacturing system and showing the fact that the whole concept behind the FPS is nothing but the Lean Production.

6
Sammanfattning Tre olika produktions linor är valda för att undersökas och olika förslag har givits som är fördelaktiga för företaget. Analysen har använt sig av konceptet Lean produktion. De tre produktions linorna har även analyserats utifrån Poka-Yoke som är den vanligaste fel orsaken i fabriken. Befintliga systm för de tre produktions linorna jämförs mot FPS som härstammar ifrån Lean produktion. Utförligare beskrivning av FPS systemet är tillgänglig i det här projektet. Detaljerad beskrivning och bakgrund gällande FPS och Lean produktion samt jämförelsebmellan FPS och Toyota Produktion system finns att tillgå i projektdokumentationen. Projektet har även analyserat olika material fasader vid sidan om de tre produktion linorna och har delgivit olika lösningsförslag utifrån konceptet Lean produktion som syftar till att ta tillverkaren ett steg närmare mot FPS. Generella projekt målet är att visa på ett samband imellan FPS och Volvo Manufacturing System som visar att konceptet bakom FPS egentligen är Lean produktion.
7
Table of Contents Acknowledgement................................................................................3 Early Definitions ..................................................................................4 Abstract ................................................................................................5 Sammanfattning....................................................................................6 Table of Contents .................................................................................7 1. Introduction ......................................................................................9
1.1 Background................................................................................................... 9 1.2 Problem Formulation.................................................................................... 9 1.3 Aim ............................................................................................................. 10 1.4 Research Issues and Delimitations............................................................. 10
1.4.1 Research Issues......................................................................................................... 10 1.4.2 Delimitation .............................................................................................................. 11
2. Theoretical Frame of Reference .....................................................12 2.1 Overall Quality Theory .............................................................................. 12
2.1.1 Definitions ................................................................................................................ 12 2.1.2 Success and Quality.................................................................................................. 13 2.1.3 Quality and Productivity........................................................................................... 13 2.1.4 Total Quality Management (TQM) .......................................................................... 13
2.2 Human Reliability ...................................................................................... 16 2.2.1 Different Analysis of Human Reliability.................................................................. 16
2.3. Main References of Frame ........................................................................ 18 2.3.1 Lean Production........................................................................................................ 18
2.3.1.1 A Brief History of Lean ............................................................................................................ 18 2.3.1.2 Lean Production Definition ....................................................................................................... 19 2.3.1.3 Principles of Lean...................................................................................................................... 19 2.3.1.4 The 7 Wastes (Harrison & Hoek 2005)..................................................................................... 21 2.3.1.5 Lean Product Design ................................................................................................................. 22 2.3.1.6 Lean Facility Design ................................................................................................................. 23 2.3.1.7 Two Relevant Aspects of Lean ................................................................................................. 23
2.3.2 Ford Production System (FPS) ................................................................................. 23 2.3.2.1 A brief History of FPS .............................................................................................................. 23 2.3.2.2 FPS Definition........................................................................................................................... 25 2.3.2.3 FPS Gearwheel Concept............................................................................................................ 26 2.3.2.4 FPS Vision ................................................................................................................................ 27 2.3.2.5 Key Principles ........................................................................................................................... 27 2.3.2.6 Plant Operation System Implementation................................................................................... 27
3. Method............................................................................................28 3.1 Research Methods ...................................................................................... 28
3.1.1 Research phase ......................................................................................................... 28 3.1.2 Inductive ................................................................................................................... 28 3.1.3 Deductive.................................................................................................................. 29
3.2 Work form and Arrangement ..................................................................... 30 3.2.1 Qualitative and quantitative investigation ................................................................ 30
8
3.3 Reliability ................................................................................................... 31 3.3.1 Validity ..................................................................................................................... 31 3.3.2 Reliability ................................................................................................................. 31
3.4 Information Gathering................................................................................ 32 3.4.1 Primary Data............................................................................................................. 33
3.4.1.1 Interview ................................................................................................................................... 33 3.4.1.2. Meeting .................................................................................................................................... 34
3.5 Method Criticism........................................................................................ 34 3.6 Structure ..................................................................................................... 36
4. Volvo Cars Torslanda/Empiric.......................................................37 4.1 Company Overview.................................................................................... 37
4.1.1 Company philosophy................................................................................................ 37 4.2 Company Background................................................................................ 37
4.2.1 Markets and Sales..................................................................................................... 38 Table 2. Sales in the ten leading markets .................................................................................................. 38 Table 3. Sold cars...................................................................................................................................... 39
4.2.2 Production................................................................................................................. 39 4.2.4 Design....................................................................................................................... 40
The Scandinavian heritage .................................................................................................................... 40 Global design process ........................................................................................................................... 40
4.2.5 Product Development ............................................................................................... 40 4.3 Manufacturing Overview ........................................................................... 41
4.3.1 Identification of Automotive .................................................................................... 42 4.3.1.1 Identity ...................................................................................................................................... 42 4.3.1.2 Labelling ................................................................................................................................... 43 4.3.1.3 Variants ..................................................................................................................................... 43 4.3.1.4 Cameras..................................................................................................................................... 44
4.3.2 Superior Production Governing Systems ................................................................. 44 4.4 Investigation ............................................................................................... 47
4.4.1 Poka-Yoke ................................................................................................................ 48 4.4.1.1 Poka-Yoke Structure ................................................................................................................. 51 4.4.1.2 Cost Example ............................................................................................................................ 53
4.4.2 Lines in Focus (Poka-Yoke point of view)............................................................. 53 4.4.2.1 Door Lines................................................................................................................................. 53 4.4.2.2 Battery Line............................................................................................................................... 57 4.4.2.3 Line 1:07 the Safety Triangle Station........................................................................................ 61
5. Analysis and Discussion.................................................................63 5.1 Lean/FPS Analysis and discussion............................................................. 63
5.1.1 Lean/FPS Aspect on the Door Lines ........................................................................ 63 5.1.2 Lean/FPS Aspect on the Battery Line ...................................................................... 65
5.2 Problem Analysis and Recommendation ................................................... 67 5.2.1 Door Lines ................................................................................................................ 67
5.2.1.1 Problem Analysis ...................................................................................................................... 67 5.2.1.2 Recommendation....................................................................................................................... 68
5.2.2 Battery Line .............................................................................................................. 71 5.2.3 Safety Triangles Line 1:07 ....................................................................................... 73
6. Conclusion......................................................................................75 References ..........................................................................................76
9
1. Introduction
1.1 Background Volvo Cars Torslanda (VCT) applies different quality methods in order to offer the best possible product to the customers. These systems have their own short comings and problems. Since VCT uses the pull system, it is very important to install right component on the right position on the production line. This issue is one of the most critical problems that VCT is facing at the moment. Volvo Cars Corporation (VCC) is bought by Ford Motor Company. Ford is willing to apply a common production system globally in its industry called "Ford Production System" (FPS). VCT is not an exception and has to apply this system as well. FPS is originally drived from "Lean Production". Lean production needs to be implemented completly and it is not possible to achieve the best result by implementing only some part of this system.
1.2 Problem Formulation
- Comparison between the theory and the empery of FPS, Lean production and VCT, - Finding the most critical quality method at VCT considering the failure cost, By:
1. Getting an overall view of VCT and getting familiar with manufacturing 2. Investigation in order to understand and find the VCT quality concept/methods
3. Learning how each method functions 4. Background/source research in order to find the methods whereabouts 5. Scientific quality methods research 6. Comparing the result of the research with how it is applied in VCT 7. Finding the contacting people who are responsible for the application of these
methods 8. The assembly rules investigation 9. Finding the methods used by VCT in order to assemble correct details 10. Finding the most critical quality methods among the found methods ( failure) 11. Investigation in order to find where in the factory this problems pop up 12. Investigation in order to select the most problematic lines 13. Analysis of the problem in different situations 14. Economics analysis ( calculating the failure cost) 15. Analysis of the existing opportunities in order to solve the problems 16. New suggestions in order to solve the problem if the existing methods do not help 17. Economic aspect of the solutions and comparison with the failure cost 18. FPS investigation and implementation consideration
19. Detailed constructional suggestion within the FPS frame

10
1.3 Aim The aim of this project is to investigate the quality methods currently implemented in VCT, also to introduce the most costly method and therefore coming up with a suggestion in order to solve this problem with the least costly method. The aim of this thesis is also to visualize and direct attention to the financial consequences of using poor quality processes and products. The main task is therefore to decide on the content of the proposed model, visualize how poor quality snowballs through the factory and generate approximate figure for the total cost of the poor quality at VCT accordingly. This project is also aiming at taking the Ford Production System (FPS) strategy under consideration since VCT is bought by Ford. Ford is trying to apply a common production method in all its factories and that's why it's very important to understand what FPS is and how it is applied in the factory. It has been also tried to find the connections between Lean production and FPS since a great part of FPS is derived from Lean production system. Considering this connection and based on pure Lean Thinking some effort has been made to come up with useful and practical suggestions in some specific lines of the factory.
1.4 Research Issues and Delimitations
1.4.1 Research Issues 1-Which technical methods/aids are used today in order to facilitate/ensure correct detail on each car model? 2-Which technical methods/aids are used today in order to facilitate/ensure correct assembly? 3- How/where/who decides about introducing of technical aids? 4- How does the preparation happen and specification of function/technology/installation of new aids? 5- How the above aids are used? - Management competence at operators/production management/production technology/maintaining personnel? - Different shifts? 6- How was the management of the education of concerned persons map for the above aid? - Instructions/training/learning correct/standardized method etc.
11
7- How was updating/maintain of the above aid? - Product related changes/urgent and preventive maintain/etc? 8- Which effect gives the aids? - Is the profitable investments or is the technology used in order to the deaf conscience in deficiency on necessary, fundamental management morals? 9- How does the end assembly look like from the above aspect compared with others, especially compared to more successful car manufacturers? 10- FPS, Ford Production systems? - Proposals on measures that would give better results? - For the end assembly general/overall alternative one or more existing assembly situations.
1.4.2 Delimitation The main limitation is the access to external and internal data for implemented quality methods. The thesis is also restricted to use available data in order to show consequences of the already existing quality methods at VCT within the decided time frame. In addition to these limitations, it has in some areas been difficult to gain access to available data bases and/or other information systems. Considering the time/credit frame of this project and after having a meeting with supervisors at VCT and the university, the agreement was to work on specific areas among the aforementioned issues according to 1.4.1. Three different operation lines are chosen, based on the following features:
- Door Line due to the highest failure cost and time - Battery line due to the fact that batteries are among most important and expensive
components of each car - Safety triangle station at the line 1:07 due to the accessibility and the low cost of
implementation of the new suggestion After having an agreement with the supervisor at VCT and other responsible people as well as the supervisor at the university, the following decision was made: The readers can find the answer to questions number 1, 2, 4, 8, 9 and 10 in different chapters of this project. The second part of the question number 5 is about the differences between the three shifts. The investigations and analyses show that there are no differences regarding the efficiency of the shifts, comparing the failure result of the shifts, therefore, no further discussions are made in this project.
12
2. Theoretical Frame of Reference
2.1 Overall Quality Theory Today, quality or lack of quality is the border between death and life for a company. Increased customer demands and globalization makes the quality improvement system of vital importance for companies to survive in the global market. According to Bergman and Klefsjö ( 2001), a hundred unsatisfied customers results in thousand customers which choose another company since one unhappy customer can easily explain his/her experiences for the people he/she knows.
2.1.1 Definitions The quality concept has nowadays several definitions. Edward Deming (1900-1993), one of the peers in quality improvement, has defined quality as follows: “Quality should be aimed at the needs of the customer, present and future.” Deming’s philosophy has pointed his philosophy in 14 items on how the management of each company should act. Another powerful man within the quality area is Genichi Taguchi (1924-). His point of view on quality and quality improvement has aroused huge interest in western countries. Bo Bergman and Bengt Klefsjö write in the book “ Kvalitet från behov till användning”(2001)that Taquchi, along with Deming, Juran and Ishikawa, are among those cornerstones of the Japanese success within quality. This concept points out the success of the Japanese companies during 1970-1980. Japanese realized early that the quality is nothing but the customer’s demands and needs and that the cost of alerts and delays are rather high. By systematically using the statistical methods for identifying and eliminating any kind of waste, the Japanese made a huge success in finding the failure at birth which led to an enormous money saving. Other definitions of quality would be as follows: “Quality is the presence of value defined by customers.” (Federal express) “Quality is when the customers come back and not the product.” (CEO in small companies) Definitions are many but there is one definition that covers all definitions mentioned before and that’s the definition according to Bergman and Kefsjö: Quality on a product is its ability to meet customer’s satisfaction and preferably be beyond the customer’s needs and demands.
13
2.1.2 Success and Quality As mentioned before, quality improvement is about creating an increased customer satisfaction with as low cost as possible. It’s also about decreasing the cost for the resources which are needed for the business to run. This is possible by minimizing the number of failures, lacks and all other relevant issues. An improved quality can effect the company’s reputation in several ways. Below are some positive effects of the increased quality in a company:
• Happy customers that would come back • Shorter lead time • A better position on the market • High productivity • Less sick-leaves Etc.
2.1.3 Quality and Productivity In the book “ Kvalitet från behov till användning”, Bo Bergman and Klefsjö point out the fact that each adjustment or failure leads to a decreased productivity. A reverse proportionality between productivity and quality was believed in the past. People thought that an increased quality would cost the company a lower productivity. That would have been right if the only solution increase the quality was to increase the number of controls on the manufacturing line but now a days the quality activities avoid such solutions. Companies strive after improvements to be created already with the construction and at early stages of the product development and also the production process itself. This would result in both better quality and an improved productivity.
2.1.4 Total Quality Management (TQM) Total quality management is about a continuous striving after fulfilling the customers’ demands, needs and expectations with the lowest cost. It is possible with continuous improvement activities where all employees are engaged and have their focus on the organization’s processes. This subject is also about changes, alerts and improvements and also avoiding the afterwards control. It’s also about supporting the personal improvement of the people who work with the process (Bergman and Klefsjö 2001). In order to make this happen in the reality of each organization, a serious engagement from the management is required. Joseph Juran made the following speech regarding to the importance of quality. “To my knowledge, no company has attained world-class quality without upper management leadership.” Even Bergman and Klefsjö mention that the management should actively take part in the daily improvement process.
14
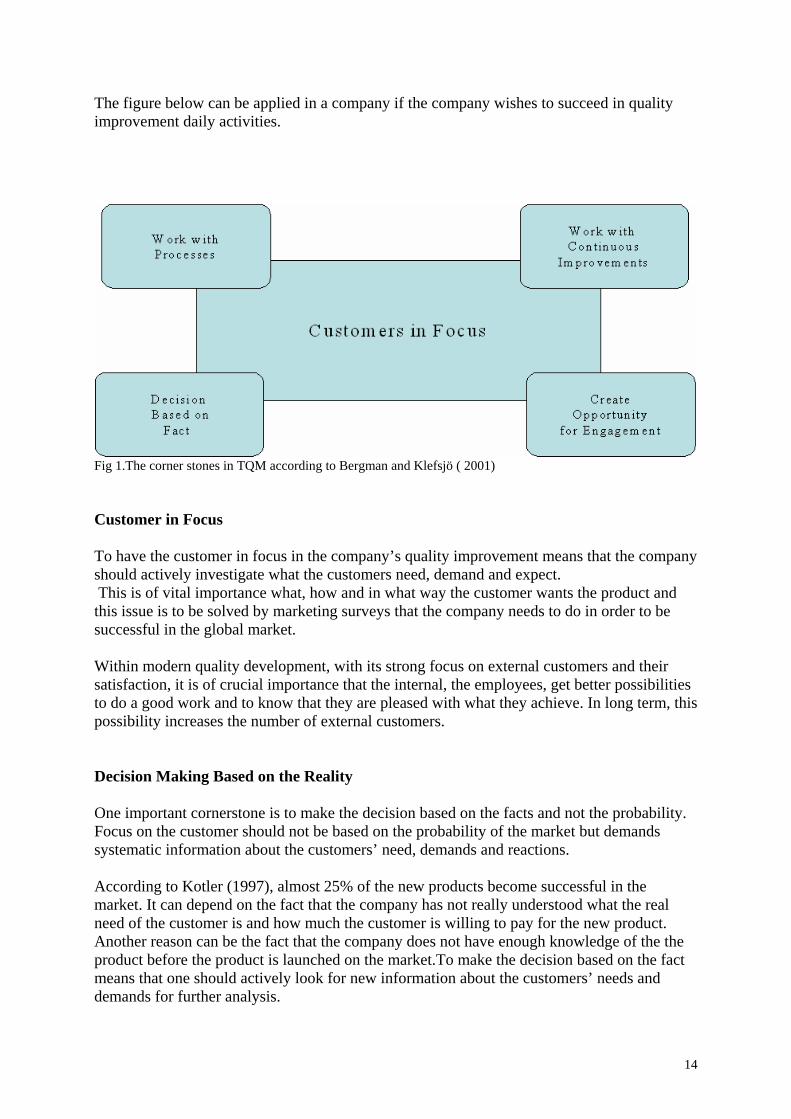
The figure below can be applied in a company if the company wishes to succeed in quality improvement daily activities.
Fig 1.The corner stones in TQM according to Bergman and Klefsjö ( 2001) Customer in Focus To have the customer in focus in the company’s quality improvement means that the company should actively investigate what the customers need, demand and expect. This is of vital importance what, how and in what way the customer wants the product and this issue is to be solved by marketing surveys that the company needs to do in order to be successful in the global market. Within modern quality development, with its strong focus on external customers and their satisfaction, it is of crucial importance that the internal, the employees, get better possibilities to do a good work and to know that they are pleased with what they achieve. In long term, this possibility increases the number of external customers. Decision Making Based on the Reality One important cornerstone is to make the decision based on the facts and not the probability. Focus on the customer should not be based on the probability of the market but demands systematic information about the customers’ need, demands and reactions. According to Kotler (1997), almost 25% of the new products become successful in the market. It can depend on the fact that the company has not really understood what the real need of the customer is and how much the customer is willing to pay for the new product. Another reason can be the fact that the company does not have enough knowledge of the the product before the product is launched on the market.To make the decision based on the fact means that one should actively look for new information about the customers’ needs and demands for further analysis.

15
In order to be able to work effectively within continuous improvement, the company also needs to analyze the verbal information along with opinions and feelings of the customers. Working with the Processes A huge part of each organized activity can be classified as process. In other words, activities that are to be repeated continuously as the time goes by. The main goal of each process is to satisfy it’s customers with a final product/service by using as less resources as possible. There are three different types of processes: the main process, the support process and the management process. The main process’s task is to fulfill the external customers’ needs and demands, to change the raw material into the final product. Product development, production and distribution processes can be mentioned as examples of the main process. The support process’s task is to provide the operative process with the resources. The main goal here is the internal customers. Information process and maintenance process are examples to be mentioned here. The management process’s task is to make decisions about the organization’s goal and strategy and to implement the continuous improvement. This kind of process is also facing the internal customers. Working with Continuous Improvements The quality demands are increasing nowadays which means that the companies need to work with the continuous improvement even more than before. The continuous improvement does not only include the product improvement but also the process improvements as well. One important method here is to use the 6-sigma method which can lead to huge money saving in the companies. This work method uses the statistics which the company gathers in order to make the product and processes even better in the future to come. Bergman and Klefsjlö (2001) write in their book “kvalitet från behov till användning” that there is always a better way to create the new product and also a better way to work wich uses as little resource as possible. This means that there is always a way to increase the quality in the company.
16
2.2 Human Reliability
2.2.1 Different Analysis of Human Reliability There are two different ways to analyze the human reliability. The investigation can be both quantitative and qualitative. Human role in the whole system would be considered at the qualitative analysis and how the system affects the operator in different situations. Different options on how the work operation affects the operator are also considered. (Akersten and Holm 1984) The quantitative analysis is to be done according to a complete model which already exists where the probability of different failures of human being in different situations are estimated. Different Types of Human Behavior There are three different stages of human behavior: Skill-based, rule based and knowledge-based. The skill based behavior is about for example how fast the operator reacts to an alarm. If the failure happens in this case, the problem would be related to the power-, time and place coordination, according to Akersten and Holm (1984). Rule based behavior demands a conscious from the operator based on a written instruction or a memorized procedure. It is not however the question about an automatic document way and the operator does not have to choose between different ways to react to a certain situation. It’s just like the skill-based behavior which is about the familiar situations which the operator might face. The failure happens when the operator misunderstands the situation (a situation according to the written document) The knowledge based behavior happens when the operator is not familiar with the situation. The problem is to be solved based on the operator’s decision which demands knowledge and capability about the physical system and its functions. The decision; as mentioned before; depends on how the operator judges the situation and how capable the operator is while facing the unique situation that might happen at the place.
17
Task Classification Failures can be classified as follows:
• Easy tasks ( e.g. to adjust a screw) • Difficult tasks, ( ex. to make an analysis of a situation after an incident) • Tasks which demand activities, (e.g. attention for an alarm/signal so that the operator
can do his part of the job. Waiting time, signal type, operator’s motion level and the type of the task are expected to affect the failure probability.
• Verifying tasks, the operator must actively choose between different options in order to prevent serious failure further more on the production line.
• Tasks or incidents, this can include all types of human behavior from skill-based to knowledge-based when an accident happens where the operator finds himself in a shock situation.
Classification of Human-based Failure Three different failures can occur as follows:
• Absence activities, The required task is not implemented • Incorrectly implemented activities, the tasks are implemented incorrectly or at the
wrong time. • Non-desirable activity is implemented, the person carries out a document that is
inappropriate.
When analysis of human reliability is done, it is valuable to examine procedures and experiences from the operators and come up with a result by simulations. Reasons for Error Acting The reason behind the malfunction of humans can be divided into different groups as follows:
• Saturation, The person is overloaded with information and does not persuade to take in what is required for a complete analysis.
• Inadequate attention, the person begins to intend on something else and gets stuck in that meaningless thought. The danger lies in the fact that the risk is too high that he misses an important operation on the manufacturing line
• Low reliability, i e the person does not believe in the information he receives. The person assumes for example that a signal is a false signal. This can depend on too much trust on the equipments.
• Stress, the person realizes that the situation is serious, but makes an incorrect decision or takes a late action due to the high pressure.
18
2.3. Main References of Frame Two main references have been chosen for this project; Lean Production and Ford Production System (FPS). The reason to choose Lean production and FPS is the fact that Volvo Cars Corporation is bought by Ford. Ford is trying to implement a common system in all its factories all around the world called FPS. FPS is originally derived from Lean production and that is the reason to decide to elaborate these two methods as the main frames of the reference.
2.3.1 Lean Production
2.3.1.1 A Brief History of Lean
Although there are instances of rigorous process thinking in manufacturing all the way back to the Arsenal in Venice in the 1450s, the first person to truly integrate an entire production process was Henry Ford. At Highland Park, MI, in 1913 he married consistently interchangeable parts with standard work and moving conveyance to create what he called flow production. The public grasped this in the dramatic form of the moving assembly line, but from the standpoint of the manufacturing engineer, the breakthroughs actually went much further.
Ford lined up fabrication steps in process sequence wherever possible using special-purpose machines and go/no-go gauges to fabricate and assemble the components going into the vehicle within a few minutes, and deliver perfectly fitting components directly to line-side. This was a truly revolutionary break from the shop practices of the American System that consisted of general-purpose machines grouped by process, which made parts that eventually found their way into finished products after a good bit of tinkering (fitting) in subassembly and final assembly.
When the world wanted variety, including model cycles shorter than the 19 years for the Model T, Ford seemed to lose his way. Other automakers responded to the need for many models, each with many options, but with production systems whose design and fabrication steps regressed toward process areas with much longer throughput times. Over time they populated their fabrication shops with larger and larger machines that ran faster and faster, apparently lowering costs per process step, but continually increasing throughput times and inventories except in the rare case—like engine machining lines—where all of the process steps could be linked and automated. Even worse, the time lags between process steps and the complex part routings required ever more sophisticated information management systems culminating in computerized Materials Requirements Planning (MRP) systems.
As Kiichiro Toyoda, Taiichi Ohno, and others at Toyota looked at this situation in the 1930s, and more intensely just after World War II, it occurred to them that a series of simple innovations might make it more possible to provide both continuity in process flow and a wide variety in product offerings. They therefore revisited Ford’s original thinking, and invented the Toyota Production System.
19
This system in essence shifted the focus of the manufacturing engineer from individual machines and their utilization, to the flow of the product through the total process. Toyota concluded that by right-sizing machines for the actual volume needed, introducing self-monitoring machines to ensure quality, lining the machines up in process sequence, pioneering quick setups so each machine could make small volumes of many part numbers, and having each process step notify the previous step of its current needs for materials, it would be possible to obtain low cost, high variety, high quality, and very rapid throughput times to respond to changing customer desires. In addition, information management could be made much simpler and more accurate.
2.3.1.2 Lean Production Definition Lean production is an assembly-line manufacturing methodology developed originally for Toyota and the manufacture of automobiles. It is also known as the Toyota Production System. The goal of lean production is described as "to get the right things to the right place at the right time, the first time, while minimizing waste and being open to change". Engineer Ohno, who is credited with developing the principles of lean production, discovered that in addition to eliminating waste, his methodology led to improved product flow and better quality.
Instead of devoting resources to planning what would be required for future manufacturing, Toyota focused on reducing system response time so that the production system was capable of immediately changing and adapting to market demands. In effect, their automobiles became made-to-order. The principles of lean production enabled the company to deliver on demand, minimize inventory, maximize the use of multi-skilled employees, flatten the management structure, and focus resources where they were needed.
2.3.1.3 Principles of Lean (James P. Womack and Daniel T. Jones, 1996)
Specify Value
The critical starting point for lean thinking is value. Value can only be defined by the ultimate customer. And it's only meaningful when expressed in terms of a specific product (a good or a service, and often both at once), which meets the customer's needs at a specific price at a specific time.
Above all, lean practitioners must be relentlessly focused on the customer when specifying and creating value. Neither shareholder needs, nor senior management¹s financial mind-set, nor political exigencies, nor any other consideration should distract from this critical first step in lean thinking.

20
Identify the Value Stream The value stream is the set of all the specific actions required to bring a specific product through the critical management tasks of any business: the problem-solving task running from concept through detailed design and engineering to production launch, the information management task running from order-taking through detailed scheduling to delivery, and the physical transformation task proceeding from raw materials to a finished product in the hands of the customer. Identifying the entire value stream for each product is the next step in lean thinking, a step which firms have rarely attempted but which almost always exposes enormous, indeed staggering, amounts of waste. Flow Only after specifying value and mapping the stream can Lean thinkers implement the third principle of making the remaining, value-creating steps flow. Such a shift often requires a fundamental shift in thinking for everyone involved, as functions and departments that once served as the categories for organizing work must give way to specific products; and a "batch and queue" production mentality must get used to small lots produced in continuous flow. Interesting, "flow" production was an even more valuable innovation of Henry Ford¹s than his better-known "mass" production model. Customer Pull As a result of the first three principles, Lean enterprises can now make a revolutionary shift: instead of scheduling production to operate by a sales forecast, they can now simply make what the customer tells them to make. You can let the customer pull the product from you as needed rather than pushing products, often unwanted, onto the customer. In other words, no one upstream function or department should produce a good or service until the customer downstream asks for it. Pursue Perfection The Lean process never ends since each company needs to strive after perfection all the time in order to meet (or meet beyond) customers demands. This issue is to be solved by working with continuous improvement on it’s highest level on each process of the manufacturing line.
21
2.3.1.4 The 7 Wastes (Harrison & Hoek 2005) There are seven different type of waste while talking about the concept Lean manufacturing
• The waste of overproduction: Making, delivering too much, too early, or “just in case”. Instead, the aim should me to make “just in time”-neither too early nor too late. Overproduction creates unevenness or lumpiness of material flow, which is bad for quality and productivity. It is often the biggest source of waste.
• The waste of waiting: Takes place whenever time is not being used effectively. It
shows up as waiting by operators, by parts or by customers
• The waste of transporting: moving parts around from one process to the next adds no value. Double handling, conveyors and movements by fork-lift truck are all examples of this waste. Placing processes as close as possible to each other only minimizes the waste of transport but also improves communication between them.
• The waste of inappropriate processing: using a large process that is shared between
several lines is an example of this type of waste. Another example is a process that is incapable of meeting quality standards demanded by the customer-so it cannot help making defects.
• The waste of unnecessary inventory: inventory is a sign that the flow has been
disrupted, and that there are inherent problems in the process.
• The waste of unnecessary motions: if operators have to bend, stretch or extend themselves unduly, then these are unnecessary motions. Other examples are walking between processes, taking a stores requisition for signature, and decanting parts from one container into another.
• The waste of defect: producing defects costs time and money. The longer a defect
remains undetected, the more cost is added. Defects are counteracted by the concept of “quality at source” and “prevention, not detection”.
Lean thinking invites us to analyze business processes systematically to establish the baseline of value-adding processes and to identify the incidence of these seven wastes. The aim is to get parts and data to flow through business processes evenly and in harmony. The more detailed analysis prompted by the concept of seven wastes encourages a greater analysis and understanding of processes and their relationship than is made by supply chain mapping. This analysis should first start with key business processes such as problem mapping. Role of Lean practices: Lean thinking is associated with a number of operational practices that help to deliver the aim of waste minimization. Two of the most significant are:
• Small-batch production; • Rapid changeover

22
These two practices are closely associated with each other, but are considered separately here to aid clarity. The target in small-batch production is a batch size of one. The traditional logic behind large batches is to take advantage of reduced costs through economies of scale (the more you produce the less would be the cost of production). This approach is often flawed, as batch size decision generally consider only production cots, and overlook the cots of inventory and lack of flexibility that is caused by large batches. Lack of flexibility is a major contributor to poor quality of service to the end-customer. The rationale behind small batches is that they can reduce total cost across a supply chain, such as removing the waste of overproduction; they help to deliver products that the end-customer wants within the expected lead time. The contribution of rapid changeover was graphically shown by the changeover of press used to make car body panels. These cumbersome pieces of equipment wan weight up to 10 tones, and historically took up to eight hours to change within the large press. The consequence of these long changeover times was that the component production runs were long, often going on for days before the press tools were changed so that another component could be made. Extensive work, again led by Toyota, was undertaken on press design, tooling design and component design over a number of years to help to reduce changeover time. The effect has been to reduce changeover times for tools for large pressed parts around five minutes. Consequently, practices that reduce changeover times are often known as single minute exchange of dies (SMED) (Shingo, 1988). The ability to undertake rapid changeovers allows a batch of each different body panel to be produced each day in line with current demand instead of having to produce to forecast. The lesson form the automotive industry is that even very large pieces of equipment can be developed to allow rapid changeovers. This effort may take a number of years, and is reliant upon developments in machinery and product design, but it can be done. The effect is to provide the flexibility to make possible small-batch production that responds to customer needs. Small-batch production associate with rapid changeover allows productivity to be maintained by taking advantages of economies of scope. Instead of economies of scale, where quantities of the same thing are made, economies of scope lower costs when quantities of similar things that use the same production resources are made.
2.3.1.5 Lean Product Design Products can be designed with a number of lean attributes. These include (Harrison & Hoek, 2005):
• A reduction in the number of parts they contain and materials from which they are made;
• Features that aid assembly, such as asymmetrical parts that can be assembled in only one way;
• Redundant features on common, core parts that allow variety to be achieved without complexity with the addition of peripheral parts;
• Modular design that allow parts to be upgraded over the product life.

23
2.3.1.6 Lean Facility Design The facility within which new products are developed and existing ones are made and delivered should be designed with lean attribute. Among those are (Harrison & Hoek, 2005):
• Modular design of equipment to allow prompt repair and maintenance; • Modular design of layout to allow teams to be brought together with all the facilities
they need, with the minimum of disruption, and then subsequently to be dispersed and reassembled elsewhere;
• Small machines, ideally portable, which can be moved to match the demand for them; • Open system architecture (both IT and physical ones) that allow equipment to fit
together and work when it is moved and connected to other items.
2.3.1.7 Two Relevant Aspects of Lean
1- Just-In-Time • Don't produce something unless the customer has ordered it. • Level demand so that work may proceed smoothly throughout the plant. • Link all processes to customer demand through simple visual tools (called kanban). • Maximize the flexibility of people and machinery
2- Jidoka
The Japanese word ji-do-ka comprises three Chinese characters. The first, ji refers to the worker herself. If she feels "something is wrong" or "I am creating a defect" she must stop the line. Do refers to motion or work, and ka to the suffix "-action." Taken together Jidoka has been defined by Toyota as "automation with a human mind" and implies intelligent workers and machines identifying errors and taking quick countermeasures.
2.3.2 Ford Production System (FPS)
2.3.2.1 A brief History of FPS “Produce high quality at low cost” This was achieved through “Economies of Scale”. This is, we have a plant and a few machines so the more units we can produce with them the lower will be the cost per unit. “Economies of Scale” means producing more and faster is better. Henry Ford concentrated on one simple vehicle the Model T, a “car for the great multitude.”
24
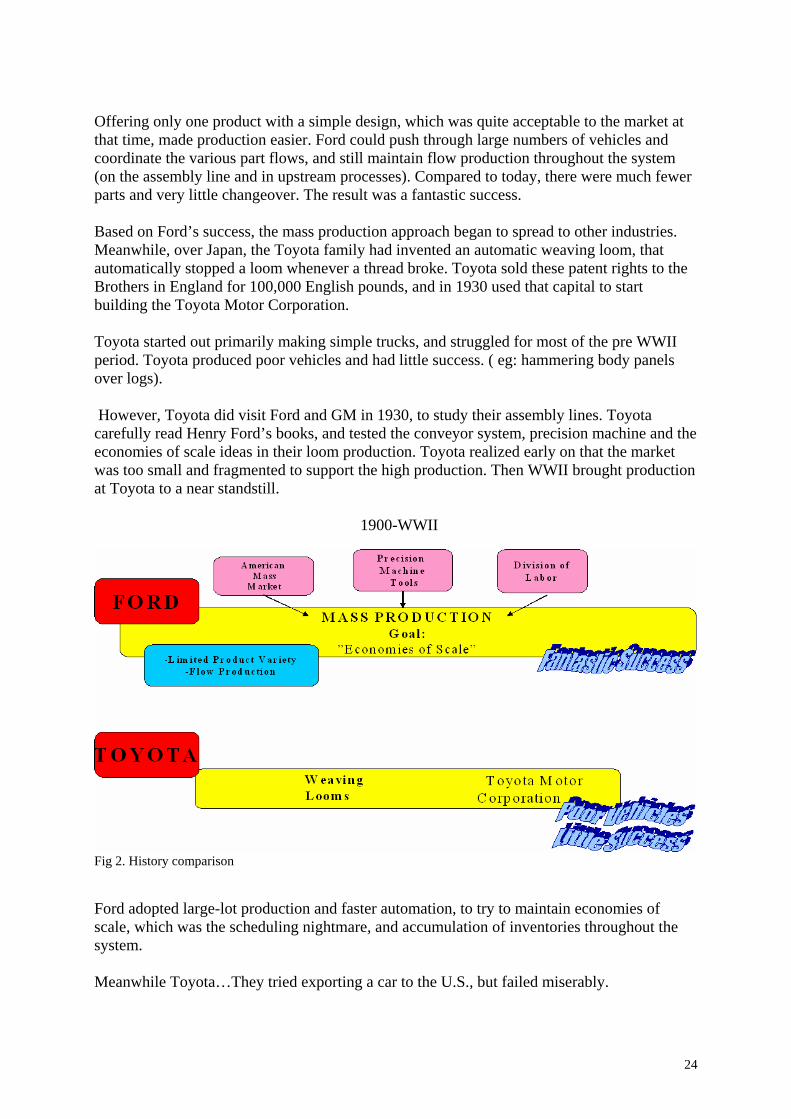
Offering only one product with a simple design, which was quite acceptable to the market at that time, made production easier. Ford could push through large numbers of vehicles and coordinate the various part flows, and still maintain flow production throughout the system (on the assembly line and in upstream processes). Compared to today, there were much fewer parts and very little changeover. The result was a fantastic success. Based on Ford’s success, the mass production approach began to spread to other industries. Meanwhile, over Japan, the Toyota family had invented an automatic weaving loom, that automatically stopped a loom whenever a thread broke. Toyota sold these patent rights to the Brothers in England for 100,000 English pounds, and in 1930 used that capital to start building the Toyota Motor Corporation. Toyota started out primarily making simple trucks, and struggled for most of the pre WWII period. Toyota produced poor vehicles and had little success. ( eg: hammering body panels over logs). However, Toyota did visit Ford and GM in 1930, to study their assembly lines. Toyota carefully read Henry Ford’s books, and tested the conveyor system, precision machine and the economies of scale ideas in their loom production. Toyota realized early on that the market was too small and fragmented to support the high production. Then WWII brought production at Toyota to a near standstill. 1900-WWII
Fig 2. History comparison Ford adopted large-lot production and faster automation, to try to maintain economies of scale, which was the scheduling nightmare, and accumulation of inventories throughout the system. Meanwhile Toyota…They tried exporting a car to the U.S., but failed miserably.
25
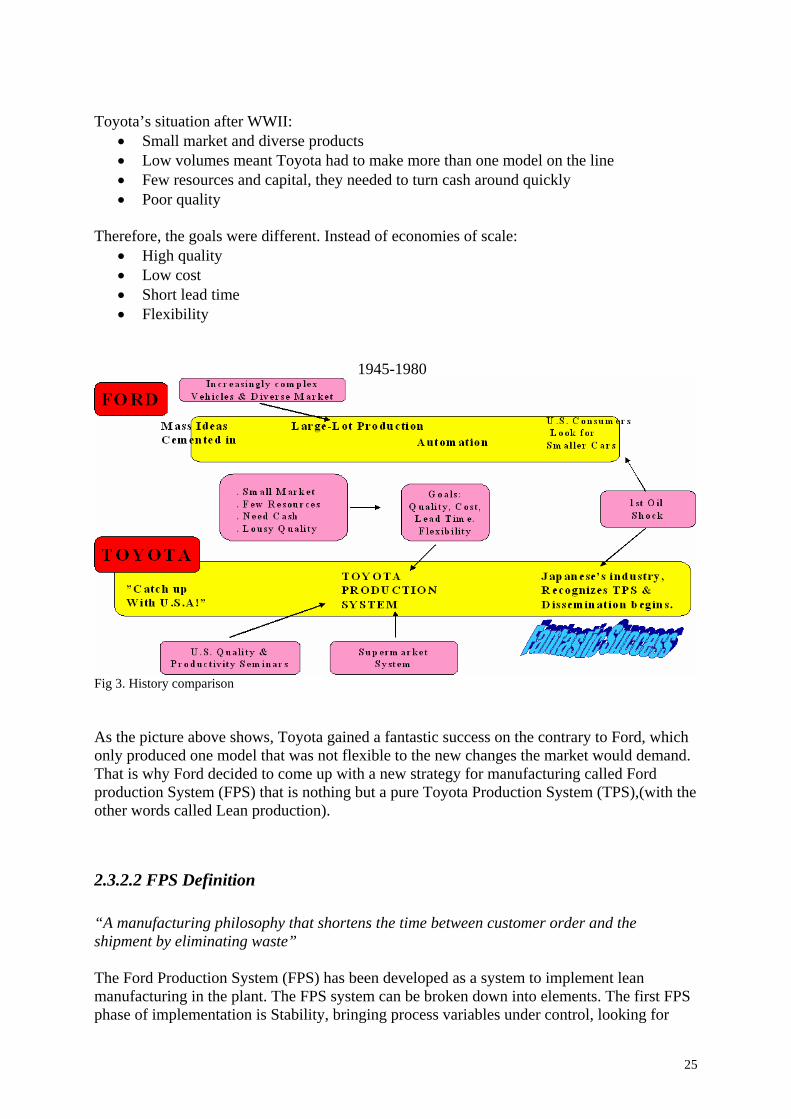
Toyota’s situation after WWII:
• Small market and diverse products • Low volumes meant Toyota had to make more than one model on the line • Few resources and capital, they needed to turn cash around quickly • Poor quality
Therefore, the goals were different. Instead of economies of scale:
• High quality • Low cost • Short lead time • Flexibility
1945-1980
Fig 3. History comparison As the picture above shows, Toyota gained a fantastic success on the contrary to Ford, which only produced one model that was not flexible to the new changes the market would demand. That is why Ford decided to come up with a new strategy for manufacturing called Ford production System (FPS) that is nothing but a pure Toyota Production System (TPS),(with the other words called Lean production).
2.3.2.2 FPS Definition “A manufacturing philosophy that shortens the time between customer order and the shipment by eliminating waste” The Ford Production System (FPS) has been developed as a system to implement lean manufacturing in the plant. The FPS system can be broken down into elements. The first FPS phase of implementation is Stability, bringing process variables under control, looking for
26
ways to make processes more robust, eliminate waste such as scrap, repairs and machne down times.
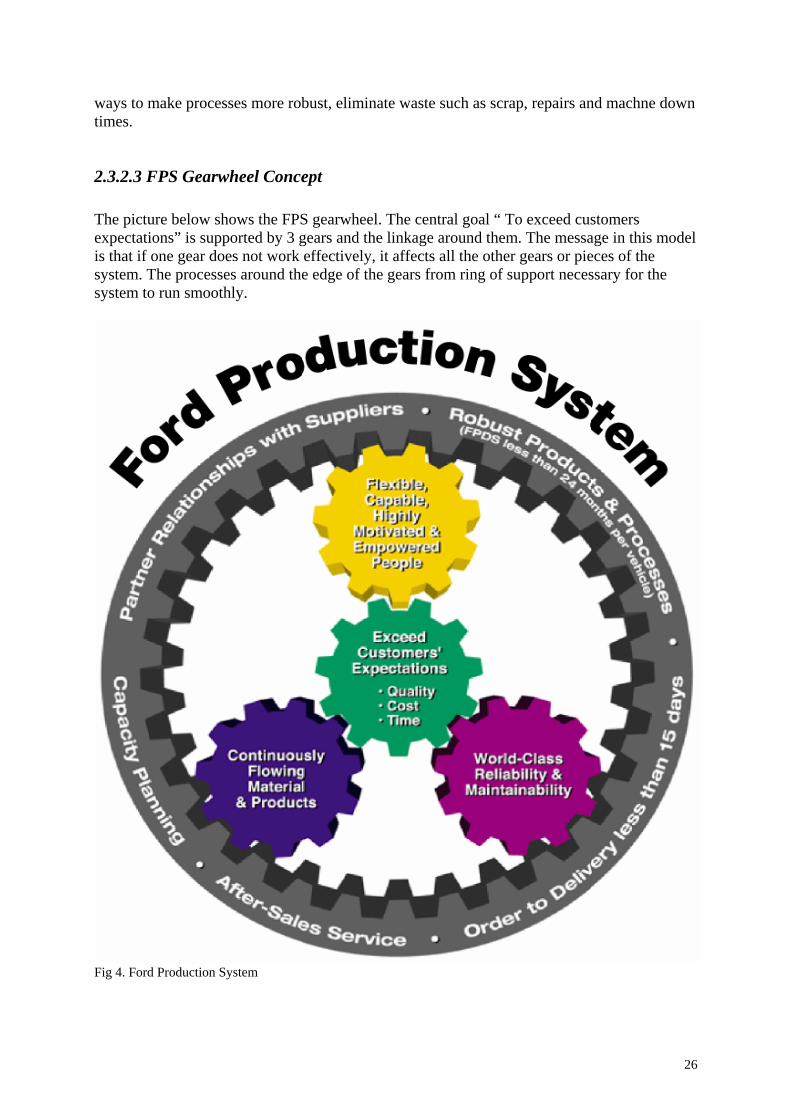
2.3.2.3 FPS Gearwheel Concept The picture below shows the FPS gearwheel. The central goal “ To exceed customers expectations” is supported by 3 gears and the linkage around them. The message in this model is that if one gear does not work effectively, it affects all the other gears or pieces of the system. The processes around the edge of the gears from ring of support necessary for the system to run smoothly.
Fig 4. Ford Production System

27
2.3.2.4 FPS Vision A lean, flexible and disciplined common production system defined by a set of principles and processes that employs group’s of capable and empowered people learning and working safely together in the production and delivery of products that consistently exceeds customer expectation in quality, cost, and time.
2.3.2.5 Key Principles
• Effective work groups • Zero Waste / Zero Defects • Aligned capacity with demand • Optimize Production throughput • Using total cost to drive Performance
2.3.2.6 Plant Operation System Implementation The part of FPS that includes what plants to do is called the Plant Operating System (POS) based on the elimination of waste and responds to the needs of customers both internally externally.
Fig 5. Plant Operation System of FPS
Stability
Continuous Flow
Sychronous Production
Pull System
Level Production

28
Stability: Stable workstations capable of consistent production. Continuous flow: Products flow from station to station continuously, maximizing flexibility Synchronous production: consistent and stable workstations operating in synchronous time Pull system: Stable workstations pulling materials from predecessors to replace the part just consumed Level production: Customers orders produced in level volume and mix. 3. Method This chapter intends to give a picture of the method’s basic outlook discussed in the project. Furthermore, the chapter's function is to give the reader an insight into those conditions and assumptions, which are as cornerstones for the results that are presented. This chapter will stand as a guarantee for a scientific basis requirement. Anyone who repeats the study will come to the same result.
3.1 Research Methods The work is characterized by the author's position on the problem. How the authors see the matter of quality has its origin back in the literature studies and in interviews and meetings during the work.
3.1.1 Research phase A researcher can approach a study item in different ways, in the form of induction or deduction. A researcher can seldom disregard the fact that the author can affect the results. The researcher's understanding, as been added through own experiences or through the literature that describes second experience, comes more or less to influence those interpretations and choices that the researcher come to do. This position is called hermeneutic ( Johansson-Lindfors, 1993) This work commutes theory and empiric in order to improve the knowledge, which is applied in the project, which means that one hermeneutist approach will be used in the report.
3.1.2 Inductive Induction means that the researcher goes from the general to the specific. Thus, conclusions are formulated from experiences. Induction requires often ability to express itself in figures; i. e. used measurements and quantitative methods (Bengtsson&Bengtsson, 1995). The matter is tackled without any hypothesis and with an unclear issue. This happens in to get a comprehensive picture of the matter.

29
Fig 6.The inductive phase
3.1.3 Deductive Deduction means to go “proving road” that is based on the basis of general principles and theories to draw conclusions of each individual phenomena (Patel&Davidsson, 1994). Without doing pretensions in the result part to present general conclusions, it is characterized as an inductive attack ways. It means that the researcher approaches from available literature within the current problem area and derives thereby new consequence kits about specific phenomena. One hypothesis examination can then happen throughout the empirical studies.
30
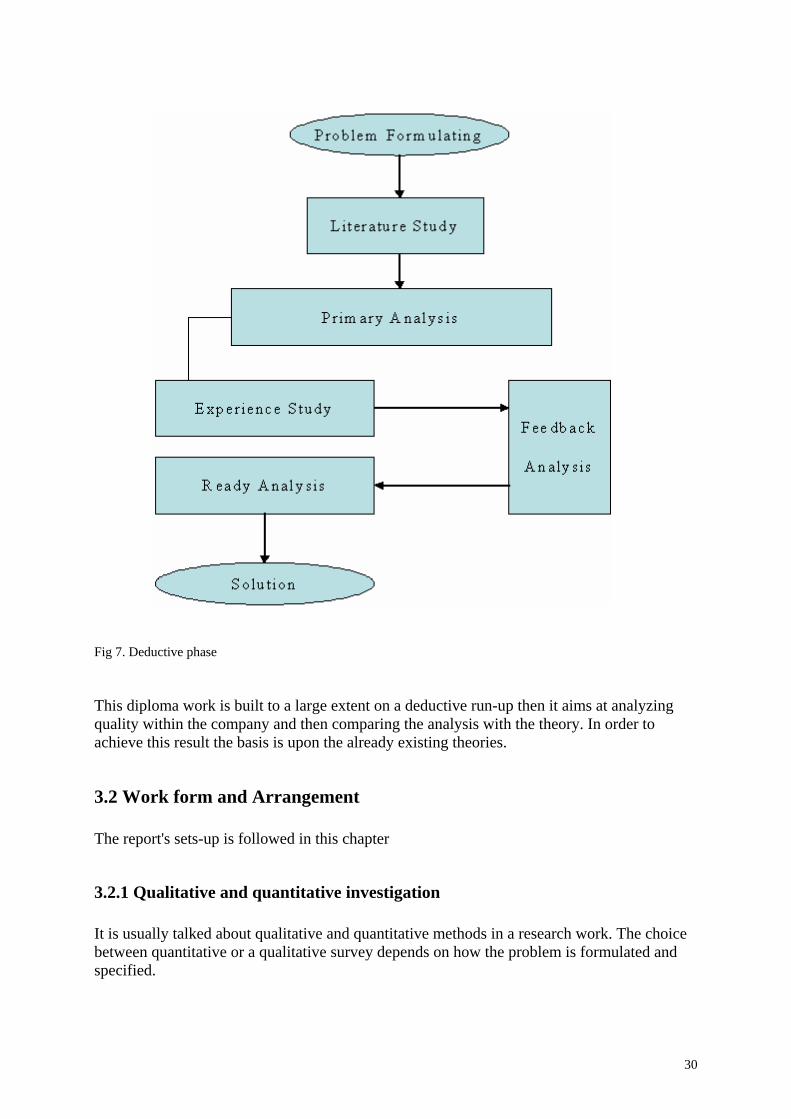
Fig 7. Deductive phase This diploma work is built to a large extent on a deductive run-up then it aims at analyzing quality within the company and then comparing the analysis with the theory. In order to achieve this result the basis is upon the already existing theories.
3.2 Work form and Arrangement The report's sets-up is followed in this chapter
3.2.1 Qualitative and quantitative investigation It is usually talked about qualitative and quantitative methods in a research work. The choice between quantitative or a qualitative survey depends on how the problem is formulated and specified.

31
A qualitative study focuses on a few study items and is based on non-quantified data like attitudes and values. The focus would be on various ways to collect information in order to get a deeper understanding of the study items. Qualitative surveys are built on interviews and observations where a phenomenon is being investigated deeply. Quantitative study is based on information gathering from a large number of study items that can be quantified. The quantitative surveys require the concepts that can be made measurable and that general conclusions can be drawn on the basis of these. This gives a general validity in research, but the deep understanding which can be approached by the qualitative method can be lost (Holm&Solvang, 1991) In the same way as qualitative methods, quantitative methods are also built on conditions that concerns knowledge. Therefore it is important to clarify what these conditions mean (Holm & Slovang, 1991) In this diploma work both quantitative and qualitative surveys were carried out.
3.3 Reliability
3.3.1 Validity The concept validity is used in order to describe whether the selected measurement method actually functions as been intended. In connection with smaller projects that does not act on testing or to measure something on a strict way, it is seldom necessary to deepen the discussion in the technical aspect of validity (Bell, 1995) In order to achieve high validity in this work, interview questions are formulated so that they are in agreement with the survey's aim and what is intended to be measured is measured and nothing more.
3.3.2 Reliability Reliability states how effective measurement method withstands the hazard's effect. Low reliability of interviews and questionnaires can for example depend on: - Personal status (health, fatigue, motivation and stress) - comfort factors (environment and in cash with interviewer) - Formulation factors (variation of interviews) A good way to reach high reliability is to use clear questions. Let a person who is interviewed take enough time. Interview in an environment where the interviewed person finds it comfortable. Do not the interview in groups so that the presentation anxiety can arise. Reliability is very easier to theoretically establish than validity which can be calculated or to be established with the aid of probability basing reasons (Bell, 1995)

32
It is not possible to avoid errors while gathering information in a process. Such errors can arise in connection with many different factors that exist with each process. The picture below shows some stages that can give low reliability (Holm & Solvang, 1994) Fig 8. Reliability point of view (Holme & Solvang 1994) High reliability on work has been received through having understandable questions and personal review of the questions. All interviews have been carried out by the authors.
3.4 Information Gathering In checking how the information is gathered the concepts primary - and secondary data are used. While gathering primary data, new data, and different techniques such as deliberations and interviews are used. Secondary data is the data that come from literature studies, magazines and information search on internet.

33
3.4.1 Primary Data Gathering of primary data can be divided into three classes; observations, opinion investigation and interviews (Dahström, 1996). The first and last classes are of interests for this diploma work. What question formulating to chose depends on which area is to be intended. For a statistic survey the questions should be standardized and formulated so that only few alternatives are left to reply. Qualitative surveys can be more appropriate with open questions with free scope for spontaneous consequence questions. One respondent can in this case moreover be submitted with larger scope for own interpretation of questions. Interviews at VCT and with persons linked to quality cooperation have happened continuously with relevant key persons. Interviews and questions have occurred with reflections around problems and actual information gathering. Questions have been typed down and been organized in this project or via telephone/mail.
3.4.1.1 Interview An interview situation in general means a communication between three types of operators: Interviewer, respondent (interview items) and possible spectators. One research interview lacks spectators. Research interviews can be carried out in several ways. An interview can be categorized with the aid of the following two dimensions, structural and standardization (Andersson, 1994) Structuring
+ -
+ Standardizing
- Table 1. Structuring-Standardizing Relation An introduction in the two dimensions of standardization and structure gives four possible interview types (see character 4). An interview of;
1 2
3 4

34
Type 1 is common within scientific research and can be compared to a person-to-person questionnaire that aims at giving replies on some specific cases. Type 2 is used when the interview items' knowledge is varying within the suitable area. This method opens opportunities for interesting and unexpected information to turn up, what possibly difficult to anticipate by more governed questions. Type 3 is called also for focal point interview, through changing on question wording and question order a problem can be approached from different directions. This type is common at market surveys. Type 4 is used often when the interview aims at getting fundamental information about an area, i. e. at preliminary research studies. Usually, interviews happen only “one and one”, a variant is group interviews, or group discussions. These usually consist of 8-10 persons and a tutor or interview leader. Surveys show that a group interview of two hours disclose as equal majority requirements and needs as two one-man interviews each about an hour (Ulrich&Eppinger, 1995)
3.4.1.2. Meeting After having different related people interviewed, it was found who to choose in order to arrange different meetings to get some feedback to approach one step closer to the aim of this project. Each part of this project needed different people at different meetings. Each meeting was aimed at discussing a logical process behind the physical process running in the company. Logical processes are drawn after having interviews and these logical processes were discussed on each meeting with the responsible people of each division.
3.5 Method Criticism On the road from wording of aim and problems to conclusions and results being presented, many different stages in a survey would be passed. In all of these stages during the work process, the risk that errors arise exists. It is possible to divide following types of errors, which arise during each project. (Lekvall&Walbin, 1993) - Wrong aim; if the aim with the survey is incorrectly formulated, this can lead to the fact that the entire study becomes misleading. Apart from the aid of this effort, it is tried to avoid this through having a continuous dialogue with the company that that has defined this work. Because of these experiences it is estimated that the risk of this type to arise very little. -Wrong direction and contents; these errors can arise when one fails with specifying the survey information on a correct way. Another reason for these errors can also be the fact that

35
one does not consider the time factor when formulating the delimitations which for example can lead to the fact that one disregards from questions that are relevant for the aim. - Inference error; Inference errors can arise when one tries to generalize and draw conclusions from a chosen objective population. This can for example be a consequence of an incorrect selection procedure from the author's side. The authors have presented this matter in the method chapter, so it’s up to the reader to assess these. This work is, as mentioned before, both a qualitative and quantitative work. - Measuring errors; these errors arise when the applied measurement procedure does not give the correct result; i. e. the measurement method affects the result. Consequently, received measurement values can differ from the real values. This can depend on that the interview persons do not want to or can not reply honestly, or because of that, the interview arena influences him/her with a certain direction for example through the appearance or through the way the questions are set. All interviews in this project has aimed at lifting the level of validity and therefore to be used as a basis for further researches and results. If the person who interviews considers the interview item errors, it results in the so called interviewer effect. The interviewer must intend in formulating the sensitive and conductive questions clearly otherwise, the questions can be interpreted in a different/wrong way (Instrument error). Instrument error has, as long as possible, been tried to avoid using branches own terminology. Furthermore, interview questions have in several cases been given repeatedly, but with different wording and at different occasions, to same respondent. All interviews are implemented in closed locals. The positive effect of this is partly that the interviewee would have courage to speak freely without becoming disturbed by other colleagues, partly means the safety since the interviewee find him/herself in his/her normal environment. Although sensible parts of the interviews have been both under structure and standardized all interviewees may say their opinion relatively free around selected matters. It can mean that sensible risk exists for the interview to be directed totally different from the way it was meant to. -Processing error; arises when the researcher processes computer material in such a way that wrong conclusions would be drawn. This work builds above all on interpretation of qualitative data which means that the risk for the data to be miss-leaded is too low.
36
3.6 Structure So much has been written about quality and quality improvement methods during the recent years. Many concepts have been discussed to elaborate this matter. Different quality methods and different models that can affect the quality has been described in the theoretical frame of reference.It is important to discuss theories around quality in order to be able to achieve a clear picture of the matter and to link the theory to the empiric. General theories and partly theories around the quality concept are being discussed in the work. The first step in this project is to find the problem and then a discussion about the problems will follow in order to approach the aim at this project. When the aim is being clarified, the material/information gathering begins. The hardest issue in this project was to find the factors which are of importance in the analysis of the concept quality. Through a careful study of the theory and the study about the connection between the different factors, a systematic analysis can be worked forward. Each area will be treated individually in order to be linked together to a general analysis of quality in the end. An important stage is when current factors will be set in correct proportion to each other. In order to give the work a scientific basis and in order to take part in the culture of the company which is available within the subject quality, a deep literature study has been done during this project work. The literature study has also functioned as basis in order to plan and to implement the work's interviews, with the intention to easily organize relevant and interesting questions for the interviewees. The result of the empiric, including interviews and visits, lies as a basis for the continued work within the clarified area.This project finishes with implementation recommendations, which are based on both the empiric and the theory parts.

37
4. Volvo Cars Torslanda/Empiric In this chapter, it is tried to explain the reality of the factory and the problem which exists at the moment regarding the quality aspect in this chapter.
4.1 Company Overview Volvo Cars Corporation (VCC) is a global company that manufactures all types of Volvo branded cars. Volvo Cars Torslanda in Gothenburg includes different factories. One of these factories is called TC which manufactures the following cars: • S80 • V70 • XC70 • XC90
4.1.1 Company philosophy Vision: ”To be the world’s most desired and successful premium car brand” Mission: ”To create the safest and most exciting car experience for modern families”
4.2 Company Background
VCC was bought by Ford Motor Company in 1999 and is a part of Premier Automotive Group, together with Land Rover, Jaguar and Aston Martin. Volvo Cars Company (VCC) develops and manufactures motor vehicles. Its subsidiary, Volvo cars Torslanda (VCT) in Gothenburg, Sweden, manufactures almost 38% of VCC’s annual car production.
VCT is divided into three production areas: the body shop, painting and final assembly. It also includes a service unit, Special Vehicle & Services (SVS), and support functions that are responsible for quality, logistics, economy, personnel, technique, operating security and information.
VCT has around 5,520 employees of whom 74% are men and 26% are women. The average age of production employees is 38 years. The age distribution of production workers is as follows:
• 17.5% are over 50 years; • 19.3% are 40–49 years; • 32.9% are 30–39 years; • 30.3% are 29 years or younger.
38
Because VCT wants to employ all age groups, it has a comprehensive employee program that includes measures in the fields of flexible work, ergonomics, health and well-being, and skills development. The company has a specific policy to take care of older employees who are not able to cope with the difficult production work.
Around 8,000 production employees are affiliated with a trade union. There is considerable agreement between the company and the trade union regarding work issues and policies. The name Volvo is Latin and it means 'I roll'. Before it adorned the first Volvo car - the ÖV4 - in 14 April 1927, it was used as a brand name for ball bearings. The symbol for Volvo's cars is the sign for iron – a circle with a diagonal arrow. The idea was to associate with Swedish steel, renowned for its durability. Since then, the iron symbol has been synonymous with Volvo throughout the world. For Volvo, the modernized logotype also represents the company's undertakings in the fields of safety, quality and design. As of 2006, the iron symbol is the shared symbol of both Volvo Cars and its former owner, AB Volvo.
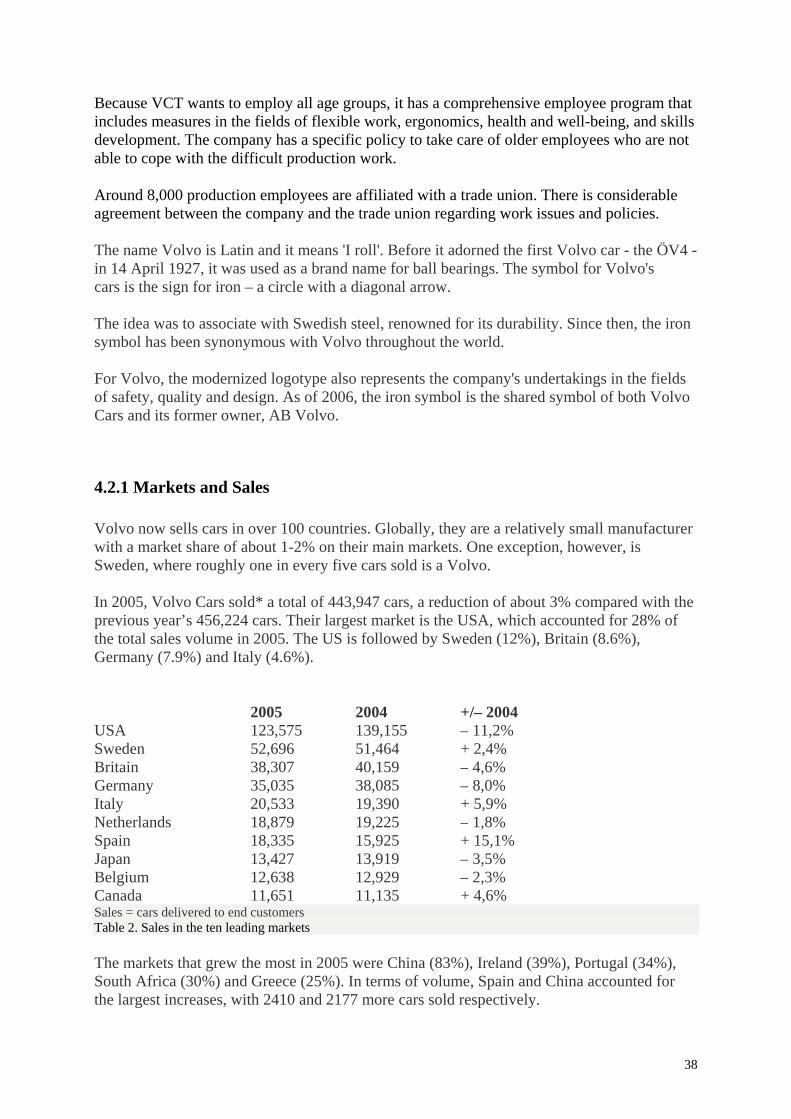
4.2.1 Markets and Sales Volvo now sells cars in over 100 countries. Globally, they are a relatively small manufacturer with a market share of about 1-2% on their main markets. One exception, however, is Sweden, where roughly one in every five cars sold is a Volvo. In 2005, Volvo Cars sold* a total of 443,947 cars, a reduction of about 3% compared with the previous year’s 456,224 cars. Their largest market is the USA, which accounted for 28% of the total sales volume in 2005. The US is followed by Sweden (12%), Britain (8.6%), Germany (7.9%) and Italy (4.6%). 2005 2004 +/– 2004 USA 123,575 139,155 – 11,2% Sweden 52,696 51,464 + 2,4% Britain 38,307 40,159 – 4,6% Germany 35,035 38,085 – 8,0% Italy 20,533 19,390 + 5,9% Netherlands 18,879 19,225 – 1,8% Spain 18,335 15,925 + 15,1% Japan 13,427 13,919 – 3,5% Belgium 12,638 12,929 – 2,3% Canada 11,651 11,135 + 4,6% Sales = cars delivered to end customers Table 2. Sales in the ten leading markets The markets that grew the most in 2005 were China (83%), Ireland (39%), Portugal (34%), South Africa (30%) and Greece (25%). In terms of volume, Spain and China accounted for the largest increases, with 2410 and 2177 more cars sold respectively.
39
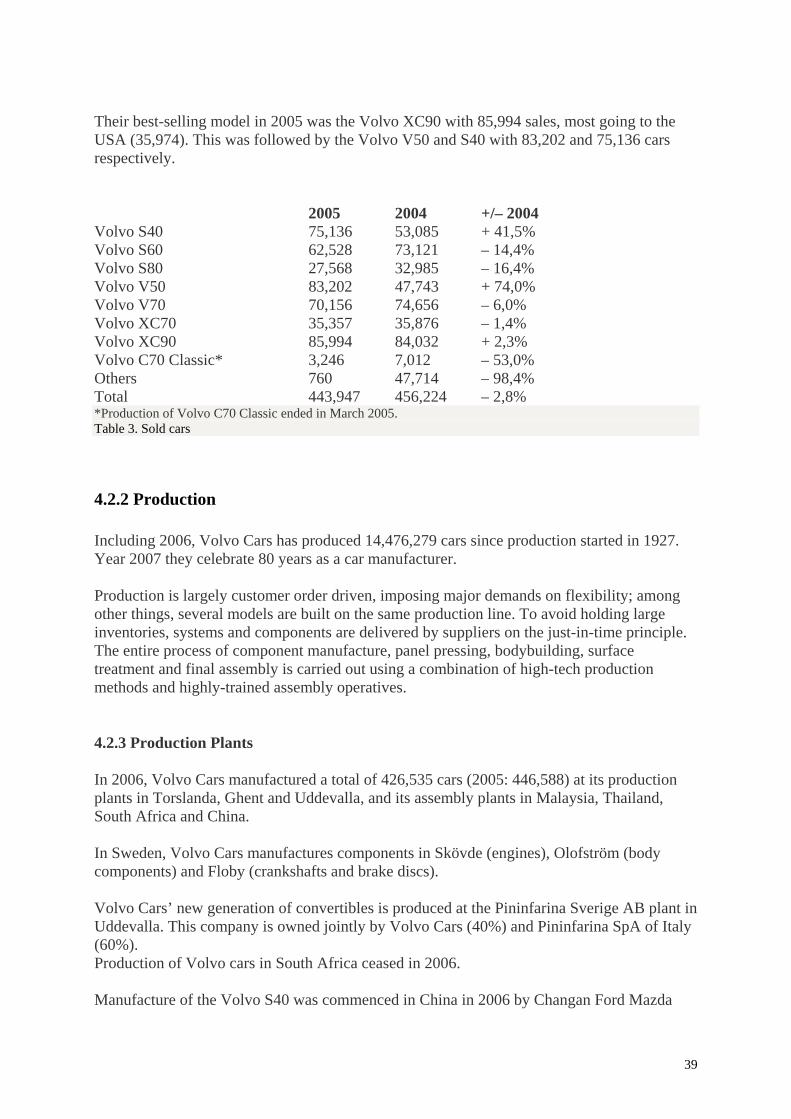
Their best-selling model in 2005 was the Volvo XC90 with 85,994 sales, most going to the USA (35,974). This was followed by the Volvo V50 and S40 with 83,202 and 75,136 cars respectively. 2005 2004 +/– 2004 Volvo S40 75,136 53,085 + 41,5% Volvo S60 62,528 73,121 – 14,4% Volvo S80 27,568 32,985 – 16,4% Volvo V50 83,202 47,743 + 74,0% Volvo V70 70,156 74,656 – 6,0% Volvo XC70 35,357 35,876 – 1,4% Volvo XC90 85,994 84,032 + 2,3% Volvo C70 Classic* 3,246 7,012 – 53,0% Others 760 47,714 – 98,4% Total 443,947 456,224 – 2,8% *Production of Volvo C70 Classic ended in March 2005. Table 3. Sold cars
4.2.2 Production Including 2006, Volvo Cars has produced 14,476,279 cars since production started in 1927. Year 2007 they celebrate 80 years as a car manufacturer. Production is largely customer order driven, imposing major demands on flexibility; among other things, several models are built on the same production line. To avoid holding large inventories, systems and components are delivered by suppliers on the just-in-time principle. The entire process of component manufacture, panel pressing, bodybuilding, surface treatment and final assembly is carried out using a combination of high-tech production methods and highly-trained assembly operatives.
4.2.3 Production Plants
In 2006, Volvo Cars manufactured a total of 426,535 cars (2005: 446,588) at its production plants in Torslanda, Ghent and Uddevalla, and its assembly plants in Malaysia, Thailand, South Africa and China. In Sweden, Volvo Cars manufactures components in Skövde (engines), Olofström (body components) and Floby (crankshafts and brake discs). Volvo Cars’ new generation of convertibles is produced at the Pininfarina Sverige AB plant in Uddevalla. This company is owned jointly by Volvo Cars (40%) and Pininfarina SpA of Italy (60%). Production of Volvo cars in South Africa ceased in 2006. Manufacture of the Volvo S40 was commenced in China in 2006 by Changan Ford Mazda
40
Automobile Corporation Ltd. (CFMA), a company owned jointly by Changan of China, Ford and Mazda.
4.2.4 Design
The Scandinavian heritage
The design of Volvo’s cars is strongly flavoured by their Scandinavian origins, where elegance, function and cleanness are strong design elements. This is also reflected in the design of their cars—outside and in. They lean towards Volvo’s own design tradition with a range of style elements that have been typical Volvo features since the 1950s, such as the vertical front, the V-shaped bonnet, the pronounced shoulders along the sides of the car and the shape of the tail lights. Design heritage and modern creativity blend to create attractive car lines that stand the test of time.
Global design process
Their design is based on the customer’s needs and lifestyle along with the values that are represented by the Volvo brand. From the very outset, their designers enjoy close cooperation with product planners, pre-production engineers and engineers, not least by using standardised computer-simulated models. This is done to create harmony and balance between the car’s design and its technical content. Various design proposals are produced and then tested, first with various reference groups within the company, later in customer clinics on important markets where car buyers get to see full-scale models and offer their personal views.
The car’s design is developed and enhanced in a continuous process. The Volvo Cars design department employs about 200 people in three design centres—in Göteborg, Barcelona and Camarillo outside Los Angeles. The role of these facilities includes the monitoring of new trends, design languages and customer preferences.
4.2.5 Product Development
What differentiate a Volvo from other cars is its properties. Naturally, within the areas that are core values at Volvo Cars—safety, environment and quality—but even the car’s comfort, driving properties and usability have clear Volvo genes. Developing and ensuring these unique properties is an important task for the product developers. Their work is based on the expertise of the 4000 or so employees of the Product Development department in Göteborg, which has been built up over decades of car development. Volvo Cars also has access to the combined competence of Ford Motor Company and the many suppliers who actively contribute to the development of new Volvo cars.
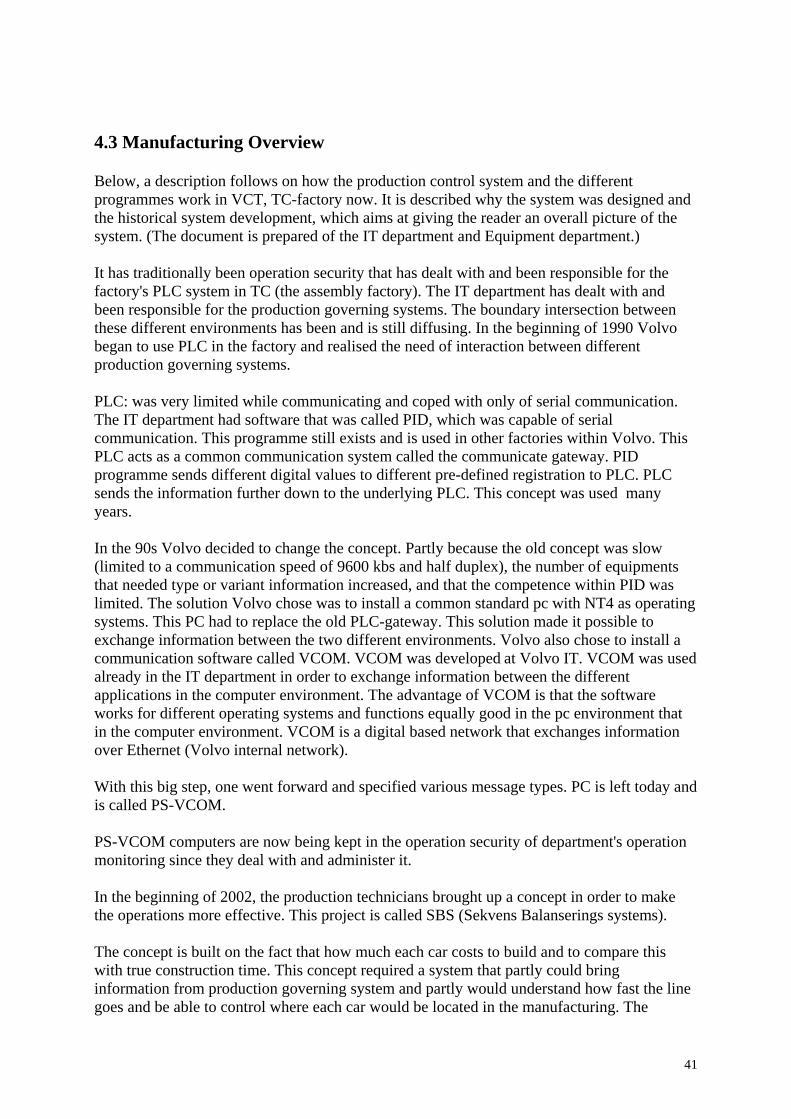
41
4.3 Manufacturing Overview Below, a description follows on how the production control system and the different programmes work in VCT, TC-factory now. It is described why the system was designed and the historical system development, which aims at giving the reader an overall picture of the system. (The document is prepared of the IT department and Equipment department.) It has traditionally been operation security that has dealt with and been responsible for the factory's PLC system in TC (the assembly factory). The IT department has dealt with and been responsible for the production governing systems. The boundary intersection between these different environments has been and is still diffusing. In the beginning of 1990 Volvo began to use PLC in the factory and realised the need of interaction between different production governing systems. PLC: was very limited while communicating and coped with only of serial communication. The IT department had software that was called PID, which was capable of serial communication. This programme still exists and is used in other factories within Volvo. This PLC acts as a common communication system called the communicate gateway. PID programme sends different digital values to different pre-defined registration to PLC. PLC sends the information further down to the underlying PLC. This concept was used many years. In the 90s Volvo decided to change the concept. Partly because the old concept was slow (limited to a communication speed of 9600 kbs and half duplex), the number of equipments that needed type or variant information increased, and that the competence within PID was limited. The solution Volvo chose was to install a common standard pc with NT4 as operating systems. This PC had to replace the old PLC-gateway. This solution made it possible to exchange information between the two different environments. Volvo also chose to install a communication software called VCOM. VCOM was developed at Volvo IT. VCOM was used already in the IT department in order to exchange information between the different applications in the computer environment. The advantage of VCOM is that the software works for different operating systems and functions equally good in the pc environment that in the computer environment. VCOM is a digital based network that exchanges information over Ethernet (Volvo internal network). With this big step, one went forward and specified various message types. PC is left today and is called PS-VCOM. PS-VCOM computers are now being kept in the operation security of department's operation monitoring since they deal with and administer it. In the beginning of 2002, the production technicians brought up a concept in order to make the operations more effective. This project is called SBS (Sekvens Balanserings systems). The concept is built on the fact that how much each car costs to build and to compare this with true construction time. This concept required a system that partly could bring information from production governing system and partly would understand how fast the line goes and be able to control where each car would be located in the manufacturing. The

42
solution in this case was to install a pc per line. Parallel to SBS project, another new project took place. The new CCC-project (Change of Consequence Class) aimed at changing the consequence classes on screw units. The aim of the new project was to ensure that the operator drugs correct number of screws on the right car and with the right angle.
4.3.1 Identification of Automotive This section treats how TC refers to and identifies cars and describes variants of cars.
4.3.1.1 Identity Each car that is built in TC must be identified in one way or another. Volvo has chosen to identify cars with the aid of one 9-digit number for example 275056255. This number can be divided into two parts, a three-digit number that referres to TYPE -number and a six-digit number that referres to chassis numbers. There are currently four types of cars being manufactured in TC factory. • S80 • V70 • XC70 • XC90 The types are identified via a type code. Each car type has also a project name. • S80 has the project name P23 • V70 has the project name P26E • XC70 has the project name P26L • XC90 has the project name P28 The type codes are as follows for different models. • S80 (P23) is 184 • V70 (P26E) is 285 • XC70 (P26L) is 295 • XC90 (P28) is type the code 275. The chassis number, which is 6-digit long, is included within the type number. Each car has also one 7-digit extension number. Most often only the three last figures are shown.

43
4.3.1.2 Labelling There is a label on the right corner of the roof of each car that can be compared to a crossword; the label is pasted on top of the car's wrap guard. The label has a code on itself that is called the data matrix code. The code contains the information about the TYPE and chassis numbers. The advantage with data matrix the code is that the entire code does not need to last visible or okay in order for the camera to interpret the information. Each car is noticed with data matrix code as soon as the car comes into TC on the so called TBH line (manufacturing line). Each car stays in a station where a dash code that is on right batch is read of. The information on the dash code is sent to the production handle-bar system SAMS.The SAMS system sends down TYPE/Chassis numbers to a label printer, a machine then paste the label on the ceiling of the car. There is a camera then which can read and interpret the barcode. The camera sends up the TYPE/The chassis number to the SAMS system, SAMS does a sequence control and will let the operator know if the car is in right sequence or not. The car will not go further on the line without the camera scanning the car. Volvo has chosen not to identify the car with the aid of the data matrix code in some places of the factory. An example on this is in “Marriage Point”. In this area, the car hangs on a mobile lift. The solution in this area has been to install one escort memory on the lift. When a car comes into “MP-area”, the camera reads of the label on the ceiling. The camera sends up TYPE/Chassis numbers to the SAMS system and an identity of the camera that has read the car. The SAMS system does a control in order to be assured the car is in the right sequence and sends down the TYPE/Chassis and possible other information that is required in this product section. The information is sent to gateway PS-VCOM. There is a translation list in the gateway that checks if the information which SAMS has sent comes from a configured camera and then send the information further to the PLC which is responsible for the "Monorail". The PLC sends over the TYPE/ chassis number to the printer via Comli protocol. The printer sends the information to its memory cordless.
4.3.1.3 Variants Four different types of cars as mentioned before are manufactured here. Each car that is built is a unique individual based on customer's wishes. The combination's number depends on the model of the car, color and other options. In order to know what to do with the unique car in every special work operation, the production engineers have broken down the different choices of the customers in order to fulfill their wishes. The production engineers call these variants for “pummlar”. There is a system called SAFIR where one “prepares” information for SAMS as in turn gets each morning (or urgent transfer from SAFIR). The SAMS system can form a TYPE/Chassis numbers and one station number speak about what it is for an individual with the aid of SAFIR.
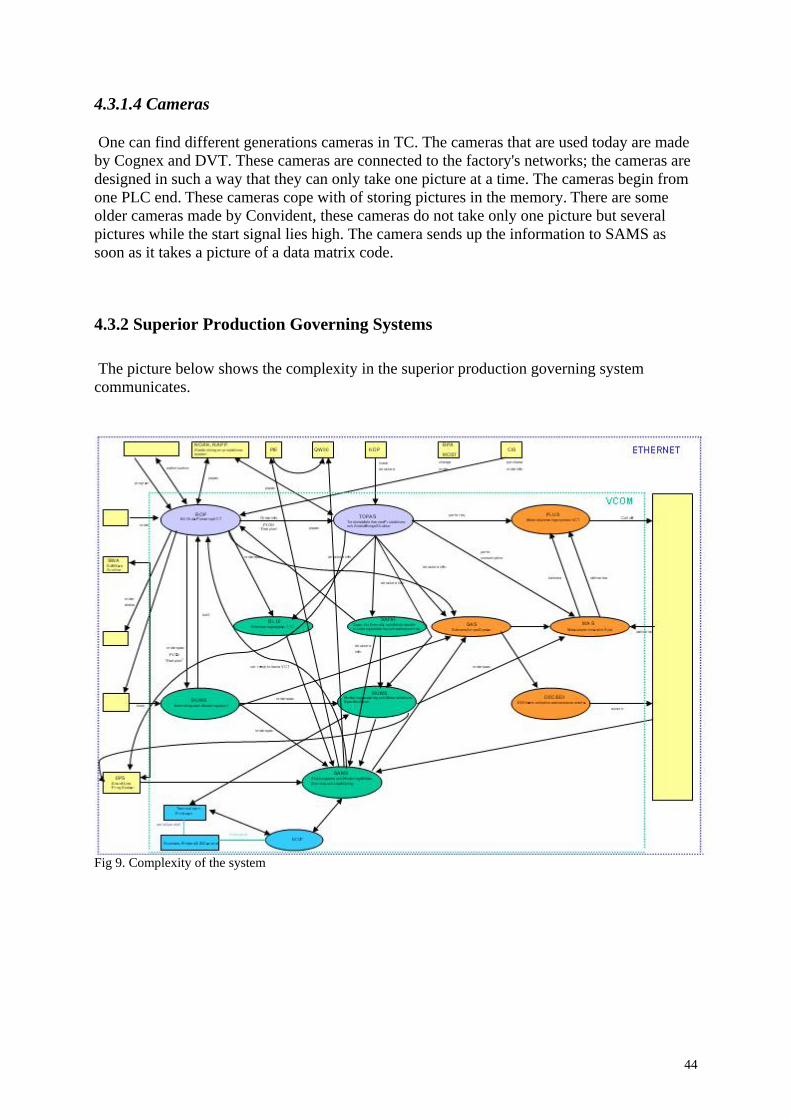
44
4.3.1.4 Cameras One can find different generations cameras in TC. The cameras that are used today are made by Cognex and DVT. These cameras are connected to the factory's networks; the cameras are designed in such a way that they can only take one picture at a time. The cameras begin from one PLC end. These cameras cope with of storing pictures in the memory. There are some older cameras made by Convident, these cameras do not take only one picture but several pictures while the start signal lies high. The camera sends up the information to SAMS as soon as it takes a picture of a data matrix code.
4.3.2 Superior Production Governing Systems The picture below shows the complexity in the superior production governing system communicates.
Fig 9. Complexity of the system

45
Below, a brief description follows on how some of the different superior production governing systems function. SAMS ”Slutacceptans och Monteringsflödes Styrning och uppföljning.” (Final acceptance and assembly flow control and follow-up.) Between SAMS and PS (intends here all equipment - and chute control) there was a concept named station for both physical and logical place. When one wagon is identified in a station, it would be treated according to the station's governed functions. The wagon can be identified with the aid of camera, scanner and terminal or virtual (the wagon identification form) Station governed function (in this context): - Controls (sequence, article number etc) - Break forward variant information according to field groups - Shipped variant information to PS (or pc on the line) - Break forward picking information according to field groups - Shipped picking information to PS (or pc on the line) - Break forward SBS (operation information according to operations for electrical band) - Shipped balance information to PS (or pc on the line) - Shipped process gates to PS (or pc on the line) - Store received information for transfer to other systems - Put up received blocks SAFIR Preparation of variant information. Everything is transfered to SAMS each morning and if necessary, can occasional field groups be transferred urgently during the day. The information is batched on the concept “field group” Variant information, picking INFO and governing signals are decided for respective equipment and are put up in existing or new field groups.

46
BLIX Preparation of work operations Relevant information for all work operations are transferred to SAMS each morning. SBS identification is given for SBS. SBS-id comprizes: Band electrical 3 characters Startposition in dm 4 characters Shifts 1 character Active/Passive 1 character DCOP Software that communicates with e.g. SAMS system. The programme is used in order to let cameras and scanners transfer information to the superior production control systems.
The camera that is connected to the network either via a serial input on a terminal server or directly on ethernet sends their camera readings to the software DCOP that in turn sends the message furthermore with VCOM to SAMS.
Fig 10. Communications Flow
SAMS
DCOP
Terminal Server
SAMS
DCOP
Camera
Camera
VCOM
IP
VCOM
IP
Communication flow for new cameras Communication flow for old cameras

47
Fig 11. Manufacturing overview
4.4 Investigation VCT has applied different systems in order to assemble right component on the right sequence. Since TC factory is a factory that assembles many different variants in one single assembly line and each variant requires specific components, TC factory has applied the following systems.
• Poka-Yoke VCT ( Volvo Cars Torslanda) has applied an error proof device ( Poka-Yoke) which is an electronical system with indicators. This helps the operator to pick the right component. • Specification paper Papers are attached to the variants including the components specifications. The operator can see the components required by the variant and pick them and assemble them.
Line
SAMS SAFIR
TCID
Line PLC
Conveyor
3. Car ID
1. Car in position
2. Trigg camera
4. Get Variant information 5. Return Variant information
6. Car data
7. Store data in register with car position
8. Send car id to PLC and start line 9. Return conveyor movement
10. Update register with conveyor movement
Car id 285111155 Position 18,1m
Car id 275123455 Position 24,9m
BLIX 4. Get balance data
5. Return balance data

48
• Warning lights This system is used for unique cars that seldom come to the assembly line. This warning system warns the operator to pick and assemble the unique component on the unique car.
• Scanner The system helps the operator to verify if the right component is picked by scanning the barcode of each component.
4.4.1 Poka-Yoke Among all quality methods used by VCT, authors’ investigation shows that Poka-Yoke system is the most time/money consuming system in the whole factory. Therefore the authors have chosen this system to work on. A Poka-yoke device is any mechanism that either prevents a mistake from being made or makes the mistake obvious immediately. Poka-Yoke is derived from the concept Jidoka. Poka means inadvertent error, and yoke means prevention. Poka-yoke means implementing simple low-cost devices that either detect abnormal situations before they occur, or once they occur, stop the line to prevent defects. Shingo (The system creator) was careful to distinguish between errors, which he felt were impossible to avoid, and defects, which he believed could be entirely eliminated. Poka-yokes reduce a worker's physical and mental burden by eliminating the need to constantly check for the common errors that lead to defects. Here are the most common errors in order of importance:
1. Missing process steps. 2. Process errors. 3. Miss-set work pieces. 4. Missing parts. 5. Wrong parts. 6. Wrong work piece processed. 7. Faulty machine operation. 8. Adjustment errors. 9. Equipment not set up properly. 10. Tools inadequately prepared.
A good Poka-Yoke satisfies the following requirements:
• Simple, with long life and low maintenance cost. • High reliability. • Low cost. • Designed for workplace conditions.

49
The concept is built up around the following systems
• SAFIR – Existing system that handles all variants • SAMS – Production system • TCID – PC that controls all cars along a line • PLC – Controls the lines movement • PS-VCOM – The same as TCID but for pre-stations • VCOM – Network protocol between SAMS and TCID
Fig 12. Poka-Yoke Overview The Poka-Yoke system functions as follows:
• All identical items are gathered in one pallet/box • Different pallets/boxes are set beside each other • Each pallet/box has an indicator in a form of lamp • This lamp functions as a button as well • There is a display that shows the number of the coming variant on the line or on the
pre-station • At the same time as the display shows the number, the light of the related component
box that is related to the variant would be turned-on automatically. • The operator knows now which component to pick and then pushes the related
button(light) • The next number would be shown on the display as soon as the operator has pushed
the button and thereafter the next button(s) would be turned-on which would tell the operator what component(s) to pick up.
• This process goes on all the time
Line
SAMS SAFIR
TCID
Poke Yoke station AAA
4. Get Variant information
5. Return Variant information
Start station 10m
End station 18m
Configfile for station AAA Start 10m Stop 18m
1. Read config file 2. Car before station AAA
3. Car ID (using TCID instead of camera) 6. Car data
7. Article 1 and 3
8. Indicate article 1 and 3
9.Operator acknowlege
10. Result to TCID
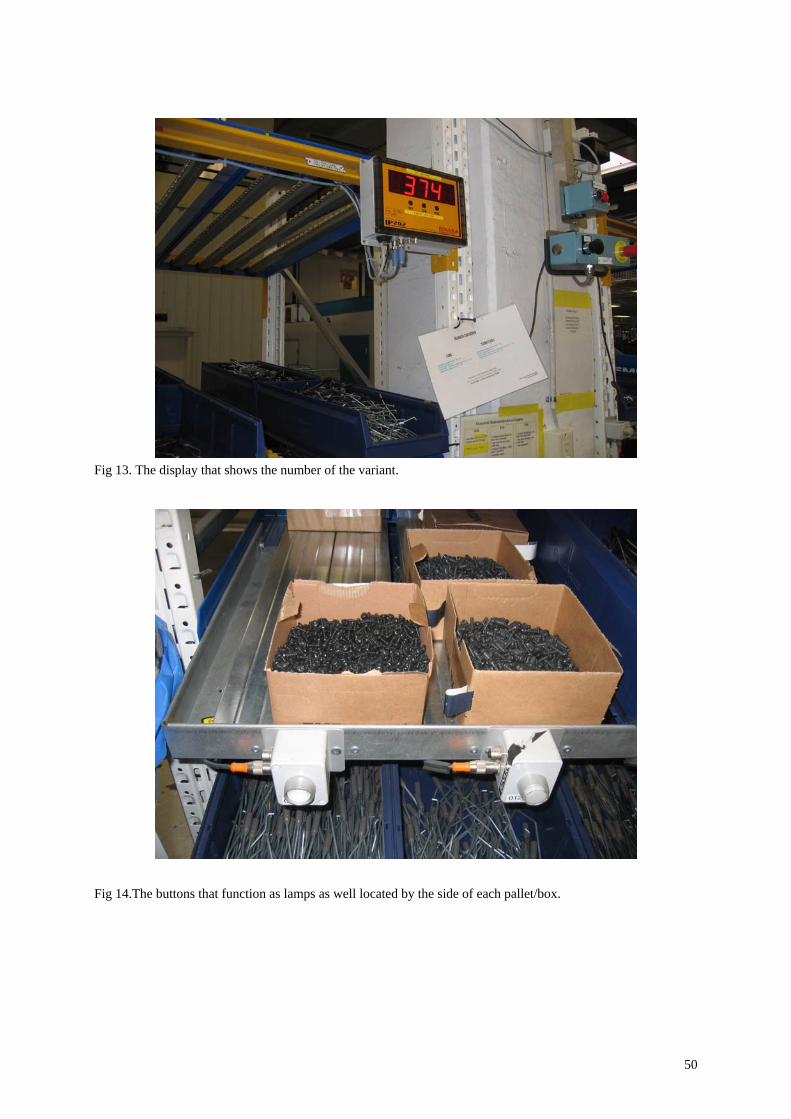
50
Fig 13. The display that shows the number of the variant.
Fig 14.The buttons that function as lamps as well located by the side of each pallet/box.

51
4.4.1.1 Poka-Yoke Structure
Fig 15. Poka-Yoke Device Central Unit
• One central unit per installation • Manage 61 nods = 244 different articles
• Inside a microcontroller attached to a circuit board • Program written in C (Same technology as inside the car)
• Size w255 x h210 x d66mm In front
• 1 pcs of five signs display (normally for mix number) • 3 pcs of diodes • 1 pcs Buzzer
Underneath
• 1 pcs Power connection 24VDC • 1 pcs Ethernet connection (communication towards TCID) • 2 pcs of CAN bus connections ( connection towards I/O nods) • 1 pcs of serial connection ( barcode reader, large display or other serial equipment)
l
.
Acknowledge device
Nod
Possible barcode reader
Possible display
Central unit
Power 24VDC Network
CAN bus
Prefabricate cables with M12 plugs

52
Fig 16. Poka-Yoke Display Acknowledge Device Buttons
• Contains led lamp • Two different types of acknowledge buttons
• With wide angle indication • Without wide angle indication
Fig 17. Light Buttons Additional:
• Key switch • Light beam • Photocell • Sensor • Scanner
Fig 18. Additional parts
Number display
Ethernet voltmeter
CAN out
Serial channel
Diodes

53
4.4.1.2 Cost Example For an installation with 5 different articles, the following items are needed : 1 pcs of Central unit 1500 Euro 1 pcs of power supply 230VAC/24VDC 120 Euro 2 pcs of I/0 nods 460 Euro 5 pcs of acknowledge buttons 500 Euro 5 pcs of I/O cables (5m each) 110 Euro 2 pcs of CAN cables (5m each) 80 Euro 1 pcs of CAN resistance 10 Euro Sum 2780 Euro This example is calculated with a rate of 1 Euro= 10 SEK. A network connection nearby is presumed. The Poke Yoke needs to be installed on a mechanical frame that is not included.
4.4.2 Lines in Focus (Poka-Yoke point of view) Three lines are chosen as mentioned earlier.
4.4.2.1 Door Lines All related components that has something to do with the doors are assembled on the Door Lines; components for right doors are being installed on Door Line-right and all components for the left doors are being installed on Door line-left. These two lines work identically. The Door Lines are now using two quality systems namely Scanners and Poka-Yoke. One of the most important operations in the Door Lines is the lock stick operation, therefore the most focus is on this work operation, which is equipped with Poka-Yoke system. There are different types of lock sticks depending on the variant of the car on the manufacturing line. These lock sticks are to be installed on the doors on the main line and the operator has to pick the right lock stick, right screw and the right label in order to be able to install the lock stick on the door. Some important specifications of the door lines are as follows:
• 25 operators on each station (left and right). • 23-25 buttons on the Poka - Yoke work operation (lock sticks) • Only one person works on this work operation, ( pick up and install) • Each workstation consists of 25 different tasks. • There is a buffer, which contains almost 200 to 230 ready doors. • Lock stick operation takes almost 1½ minutes. • Each station is 204 meters long. • Each station has 2 Poka-Yoke work operations.
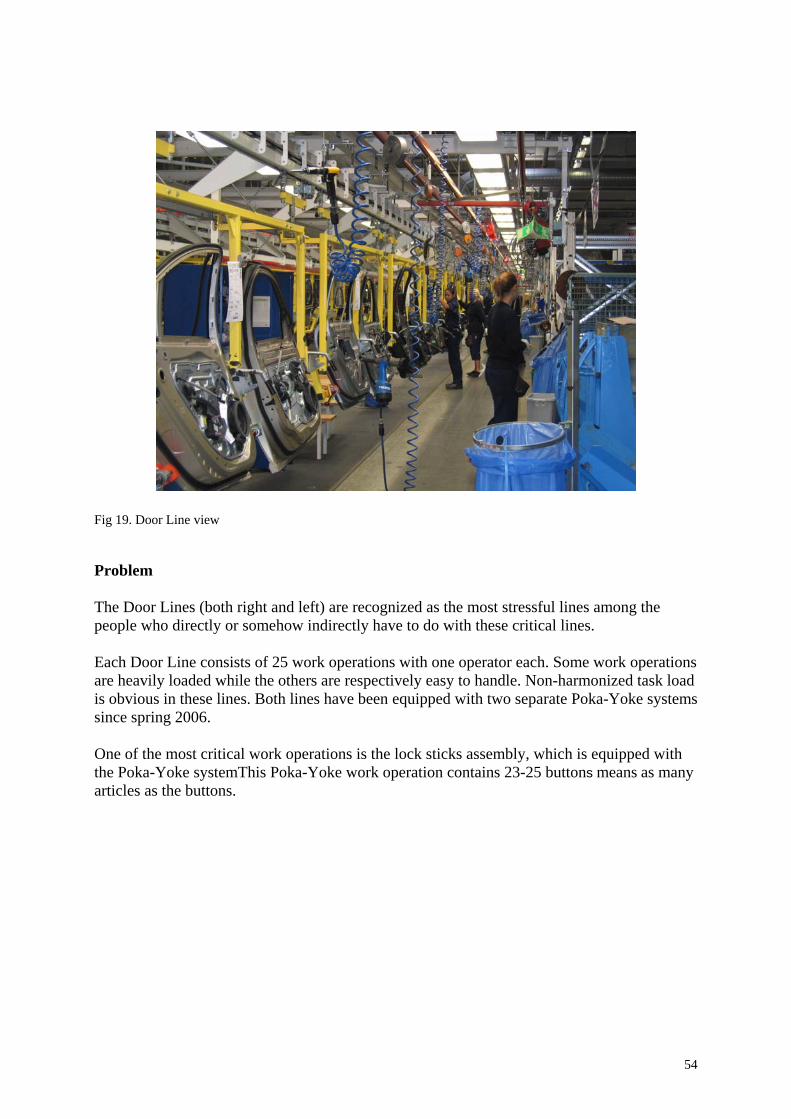
54
Fig 19. Door Line view Problem The Door Lines (both right and left) are recognized as the most stressful lines among the people who directly or somehow indirectly have to do with these critical lines. Each Door Line consists of 25 work operations with one operator each. Some work operations are heavily loaded while the others are respectively easy to handle. Non-harmonized task load is obvious in these lines. Both lines have been equipped with two separate Poka-Yoke systems since spring 2006. One of the most critical work operations is the lock sticks assembly, which is equipped with the Poka-Yoke systemThis Poka-Yoke work operation contains 23-25 buttons means as many articles as the buttons.
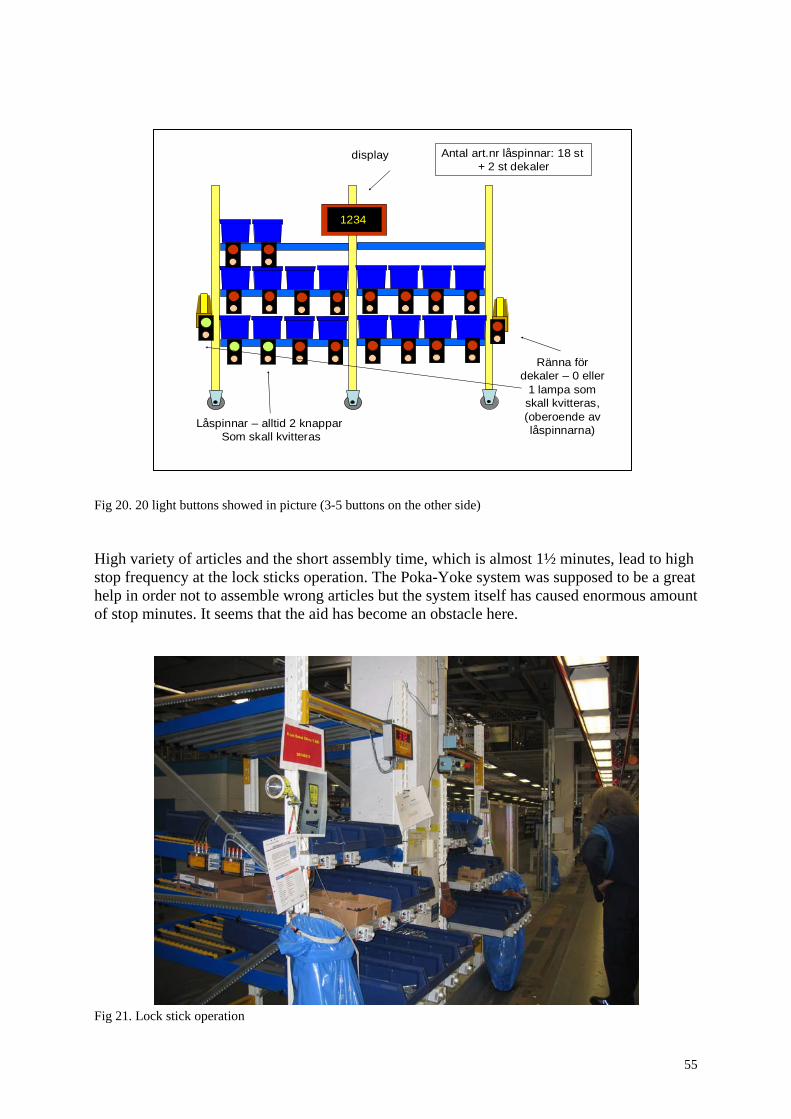
55
Fig 20. 20 light buttons showed in picture (3-5 buttons on the other side) High variety of articles and the short assembly time, which is almost 1½ minutes, lead to high stop frequency at the lock sticks operation. The Poka-Yoke system was supposed to be a great help in order not to assemble wrong articles but the system itself has caused enormous amount of stop minutes. It seems that the aid has become an obstacle here. Fig 21. Lock stick operation
1234
Låspinnar – alltid 2 knappar Som skall kvitteras
Ränna för dekaler – 0 eller
1 lampa som skall kvitteras, (oberoende av låspinnarna)
display Antal art.nr låspinnar: 18 st + 2 st dekaler
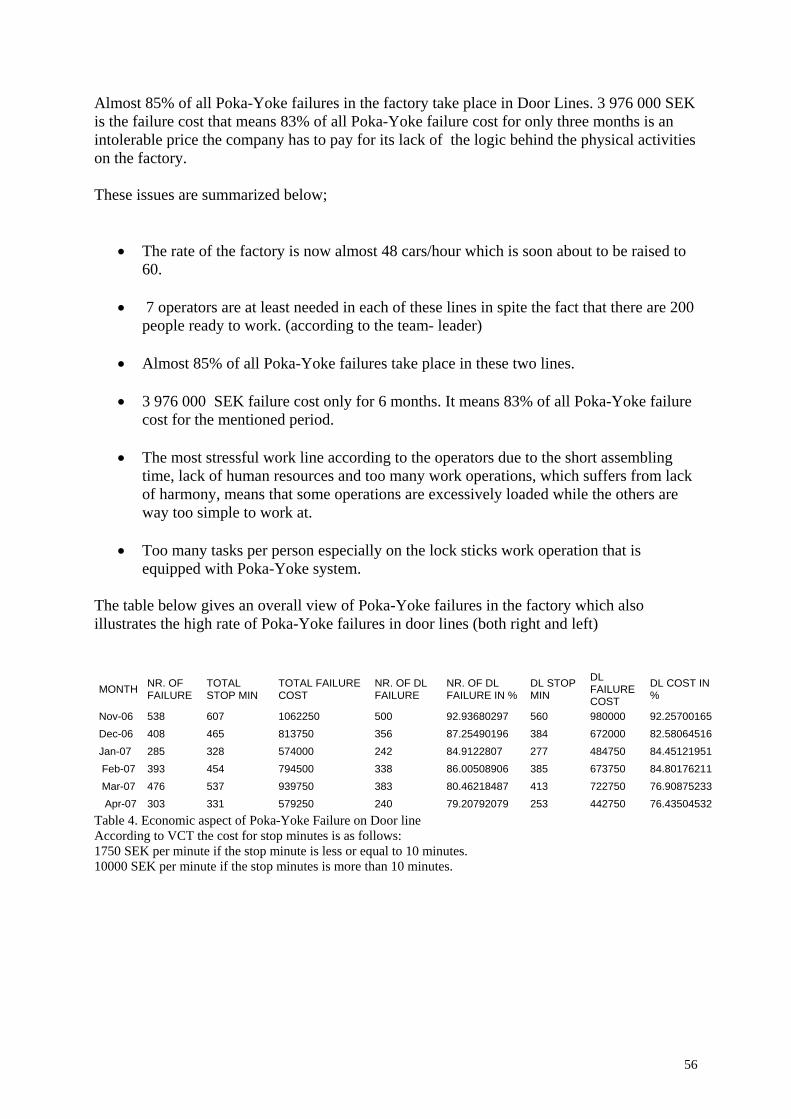
56
Almost 85% of all Poka-Yoke failures in the factory take place in Door Lines. 3 976 000 SEK is the failure cost that means 83% of all Poka-Yoke failure cost for only three months is an intolerable price the company has to pay for its lack of the logic behind the physical activities on the factory. These issues are summarized below;
• The rate of the factory is now almost 48 cars/hour which is soon about to be raised to 60.
• 7 operators are at least needed in each of these lines in spite the fact that there are 200
people ready to work. (according to the team- leader)
• Almost 85% of all Poka-Yoke failures take place in these two lines.
• 3 976 000 SEK failure cost only for 6 months. It means 83% of all Poka-Yoke failure cost for the mentioned period.
• The most stressful work line according to the operators due to the short assembling
time, lack of human resources and too many work operations, which suffers from lack of harmony, means that some operations are excessively loaded while the others are way too simple to work at.
• Too many tasks per person especially on the lock sticks work operation that is
equipped with Poka-Yoke system. The table below gives an overall view of Poka-Yoke failures in the factory which also illustrates the high rate of Poka-Yoke failures in door lines (both right and left)
MONTH NR. OF FAILURE
TOTAL STOP MIN
TOTAL FAILURE COST
NR. OF DL FAILURE
NR. OF DL FAILURE IN %
DL STOP MIN
DL FAILURE COST
DL COST IN %
Nov-06 538 607 1062250 500 92.93680297 560 980000 92.25700165Dec-06 408 465 813750 356 87.25490196 384 672000 82.58064516Jan-07 285 328 574000 242 84.9122807 277 484750 84.45121951 Feb-07 393 454 794500 338 86.00508906 385 673750 84.80176211 Mar-07 476 537 939750 383 80.46218487 413 722750 76.90875233 Apr-07 303 331 579250 240 79.20792079 253 442750 76.43504532
Table 4. Economic aspect of Poka-Yoke Failure on Door line According to VCT the cost for stop minutes is as follows: 1750 SEK per minute if the stop minute is less or equal to 10 minutes. 10000 SEK per minute if the stop minutes is more than 10 minutes.
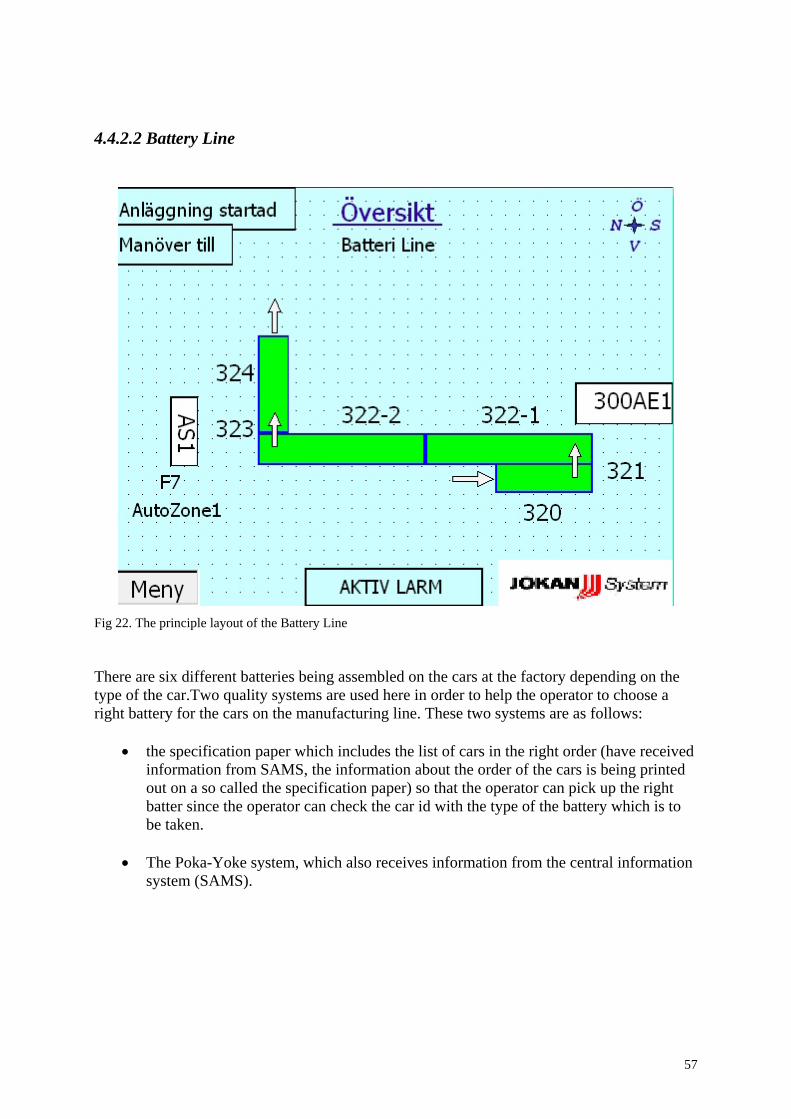
57
4.4.2.2 Battery Line
Fig 22. The principle layout of the Battery Line There are six different batteries being assembled on the cars at the factory depending on the type of the car.Two quality systems are used here in order to help the operator to choose a right battery for the cars on the manufacturing line. These two systems are as follows:
• the specification paper which includes the list of cars in the right order (have received information from SAMS, the information about the order of the cars is being printed out on a so called the specification paper) so that the operator can pick up the right batter since the operator can check the car id with the type of the battery which is to be taken.
• The Poka-Yoke system, which also receives information from the central information
system (SAMS).

58
Fig 23. Battery pallets
There are six different battery types and there is a lamp above each type. Each would be switched on automatically with the same order as the cars go through the manufacturing line. The operator has to push the button (the lamp) and confirm that he has taken the battery from the section with the switched-on lamp. These six lamps would automatically be switched on at a time once it's their turn. This lamp works as an indication in order to send a light signal to the operator to pick the right battery.
Fig 24. The battery line overview (the rolling band)

59
The role band would stop for 5 seconds while the operator puts the battery on it in order to make it possible for the operator to put the battery on the band in the right position. This stop time can be controlled manually as well. The battery will then move forward on the band after the stop. Here, there is another operator who picks the battery from the line and put it in the car on the manufacturing line. This operator here has no control and specification paper to check with but there is a paper on the windscreen of each car which helps the operator to confirm if the battery matches the car. Fig 25. The battery is only placed in the car without being installed. The car, with the battery in, will then pass this workstation by on the manufacturing line since the batteries are to be installed in another station. One can see a little sign of Lean manufacturing since the batch size, which is the battery here, is one here that follows the car all the way on down to the battery installation work operation on the manufacturing line. The operator installs the battery in the car on the battery assembly work operation (line 1:07) without wasting time checking whether the battery, which is in the car, is correct or not since another operator has done this task before. The Operator here has only the duty to install the battery and nothing more and that is why this line is one of the least stressful lines in the company.

60
Fig 26. Line 1:07 where the batteries are finally installed. The operator here has only one task and that makes it much easier for the operator to work with high installation quality, which is of vital importance. Problem In case the operator forgets to push the lighted button, the consequence would be the fact that the sequence would go out of order and therefore the wrong battery would be placed in the car. Cars go on the line in the right order and each car needs its own battery among 6 different batteries, even if the operator forgets just once to push the lighted button, the whole battery order would go one step back means for example one kind of battery should be placed in the first car but the operator forgets to push the button, now the second car is in the line waiting for its battery to be placed in. Since the former light is still on the operator takes a battery from the same old pallet one more time. This means that the whole sequence is destroyed by one simple mistake of the operator. The operator might double check the sequence by controlling the order list, which he/she has in front of him/her. These papers are now available but are soon to be taken away from the system. The sequence problem mostly happens by the change of the operator. Nobody would notice this mistake all the way from the battery line to the line 1:07 where the batteries are to be installed in the car. This mistake might not even be shown in this station either since the size of batteries are almost the same.
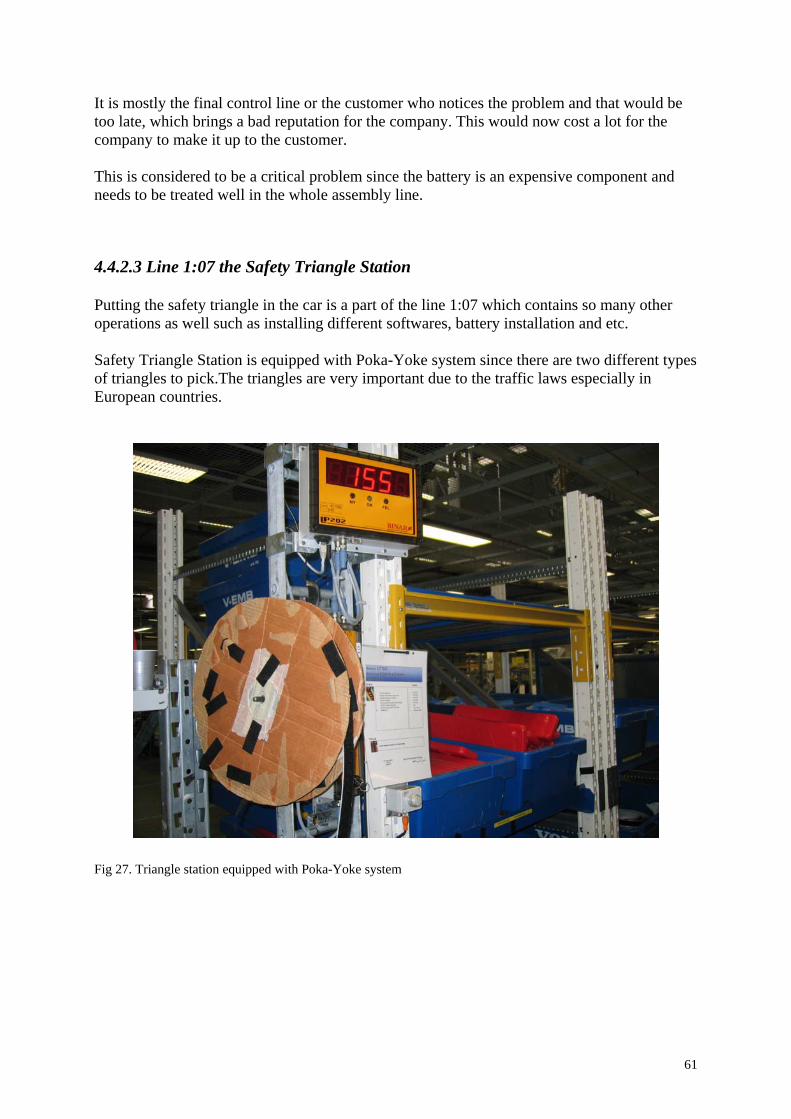
61
It is mostly the final control line or the customer who notices the problem and that would be too late, which brings a bad reputation for the company. This would now cost a lot for the company to make it up to the customer. This is considered to be a critical problem since the battery is an expensive component and needs to be treated well in the whole assembly line.
4.4.2.3 Line 1:07 the Safety Triangle Station Putting the safety triangle in the car is a part of the line 1:07 which contains so many other operations as well such as installing different softwares, battery installation and etc. Safety Triangle Station is equipped with Poka-Yoke system since there are two different types of triangles to pick.The triangles are very important due to the traffic laws especially in European countries. Fig 27. Triangle station equipped with Poka-Yoke system

62
Problem These two types of triangles are very similar to each other with a very little different which is the black tag pasted on one type. The operator could easily make a mistake while picking the safety triangle. The only person who would notice this mistake would be the end customer and that would be a very bad reputation for the company to have the wrong triangle put in the car. Just like the battery line, if the operator makes a mistake here the whole sequence would completely go wrong afterwards. Fig 28. Two different types of safety triangles, one with the black tag and the other one without.

63
5. Analysis and Discussion
5.1 Lean/FPS Analysis and discussion Lean production and how it can be applied theoretically have been elaborated so far in this project.It is now time to investigate if the Lean which is a major part of the FPS system has been applied correctly on the manufacturing lines in consideration. To summarize the Lean concept one can claim that the whole concept is to eliminate the seven different wastes mentioned earlier in this project. The focus is now on how the facilities and material are arranged for the operator to install different components on the car.Ergonomic is one of the most important subjects in the recent years. Both companies and those who work at the companies demand better and healthier work climate these days. VCT has also tired to facilitate as good work climate as possible for its operator according to FPS which itself follows the Lean concept.Two lines are considered from the Lean/FPS point of view; the Battery Line and the Door Line.
5.1.1 Lean/FPS Aspect on the Door Lines Ergonomic is taken under consideration here. As shown in fig.29, the operator needs to pick the plastic strips (gems that are to be pasted around the door panel) from a pallet and in order to do this, the operator needs to bend down and pick the plastic strip. The operator also needs to remove the cardboard every now and then in order to have access to the next layer (the plastic strips are placed in several layers in each pallet). The operator also has to put the cardboard on the side and wait for the lift truck driver to put the cardboard away. This is both non-ergonomic and time consuming, which is a kind of waste that is mentioned earlier in this project. The only aim of the Lean manufacturing system is to eliminate the waste in every from of it. Here one can see both waste of time and extra motions that the operator needs to do in order to reach the next layer of the plastic strips.
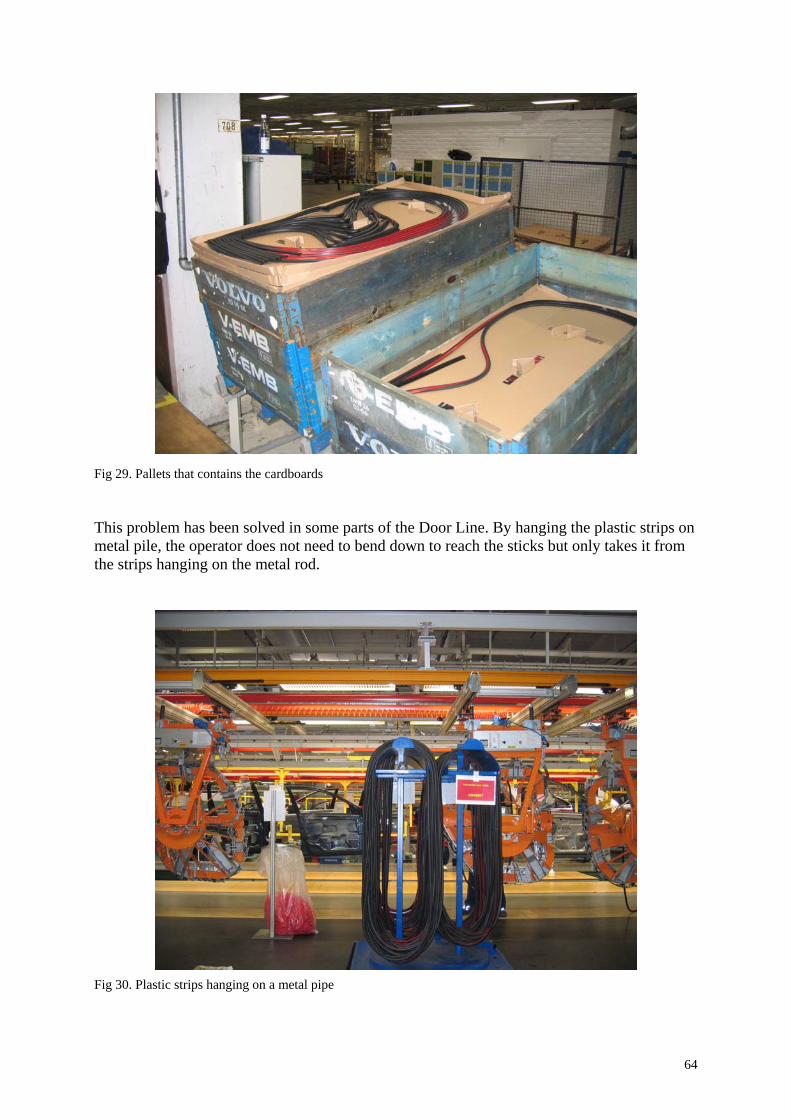
64
Fig 29. Pallets that contains the cardboards This problem has been solved in some parts of the Door Line. By hanging the plastic strips on metal pile, the operator does not need to bend down to reach the sticks but only takes it from the strips hanging on the metal rod. Fig 30. Plastic strips hanging on a metal pipe

65
This means that one does not need to have a pallet anymore, which occupies the space around the manufacturing line. This solution has also helped to implement the FPS more that ever in the factory since one important aspect of the FPS is to create a visual factory (eliminating everything such as pallet etc that prevents the operator being seen).Substituting the pallet with a metal pipe is one important step towards the FPS and Lean thinking.
5.1.2 Lean/FPS Aspect on the Battery Line Observing the battery line showed that the first thing that arouses attention was the lift robot which is to be used to lift the batteries from it's pallet to the rolling band where the batteries are to be moved forward to the main line. Almost none of the operators use this lift, they lift the batteries themselves by hands as shown in the fig.33. Fig 31. The lift on the Battery Line

66
Fig 32. The lift is meant to lift the batteries Fig 33. The operator lifts the battery by hands instead of letting the lift does this for him. This robot was meant to be used as a help but all one can see here is one robot, which is left unused only occupying a place on the battery line. This robot not only occupies a place but also costs for the factory via maintenance cost and reparation cost.This process does not seem to be a Lean thought even though the whole concept of installing this robot was to implement Lean production in the factory. This robot is a clear example of the waste, which mentioned before in the Lean chapters.
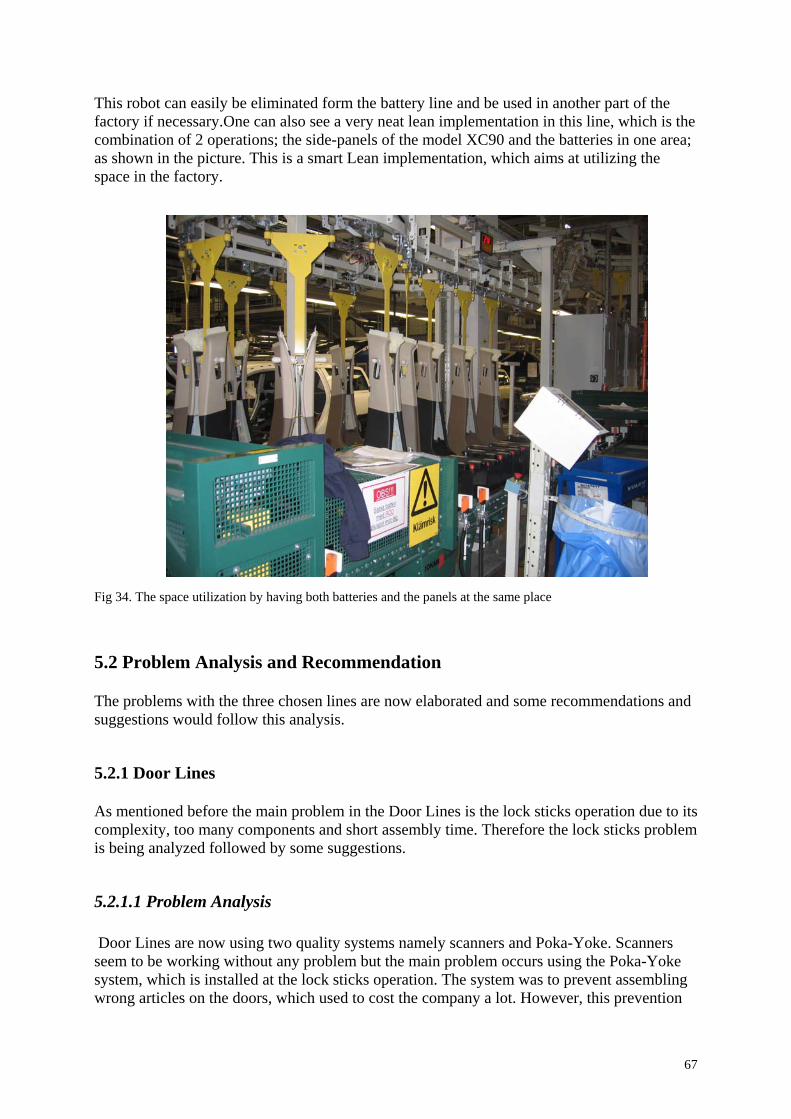
67
This robot can easily be eliminated form the battery line and be used in another part of the factory if necessary.One can also see a very neat lean implementation in this line, which is the combination of 2 operations; the side-panels of the model XC90 and the batteries in one area; as shown in the picture. This is a smart Lean implementation, which aims at utilizing the space in the factory. Fig 34. The space utilization by having both batteries and the panels at the same place
5.2 Problem Analysis and Recommendation The problems with the three chosen lines are now elaborated and some recommendations and suggestions would follow this analysis.
5.2.1 Door Lines As mentioned before the main problem in the Door Lines is the lock sticks operation due to its complexity, too many components and short assembly time. Therefore the lock sticks problem is being analyzed followed by some suggestions.
5.2.1.1 Problem Analysis Door Lines are now using two quality systems namely scanners and Poka-Yoke. Scanners seem to be working without any problem but the main problem occurs using the Poka-Yoke system, which is installed at the lock sticks operation. The system was to prevent assembling wrong articles on the doors, which used to cost the company a lot. However, this prevention

68
system seems to have created so many problems and as a consequence so much stop minutes which led to coming up with a remedy. Volvo has tried to apply this system in the company, which is an important part of Lean production, but they might have forgotten the fact that these kinds of systems cannot be applied partly. They have to be applied completely in order to achieve zero failure in the production line.
5.2.1.2 Recommendation Using the existing resources is always the cheapest solution. According to the done observations and comparisons the following fact appeared: Comparisons showed that those lines which received components in right order based on the Poka-Yoke system work much more efficiently than those lines with the Poka-Yoke system right at the station. Studies and investigations show the fact that when the material/components come to the line with the right order, the assembler would have more time to think and therefore to assemble faultlessly in a more acceptable/shorter time. In order to deliver the right material/component in right order, especially stations with high variety of components such as door lines, the line needs to have a pre-station where the right material in right order is arranged mostly with the help of Poka-Yoke or any other quality assurance system, which is different depending on the type of the industries. Another problem for stations with so many articles, which are equipped with the Poka-Yoke system at the main station, is the fact that the variety and the short time can cause confusion and mistakes in the assembling process. One can claim that applying the Poka-Yoke system at the main station is excessively late but the system must be installed in a pre-station that arranges the components in the right order for the main station. Lock sticks operation which is an important work operation belonging to the Door lines has applied the Poka-Yoke system since spring 2006.This operation has almost 23-25 buttons which confused the operator since the assembling time is rather short. The highest rate of stop minutes occurs here according to Volvo quality control center and "operational reliability center". The Poka-Yoke system is now being applied in companies such as Toyota. This company has applied the system thoroughly means that they have fulfilled the Lean system and therefore Poka-Yoke which is a part of Lean production. (Minimizing the batch size into one) This fact is obvious in companies such as Toyota in such a way that all needed articles that are to be installed on the car (or a specific part of a car like one door) follows the car (in a small box that follows the car) all the way on the production line. All the operator does is to pick the article and assemble it. The operator does not have to choose the article among other similar article but just has the access to the articles, which has to do with that specific car.
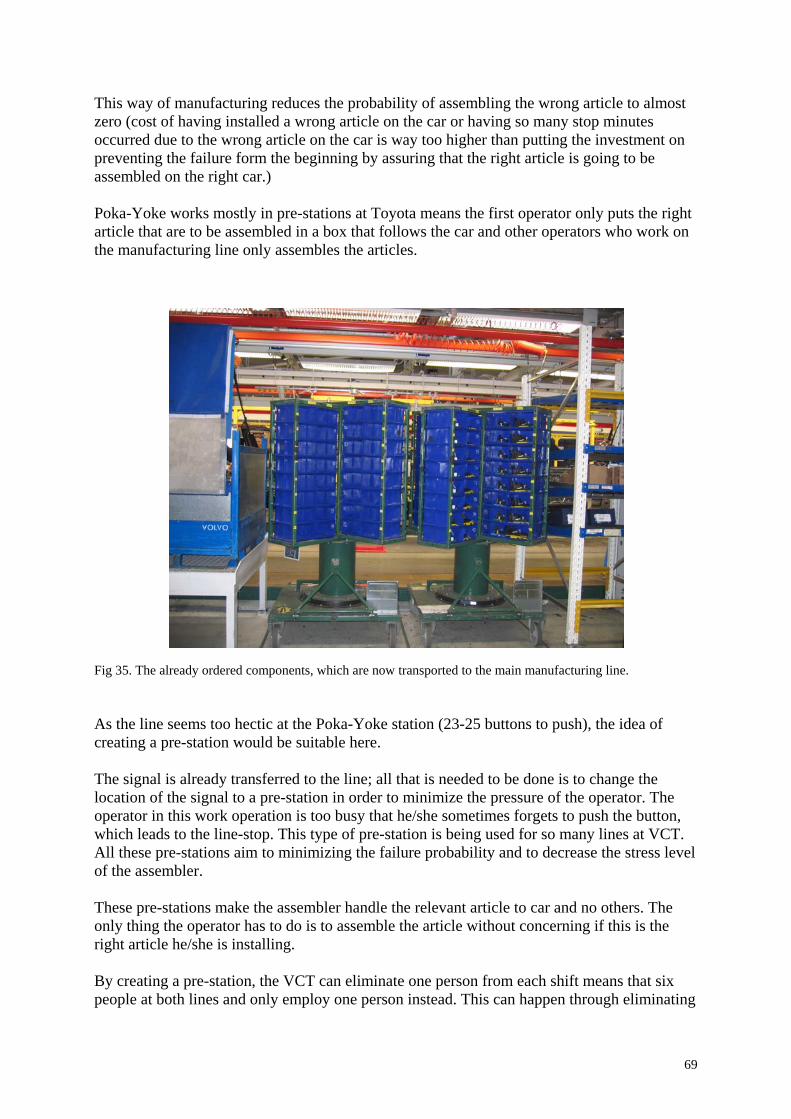
69
This way of manufacturing reduces the probability of assembling the wrong article to almost zero (cost of having installed a wrong article on the car or having so many stop minutes occurred due to the wrong article on the car is way too higher than putting the investment on preventing the failure form the beginning by assuring that the right article is going to be assembled on the right car.) Poka-Yoke works mostly in pre-stations at Toyota means the first operator only puts the right article that are to be assembled in a box that follows the car and other operators who work on the manufacturing line only assembles the articles. Fig 35. The already ordered components, which are now transported to the main manufacturing line. As the line seems too hectic at the Poka-Yoke station (23-25 buttons to push), the idea of creating a pre-station would be suitable here. The signal is already transferred to the line; all that is needed to be done is to change the location of the signal to a pre-station in order to minimize the pressure of the operator. The operator in this work operation is too busy that he/she sometimes forgets to push the button, which leads to the line-stop. This type of pre-station is being used for so many lines at VCT. All these pre-stations aim to minimizing the failure probability and to decrease the stress level of the assembler. These pre-stations make the assembler handle the relevant article to car and no others. The only thing the operator has to do is to assemble the article without concerning if this is the right article he/she is installing. By creating a pre-station, the VCT can eliminate one person from each shift means that six people at both lines and only employ one person instead. This can happen through eliminating
70
the operator from the speaker operation since this operation is too easy and does not take a long time to be done. Investigation shows that the previous operation can handle fixing the speakers as well. There are three shifts and one person would be eliminated form each shift, which would be a sum of three people on each line and this, will be six people for two lines and one person would work on the pre-station each shift means a sum of three operators would be needed at the pre-station for all three shifts. As a result three operators would be eliminated totally which almost ends up to a cost elimination of more than 3 000 000 SEK per year. The pre-stations works as follows
• Partly assembling the articles and then transporting them to the main manufacturing line.Some parts of some components have to be assembled in pre-stations in order to be assembled on the car at the main manufacturing line. These components can not be made on the main line due to the lack of time or equipment shortage on the line.
• These ready-to-assemble components will then be delivered to the main line for the
final assembly on the car. These components will be put in a box, which contains smaller boxes numbered one to n (depending on the size of the components and the big box).This arrangement happens in such a way that the operator puts the components in order, according to the given specification. Poka-yoke here is such a great help for the operator since it tells the operator exactly which component to pick and put in the boxes. There is a lamp above every variant of components, which would be switched on automatically as an indication for the operator to pick the article/component from that specific shelf. The Poka-Yoke gets order from SAMS, which is the central information system. SAMS arranges the information in such a way that the article number labeled on the component matches the car that is to be worked on in the manufacturing line.

71
Fig 36. A pre-station that arrange the component’s order to send them to the main line. This solution is chosen based on the following facts:
• Statistics show better Poka-Yoke result at the pre-stations. • Both lines (left & right) demand only one pre-station. • One less operator on each shift • One pre-station equipped with Poka-Yoke costs 100 000 – 150 000 SEK (not
expensive) • Poka-Yoke system which costs 70 000 SEK already exists.( no new purchase for
Poka-Yoke components) • Small size of pre-station due to the small size of components. • Since the TC factory is moving all its pre-stations to a new place, it would be
easier to place this pre-station among other pre-stations.
5.2.2 Battery Line Here comes a suitable solution for the battery line which can save the whole process from the beginning, the battery line, to the end, the line 1:07, where the batteries are to be finally installed. The solution is very easy and cheap to implement and that would be to install a scanner on the entrance of the rolling rail in such a situation that the confrontation of the top of the battery and the scanner would be inevitable. This scanner shall function instead of the push buttons of the Poka-Yoke system. The whole concept is not complicated at all. It is only to change the device which is connected to the Poka-Yoke signal.
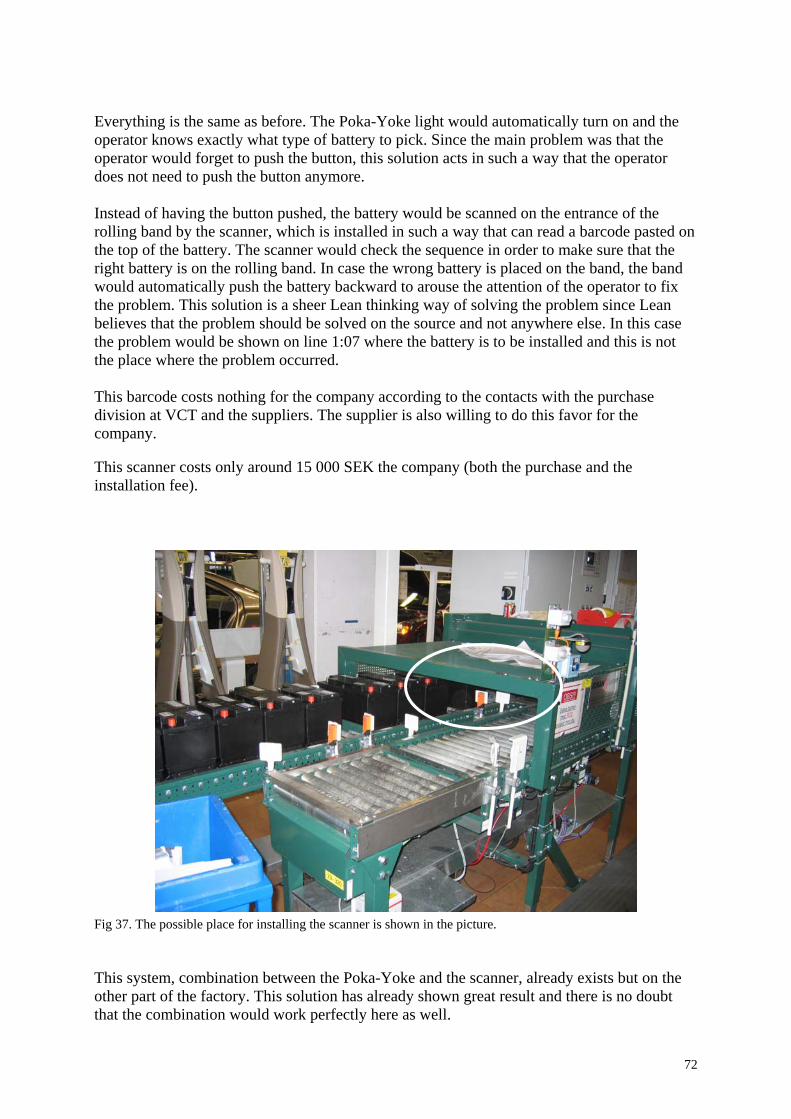
72
Everything is the same as before. The Poka-Yoke light would automatically turn on and the operator knows exactly what type of battery to pick. Since the main problem was that the operator would forget to push the button, this solution acts in such a way that the operator does not need to push the button anymore. Instead of having the button pushed, the battery would be scanned on the entrance of the rolling band by the scanner, which is installed in such a way that can read a barcode pasted on the top of the battery. The scanner would check the sequence in order to make sure that the right battery is on the rolling band. In case the wrong battery is placed on the band, the band would automatically push the battery backward to arouse the attention of the operator to fix the problem. This solution is a sheer Lean thinking way of solving the problem since Lean believes that the problem should be solved on the source and not anywhere else. In this case the problem would be shown on line 1:07 where the battery is to be installed and this is not the place where the problem occurred. This barcode costs nothing for the company according to the contacts with the purchase division at VCT and the suppliers. The supplier is also willing to do this favor for the company. This scanner costs only around 15 000 SEK the company (both the purchase and the installation fee). Fig 37. The possible place for installing the scanner is shown in the picture. This system, combination between the Poka-Yoke and the scanner, already exists but on the other part of the factory. This solution has already shown great result and there is no doubt that the combination would work perfectly here as well.
73
The solution can be summarized as follows:
• Installing a simple scanner which is connected to the Poka-Yoke system instead of the buttons.
• A barcode is to be typed on the label of each battery • The scanner is to be installed on the entrance of the rolling rail in such a situation
that can scan the barcode of the battery. • This would check the sequence and the rail would return the battery in case of
wrong component. Why Is the Scanner Chosen?
• Minimizes the human failure factor • Barcodes cost almost nothing according to the purchase division. • This type of scanner already exists in the factory and does not cost a lot. (the Door
Lines are equipped with this type of scanner, both cost around 30 000 SEK) • The scanner inevitably scans the barcode (no way the wrong sequence would go
through the main assembly line)
5.2.3 Safety Triangles Line 1:07 There are two different triangles in this operation to be installed on the car depending on the variant of the car. This operation is equipped with the Poka-Yoke system which has its own problem almost similar to the battery line (when the operator forgets to push the button and the whole sequence would go out of order).Since there are only two different components in the operation, the idea of having Poka-Yoke in this station seems to be a kind of waste which is totally against the Lean manufacturing and FPS. A better solution would be to use different colors in order to be able to distinguish between the two different triangles considering the fact that the specification papers follow the car all the way. This color symbol can be drawn on the specification paper and the same color on the pallet that contains the triangles by the side of the line. Since the SAMS system is an old system which can not handle colors and symbols on the specification papers, the idea could be alerted a little bit. The factory can use capital and bold letters instead of the different colors and symbols.
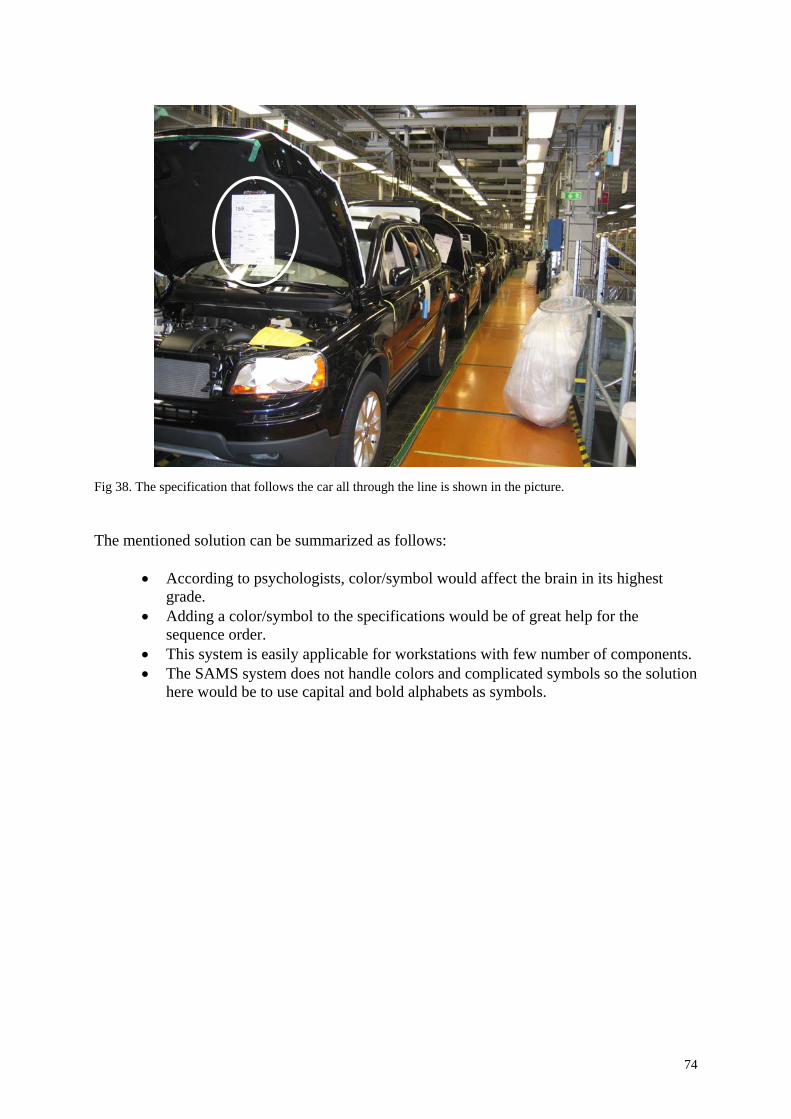
74
Fig 38. The specification that follows the car all through the line is shown in the picture. The mentioned solution can be summarized as follows:
• According to psychologists, color/symbol would affect the brain in its highest grade.
• Adding a color/symbol to the specifications would be of great help for the sequence order.
• This system is easily applicable for workstations with few number of components. • The SAMS system does not handle colors and complicated symbols so the solution
here would be to use capital and bold alphabets as symbols.
75
6. Conclusion Ford Motors Company has bought Volvo Cars Corporation including Volvo Cars Torslanda (VCT). The Ford Company applies a common manufacturing system to all its factories around the world called Ford Production System (FPS). The FPS system has been originally derived from the Lean Production system that fights against different kinds of wastes. One important part of the Lean manufacturing system is called Poka-Yoke system, which is a mistake proofing system and uses simple devices to prevent any mistake or find it in the very early stage of manufacturing. VCT has tried to apply this system in some of its manufacturing lines such as Door Lines, Battery Line and Line 1:07 The investigation results can be concluded as follows:
• Human-machine interaction has been the most critical problem of the last century. • More robotisation as the time goes by. • 100% robotisation would eliminate the human factor failure risk but still has its own
problem such as high cost of maintenance. The emphatic stress on this project was to investigate the Poka-Yoke system and to find the possible problem resulted from this system and come up with possible and rational solution for these problems. When it comes to the leadership and management issues, the lack of knowledge and not being updated for the new systems such as Lean manufacturing is obvious among the staff. The problem solving at VCT seems to be of short-term nature and almost no prevention or long-term solutions are considered. Even though the whole concept of Lean manufacturing is around prevention of the problems (not letting them happen), VCT has chosen to wait for the problems to happen and then come up with short-term solutions. It seems that they might have forgotten the fact that prevention would cost much less that the solution. The suggestion to prevent the problems is to improve the Lean thinking among staff besides using the Lean equipments currently employed, hence implementing the complete Lean concept, FPS in Ford terminology.

76
References Books: Akersten P.A & Holm G: Aspekter på Mänsklig Ttillförlitlighet, Sveriges mekanförbud, 1984 Allan Harrison & Remko van Hoek. Logistics Management and Strategy. Second edition England 2005 Andersson, H. Vetenskapteori och Metodlära. Lund: Studentlitteratur. 1994 Befring., E. Forskningsmetodik och Statistik. Lund: Studentlitteratur 1994 Bell, J. Introduktion till Forskningsmetodik. Lund: Studentlitteratur. 1995 Bengtsson, H. & Bengtsson, B-A Forskningsboken- Om konsten att arbeta på ett undersökande och kunskapande sätt. Uppsala: Almqvist & Wiksell Förlag AB. 1995 Bergman B & Klefsjö B. : Kvalitet från Behov till Användning, 3:e upplagan, studentlitteratur, Lund 2001 Carlzon J. I samarbete med Lagerström T.: Riv Pyramiderna!, Bonnier, Stockholm 1985 Dahström, K. Från Data Insamling till Rapport- Att göra en statistik undersökning Lund: Studentlitteratur. 1996 Holm & Solvang . Forskningsmetodik – Om kvalitativa och kvantitativa metoder 1991 Johansson-Lindfors, M.B Att Utveckla Kkunskap. Lund: Studentlitteratur 1993 Kotler P, Marketing Management, Prentece-Hall, New Jersey 1997 Lekvall & Walbin. Information för Marknadsföringsbeslut. Göteborg: IHM Förlag AB.1993 Pascal Dennis, Lean Production Simplified. Productivity Press. New York. 2002 Patel, R. & Davidsson, B. Forskningsmetodikens Grunder. Lund: Studentlitteratur. 1994 Ulrich, K. & Eppinger, S. Product Design and Development. New York: Mc Graw-Hill. 1995 Villemeur A.: Reliability, Availability, Manitainability and Safety Assessment, vol. 1: methods and techniques, John Wiley & Sons Ltd, West Sessex 1992 Electronic References Ford & Volvo Internal network 2007.01.20 - 2007.05.30
http://www.lean.org/WhatsLean/History.cfm 2007.04.15

77
http://searchcio.techtarget.com/sDefinition/0,,sid19_gci810519,00.html 2007.03.02 http://www.fpsvoc.ford.com/ 2007.02.21 http://www.jaguar.ford.com/manuf/manhome.htm 2007.05.18 http://www.it.volvocars.ford.com/vct_it/system.htm 2007.01.20 - 2007.05.30