quality management (pqm01) chapter 04 - quality...
TRANSCRIPT

Quality Management (PQM01)
Chapter 04 - Quality Control

Slide 1
_____________________________________________________________________________________
_____________________________________________________________________________________
_____________________________________________________________________________________
_____________________________________________________________________________________
_____________________________________________________________________________________
_____________________________________________________________________________________
_____________________________________________________________________________________
_____________________________________________________________________________________
_____________________________________________________________________________________
_____________________________________________________________________________________

Slide 2
Involves monitoring specific project results to determine if they comply with relevant quality standards, and identifying ways to eliminate causes of unsatisfactory results.
Performed throughout the project
Results in ability to eliminate or reduce causes of unsatisfactory performance
2v.7.0- © Copyright and all rights reserved –Looking Glass Development, LLC.
_____________________________________________________________________________________
_____________________________________________________________________________________
_____________________________________________________________________________________
_____________________________________________________________________________________
_____________________________________________________________________________________
_____________________________________________________________________________________
_____________________________________________________________________________________
_____________________________________________________________________________________
_____________________________________________________________________________________
_____________________________________________________________________________________

Slide 3
Juran defines Quality Control as – “The process through which we measure quality performance, compare it with quality goals, and act on the difference”.
3v.7.0- © Copyright and all rights reserved –Looking Glass Development, LLC.
_____________________________________________________________________________________
_____________________________________________________________________________________
_____________________________________________________________________________________
_____________________________________________________________________________________
_____________________________________________________________________________________
_____________________________________________________________________________________
_____________________________________________________________________________________
_____________________________________________________________________________________
_____________________________________________________________________________________
_____________________________________________________________________________________

Slide 4
Conformance Nonconformance
Prevention Planning Scrap Failure
Appraisal Training Rework
Auditing Expediting
TestingWarranty Service
Controlling Recalls
4v. 7.0 - © Copyright and all rights reserved –Looking Glass Development, LLC.
Cost of Quality
_____________________________________________________________________________________
_____________________________________________________________________________________
_____________________________________________________________________________________
_____________________________________________________________________________________
_____________________________________________________________________________________
_____________________________________________________________________________________
_____________________________________________________________________________________
_____________________________________________________________________________________
_____________________________________________________________________________________
_____________________________________________________________________________________

Slide 5
7 Basic Quality ToolsAlso know as 7QC Tools.Used within PDCA cycle to solve quality problems.They are:
5v. 7.0 - © Copyright and all rights reserved –Looking Glass Development, LLC.
• Cause-and-effect diagrams
• Flowcharts
• Checksheets • Pareto diagrams
• Histograms • Control charts
• Scatter diagrams
_____________________________________________________________________________________
_____________________________________________________________________________________
_____________________________________________________________________________________
_____________________________________________________________________________________
_____________________________________________________________________________________
_____________________________________________________________________________________
_____________________________________________________________________________________
_____________________________________________________________________________________
_____________________________________________________________________________________
_____________________________________________________________________________________

Slide 6
Key Concepts Prevention vs. Control
◦ Prevention – Aims to stop an event or failure from ever occurring
◦ Control – Attempts to limit the impact of a failure after it has happened
6v.7.0- © Copyright and all rights reserved –Looking Glass Development, LLC.
_____________________________________________________________________________________
_____________________________________________________________________________________
_____________________________________________________________________________________
_____________________________________________________________________________________
_____________________________________________________________________________________
_____________________________________________________________________________________
_____________________________________________________________________________________
_____________________________________________________________________________________
_____________________________________________________________________________________
_____________________________________________________________________________________

Slide 7
Key Concepts Attribute Sampling & Variable Sampling
◦ Attribute Sampling – Asks the question, does the attribute exist and is binary in nature?
◦ Variable Sampling – Addresses characteristics like how much and is numeric in nature
7v.7.0- © Copyright and all rights reserved –Looking Glass Development, LLC.
_____________________________________________________________________________________
_____________________________________________________________________________________
_____________________________________________________________________________________
_____________________________________________________________________________________
_____________________________________________________________________________________
_____________________________________________________________________________________
_____________________________________________________________________________________
_____________________________________________________________________________________
_____________________________________________________________________________________
_____________________________________________________________________________________

Slide 8
Key Concepts Special Causes vs. Random Causes
◦ Special Causes – Unusual events
◦ Random/Common Causes – Normal or expected variations
8v.7.0- © Copyright and all rights reserved –Looking Glass Development, LLC.
_____________________________________________________________________________________
_____________________________________________________________________________________
_____________________________________________________________________________________
_____________________________________________________________________________________
_____________________________________________________________________________________
_____________________________________________________________________________________
_____________________________________________________________________________________
_____________________________________________________________________________________
_____________________________________________________________________________________
_____________________________________________________________________________________

Slide 9
Key Concepts Tolerances & Control Limits
◦ Tolerances – Range of acceptable results
◦ Control Limits – Values that indicate if a process is in control
9v.7.0- © Copyright and all rights reserved –Looking Glass Development, LLC.
_____________________________________________________________________________________
_____________________________________________________________________________________
_____________________________________________________________________________________
_____________________________________________________________________________________
_____________________________________________________________________________________
_____________________________________________________________________________________
_____________________________________________________________________________________
_____________________________________________________________________________________
_____________________________________________________________________________________
_____________________________________________________________________________________
Slide 10
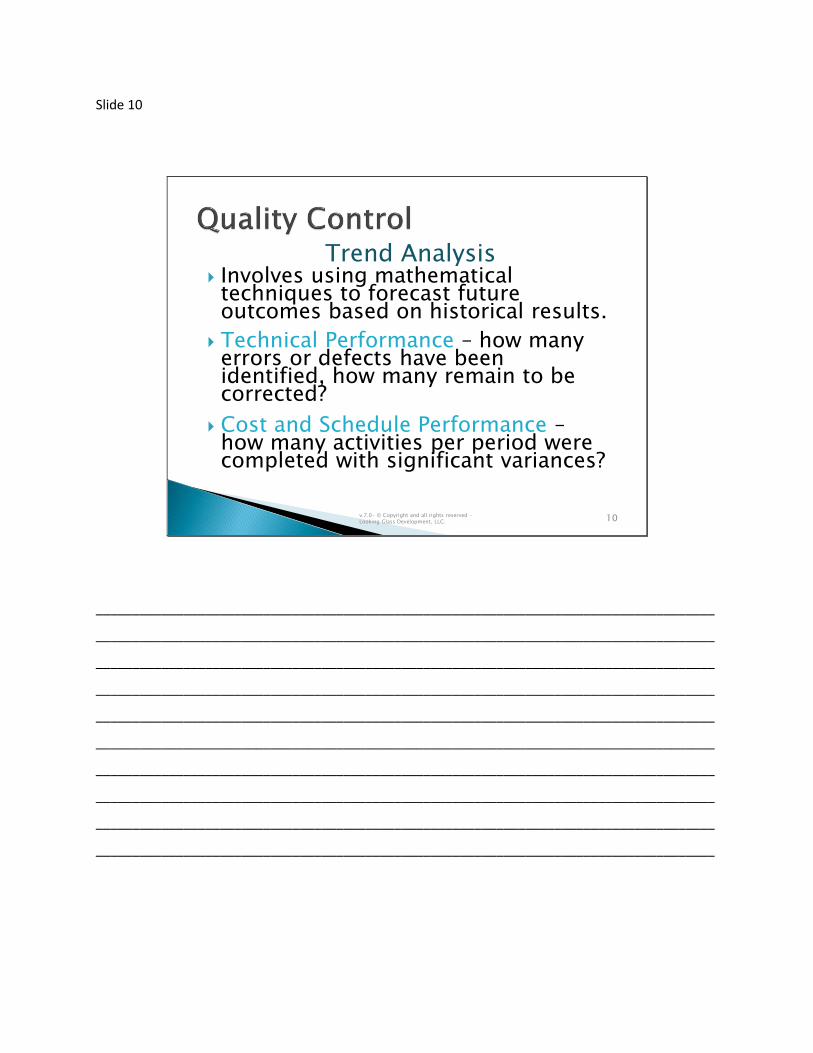
Trend Analysis Involves using mathematical techniques to forecast future outcomes based on historical results.
Technical Performance – how many errors or defects have been identified, how many remain to be corrected?
Cost and Schedule Performance –how many activities per period were completed with significant variances?
10v.7.0- © Copyright and all rights reserved –Looking Glass Development, LLC.
_____________________________________________________________________________________
_____________________________________________________________________________________
_____________________________________________________________________________________
_____________________________________________________________________________________
_____________________________________________________________________________________
_____________________________________________________________________________________
_____________________________________________________________________________________
_____________________________________________________________________________________
_____________________________________________________________________________________
_____________________________________________________________________________________

Slide 11
A Good Quality System Will Compare actuals to standards (inspection)
Act when standards are not met
Plan for improvements
11v.7.0- © Copyright and all rights reserved –Looking Glass Development, LLC.
_____________________________________________________________________________________
_____________________________________________________________________________________
_____________________________________________________________________________________
_____________________________________________________________________________________
_____________________________________________________________________________________
_____________________________________________________________________________________
_____________________________________________________________________________________
_____________________________________________________________________________________
_____________________________________________________________________________________
_____________________________________________________________________________________

Slide 12
Control Charts – Graphic display of the results of a process over time
◦ Based on statistical probability
◦Determine if a process is in control
◦ Verify the impact on a process when changes are made
12v.7.0- © Copyright and all rights reserved –Looking Glass Development, LLC.
_____________________________________________________________________________________
_____________________________________________________________________________________
_____________________________________________________________________________________
_____________________________________________________________________________________
_____________________________________________________________________________________
_____________________________________________________________________________________
_____________________________________________________________________________________
_____________________________________________________________________________________
_____________________________________________________________________________________
_____________________________________________________________________________________

Slide 13
Control Charts Key Terms A center line - designated with an “x”, which provides the average (x) of the process area.
An upper line designating the upper control limit (UCL).
13v.7.0- © Copyright and all rights reserved –Looking Glass Development, LLC.
_____________________________________________________________________________________
_____________________________________________________________________________________
_____________________________________________________________________________________
_____________________________________________________________________________________
_____________________________________________________________________________________
_____________________________________________________________________________________
_____________________________________________________________________________________
_____________________________________________________________________________________
_____________________________________________________________________________________
_____________________________________________________________________________________

Slide 14
Control Charts Key Terms The lower line designating the lower control limit (LCL)
Points outside of the UCL and LCL are indicative that the process is out of control and/or unstable
14v.7.0- © Copyright and all rights reserved –Looking Glass Development, LLC.
_____________________________________________________________________________________
_____________________________________________________________________________________
_____________________________________________________________________________________
_____________________________________________________________________________________
_____________________________________________________________________________________
_____________________________________________________________________________________
_____________________________________________________________________________________
_____________________________________________________________________________________
_____________________________________________________________________________________
_____________________________________________________________________________________

Slide 15
15v.7.0- © Copyright and all rights reserved –Looking Glass Development, LLC.
‘In Control’ – When ‘in control’ a process should not be adjusted
What is ‘out of control?
The ‘rule of 7’?
LCL
X
UCL
x
x
x
x
x
x
x
x
x
x
x
x
3ơ2ơ1ơ
-1ơ-2ơ-3ơ
_____________________________________________________________________________________
_____________________________________________________________________________________
_____________________________________________________________________________________
_____________________________________________________________________________________
_____________________________________________________________________________________
_____________________________________________________________________________________
_____________________________________________________________________________________
_____________________________________________________________________________________
_____________________________________________________________________________________
_____________________________________________________________________________________

Slide 16
Variations Normal – Common, random, naturally occurring◦ Found throughout the entire system
◦ Accounts for 85% of variation (Deming)◦ Management’s responsibility to correct
◦ Requires investigation and elimination or incorporation
16v.7.0- © Copyright and all rights reserved –Looking Glass Development, LLC.
_____________________________________________________________________________________
_____________________________________________________________________________________
_____________________________________________________________________________________
_____________________________________________________________________________________
_____________________________________________________________________________________
_____________________________________________________________________________________
_____________________________________________________________________________________
_____________________________________________________________________________________
_____________________________________________________________________________________
_____________________________________________________________________________________

Slide 17
Variations Abnormal – Assignable or special◦ Specific to material, machinery,
manpower, or method◦ Accounts for only 15% of variation◦ Location supervisor or worker should
correct
17v.7.0- © Copyright and all rights reserved –Looking Glass Development, LLC.
_____________________________________________________________________________________
_____________________________________________________________________________________
_____________________________________________________________________________________
_____________________________________________________________________________________
_____________________________________________________________________________________
_____________________________________________________________________________________
_____________________________________________________________________________________
_____________________________________________________________________________________
_____________________________________________________________________________________
_____________________________________________________________________________________

Slide 18
SIPOCSometimes called COPISTool that summarizes the inputs and outputs of one or more processes in table form. Acronym SIPOC stands for suppliers, inputs, process, outputs, and customers which form the columns of the table.First used in TQM programs.Used today in Six Sigma and Lean manufacturing.
18v. 7.0 - © Copyright and all rights reserved –Looking Glass Development, LLC.
_____________________________________________________________________________________
_____________________________________________________________________________________
_____________________________________________________________________________________
_____________________________________________________________________________________
_____________________________________________________________________________________
_____________________________________________________________________________________
_____________________________________________________________________________________
_____________________________________________________________________________________
_____________________________________________________________________________________
_____________________________________________________________________________________

Slide 19
SIPOC
19v. 7.0 - © Copyright and all rights reserved –Looking Glass Development, LLC.
Supplier CustomerProcessInput Output
Requirements &
Feedback Loop Requirements &
Feedback Loop
Requirements List
•______________
•______________
•______________
•______________
•______________
Measurements List
•______________
•______________
•______________
•______________
•______________
Requirements List
•______________
•______________
•______________
•______________
•______________
Measurements List
•______________
•______________
•______________
•______________
•______________
_____________________________________________________________________________________
_____________________________________________________________________________________
_____________________________________________________________________________________
_____________________________________________________________________________________
_____________________________________________________________________________________
_____________________________________________________________________________________
_____________________________________________________________________________________
_____________________________________________________________________________________
_____________________________________________________________________________________
_____________________________________________________________________________________

Slide 20
Pareto Diagrams – A histogram, ordered by frequency of occurrence, that shows how many results were generated by type of category of identified cause.
20v.7.0- © Copyright and all rights reserved –Looking Glass Development, LLC.
0
10
20
30
40
50
60
1 2 3 4 5 6
_____________________________________________________________________________________
_____________________________________________________________________________________
_____________________________________________________________________________________
_____________________________________________________________________________________
_____________________________________________________________________________________
_____________________________________________________________________________________
_____________________________________________________________________________________
_____________________________________________________________________________________
_____________________________________________________________________________________
_____________________________________________________________________________________

Slide 21
Pareto Diagrams – Can combine bar charts with Pareto Diagrams
21v.7.0- © Copyright and all rights reserved –Looking Glass Development, LLC.
40 100
30 Cumulative 75
Percentage
20 50
10 25
0 0
Impro
per
Rota
tion
Nois
e
Wobble
Pre
ssure
Axle
Caulk
ing
Case W
obble
s
Oth
er
Nu
mb
er
of
Defe
cti
ve C
ases
Perc
en
tag
e o
f D
efe
cti
ve C
ases
Car Problems
_____________________________________________________________________________________
_____________________________________________________________________________________
_____________________________________________________________________________________
_____________________________________________________________________________________
_____________________________________________________________________________________
_____________________________________________________________________________________
_____________________________________________________________________________________
_____________________________________________________________________________________
_____________________________________________________________________________________
_____________________________________________________________________________________

Slide 22
Statistical Sampling Terms Attribute – Either accept or reject
(% defective)
Variable – Anything measured (average measure)
Producer’s Risk – (alpha) chance of rejecting a good lot. Type II error.
22v.7.0- © Copyright and all rights reserved –Looking Glass Development, LLC.
_____________________________________________________________________________________
_____________________________________________________________________________________
_____________________________________________________________________________________
_____________________________________________________________________________________
_____________________________________________________________________________________
_____________________________________________________________________________________
_____________________________________________________________________________________
_____________________________________________________________________________________
_____________________________________________________________________________________
_____________________________________________________________________________________

Slide 23
Statistical Sampling Terms Consumer’s Risk – (Beta) chance of accepting a bad lot. Type I error.
Sampling Plan – Sample size (n) and acceptance criteria ( c )
23v.7.0- © Copyright and all rights reserved –Looking Glass Development, LLC.
_____________________________________________________________________________________
_____________________________________________________________________________________
_____________________________________________________________________________________
_____________________________________________________________________________________
_____________________________________________________________________________________
_____________________________________________________________________________________
_____________________________________________________________________________________
_____________________________________________________________________________________
_____________________________________________________________________________________
_____________________________________________________________________________________

Slide 24
Acceptance Sampling Process of evaluating a portion of the
product in a lot for the purpose of accepting or rejecting the entire lot.
Alternative to 0% or 100% inspection
Single or multiple samples
24v.7.0- © Copyright and all rights reserved –Looking Glass Development, LLC.
_____________________________________________________________________________________
_____________________________________________________________________________________
_____________________________________________________________________________________
_____________________________________________________________________________________
_____________________________________________________________________________________
_____________________________________________________________________________________
_____________________________________________________________________________________
_____________________________________________________________________________________
_____________________________________________________________________________________
_____________________________________________________________________________________

Slide 25
Advantages of Acceptance Sampling
Smaller inspection staff Less product damage Quicker decisions Less inspection errors Lower cost
25v.7.0- © Copyright and all rights reserved –Looking Glass Development, LLC.
_____________________________________________________________________________________
_____________________________________________________________________________________
_____________________________________________________________________________________
_____________________________________________________________________________________
_____________________________________________________________________________________
_____________________________________________________________________________________
_____________________________________________________________________________________
_____________________________________________________________________________________
_____________________________________________________________________________________
_____________________________________________________________________________________

Slide 26
Disadvantages of Acceptance Sampling
Sampling risks
Less information
26v.7.0- © Copyright and all rights reserved –Looking Glass Development, LLC.
_____________________________________________________________________________________
_____________________________________________________________________________________
_____________________________________________________________________________________
_____________________________________________________________________________________
_____________________________________________________________________________________
_____________________________________________________________________________________
_____________________________________________________________________________________
_____________________________________________________________________________________
_____________________________________________________________________________________
_____________________________________________________________________________________

Slide 27
Quality Circles 5 -15 workers who meet on a frequent basis to identify, discuss and solve productivity and quality problems
One member of the group acts as the liaison between management and the group
27v.7.0- © Copyright and all rights reserved –Looking Glass Development, LLC.
_____________________________________________________________________________________
_____________________________________________________________________________________
_____________________________________________________________________________________
_____________________________________________________________________________________
_____________________________________________________________________________________
_____________________________________________________________________________________
_____________________________________________________________________________________
_____________________________________________________________________________________
_____________________________________________________________________________________
_____________________________________________________________________________________

Slide 28
Quality Assurance – Applying the planned systematic quality activities to ensure that the project employs all processes needed to meet requirements.
Quality Control – Monitoring specific project results to determine whether they comply with relevant quality standards, and identifying ways to eliminate causes of unsatisfactory performance
28v.7.0- © Copyright and all rights reserved –Looking Glass Development, LLC.
_____________________________________________________________________________________
_____________________________________________________________________________________
_____________________________________________________________________________________
_____________________________________________________________________________________
_____________________________________________________________________________________
_____________________________________________________________________________________
_____________________________________________________________________________________
_____________________________________________________________________________________
_____________________________________________________________________________________
_____________________________________________________________________________________

Slide 29
29v.7.0- © Copyright and all rights reserved –Looking Glass Development, LLC.
Perform
Quality
Control
Perform
Quality
AssuranceContinuous
Improvement
Quality
Planning
_____________________________________________________________________________________
_____________________________________________________________________________________
_____________________________________________________________________________________
_____________________________________________________________________________________
_____________________________________________________________________________________
_____________________________________________________________________________________
_____________________________________________________________________________________
_____________________________________________________________________________________
_____________________________________________________________________________________
_____________________________________________________________________________________


Review Questions:
1. Which of the following statements concerning quality control is NOT true?
A. Quality control involves monitoring specific project results to determine if
they comply with relevant quality standards, and identifying ways to
eliminate causes of unsatisfactory results
B. Quality control is performed throughout the project
C. Quality control results in the ability to eliminate or reduce causes of
unsatisfactory performance
D. None; all of the above are true
2. Which of the following best describes the preventive aspect of quality control?
A. It attempts to limit the impact of a failure after it has happened
B. It aims to stop an event or failure from ever occurring
C. All of the above
D. None of the above
3. What type of sampling asks the question "does the attribute exist", and is binary
in nature?
A. Attribute sampling
B. Variable sampling
C. Both of the above
D. None of the above
4. When evaluating the causes of errors, what type explains outcomes that are
naturally occurring?
A. Type I errors
B. Type II errors
C. Random causes
D. Special causes
5. What term is used to describe the range of acceptable results?
A. Control limits
B. Tolerances
C. Special causes
D. Random causes

6. Who describes quality control as the process through which we measure quality
performance, compare it with quality goals, and act on the difference?
A. Deming
B. Crosby
C. Juran
D. Taguchi
7. What type of analysis involves using mathematical techniques to forecast future
outcomes based on historical results?
A. Technical analysis
B. Trend analysis
C. Performance analysis
D. None of the above
8. What kind of performance evaluates how many errors or defects have been
identified, or how many remain to be corrected?
A. Technical performance
B. Cost and schedule performance
C. Technical analysis
D. Trend analysis
9. Which of the following will a good quality control system do?
A. Compare actuals to standards (inspection)
B. Act when standards are not met
C. Plan for improvements
D. All of the above
10. Which of the following is used to describe a control chart?
A. Based on statistical probability
B. Determine if a process is in control
C. Verify the impact on a process when changes are made
D. All of the above
11. Which of the following is NOT a common name for the curve most often used to
describe a variable that is unaffected by other variables?
A. A normal distribution
B. A bell curve
C. A standard distribution
D. A Gaussian distribution

12. Which of the following terms is often used to describe the mid-point of the
distribution when examining a control chart?
A. The mean
B. X (with a line above it)
C. The centerline
D. All of the above
13. Which of the following terms is often used to describe the maximum allowable
value for a control chart?
A. Lower control limit
B. Upper control limit
C. Maximum value
D. Top value
14. Which of the following is NOT a term used to describe variations that account for
85% of the error?
A. Normal variation
B. Standard variation
C. Type II errors
D. Abnormal variation
15. A graph ordered by frequency of occurrence that shows how many results were
generated by type of category of identified cause is called what?
A. A histogram
B. A pareto diagram
C. A trend chart
D. A scatter diagram
16. Which of the following statistical sampling terms is used to describe a tested item
that is either accepted or rejected?
A. A variable
B. A sample plan
C. An attribute
D. None of the above

17. What kind of risk is involved when you are worried that you might accept product
that should be rejected?
A. Producer risk
B. Consumer risk
C. Project risk
D. Alpha risk
18. Which of the following is an advantage of acceptance sampling?
A. Less product damage
B. Quicker decisions
C. Less inspection errors
D. All of the above
19. Which of the following is NOT a characteristic of a quality circle?
A. It is usually made up of 5 -15 workers
B. The team meets on a frequent basis to identify, discuss, and solve
productivity and quality problems
C. One member of the group acts as the liaison between management and
the group
D. All of the above are characteristics of a quality circle
20. Which of the following statements defines quality control?
A. It is the application of planned systematic quality activities to ensure that
the project employs all processes needed to meet requirements
B. It is the monitoring of specific project results to determine whether they
comply with relevant quality standards, and identifying ways to eliminate
causes of unsatisfactory performance
C. Both statements define quality control
D. Neither statement defines quality control
21. In which of the following processes is continuous improvement most commonly
categorized?
A. Quality planning
B. Perform quality assurance
C. Perform quality control
D. All of the above

Answer Key:
1. D
Quality control involves monitoring specific project results to determine if they
comply with relevant quality standards, and identifying ways to eliminate causes
of unsatisfactory results. It is performed throughout the project and results in the
ability to eliminate or reduce causes of unsatisfactory performance.
2. B
Prevention, as a concept in quality management, is all about stopping an event
or failure from ever occurring within the project.
3. A
Attribute sampling and variable sampling are the two types of sampling
techniques. Attribute sampling asks if the attribute exists at the desired level or
value. It is a simple yes or no question.
4. C
Random causes are inherent in nature and are difficult to predict. However, they
account for only 85% of the errors.
5. B
Tolerances describe the limits and what you are willing to tolerate or accept, in
terms of the results.
6. C
Juran describes quality control as the process through which we measure quality
performance, compare it with quality goals, and act on the difference.
7. B
Trend analysis takes past values and using mathematical techniques forecasts
future outcomes based on historical trends.
8. A
Technical performance is a purely quantitative method for measuring results. It
focuses on how many defects have been identified and keeping track of how
many remain to be corrected.

9. D
By definition, according to Juran, a good quality control system will measure
quality performance, compare it with quality goals, act on the difference, and plan
for improvements.
10. D
A control chart is based on statistical probability and is used to determine if a
process is in control by establishing upper and lower control limits. It can also
verify the impact on a process when changes are made.
11. C
The curve that describes any independent variable with a nominal number of
cases that is distributed in a balanced or normal fashion is called a normal
distribution, a bell curve or a Gaussian distribution.
12. D
It is most commonly referred to as the mean of the distribution; it can also be
represented by an X with a line over it, or called the centerline of the distribution.
13. B
Within a control chart, the tolerances are defined by an upper and lower control
limit. These create the maximum and minimum allowable value.
14. D
Abnormal variation, assignable, or special variations account for only 15% of
differences and require the resource to take action. These are different than the
normal or standard variation that is also referred to as a type II error.
15. B
A pareto diagram is a bar chart representing occurrences of something, usually
errors. It is typically organized from left to right with the most commonly
occurring errors on the left.
16. C
An attribute is a variable that has a yes or no answer. It can be binary in nature
or it can be a target value that must be reached as a minimum.
17. B
Consumer risk is sometimes referred to as a type I error and represents the
likelihood of accepting a product that should be rejected.

18. D
Acceptance sampling allows the organization to test only a small portion of the
total products. This allows for less damage (e.g. fewer products tested), quicker
decisions, and fewer errors.
19. D
Quality circles are usually made up of 5-15 workers, require the team to meet on
a frequent basis to identify, discuss, and solve productivity and quality problems.
They often require that one member of the group acts as the liaison between
management and the group.
20. B
Quality control is the monitoring of specific project results to determine whether
they comply with relevant quality standards, and identifying ways to eliminate
causes of unsatisfactory performance.
21. B
Continuous improvement is part of the perform quality assurance process.