quality improvement plan - alabama department of...
TRANSCRIPT

Approved March 1, 2016
Quality Improvement Plan
Alabama Department of Public Health
April 2016 – March 2021

-2-
Table of Contents Section 1: Introduction 3
Section 2: QI Leadership and Organizational Structure 7
Section 3: Training 9
Section 4: Quality Improvement Initiatives 11
Section 5: Goals, Objectives, and Performance Measures 12
Section 6: Evaluation of QI Plan 14
Section 7: Communication 15
Section 8: Sustainability 16
APPENDIX A: Definitions 16
APPENDIX B: Plan-Do-Check-Act (PDCA) Cycle 21
APPENDIX C: Quality Improvement Tools 27
APPENDIX D: Quality Improvement Council Team Charter 32
APPENDIX E: Training Courses and Resources 34
APPENDIX F: Quality Improvement Submission and Reporting Forms 36
APPENDIX G: Storyboard Instructions and Template 38
APPENDIX H: QI Maturity Assessment Tool 43

-3-
Alabama Department of Public Health Quality Improvement Plan
Section 1: Introduction The Alabama Department of Public Health (ADPH) is committed to continuous quality improvement of its programs, services, and operations. To promote and achieve a quality culture, quality improvement (QI) must become second nature to all employees and be incorporated into the way our department does business on a daily basis. The Quality Improvement Plan (QI Plan) is a guidance document that supports the department’s culture of quality. The QI Plan, Community Health Assessment (CHA), the Alabama Community Health Improvement Plan (ACHIP), and the department’s strategic plan are aligned to achieve departmental goals. QI focuses on activities that are of highest priority in meeting the department’s strategic goals.
Quality ADPH continuously strives to ensure that:
• The services provided incorporate evidence-based effective practices. • The services are appropriate to each stakeholder’s needs, culturally sensitive,
and available when needed. • The stakeholders have the opportunity to provide input into the services delivered
and feedback regarding outcomes. • The services are provided in an efficient manner and incorporate customer
feedback. • Staff is trained in basic methods for evaluating and improving quality, is
empowered to contribute to decisions, and has the authority to work within and across program boundaries.
Quality Improvement Quality improvement (QI) in public health is the use of a deliberate and defined improvement process which is focused on activities that are responsive to community needs and improve population health incorporating lessons learned from evaluation.1 It requires staff commitment at all levels within an organization to infuse QI into public health practice and operations. Refer to Appendix A for additional definitions. The Plan-Do-Check-Act (PDCA) cycle of quality improvement is the process improvement model adopted for the department. The four phases in the PDCA cycle involve: 1 Minnesota Department of Health QI Plan, September 2014.
-4-
• Plan: Identifying and analyzing the problem. • Do: Developing and testing a potential solution. • Check: Measuring how effective the test solution was, and analyzing whether it
could be improved in any way. • Act: Implementing the improved solution fully.
The “Do” and “Check” phases are often repeated as the solution is refined, retested, re-refined and retested again. Refer to Appendix B for additional information about PDCA.
Continuous Quality Improvement and Quality Assurance Continuous quality improvement (CQI) and quality assurance (QA) are integral parts of the department’s quality management plan, but there are definitive differences in the two approaches. QA is a required process that seeks to evaluate compliance against an established set of standards. Performance is inspected and repaired or corrected when found to be below standards and results of the evaluation are communicated. QA typically focuses on individual performance. Standards and measures developed for QA can inform the QI process. CQI is a philosophy that allows the department to examine its processes and performance and create plans for improvement. In CQI, prevention, rather than inspection, is the primary method used. The focus is on improving processes and reducing variation of a process so that performance increases for all staff, even when standards are met. CQI emphasizes doing the right things right. If problems are identified, the attention is directed to the process, not the people.2 The process is never punitive towards any staff, individuals, or sites, and is solution focused.
Core Concepts of CQI • Quality is defined as meeting and/or exceeding the expectations of our
customers. • Success is achieved through meeting the needs of those we serve. • Most problems are found in processes, not in people. CQI does not seek to
blame, but rather to improve processes. • Unintended variation in processes can lead to unwanted variation in outcomes,
and therefore we seek to reduce or eliminate unwanted variation. • It is possible to achieve continual improvement through small, incremental
changes using the scientific method.
2 Quality Improvement and PDSA Cycle Self Learning Pack, Quality Insights of Pennsylvania, the Medicare Quality Improvement Organization for Pennsylvania, under contract with the Centers for Medicare & Medicaid Services (CMS), an agency of the U.S. Department of Health and Human Services

-5-
• Continuous improvement is most effective when it becomes a natural part of the way everyday work is done.
Comparison of Quality Assurance and Quality Improvement3
Quality Assurance Quality Improvement
Focus
• Catch “bad apples” – people or worker focus
• Eliminate the bad performers
• Detect problems • A program • Results-oriented • Evaluate the outcomes
• Examine and improve the processes
• Does not find fault • Integration into work • Process-oriented • Maintain standards/systems • Focus on best practices so
all can learn/benefit
Goal • Meet the minimal standards • Control • Identify the outliers
• Ongoing process improvement
• Breakthrough improvements • Identify the system
Who is Involved • Usually 1-2 individuals in the
organization • Committees
• Teams
Driven By
• Regulations • Accreditation • Knowledge of peers • Special cause variation • Statistical analysis
• Organization • Data • Knowledge of all • Common and special
causes examined • Revision of performance
When Occurs • Monthly or quarterly • Continuous
Other Differences
• No historical value or customer Input
• Assigned responsibility for monitoring indicators
• Asks “who?”
• Customer driven • Organization of a team
comprised of people that work in the process
• Asks “why?”
3 Guide to Implementing Quality Improvement Principles, Quality Partners of Rhode Island, prepared by Alliant | GMCF, the Medicare Quality Improvement Organization for Georgia, under contract with the Centers for Medicare & Medicaid Services (CMS), an agency of the U.S. Department of Health and Human Services.

-6-
Quality Improvement Activities QI activities emerge from a systematic and organized framework for improvement. This framework, adopted by leadership, will be understood, accepted and utilized throughout the organization, as a result of continuous education and involvement of staff at all levels in performance improvement. ADPH uses the Public Health Performance Management System for guidance in performance management. QI is one component of that model.
The five components are defined as follows:
• Visible Leadership is the commitment of senior management to a culture of quality that aligns performance management (PM) practices with the organization’s mission, regularly takes into account customer feedback, and enables transparency about performance between leadership and staff.
• Performance Standards are the establishment of organizational or system standards, targets, and goals to improve public health practices. Standards may be set based on national, state, or scientific guidelines, benchmarking against similar organizations, the public’s or leaders’ expectations, or other methods.

-7-
• Performance Measurement is the development, application, and use of performance measures to assess achievement of performance standards.
• Reporting Progress is the documentation and reporting of how standards and targets are met, and the sharing of such information through appropriate feedback channels.
• Quality Improvement (QI) is the establishment of a program or process to manage change and achieve quality improvement in public health policies, programs, or infrastructure based on performance standards, measures, and reports.4
QI involves two primary activities:
• Measuring and assessing performance through the collection and analysis of data.
• Conducting QI initiatives and taking action where indicated. QI tools that may be used to conduct these activities are described in Appendix C.
Section 2: QI Leadership and Organizational Structure
Leadership The QI Council provides leadership support and guidance to build capacity for QI efforts on all levels throughout the department. Specific activities of the QI Council include developing a comprehensive QI Plan, preparing the department to meet Public Health Accreditation Board (PHAB) standards related to QI, exchanging information about QI activities and resources, and providing support for QI projects. The QI Council consists of approximately 14 members, with representation from administration, bureau and division management, program management, and program staff. Additional ad-hoc members may be called to engage in QI activities on an as-needed basis. Current QI Council members are listed in the QI Council Team Charter in Appendix D. QI Council members serve staggered, two-year terms with a maximum of half of the membership rotating off every year. The QI Team Lead, Team Sponsor, and Team Facilitator are permanent members of the QI Council who jointly recruit Council members and establish the membership rotation process. QI Council members participate in scheduled meetings, QI trainings, and mentoring activities. The QI Council meets at least ten times per year. 4 Public Health Foundation, Performance Management Toolkit. Web address: http://www.phf.org/focusareas/performancemanagement/toolkit/Pages/PM_Toolkit_About_the_Performance_Management_Framework.aspx, accessed March 2015.

-8-
The responsibilities of the Council include:
• Implement, evaluate, and update the QI Plan. • Establish and implement a QI Project tracking and monitoring procedure. • Foster and support a culture of QI at ADPH. • Measure change in the culture of QI within the organization. • Review customer satisfaction feedback to identify opportunities for improvement. • Review QI performance indicators in the department’s Performance Dashboard
periodically to ensure progress toward specific, achievable QI goals and objectives.
• Disseminate information about quality and performance improvement results. • Improve the capacity of staff to use QI tools and processes to improve efficiency
and effectiveness of public health processes, programs, and interventions. • Inform and communicate QI progress and activities to leadership and staff.
Staff Roles and Responsibilities To achieve a department-wide QI culture, all employees must be actively involved and committed to applying QI principles and tools to daily work. Specific roles and responsibilities are listed below: Administration
• Provide leadership for department vision, mission, strategic plan and direction related to QI efforts.
• Promote a CQI learning environment for the department. • Maximize resources necessary to carry out QI training and projects.
QI Council
• Develop and monitor the department QI Plan and activities. • Participate in at least one QI and/or performance management training annually. • Advocate use of QI and encourage a culture of learning and CQI among
employees. • Provide guidance for QI projects.
Performance Improvement Manager (PIM)
• Support the department’s QI program. • Facilitate and provide administrative support for QI Council meetings and
activities. • Ensure PHAB accreditation requirements of the QI Plan are met. • Communicate QI plans and activities to leadership and staff. • Assist QI Council members in addressing problems encountered by QI project
teams. Bureau Directors
-9-
• Ensure training and implementation of QI activities within the Bureau. • Support employees in their work with QI activities. • Participate in QI project teams when requested. • Facilitate identification of projects or processes to improve and assist with
development of QI project proposals. • Communicate QI activities within the Bureau and department. • Provide feedback and input to QI Council to help shape future QI Plans.
Program Managers/Supervisors
• Encourage employees to participate in QI training and activities. • Initiate problem-solving processes and facilitate the selection of QI projects. • Facilitate the collection of data for QI projects. • Support QI project teams. • Keep Bureau Director apprised of QI activities.
All Employees
• Actively participate in basic training regarding PM and QI principles and tools. • Identify areas for process improvement and suggest potential QI projects. • Propose QI training needs to the QI Council. • Apply QI principles and tools to daily work. • Participate in QI projects. • Contribute and adapt to change.
Budget and Resource Allocation In 2010, ADPH received funding through the Centers for Disease Control and Prevention (CDC) National Public Health Improvement Initiative (NPHII) cooperative agreement to support performance management activities. With this funding and subsequent funding through the Preventive Health and Health Services (PHHS) Block Grant, resources have been allocated to implement PM activities and meet national accreditation standards of the Public Health Accreditation Board (PHAB). The Office of Performance Management (OPM) provides support in the form of planning, coordination, and facilitation of PM efforts. QI projects are carried out by staff in their respective program areas as they strive to meet the department’s performance improvement goals.
Section 3: Training Workforce QI training is essential to establishing a culture of CQI. Critical to the implementation of CQI is strengthening public health workforce capacity to apply QI methods within the organization. The following strategies will be used to train employees.
New Employees

-10-
• Completion of basic PM and QI training within six months of hire date as part of new employee onboarding.

-11-
Current Employees • Completion of basic PM and QI training. • Completion of training on basic QI tools.
Refer to Appendix E for training courses and resources.
Section 4: Quality Improvement Initiatives QI projects are encouraged at every level of the department. Each Bureau/Office/Area is encouraged to select at least one QI project annually that focuses on analyzing and improving processes, programs, or interventions directly related to the ADPH Strategic Plan, a Healthy People 2020 Topic Area or a Public Health Essential Services/PHAB Domain. This ensures an opportunity for employees to actively utilize QI training, gain confidence in analyzing and improving processes, and direct activities toward achieving ADPH’s mission and related goals. QI projects can be identified by employees at any level, but must be approved by the applicable Bureau/Office/Area Director. To facilitate identifying QI projects, a completed Aim Statement Template will be required with submission of the ADPH Quality Improvement Project Form to the QI Council. The initial Aim Statement and the “Plan” section of the QI Project Form are to be completed by the QI Team Lead prior to submission to the QI Council. The QI Project Form and the Aim Statement Template are in Appendix F. Contact the OPM for assistance, if needed.
• The Aim Statement requires the selection of a specific process with a beginning and end point and states key characteristics of the process that should be improved to benefit a specific audience. It also requires a baseline measurement. The process of completing the Aim Statement will enable employees to select specific, well-defined, and time-specific QI projects.
• The ADPH Quality Improvement Project Form is used to initiate engagement of
the QI Council in the QI project. Once reviewed by the QI Council, the QI Project Form will be used to monitor progress and document completion of the project. The QI Project Form is divided into four sections that facilitate the “Plan-Do-Check-Act” Cycle. The “Plan” section designates how the project aligns with ADPH’s Strategic Plan/Healthy People 2020/PHAB Domain, designates the Department Unit, states the both process and outcome measures, lists the QI Team members, the QI Team Lead, the action steps and the timeline. The “Do” section summarizes key action steps taken, the “Check” section describes the results of the action steps and information learned from the process and the “Act” section captures the next planned steps.
Both forms will be submitted via email to the QI Council address. Once submitted, a member of the Council is assigned as a Team Champion. The project is presented to

-12-
the Council by the Team Champion and the Council recommends changes or implementation of the project. Criteria used to prioritize projects will include alignment to agency priorities and originality of effort. The Team Champion will encourage the participation of appropriate QI Team members to ensure success. QI Team members should be diversified and have knowledge of and be directly involved in the process, program or service selected. The Team Champion will work with the QI Team Lead to mentor and assist. Examples of support activities by the Team Champion include the following:
• Assisting to complete a QI Team charter. • Linking to training and resources. • Reviewing action plan status and barriers. • Assisting to complete the storyboard.
QI project progress will be reviewed monthly by the Team Champion. The Team Champion will update the QI Council periodically to report progress, seek advice, and/or share results. The QI Team Lead may be invited to a Council meeting to provide project updates, report results, and share lessons learned. A storyboard for each successful QI project will be completed by the QI Team Lead. The storyboard will support QI Council efforts to share information about successful QI projects and to facilitate replication in other areas of the department, where applicable. The storyboard template and instructions can be found in Appendix G.
Section 5: Goals, Objectives, and Performance Measures The goals of the QI Council are as follows:
• Advance the culture of QI within ADPH. • Ensure an effective QI project tracking and monitoring procedure. • Use customer satisfaction data to inform opportunities for improvement. • Inform leadership and staff about quality and performance improvement results
and resources. • Improve the capacity of staff to use QI tools and processes to improve efficiency
and effectiveness of public health practice and operations. The goals, objectives, responsible persons/teams, timeframes, activities and performance measures are outlined in the following table.

-13-
Goals Objectives Responsible
Person/Team Timeframe Activities Performance
Measures 1. Advance the culture of QI within ADPH
1A. Market the importance of QI to staff
1B. Share results of QI activities with leadership and staff 1C. Measure change in the department’s QI culture
1A. Administration, QI Council, PIM, Bureau Directors, Program Managers/ Supervisors 1B. QI Council 1C. QI Council
1A. Quarterly 1B. Annual (target March) 1C. Bi-annual (target March)
1A1. Review and update QI webpage for employee and public use 1A2. Use ADPH publications, social media, storyboards and/or videos to promote QI 1B. Use ADPH publications, social media, storyboards and/or videos to promote QI 1C1. Conduct follow-up QI culture survey
1A1. Updated QI webpage
1A2. Examples of published articles, social media postings, storyboards, or videos 1B. Examples of published articles, social media postings, storyboards, or videos 1C.Follow-up QI Maturity Score
2. Ensure an effective QI project tracking and monitoring procedure
2. Evaluate and improve the tracking procedure
2. QI Council
2. Annual (target February)
2A. Obtain feedback from tracking procedure users 2B. Use feedback to improve procedure
2A. Feedback results 2B. Changes to procedures

-14-
Goals Objectives Responsible Person/Team
Timeframe Activities Performance Measures
3. Facilitate the collection and use of customer satisfaction data to inform opportunities for improvement
3A. Identify an opportunity for the collection of customer satisfaction data 3B. Support the collection and analysis of data 3C. Support use of data to identify opportunities for improvement 3D. Share the results of the customer satisfaction initiative
3A. QI Council, Bureau Directors 3B. QI Council 3C. QI Council, Initiative Lead 3D. QI Council, Initiative Lead
3A. As needed 3B. As needed 3C. As needed 3D. Annually
3A. Collaborate with Area and Bureau Directors to identify an opportunity to collect customer satisfaction data. 3B. Support the collection and analysis of data, as requested 3C. Support the review of data to determine opportunities for improvement 3D. Facilitate dissemination of results to leadership and staff
3A. Identify the opportunity
3B. Results of data collection and analysis 3C. Identified opportunity for improvement 3D. Disseminated results
4. Improve the capacity of staff to use QI tools and processes to improve efficiency and effectiveness of public health practice and operations
4A. Provide QI and/or PM education and training to department staff. 4B. Provide QI and/or PM education and training to new employees
4A. QI Council, Bureau Directors, Program Managers/ Supervisors 4B. QI Council, Bureau Directors, Program Managers/ Supervisors
4A. Annual (target November) 4B. Annual (target November)
4A1. Outline curriculum for basic PM and QI training for department staff 4A2. Promote and release basic training for department staff 4B1. Add basic training to new employee orientation process
4A. Curriculum 4A. Documentation of training completion by current staff 4B. Documentation of training completion by new employees
Section 6: Evaluation of QI Plan Progress toward meeting the QI Plan goals and objectives will be discussed by the QI Council and recommendations for improvement made as needed. This discussion will be documented in QI Council meeting minutes. The QI Plan will be reviewed annually by the QI Council. The effectiveness of the QI Plan will be measured through results from the bi-annual QI Maturity Survey that incorporates questions used to calculate the department’s QI Maturity score, a reflection of the department’s QI culture. See Appendix H for more

-15-
information about the QI Maturity Assessment Tool. The results of the QI Maturity survey will inform the QI Council of the effectiveness of the QI Plan implementation and achievement of the goals and objectives. Actions will be taken to improve the QI Plan based on progress reports, lessons learned, and QI Maturity survey results. The QI Council will present an annual report to the State Health Officer which summarizes:
• Information about cross-divisional QI projects. • Achievement on the comprehensive QI Maturity Score and data from the specific
survey questions. • Progress toward completing goals and objectives.
Section 7: Communication QI efforts and success will be recognized through various avenues. The promotion of additional strategies to build a culture of CQI throughout the department may be encouraged and communicated through these venues, as well. This communication plan is designed to help strengthen the linkages between existing activities and aid staff in understanding how each activity is connected to a bigger picture. A number of methods will be used to assure that regular and consistent communication occurs regarding PM and efforts within ADPH. These methods include, but are not limited to:
• Dissemination and promotion of the QI Plan to all staff.
• QI Council updates during staff and committee meetings and posting of meeting minutes on the department’s webpage.
• Ongoing presentations and trainings regarding QI project updates and/or QI
techniques and tools.
• Storyboard presentations and displays at meetings.
• Articles in the department newsletter, Alabama’s Health, or other publications.
• Information about QI efforts on social media sources (e.g., Facebook and Twitter).
• Resources and updates on the department’s QI webpage. As ADPH seeks to develop a culture of quality that encourages all staff to develop their own skills relative to QI, opportunities to recognize QI project teams and successes among peers and department leadership will be optimized.

-16-
Section 8: Sustainability Sustainability involves creating and building momentum to integrate QI processes into organizational routines utilized by all employees within the agency. To achieve long term growth in QI, the following approach will be undertaken to create an environment to sustain the agency’s QI Plan:
• Maintain a QI Council responsible for the QI Plan and attainment of goals and objectives.
• Provide regular communication to agency leadership and employees regarding
the QI Plan and activities.
• Integrate QI in training protocols for new employees and current employees.
• Review and update the QI Plan on a regular basis to support PHAB requirements and build QI performance within the agency.
• Contribute needed resources to ensure continuous growth in the department’s culture of QI.
APPENDIX A: Definitions Accreditation: According to the Public Health Accreditation Board (PHAB), accreditation is defined as:
• The development and acceptance of a set of national public health department accreditation standards;
• The development and acceptance of a standardized process to measure health department performance against those standards;
• The periodic issuance of recognition for health departments that meet a specified set of national accreditation standards; and
• The periodic review, refining, and updating of the national public health department accreditation standards and the process for measuring and awarding accreditation recognition.5
Alignment: Alignment is the consistency of plans, processes, information, resource decisions, actions, results and analysis to support key organization-wide goals.6 Community Health Assessment (CHA): A CHA is a systematic examination of the health status indicators for a given population that is used to identify key problems and assets in a community. The ultimate goal of a CHA is to develop strategies to address the community’s health needs and identified issues. A variety of tools and processes 5 Public Health Accreditation Board. Acronyms and Glossary of Terms, Version 1.5. Alexandria, VA. December 2013. 6 Baldrige National Quality Program. 2005.

-17-
may be used to conduct a community health assessment; the essential ingredients are community engagement and collaborative participation.7 All parties need to be actively involved to achieve true success. Community Health Improvement Plan (CHIP): A CHIP is a long-term, systematic effort to address public health problems on the basis of the results of CHA activities and the community health improvement process. A CHIP is typically updated every three to five years. 8 This plan is used by health and other governmental education and human service agencies, in collaboration with community partners, to set priorities and coordinate and target available resources. A CHIP is critical for developing policies and defining actions to target efforts that promote health. It should define the vision for the health of the community through a collaborative process and should address the gamut of strengths, weaknesses, challenges, and opportunities that exist in the community to improve the health status of that community. 9 Continuous Quality Improvement (CQI): CQI is an ongoing effort to increase an agency’s approach to manage performance, motivate improvement, and capture lessons learned in areas that may or may not be measured as part of accreditation. The primary goals are to improve the efficiency, effectiveness, quality, or performance of services, processes, capacities, and outcomes.10 Employees need to be encouraged to have a voice and bring to the attention of supervisory staff ideas for improved efficiency. Customer/Client Satisfaction: Customer or client satisfaction is the degree of satisfaction provided as defined by that person or group receiving a service.11 Customer satisfaction is a measure of how products and services supplied by an organization meet or surpass customer expectations. Customer satisfaction is the number of customers, or percentage of total customers, whose reported experience with an entity, its products, or its services (ratings) exceeds specified satisfaction goals.12 Customer/client satisfaction goals, by definition, are fluid and changing based upon the changing needs of the customer/client. Data: Data is factual information (as measurements or statistics) used as a basis for reasoning, discussion, or calculation. Data is information in numerical form that can be digitally transmitted or processed.13 Goals: The term “goals” refers to a future condition or performance level that one intends to attain. Goals can be both short- and longer-term. Goals are ends that guide
7 Turnock, B. Public Health: What It Is and How It Works. Jones and Bartlett, 2009 8 http://www.cdc.gov/stltpublichealth/cha/plan.html 9 Adapted from: United States Department of Health and Human Services, Healthy People 2010. Washington, DC 10 Centers for Disease Control and Prevention, National Public Health Performance Standards Program and Public Health Foundation. (2007). Acronyms, Glossary, and Reference Terms. 11 www.businessdictionary.com/definition/customer-satisfaction.html 12 Farris PW, Bendle NT, Pfeiffer PE, ReibsteinDJ. (2010). Marketing Metrics: The Definitive Guide to Measuring Marketing Performance. Upper Saddle River, NJ: Pearson Education, Inc. 13 Merriam-Webster Online. Data – Definition and More. Online:http://www.merriam-webster.com/dictionary /data

-18-
actions. Quantitative goals frequently referred to as “targets,” include a numerical point or range.14 Objectives: Objectives are targets for achievement through interventions. Objectives are time limited and measurable in all cases. Various levels of objectives for an intervention include outcome, impact, and process objectives.
• An outcome objective is long term (greater than three years) and measurable. • An impact objective is short term (less than three years) and measurable. • A process objective is short term and measurable. Process objectives may be
evaluated by audit, peer review, accreditation, certification or administrative surveillance. 15
Action steps drive toward an objective. Objectives in turn drive toward a goal. Performance Dashboard: The Performance Dashboard is a web-based application which allows users across ADPH to report and monitor performance based on a variety of performance measures that are aligned with the department mission and priorities. Performance Management: Performance Management uses data for decision-making, by setting objectives, measuring and reporting progress toward those objectives, and engaging in QI activities when desired progress toward those objectives is not being made. Performance Management System: A fully functioning performance management system that is completely integrated into health department daily practice at all levels includes: 1) setting organizational objectives across all levels of the ADPH, 2) identifying indicators to measure progress toward achieving said objectives on a regular basis, 3) identifying responsibility for monitoring progress and reporting, and 4) identifying areas where achieving objectives requires focused QI processes. 16 Performance Measure: A performance measure is a numeric description of an agency’s work and the results of that work. Performance measures are based on data, and tell a story about whether an agency or activity is achieving its objectives and if progress is being made toward attaining policy or organizational goals.17 A performance measure is the specific quantitative representation of a capacity, process, or outcome deemed relevant to the assessment of performance. 18 Performance measures can be categorized into three main categories
• Process: How much did we do? • Structure/Capacity: How well did we do it?
14 Baldrige Performance Excellence Program. (2002). Goals. Baldrige Business, Public Sector, and other Nonprofit Glossary 15 Turnock, BJ. (2009). Public Health: What It Is and How It Works. 4th ed. Sudbury, MA: Jones and Bartlett. 16 Public Health Accreditation Board. (2011). Standards and Measures Version 1.0. PHAB: Alexandria, VA. Online: http://www.phaboard.org/wp-content/uploads/PHAB-Standards-and-Measures-Version-1.0.pdf 17 State of Washington, Office of Financial Management, Performance Measure Guide, Budget Division, August 2009, Accessed at http://www.ofm.wa.gov/budget/instructions/other/2009performancemeasureguide.pdf, March 2015. 18 Based on: National Research Council. E. B. Perrin, J. S. Durch, and S. M. Skillman,eds., Health Performance Measurement in the Public Sector: Principles and Policies for Implementing an Information Network. (Washington D.C.: National AcademyPress, 1999).

-19-
• Impact/Outcome: Is anyone (the customer) better off?19 Plan-Do-Check-Act (PDCA): PDCA refers to the process of continual improvement and learning proposed by Walter Shewhart and espoused by W. Edwards Deming. The four stages of the PDCA cycle: Plan – the change to be tested or implemented; Do – carry out the test or change; Check – data before and after the change and reflect on what was learned; Act – plan the next change cycle or full implementation. This is sometimes referred to as the Plan-Do-Study-Act (PDSA) cycle, Deming cycle, or Shewhart cycle. Refer to Appendix B for more information. Public Health Accreditation Board (PHAB): The Public Health Accreditation Board is the national accrediting organization for public health departments. A nonprofit organization, PHAB is dedicated to advancing the continuous quality improvement of Tribal, state, local and territorial public health departments. PHAB is working to promote and protect the health of the public by advancing the quality and performance of all public health departments in the United States through national public health department accreditation.20 Quality Improvement (QI): Quality improvement in public health is the use of a deliberate and defined improvement process, such as Plan-Do-Check-Act, which is focused on activities that are responsive to community needs and improving population health. It refers to a continuous and ongoing effort to achieve measurable improvements in the efficiency, effectiveness, performance, accountability, outcomes, and other indicators of quality in services or processes which achieve equity and improve the health of the community.21 Quality Improvement Culture: The culture of an organization is the embodiment of the core values, guiding principles, behaviors, and attitudes that collectively contribute to its daily operations. 22 When a quality culture is achieved, all employees, from senior leadership to frontline staff, have infused QI into the way they do business daily. Employees continuously consider how processes can be improved, and QI is no longer seen as an additional task but a frame of mind in which the application of QI is second nature. Leadership commitment, QI infrastructure, employee empowerment, customer focus, teamwork and collaboration, and continuous process improvements are the foundational elements of a culture of quality.23 Quality Improvement Plan: The QI Plan is a guidance document indicating the 19 Mark Friedman, “Trying Hard is Not Good Enough”, How to Produce Measurable Improvements for Suctomers and Communities, 2005. 20 Public Health Accreditation Board. Guide to National Public Health Department Accreditation Version 1.0. Alexandria, VA, May 2011 21 Riley WJ, Moran JW, Corso LC, Beitsch LM, Bialek R, and Cofsky A. (2010). Defining Quality Improvement in Public Health. Journal of Public Health Management and Practice 16(1), 5-7. 22 Delmarva Foundation. (2003). Healthcare Quality Improvement and Organizational Culture. Easton, MD: Boan, D. & Funderburk, F. 23National Association of County and City Health Officials (NACCHO) Roadmap to a Culture of Quality. http://qiroadmap.org/culture-to-qi/foundational-elements-for-building-a-qi-culture/, accessed March 2015.

-20-
direction, timeline, activities, and importance of quality and QI in the organization. The plan identifies specific areas of current operational performance for improvement within the agency. The QI Plan is revised to reflect accomplishments, lessons learned, and changing organizational priorities.24 Stakeholder: Stakeholders are all persons, agencies and organizations with an investment or 'stake' in the health of the community and the local public health system. This broad definition includes persons and organizations that benefit from and/or participate in the delivery of services that promote the public's health and overall well-being.25 Strategic Plan: A strategic plan results from a deliberate decision-making process and defines where an organization is going. The plan sets the direction for the organization and, through a common understanding of the mission, vision, goals, and objectives, provides a template for all employees and stakeholders to make decisions that move the organization forward.26
24 Kane T, Moran JW, and Armbruster S. (2010). Developing a Health Department Quality Improvement Plan. Public Health Foundation. Online: http://www.phf.org/resourcestools/documents/developing_a_quality_improvement_plan.pdf. 25 National Association of County and City Health Officials (US). Mobilizing for Action through Planning and Partnerships (MAPP): Achieving Healthier Communities through MAPP, A User’s Handbook. 2001 http://www.naccho.org/topics/infrastructure/mapp/upload/MAPP_Handbook_fnl.pdf 26 Swayne LE, Duncan WJ, and Ginter PM. (2008). Strategic Management of Health Care Organizations. Jossey-Bass: New Jersey.

-21-
APPENDIX B: Plan-Do-Check-Act (PDCA) Cycle
Source: National Network of Public Health Institutes Public Health Improvement Webinar Series, The Quality Improvement Tool Kit, broadcast March 3, 2015, accessed at https://cc.readytalk.com/cc/playback/Playback.do?id=b4s8xk, March 2015.
The ABCs of PDCA Grace Gorenflo and John W. Moran27
The Public Health Accreditation Board’s (PHAB) voluntary accreditation program emphasizes the importance of quality improvement, and has catalyzed health department activity in this arena. The Accreditation Coalition, comprising national public health leaders, defines quality improvement in public health as the following:
“Quality improvement in public health is the use of a deliberate and defined improvement process, such as Plan-Do-Check-Act, which is
27 Grace Gorenflo is Director, Accreditation Preparation and Quality Improvement, NACCHO and John W. Moran is Senior Quality Advisor to the Public Health Foundation and a Senior Fellow at the University of Minnesota School of Public Health in the Division of Health Policy and Management

-22-
focused on activities that are responsive to community needs and improving population health. It refers to a continuous and ongoing effort to achieve measurable improvements in the efficiency, effectiveness, performance, accountability, outcomes, and other indicators of quality in services or processes which achieve equity and improve the health of the community.”28
The Plan-Do-Check-Act cycle (PDCA) has been embraced as an excellent foundation for, and foray into, quality improvement for public health departments, as it is both simple and powerful. Its simplicity comes from the systematic, straightforward and flexible approach that it offers. Its power is derived from its reliance on the scientific method, i.e., it involves developing, testing, and analyzing hypotheses. This foundation offers a means to become comfortable with a host of quality improvement methods and techniques, and to progressively evolve into addressing more complex problems, employing additional QI tools, and migrating to system-wide approaches to QI.
PDCA is based on the “Shewhart cycle,” and was made popular by Dr. W. Edwards Deming, considered by many to be the father of modern quality control.29 During his lectures in Japan in the early 1950s, Deming noted that the Japanese participants shortened the cycle’s steps to the now traditional plan, do, check and act. It is interesting to note that Deming preferred plan, do, study, act because the translation of "study" from Japanese to English has connotations closer to Shewhart's intent than does "check."30 This model has been around for 60 years and it is relevant in today’s public health world, providing a defined and well tested process to achieve lasting improvement to the problems and challenges public health is now facing.
Spending adequate time in each phase of the PDCA cycle is imperative to having a smooth and meaningful quality improvement process. The elements put forth here comprise a deliberate process based on the scientific method, and help ensure that improvement efforts are conducted in a way that will maximize the degree of success achieved.
Before beginning the PDCA process, it is important to assemble the team that will participate and to develop a communications plan about the effort.
Assemble the team PDCA involves a team approach to problem solving. To begin, designate a team leader and team members, and address the following questions:
• Do we have the right people (i.e., those who are directly involved with the area needing improvement)?
28 This definition was developed by the Accreditation Coalition Workgroup (Les Beitsch, Ron Bialek, Abby Cofsky, Liza Corso, Jack Moran, William Riley, and Pamela Russo) and approved by the Accreditation Coalition on June 2009. 29 http://en.wikipedia.org/wiki/PDCA - accessed 12/2/2009 30 http://en.wikipedia.org/wiki/PDCA - accessed 12/2/2009

-23-
• Does the team need training? • Who will facilitate the team and process?
Another key step is to develop a team charter31, which serves to provide focus and clarity regarding the team’s work. Additional resources on tending to teams as they move through the PDCA process may prove useful to optimize the team’s performance.32
Communication plan Those involved with or impacted by improvements must be kept informed of the changes, timing, and status of the quality improvement project. It’s important to establish a communication plan at the outset of the improvement effort, and to communicate and post progress on a regular basis, in a highly visible location, for all to see. Storyboards33 offer a cogent picture of key points in the PDCA cycle, and can be an effective venue to tell the story as the team moves through its improvement work.
Phases of the PDCA Model
The phases of the PDSA model below assume that just one underlying, or root, cause will be addressed by testing just one intervention. When undertaking the PDCA process, the team may decide to address more than one root cause, and/or to test more than one intervention to address a root cause. In such instances, it will be important to measure the effect of each intervention on the root cause it is intended to address.
Plan: The purpose of this phase is to investigate the current situation, fully understand the nature of any problem to be solved, and to develop potential solutions to the problem that will be tested.
1. Identify and prioritize quality improvement opportunities. Usually a team will find that there are several problems, or quality improvement opportunities, that arise when programs or processes are investigated. A prioritization matrix34 may help in determining which one to select. Once the quality improvement opportunity has been decided, articulate a problem statement. Revisit and, as appropriate, revise the problem statement as you move through the planning process.
31 J. Moran and G. Duffy. Team Chartering. Quality Texas Newsletter, April 10, 2010 (available at www.naccho.org/toolbox/ in the Quality Improvement Toolkit) 32 Team Assessment, team charter, team manager self-assessment, team process review checklist, and T. Kuras and J. Moran. 20 Questions to Ask Your Team. The Quality Management Forum, Winter Edition, Vol. 23, Number 4, 1997 are all available at www.naccho.org/toolbox/ in the Quality Improvement Toolkit 33 A number of national efforts to support QI in public health have used a storyboard format that was developed by the Michigan department of public health and can be accessed at http://nnphi.org/CMSuploads/Storyboard-Guidelines-FINAL-05868.pdf (accessed 3/26/10) 34 Bialek, R., Duffy, G. L., Moran, J. W. (2009). The Public Health Quality Improvement Handbook. Milwaukee, WI: ASQ Quality Press. This resource contains all of the quality improvement tools mentioned in this paper.

-24-
2. Develop an AIM statement35 that answers the following questions:
a. What are you seeking to accomplish? b. Who is the target population? c. What is the specific, numeric measure(s) you are seeking to achieve? d. The measurable improvement objective is a key component of the entire
quality improvement process. It’s critical to quantify the improvement you are seeking to achieve. Moreover, the entire aim statement also will need to be revisited and refined as you move through the planning phase.
3. Describe the current process surrounding the problem in order to
understand the process and identify areas for improvements. Flow charts and value stream mapping are two examples of methods to accomplish this.
4. Collect data on the current process. Baseline data that describe the current
state are critical to further understanding the process and establishing a foundation for measuring improvements. The data may address, for example, time, people, space, cost, number of steps, adverse events, and customer satisfaction. A host of tools are available to collect and interpret data on the process, such as Pareto charts, histograms, run charts, scatter plots and control charts. The data collected must be aligned with the measures listed in the aim statement.
5. Identify all possible causes of the problem and determine the root cause.
While numerous causes will emerge when examining the quality improvement opportunity, it is critical to delve in and carefully identify the underlying, or root, cause of the problem, in order to ensure that an improvement or intervention with the greatest chance of success is selected. Brainstorming is a useful way to identify possible causes and a cause and effect/fishbone diagram and the 5 Whys are useful for determining the actual root cause.
6. Identify potential improvements to address the root cause, and agree on
which one to test. Once the improvement has been determined, carefully consider any unintended consequences that may emerge as a result of the implementing improvement. This step provides an opportunity to alter the improvement and/or develop countermeasures as needed to address any potential unintended consequences. Revisiting the aim statement and revising the measurable improvement objectives are important steps at this point.
7. Develop an improvement theory. An improvement theory36 is a statement
that articulates the effect that you expect the improvement to have on the
35 http://www.accreditation.localhealth.net/MLC-2%20website/Michigans_QI_Guidebook.pdf - accessed 3/26/10

-25-
problem. Writing an improvement theory crystallizes what you expect to achieve as a result of your intervention, and documents the connection between the improvement you plan to test and the measurable improvement objective.
8. Develop an action plan indicating what needs to be done, who is responsible,
and when it should be completed. The details of this plan should include all aspects of the method to test the improvements – what data will be collected, how frequently data are collected, who collects the data, how they are documented, the timeline, and how results will be analyzed.
Do: The purpose of this phase is to implement the action plan.
1. Implement the improvement. 2. Collect and document the data. 3. Document problems, unexpected observations, lessons learned and
knowledge gained. Check/Study: This phase involves analyzing the effect of the intervention. Compare the new data to the baseline data to determine whether an improvement was achieved, and whether the measures in the aim statement were met. Pareto charts, histograms, run charts, scatter plots, control charts and radar charts are all tools that can assist with this analysis.
1. Reflect on the analysis, and consider any additional information that
emerged as well. Compare the results of your test against the measurable objective.
2. Document lessons learned, knowledge gained, and any surprising results that emerged.
Act: This phase marks the culmination of the planning, testing, and analysis regarding whether the desired improvement was achieved as articulated in the aim statement, and the purpose is to act upon what has been learned. Options include:
1. Adopt: Standardize the improvement if the measurable objective in the aim
statement has been met. This involves establishing a mechanism for those performing the new process to measure and monitor benchmarks on a regular basis to ensure that improvements are maintained. Run charts or control charts are two examples of tools to monitor performance.
2. Adapt: The team may decide to repeat the test, gather different data,
revise the intervention, or otherwise adjust the test methodology. This might occur, for example, if sufficient data weren’t gathered, circumstances
36 Ibid.

-26-
have changed (e.g., staffing, resources, policy, environment, etc.), or if the test results fell somewhat short of the measurable improvement goal. In this case, adapt the action plan as needed and repeat the “Do” phase.
3. Abandon: If the changes made to the process did not result in an
improvement, consider lessons learned from the initial test, and return to the “Plan” phase. At this point the team might revisit potential solutions that were not initially selected, or delve back into a root cause analysis to see if additional underlying causes can be uncovered, or even reconsider the aim statement to see if it’s realistic. Whatever the starting point, the team will then need to engage in the Plan cycle to develop a new action plan, and move through the remaining phases.
PDCA offers a data-based framework based on the scientific method. This simple yet powerful format drives continuous and ongoing efforts to achieve measurable improvements in the efficiency, effectiveness, performance, accountability, outcomes, and other indicators of quality in services or processes which achieve equity and improve the health of the community. Source: http://www.phf.org/resourcestools/Documents/ABCs_of_PDCA.pdf, accessed March 2015.

-27-
APPENDIX C: Quality Improvement Tools Following are some of the tools available to assist in the Quality Improvement process. a. Affinity Diagram: The Affinity Diagram is often used to group ideas generated by
brainstorming. It is a tool that gathers large amounts of language data (ideas, issues, opinions) and organizes them into groupings based on their natural relationship. The affinity process is a good way to get people who work on a creative level to address difficult, confusing, unknown or disorganized issues. The affinity process is formalized in a graphic representation called an affinity diagram. This process is useful to:
1) Sift through large volumes of data. 2) Encourage new patterns of thinking.
As a rule of thumb, if less than 15 items of information have been identified, the affinity process is not needed. More information about this tool can be found at this web address: http://asq.org/learn-about-quality/idea-creation-tools/overview/affinity.html
b. Brainstorming: A tool used by teams to bring out the ideas of each individual and
present them in an orderly fashion to the rest of the team. Essential to brainstorming is to provide an environment free of criticism. Team members generate issues and agree to defer judgment on the relative value of each idea. Brainstorming is used when one wants to generate a large number of ideas about issues to tackle, possible causes, approaches to use, or actions to take. The advantages of brainstorming are that it:
1) Encourages creativity. 2) Rapidly produces a large number of ideas. 3) Equalizes involvement by all team members. 4) Fosters a sense of ownership in the final decision as all members actively
participate. 5) Provides input to other tools: “brain stormed” ideas can be put into an affinity
diagram or they can be reduced by multi-voting. More information about this tool can be found at this web address:
http://www.health.state.mn.us/divs/opi/qi/toolbox/brainstorm.html c. Cause and Effect Diagram (also called a fishbone or Ishakawa diagram): This
is a tool that helps identify, sort, and display. It is a graphic representation of the relationship between a given outcome and all the factors that influence the outcome. This tool helps to identify the basic root causes of a problem. The structure of the diagram helps team members think in a very systematic way. The benefits of a cause-and-effect diagram are that it:
1) Helps the team to determine the root causes of a problem or quality characteristic using a structured approach
2) Encourages group participation and utilizes group knowledge of the process

-28-
3) Uses an orderly, easy-to-read format to diagram cause-and-effect relationships
4) Indicates possible causes of variation in a process Increases knowledge of the process
5) Identifies areas where data should be collected for additional study.
Cause and effect diagrams allow the team to identify and graphically display all possible causes related to a process, procedure, or system failure. More information about this tool can be found at this web address: http://www.health.state.mn.us/divs/opi/qi/toolbox/fishbone.html d. Control Chart: A control chart is a statistical tool used to distinguish between
variation in a process resulting from common causes and variation resulting from special causes. It is noted that there is variation in every process, some the result of causes not normally present in the process (special cause variation). Common cause variation is variation that results simply from the numerous, ever-present differences in the process. Control charts can help to maintain stability in a process by depicting when a process may be affected by special causes. The consistency of a process is usually characterized by showing if data fall within control limits based on plus or minus specific standard deviations from the center line. Control charts are used to:
1) Monitor process variation over time 2) Help to differentiate between special and common cause variation 3) Assess the effectiveness of change on a process 4) Illustrate how a process performed during a specific period.
Using upper control limits (UCLs) and lower control limits (LCLs) that are statistically computed, the team can identify statistically significant changes in performance. This information can be used to identify opportunities to improve performance or measure the effectiveness of a change in a process, procedure, or system. More information about this tool can be found at this web address: http://www.health.state.mn.us/divs/opi/qi/toolbox/controlchart.html
65%
70%
75%
80%
85%
90%
Perc
ent C
ompli
ance
2nd QTR 973rd QTR 97
4th QTR 971st QTR 98
2nd QTR 983rd QTR 98
4th QTR 981st QTR 99
2ND QTR 993RD QTR 99
4th QTR 99
Quarters
Pilgrim Psychiatric Center Control Chart
UCL
LCL
UndesiredOutcome
POLICIES &PROCEDURES(PROCESSES)
SUPPLIES,EQUIPMENT &
MATERIALS
CAUSE & EFFECT DIAGRAM
PHYSICALENVIRONMENT
OTHERAREAS
Security problems
Unsafe conditions
No policies present
conflicting policies
Insufficient suppliesHuman
Resources
Human Error
Staffing
Competency
inadequate policies
not available

-29-
e. Decision-making Tools: While not all decisions are made by teams, two tools can
be helpful when teams need to make decisions. 1) Multi-voting is a group decision-making technique used to reduce a long list
of items to a manageable number by means of a structured series of votes. The result is a short list identifying what is important to the team. Multi-voting is used to reduce a long list of ideas and assign priorities quickly with a high degree of team agreement. More information about this technique can be found at this web address: http://asq.org/learn-about-quality/decision-making-tools/overview/multivoting.html
2) Nominal Group technique is used to identify and rank issues. It is a structured method for group brainstorming that encourages contributions from everyone. More information about this technique can be found at this web address: http://asq.org/learn-about-quality/idea-creation-tools/overview/nominal-group.html
f. Five Whys and Five Hows: The five whys and five hows constitute a questioning
process designed to drill down into the details of a problem or a solution and peel away the layers of symptoms.37 More information about these tools can be found at this web address: http://asq.org/healthcare-use/why-quality/five-whys.html
g. Flow Charting: Flow charting allows the team to identify the actual flow-of-event
sequence in a process. This tool is particularly useful in the early stages of a project to help the team understand how the process currently works. The “as-is” flow chart may be compared to how the process is intended to work. At the end of the project, the team may want to then re-plot the modified process to show how the redefined process should occur. The benefits of a flow chart are that it:
1) Is a pictorial representation that promotes understanding of the process.
2) Is a potential training tool for employees. 3) Clearly shows where there are problem areas and processes for
improvement. More information about this tool can be found at this web address: http://www.health.state.mn.us/divs/opi/qi/toolbox/flowchart.html
h. Force Field Analysis: A force field analysis helps a team study a problem's
positives and negatives, and how they impact resolving that problem. It can present pros and cons in an easy comparison, allowing for consensus and collective decision-making.38 More information about this tool can be found at this web
37 ASQ (American Society for Quality), Quality in Healthcare - Tools. Accessed at http://asq.org/healthcare-use/links-resources/tools.html, March 2015 38 Minnesota Department of Health, QI Toolbox, accessed at http://www.health.state.mn.us/divs/opi/qi/toolbox/, March 2015
Process
Decision
Document
Data
Predefined process
Preparation
Terminator
FLOW CHART SYMBOLS
Yes
No

-30-
address: http://www.health.state.mn.us/divs/opi/qi/toolbox/forcefield.html i. Histogram: This is a vertical bar chart which depicts the distribution of a data set at
a single point in time. A histogram facilitates the display of a large set of measurements presented in a table, showing where the majority of values fall in a measurement scale and the amount of variation. The histogram is used in the following situations:
1) To graphically represent a large data set by adding specification limits one can compare.
2) To process results and readily determine if a current process was able to produce positive results which assists with decision-making.
More information about this tool can be found at the web address: http://asq.org/learn-about-quality/data-collection-analysis-tools/overview/histogram.html
j. Pareto Chart: Named after the Pareto Principle which indicates that 80% of the
trouble comes from 20% of the problems. It is a series of bars on a graph, arranged in descending order of frequency. The height of each bar reflects the frequency of an item. Pareto charts are useful throughout the performance improvement process by helping to identify which problems need further study, which causes to address first, and which are the “biggest problems.” Benefits and advantages include:
1) Allows focus on the most important factors and helps to build consensus. 2) Allows for allocation of limited resources.
More information about this tool can be found at this web address: http://www.health.state.mn.us/divs/opi/qi/toolbox/pareto.html
k. Prioritization Matrix: A prioritization matrix can help an organization make
decisions by narrowing options down by systematically comparing choices through the selection, weighing, and application of criteria. Prioritization matrices: • Quickly surface basic disagreements, so disagreements can be resolved openly • Force a team to narrow down all solutions from all solutions to the best solutions,
which are more likely to increase chances for successful program implementation • Limits "hidden agendas" by bringing decision criteria to the forefront of a choice • Increases follow-through by asking for consensus after each step of the
processmm For more information about this tool can be found at this web address:
mm Minnesota Department of Health, QI Toolbox, accessed at http://www.health.state.mn.us/divs/opi/qi/toolbox/, March 2015
Event Rate - 12 Months
0
2
4
6
8
14/7 30/8 14/8 15/6 14/4 30/7 30/6 14/2 30/5 22/4
Wards
Rate
/Pa
tie
nt

-31-
http://www.health.state.mn.us/divs/opi/qi/toolbox/prioritizationmatrix.html l. Run Chart: Most basic tool to show how a process performs over time. Data points
are plotted in temporal order on a line graph. Run charts are most effectively used to assess and achieve process stability by graphically depicting signals of variation. A run chart can help to determine whether or not a process is stable, consistent, and predictable. Simple statistics such as median and range may also be displayed. The run chart is most helpful in:
1) Understanding variation in process performance
2) Monitoring process performance over time to detect signals of change
3) Depicting how a process performed over time, including variation. More information about this tool can be found at this web address:
http://www.health.state.mn.us/divs/opi/qi/toolbox/runchart.html
60%
65%
70%
75%
80%
85%
90%
Pe
rce
nt
Com
plia
nce
2nd QTR 973rd QTR 97
4th QTR 971st QTR 98
2nd QTR 983rd QTR 98
4th QTR 981st QTR 99
2ND QTR 993RD QTR 99
4th QTR 99
Quarters
RUN CHART

-32-
APPENDIX D: Quality Improvement Council Team Charter
1. QUALITY IMPROVEMENT COUNCIL TEAM CHARTER 2. Team Name: 3. Version: 4. Subject: Quality Improvement (QI) Council 3.0 (March 2016) QI Council 5. Problem / Opportunity Statement: The QI Council is established to support documentation requirements of the Public Health Accreditation Board (PHAB) and to support leadership to build a culture of QI within the department. 6. Strategic Alignment: 7. Team Leader: PHAB Standards and Measures, Version 1.5, Domain 9 ADPH Strategic Plan
Jamey Durham, Director, Bureau of Professional and Support Services
8. Team Sponsor: 9. Team Facilitator: Michele Jones, Deputy Commissioner for Programs
Carrie Allison, Performance Improvement Manager
10. Team Members: Area of Expertise: 1. Cathy Caldwell Director, Bureau of Child Health Insurance Program (CHIP) 2. Janice Cook Management Support, Bureau of Professional and Support Services 3. William “Bill” Kennedy ACORN Program Manager, Emergency Preparedness Social Work Coordinator,
Bureau of Professional and Support Services 4. Tammy Langlois Tuberculosis, Assistant Director for Clinical Services/TB Nurse Consultant, Bureau of
Communicable Diseases 5. Jim McVay Director, Bureau of Health Promotion and Chronic Disease 7. Robyn Peacock Office of Human Resources 8. Perry Snider Senior Microbiologist, Quality Management Division, Bureau of Clinical Laboratories 9. Doug Turnbull Area 10 Public Health Environmental Supervisor 10. Nancy Wright Director of Cancer Prevention and Control Division, Bureau of Family Health Services 11. Tammy Yager Area 3 Administrator 11. Purpose: The QI Council is chartered to support department leadership in building a culture of continuous quality improvement throughout the organization. The QI Council provides leadership, direction, and priorities for department-wide quality improvement (QI) efforts at the Alabama Department of Health (ADPH). The Council will also provide leadership support and guidance for: building capacity for QI on all levels; communicating and sharing QI improvement activities and resources; and recognizing QI efforts and successes. 12. Scope (Boundaries): The QI Council’s work is not intended to replace the quality improvement and program evaluation responsibilities of ADPH leadership or to replace the quality improvement and program evaluation responsibilities of specific funded activities that already require these features from grant requirements, rather it is to support leadership and staff by providing training, resources, and structures to support quality improvement efforts performed by leaders and staff. 13. Customers (primary and other): Customer Needs Addressed: ADPH Staff Performance management and QI training, engagement in
process improvements, and recognition of QI successes. 14. Objectives:- SMART - Specific, Measurable, Achievable, Realistic, Time Frame Achieve goals and objectives of the ADPH QI Plan by March 31, 2021 and review annually. 15. Success Metrics (Measures): The QI Council meetings and minutes. The QI Plan that meets PHAB requirements. An agency-wide QI tracking procedure. Evidence of recognition of QI efforts and successes. Up-to-date and resourceful QI webpage. Bi-annual QI culture survey results. Performance management and QI training certificates/reports.

-33-
16. Considerations (Assumptions/Constraints/Obstacles/Risks): Lack of staff time and resources Learning curve/lack of expertise, experience and/or training Funding Buy-in to culture change 17. Team Member Time Commitments: 18. Available Resources: The initial QI Council will be in place until the first PHAB accreditation
process is completed. After that initial accreditation process, QI Council members will serve a
two-year term, with a maximum of half of the membership rotating off every year. The QI Team Lead, Team Sponsor, and Team Facilitator are permanent members of the QI Council.
Meetings will take place on the first Tuesday of each month. The Council will meet at least 10 times per calendar year. Council members should be able to commit to attending scheduled meetings and be able to carry out the Council responsibilities.
Members will be representative of the ADPH organization and from different levels within the organization. Members should have an interest in attaining basic knowledge or skills in performance management and quality improvement.
Membership will range from 10 to 15. Additional ad-hoc members may be called to engage in QI activities on an as-needed basis.
Meetings will be conducted and decisions will be made when a quorum is present. A quorum consists of at least fifty percent (50%) of the group members plus one (1) Lead/designee.
PHAB Standards and Measures, Version 1.5
Association of State and Territorial Health Officials (ASTHO)
National Association of County and City Health Officials (NACCHO)
Public Health Foundation (PHF) Accredited State and Local Health
Departments National Network of Public Health
Institutes (NNPHI) Public Health Quality Improvement
Exchange (PHQIX)
19. Key Milestones: Date: Implement an updated QI Plan for the department March 31, 2016 Market the importance of QI to staff Ongoing beginning March 31,
2016 Share QI results, resources (including QI Plan) with all staff using existing communication resources
Ongoing beginning May 31, 2016
Inform leadership regarding status of QI performance indicators in the department’s Performance Dashboard
Annual (target August)
Provide QI and/or PM education and training to current department staff and new employees.
Ongoing
Evaluate an agency-wide QI project process (QI project forms) Annual (target February) Establish follow-up measure of department’s QI culture March 31, 2021 Complete QI or performance management training (one session/year/member) Annual (target March) 20. Communication Plan (Who, How, and When): The Council will undertake communication activities each year that will include updating a QI webpage to house the QI Plan and other materials and resources pertaining to the Council. Council agendas, meeting minutes, sign-in sheets and handouts are posted on the department intranet. The Council will also recognize QI efforts and successes using available publications and communication resources. 21. Key Stakeholders: Area of Concern (as it relates to the Charter): ADPH Customers Quality programs and services State Board of Health Efficient and effective operations Grantors Quality of care Alabama Residents Safe and healthy communities

-34-
APPENDIX E: Training Courses and Resources
Training Type
Course Name
Audience Level Purpose Source
Onboarding and Basic Performance Management and QI for staff
Introduction to QI
All employees (also added to new employee orientation; highly recommended for current employees)
Introductory To orient current and new employees to the department’s QI culture, the PDCA cycle and the QI Plan
Link to be posted on the ADPH QI webpage and in Learning Content Management System (LCMS)
Introduction to PM and QI
Embracing Quality in Public Health
All Employees (highly recommended)
Introductory To provide general overview of performance management and QI principles methods, and tools
Michigan Public Health Institute QI Guidebook - https://www.mphiaccredandqi.org/qi-guidebook/
Basic QI Tools Various Sources
All Employees (highly recommended)
Introductory To provide information and examples of QI Tools
See Appendix C
Continuing Education
Implementing and Sustaining Continuous Quality Improvement in an Organization
Program Managers (recommended)
Introductory To provide members with an awareness of QI and how it can be used in public health to "work smarter, not harder".
https://az.train.org/DesktopModules/eLearning/CourseDetails/CourseDetailsForm.aspx?courseId=1030628
Continuing Education
The Quality Improvement Welcome Kit
Program Managers (recommended)
Introductory to intermediate
To provide information about QI, the difference between QI, quality planning and quality assurance, why QI is important now, the Plan-Do-Check-Act (PDCA) cycle with examples, QI tools and methods used in QI, and resources.
National Network of Public Health Institutes (NNPHI) Webinar broadcast March 3, 2015 https://cc.readytalk.com/cc/playback/Playback.do?id=b4s8xk
Continuing Education
Pathways to CQI
All employees (recommended)
Introductory to intermediate
To provide an introduction to and further instruction on QI project development and QI tools
Self-guided using resources below.

-35-
Training Type
Course Name
Audience Level Purpose Source
Continuing Education
Change Management
Leadership/ Management (recommended)
Intermediate Navigation of challenges when initiating organizational change
Self-guided using resources below.
Resources: Websites
• Institute for Healthcare Improvement - http://www.ihi.org/resources/Pages/HowtoImprove/default.aspx
• National Association of City and County Health Officials (NACCHO) QI in Public Health - http://www.naccho.org/topics/infrastructure/accreditation/quality.cfm
• Public Health Foundation Performance Management Toolkit, http://www.phf.org/focusareas/performancemanagement/toolkit/Pages/Performance_Management_Toolkit.aspx
• Public Health Foundation. The TrainingFinder Real-time Affiliate Integrated Network, or TRAIN, https://www.train.org/
• Public Health Quality Improvement Exchange (PHQIX) – https://www.phqix.org/ Articles
• “Clean Sheet Process Redesign” – John Moran, Amanda McCarty; July 2014, http://www.phf.org/resourcestools/Documents/Clean_Sheet_Process_Redesign.pdf
• “Mistake Proofing” – John Moran, Sonja Armbruster; June 26, 2013, http://www.phf.org/resourcestools/Documents/Mistake_Proofing.pdf
• “Rapid Cycle PDCA” - Grace Duffy, John Moran, William Riley, 2009, http://www.phf.org/resourcestools/Documents/Rapid_Cycle_PDCA.pdf
• “TAPP into the PDCA Cycle to Make Improvements in Public Health” - John W. Moran, Grace L. Duffy and William Riley; ASQ’s Healthcare Update newsletter, May 2009, http://www.phf.org/resourcestools/Documents/TAPP_into_the_PDCA_Cycle.pdf
• “Utilizing the Advanced Tools of Quality Improvement to Leverage the Power and Reach of Public Health” – Ron Bialek, Louise Kent, John Moran; August 2010, http://qiroadmap.org/?wpfb_dl=8
Publications (Available for loan from the OPM) • Public Health Quality Improvement Encyclopedia, by John W. Moran and Grace
L. Duffy, Glossary by Jimmy Smith, Public Health Foundation, 2012 • The Public Health Quality Improvement Handbook, by Ron Bialek, Grace L.
Duffy, and John W. Moran, ASQ Quality Press, 2009

-36-
APPENDIX F: Quality Improvement Submission and Reporting Forms These forms are available on the ADPH Accreditation Website at www.adph.org/accreditation.

-37-
Alabama Department of Public Health AIM Statement Templatenn
An opportunity exists to improve the
(insert name process or area to work on)
beginning with
(insert beginning boundary, starting point)
and ending with
(insert ending boundary, finish point).
This effort should improve
(insert key characteristics of area the team is working on)
for the
(insert customers, staff or those affected by the process under improvement).
This process is important to work on now because
(insert what will it improve and for whom).
The baseline measurement is defined as the following metric:
(indicate the metric’s starting point-current state)
nn Created by the Public Health Foundation

-38-
APPENDIX G: Quality Improvement Storyboard Instructions and Template
Bureau of Professional and Support Services - Office of Performance Management Guidelines for the Development of Quality Improvement Storyboards
Overview and Purpose Quality Improvement (QI) Storyboards document and showcase in an organized way the QI process conducted by a team that is working systematically to resolve a specific problem and/or improve a given process. Storyboards use simple, clear statements as well as pictures and graphs to describe a problem, summarize the analysis process while it is under way, describe the solution and its implementation, and display the results and next steps. Storyboards summarize key components of the project onto a one-page document that can be converted to large poster format to share with department leaders, peers, and stakeholders. The QI efforts undertaken by department staff will pave the way for others as our department prepares for national accreditation and learns more about QI in public health. A crucial component of participation in a QI project consists of sharing experiences and lessons learned with others. As such, each QI Team is asked to develop a QI Storyboard for their project to document the steps that were taken to conduct the project and the impact of that effort. The Storyboards will serve the primary purpose of providing a concise description of the key components of each QI project and the QI tools and methods that are used. Timeline The team’s QI Storyboard can serve as an ongoing visual record of a team’s progress, helping to keep team members focused on the task while sharing their progress with others. It is recommended that QI Teams develop their Storyboard as the QI project is taking place. The Storyboard will likely be refined and revised throughout the course of the project. At a minimum, the QI Council requests that QI teams submit their Storyboards to the QI Council within 30 days after the completion of a QI project. Storyboard Components The final Storyboard should summarize the QI project using a Plan-Do-Check-Act model and include, at a minimum, the following nine components. Each section provides information on several key components that are usually part of any QI project. Where it is appropriate, the Storyboard includes information about the QI tools and methods that are used. Header: List the descriptive QI project title, organizational unit (Bureau/Area/County and Program name) responsible for the project, and names of the QI Team Lead, Members, and Champion.

-39-
Plan: Describe the situation or a problem, identify potential strategies, and articulate the intended end results.
1. Getting Started a. Describe the situation/problem and explain why the QI project was
undertaken. Address questions such as the following: i. How was the problem identified? How did you know that
there was an opportunity for improvement? ii. What is the context of the problem? Why was this problem
significant? 2. Assemble the Team
a. Describe the composition of the QI Team. (Include QI Team member names in the Storyboard heading, but not here.) Address questions such as the following:
i. Why were the QI Team members selected for the project? ii. What made them a good fit for both the team and the
project? b. Aim Statement
i. State the final aim statement for the project to describe what you wanted to accomplish. Use the AIM Statement Template to develop the statement. Answer these three fundamental questions:
1. What were you trying to accomplish? 2. How would you know that the change was an
improvement? 3. What change did you want to make to result in
improvement? ii. Describe the baseline and target measures with timeframes
that were used to measure improvement. 3. Examine the Current Approach
a. Describe the current practices/existing efforts that were targeted for improvement during the project.
i. Reference any data collection done about the current process such as check sheet examples, charts, surveys, etc.
ii. Show/reference QI tools that were used to describe the current process such as process maps, flow charts, swim lane diagrams, Strengths-Weaknesses-Opportunities-Threats (SWOT) analysis, brainstorming, etc.
4. Identify Potential Solutions a. Describe the proposed intervention or solution that was selected to
address the situation/problem. What action or intervention was tested? 5. Develop an Improvement Theory
a. Share your plans/theory for improvement before intervention. Describe the major steps (objectives) that were selected/planned to collect data and result in improvement. Describe the actions steps that

-40-
were planned to meet each objective. b. Show/reference root cause analysis tools used to develop the
improvement theory such as fishbone diagrams, five whys, brainstorming, prioritization matrix, etc.
Do: Describe the activities done to address the identified problem.
6. Test the Theory a. Share your intervention after planning. Describe what was done to
address the situation/problem and test the improvement theory (#5). What actions or activities actually took place to address the problem?
Check: Provide an overview of the results as well as what has been learned through this process. Specifically demonstrate whether implemented changes resulted in improvement.
7. Check the Results a. Describe the analysis/evaluation of the intervention/actions taken to
address the situation/problem. b. Describe the actual measure with timeframe that was used to
measure improvement. i. What were the results of the activities that took place? ii. What measurements were taken to identify if there had been
a change?
Act: Describe plans for adopting and sustaining the strategies that lead to measureable improvement, adapting them because they were not as effective as planned, or abandoning them if they were ineffective.
8. Standardize the Improvement or Develop a New Theory a. Describe the subsequent action that took place to adopt, adapt, or
abandon the improvement. Address questions such as the following: i. What happened in response to the analysis of the
intervention or solution that was tested? ii. What adjustments were made or next steps will take place if
an improvement was not made? iii. What will be done to sustain or standardize the solution?
9. Establish Future Plans a. Describe the next steps to address additional opportunities for
improvement related to the process that was targeted for improvement. b. Describe the overarching lessons learned. Address questions such
as the following: i. What did you learn from the process? ii. What worked? What did not work? iii. What would you do differently next time?
Footer: Add the date the Storyboard was finalized.
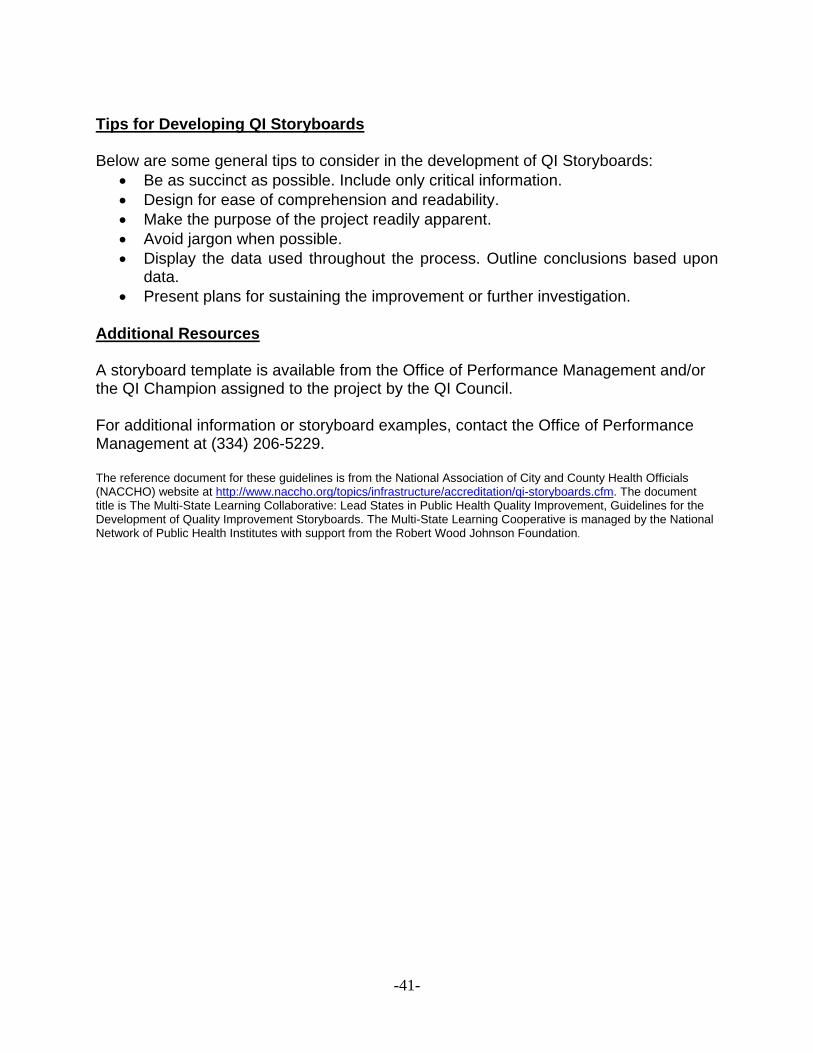
-41-
Tips for Developing QI Storyboards Below are some general tips to consider in the development of QI Storyboards:
• Be as succinct as possible. Include only critical information. • Design for ease of comprehension and readability. • Make the purpose of the project readily apparent. • Avoid jargon when possible. • Display the data used throughout the process. Outline conclusions based upon
data. • Present plans for sustaining the improvement or further investigation.
Additional Resources A storyboard template is available from the Office of Performance Management and/or the QI Champion assigned to the project by the QI Council. For additional information or storyboard examples, contact the Office of Performance Management at (334) 206-5229. The reference document for these guidelines is from the National Association of City and County Health Officials (NACCHO) website at http://www.naccho.org/topics/infrastructure/accreditation/qi-storyboards.cfm. The document title is The Multi-State Learning Collaborative: Lead States in Public Health Quality Improvement, Guidelines for the Development of Quality Improvement Storyboards. The Multi-State Learning Cooperative is managed by the National Network of Public Health Institutes with support from the Robert Wood Johnson Foundation.

-42-
Project Title: Start typing here Public Health Organizational Unit: Start typing here Quality Improvement (QI) Team Leader: Start typing here QI Team Members: Start typing here QI Council Champion: Start typing here
1. Getting Started Start typing here 2. Assemble the Team Start typing here
AIM Statement Start typing here
3. Examine the Current Approach Start typing here 4. Identify Potential Solutions Start typing here 5. Develop an Improvement Theory Start typing here
6. Test the Theory Start typing here
7. Check the Results Start typing here
8. Standardize the Improvement or Develop a New Theory Start typing here 9. Establish Future Plans Start typing here (Add final date to the footer.)
ACT Standardize the Improvement and
Establish Future Plans
Check Use Data to Check Results of the Test
DO Test the Theory for Improvement
PLAN Identify an Opportunity and
Plan for Improvement

-43-
APPENDIX H: QI Maturity Assessment Tool In September 2014, QI Council members conducted a QI Phases Assessment to assess the status of the agency’s QI culture. The assessment was based on the 6 foundational elements of a culture of QI that are defined in the NACCHO's Roadmap to an Organizational Culture of Quality Improvement (QI Roadmap).oo Results of the assessment indicated that the current ADPH culture of quality could be described as follows:
• Having adequate leadership commitment and making good progress over the last year,
• Moving in the right direction with regards to employee empowerment, teamwork and collaboration, and customer focus, and
• Getting started, but moving in the right direction with regards to QI infrastructure and continual process improvement.
A baseline measure of the agency’s QI culture that sought input from all employees was needed to further evaluate organizational QI maturity and the effectiveness of the QI Plan. The QI Maturity Tool is a validated survey instrument to assess and monitor QI efforts in public health agencies. pp The tool was created by the Multi-State Learning Collaborative evaluation team at the University of Southern Maine’s Muskie School. The tool is designed to:
• Identify features of an organization that may be enhancing or impeding QI approaches;
• Monitor the impact of efforts to create a more favorable environment for QI to flourish, and
• Define potential cohorts of public health agencies for evaluation purposes.qq Since 2012, the Minnesota Department of Health (MDH) has been monitoring organizational QI maturity and evaluating the implementation of the agency QI Plan through use of a ten question survey.rr The survey was developed by the Minnesota Public Health practice-based research network (PBRN). The PBRN used methods to identify a select number of items from the QI Maturity Tool as the basis for calculating organizational and system-level QI maturity scores. The survey questions collectively span the key domains of QI maturity; organizational culture, capacity/competency, and alignment/spread. They also align with national standards of PHAB and were judged by
oo National Association of County & City Health Officials. Roadmap to a Culture of Quality Improvement website http://qiroadmap.org. Published 2013. pp Joly, Brenda M.; Booth, Maureen; Mittal, Prashant; and Zhang, Yan (2013) "Using the QI Maturity Tool to Classify Agencies Along a Continuum," Frontiers in Public Health Services and Systems Research: Vol. 2: No. 3, Article 2. Available at: http://uknowledge.uky.edu/frontiersinphssr/vol2/iss3/2. qq Joly, B.M., Booth, M., Mittal P., & Shaler, G. Measuring quality improvement in public health: the development and psychometric testing of a QI Maturity Tool. Eval Health Prof., 35(2):119-47. rr Quality Improvement Plan, Minnesota Department of Health, April 2013. For more information on the tool: www.health.state.mn.us/lphap.

-44-
practice partners to be most relevant and actionable for local health departments. The 10-question median score is highly correlated with the full QI Maturity Tool based on a similarly calculated median score. The abbreviated tool is used by MDH to monitor trends and measure variation in QI maturity across local health departments and differences in scores among divisions within a state health department. The health system median score and the distribution of scores each year are used for annual reporting to stakeholders and to inform opportunities for system-wide improvements.ss ADPH sought technical assistance from MDH regarding their survey methodology and outcomes and elected to use the ten question survey tool for our QI culture assessment. The survey was issued by the QI Council initially in 2015 and will be conducted bi-annually thereafter. Results will be reported through the department’s Performance Dashboard and the staff newsletter. QI maturity scores will be calculated for the health system, local health departments, and state health department bureaus based on responses to the following 10 questions: Domain of QI Maturity Survey Question Associated PHAB
Measurett Organizational Culture – measures the values and norms that pervade how the agency interacts with its staff and stakeholders.
1. Staff members are routinely asked to contribute to decisions at ADPH.
9.1.1A – Staff at all organizational levels engaged in establishing and/or updating a performance management system
2. ADPH currently has a pervasive culture that focuses on continuous quality improvement.
9.1.3A – Implement performance management system
Capacity/Competency – measures the skills, functions, and approach used within an organization to assess and improve quality.
3. The leaders of my division use basic methods for evaluating and improving quality, such as Plan-Do-Check-Act.
9.1.5A – Opportunities provided to staff for involvement in the department’s performance management
4. ADPH has a quality improvement plan.
9.2.1A – Establish a QI program based on organizational policies and direction
5. ADPH currently has a high level of capacity to engage in quality improvement efforts.
9.1.3A – Implement performance management system
Alignment and Spread - measures the extent to which QI supports (and is supported by) the
6. When trying to facilitate change, staff has the authority to work within and across program boundaries.
9.1.1A – Staff at all organizational levels engaged in establishing and/or updating a performance management
ss Miner Gearin, Kimberly J.; Gyllstrom, M. Elizabeth; Joly, Brenda M.; Frauendienst, Renee S.; Myhre, Julie; and Riley, William (2013) "Monitoring QI Maturity of Public Health Organizations and Systems in Minnesota: Promising Early Findings and Suggested Next Steps," Frontiers in Public Health Services and Systems Research: Vol. 2: No. 3, Article 3. Available at: http://uknowledge.uky.edu/frontiersinphssr/vol2/iss3/3 tt Public Health Accreditation Board Standards and Measures, Version 1.5. Available at http://www.phaboard.org/.

-45-
organization as well as the diffusion of QI within the agency.
system 7. Job responsibilities for many individuals responsible for programs and services in my division include those specific to measuring and improving quality.
9.2.2A – Implemented QI activities
8. Customer satisfaction information is routinely used by many individuals responsible for programs and services throughout the agency.
9.1.4A – Implemented systematic process for assessing customer satisfaction with health department services.
9. The key decision makers in the agency believe quality improvement is very important.
9.1.1A – Staff at all organizational levels engaged in establishing and/or updating a performance management system
10. ADPH currently has aligned our commitment to quality with most of our efforts, policies and plans.
9.2.1A – Establish a QI program based on organizational policies and direction
To produce the QI maturity scores, a closed Likert-type scale with the following response choices will be associated with each of question:
• 5-Strongly Agree • 4-Agree • 3-Neutral • 2-Disagree • 1-Strongly Disagree • 1-I don’t know
The response of “I don’t know” is included as a response choice given that the concept of QI may be relatively new to some employees. The organizational QI maturity score is calculated based on survey results. The mean score for all survey responses corresponds to the phases of a culture of quality described in the QI Roadmap as follows:
• 0-2.9 Low QI (no knowledge of QI, not involved in QI activities) • 3.0-3.9 Medium QI (informal or ad hoc QI activities) • 4.0-5.0 High QI (Borderline Formal QI, Formal QI, QI Culture)