quality control. quality control is a testing procedure performed every hour (or every half hour,...
TRANSCRIPT

Quality Control

Quality Control
Quality Control is a testing procedure
performed every hour (or every half hour, etc) in
an ongoing process of production in order to
see whether the process is running properly
(“ is under control” or “not”). If the process is
not under control, the process is halted to
search for the trouble and remove it.

Statistical Process Control
Statistical Process Control (SPC) Monitoring production process
to detect and prevent poor quality
Sample Subset of items produced to
use for inspection Control Charts
Process is within statistical control limits

Quality Measures Attribute
A product characteristic that can be evaluated with a discrete response
good – bad; yes - no Variable
A product characteristic that is continuous and can be measured
weight - length

Process Control Chart
1 2 3 4 5 6 7 8 9 10Sample number
UpperControl
Limit(UCL)
ProcessAverage
(CL)
LowerControl
Limit (LCL)
Out of control

A Process is in Control If …
No sample points outside limits Most points near process average About equal number of points
above and below centerline Points appear randomly distributed

Applying SPC to Service
Hospitals Timeliness and quickness of care, staff responses
to requests, accuracy of lab tests, cleanliness, courtesy, accuracy of paperwork, speed of admittance and checkouts
Grocery Stores Waiting time to check out, frequency of out-of-
stock items, quality of food items, cleanliness, customer complaints, checkout register errors
Airlines Flight delays, lost luggage and luggage handling,
waiting time at ticket counters and check-in, agent and flight attendant courtesy, accurate flight information, passenger cabin cleanliness and maintenance

Applying SPC to Service
Fast-Food Restaurants Waiting time for service, customer
complaints, cleanliness, food quality, order accuracy, employee courtesy
Catalogue-Order Companies Order accuracy, operator knowledge and
courtesy, packaging, delivery time, phone order waiting time
Insurance Companies Billing accuracy, timeliness of claims
processing, agent availability and response time

Control Charts for Variables
Mean (x-bar) Charts Tracks the Central Tendency (the
average value observed) over time Range (R) Charts
Tracks the Spread of the Distribution over time (estimates the observed variation)

Control Chart For Mean
nDZUCL
nDZLCL
)(
)(
0
0
If α is not specified, then α be taken as 1%. (Z (1%) = 2.58)
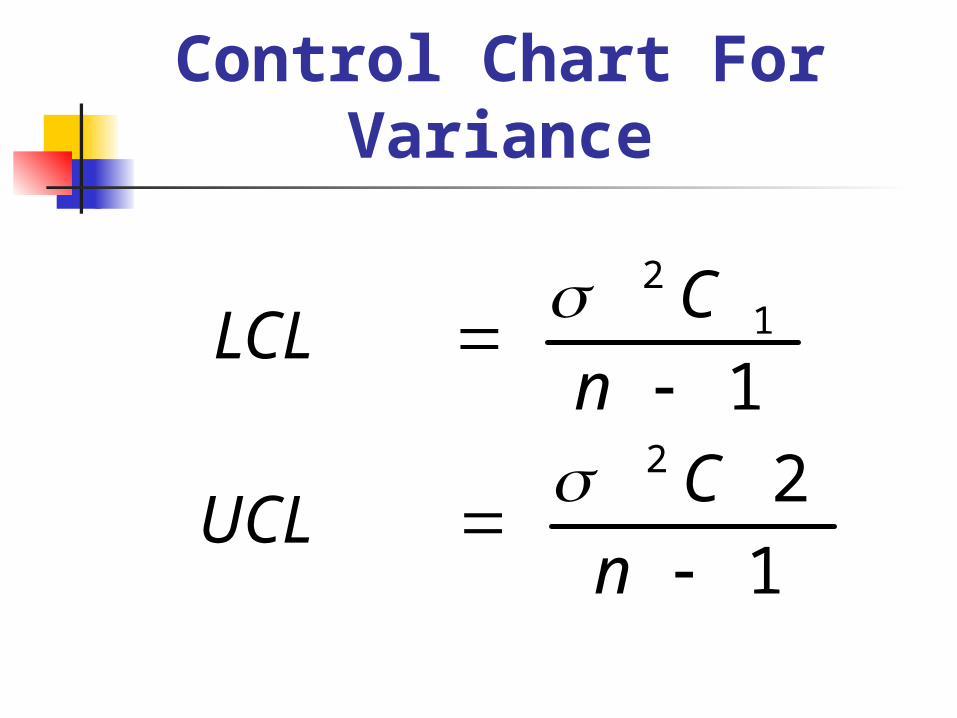
Control Chart For Variance
1
2
12
12
n
CUCL
n
CLCL

Control Chart(For Std Deviation)
1
1
2
1
n
CUCL
n
CLCL

Control Chart For Range
)(
)(3)(
)(3)(
*
**
**
RE
REREUCL
RERELCL
n
n
n
E(R*) = Mean of the Sample Ranges

Problem 1
Suppose a machine for filling cans with
lubricating oil is set, so that it will generate
fillings which form a normal population with
Mean 1 gallon and Standard Deviation 0.03
gallon. Set up a Control Chart for controlling
the mean (that is, find LCL and UCL),
assuming that Sample Size is 6.

Problem 3
What Sample Size should we choose in
Problem 1, if we want LCL and UCL
somewhat closer together, say
UCL – LCL = 0.5
Without changing the Significance Level?

Problem 5
How should we change the Sample Size
in controlling the mean of a Normal
Population, if we want the difference,
UCL – LCL to decrease to half its original
value?

Problem 7Ten Samples of Size 2 were taken from a
production lot of bolts. The values (length in mm) are as following:
Assuming that population is normal with Mean 27.5 and Variance 0.024, set up a Control Chart for the Mean and graph Sample Means on the chart.
Sample No
1 2 3 4 5 6 7 8 9 10
Length 27.4
27.4
27.5
27.3
27.9
27.6
27.6
27.8
27.5
27.3
27.6
27.4
27.7
27.4
27.5
27.5
27.4
27.3
27.4
27.7

Problem 9Graph the ranges of the given sample as Control
Chart for Ranges, assuming that population is normal with Mean 5 and Standard Deviation 1.55.
Time Sample Values Sample Range R
8:00 3 4 8 4
8:30 3 6 6 8
9:00 5 2 5 6
9:30 7 5 4 4
10:00 7 3 6 5
10:30 4 4 3 6
11:00 5 6 4 6
11:30 6 4 6 4
12:00 5 5 6 4
12:30 5 2 5 3

Problem 9Graph the ranges of the given sample as Control
Chart for Ranges, assuming that population is normal with Mean 5 and Standard Deviation 1.55.
Time Sample Values Sample Range R
8:00 3 4 8 4 5
8:30 3 6 6 8 5
9:00 5 2 5 6 4
9:30 7 5 4 4 3
10:00 7 3 6 5 4
10:30 4 4 3 6 3
11:00 5 6 4 6 2
11:30 6 4 6 4 2
12:00 5 5 6 4 2
12:30 5 2 5 3 3

Problem 13
Find formulas for UCL, CL and LCL
(corresponding to 3б Limits) in case of a
Control Chart for the defectives, assuming
that in a state of Statistical Control the
fraction of defectives is p.

Problem 15
A so called C-Chart or Defects Per Unit Chart is used for the control of number of defects per unit (for instance, the number of defects per 10 meters of paper, the number of missing rivets in an airplane wing, etc).
Set up formulas for UCL, CL and LCL corresponding µ ± 3б, assuming that X has a Poisson Distribution.
Compute UCL, CL and LCL in a Control Process of number of imperfections in sheet glass, assume that this number is 2.5 per sheet on average, when process is under control.

Three Sigma Capability
Mean output +/- 3 standard deviations falls within the design specification
It means that 0.26% of output falls outside the design specification and is unacceptable.
The result: a 3-sigma capable process produces 2600 defects for every million units produced

Six Sigma Capability Six sigma capability assumes the
process is capable of producing output where the mean +/- 6 standard deviations fall within the design specifications
The result: only 3.4 defects for every million produced
Six sigma capability means smaller variation and therefore higher quality

Process Control ChartsControl Charts show sample data plotted on a graph with Center Line (CL), Upper Control Limit (UCL), and Lower Control Limit (LCL).

Setting Control Limits

Problem 11
Since the presence of a point outside control
limits for Mean indicates trouble (“the process is out
of control”), how often would we be making the
mistake of looking for nonexistent trouble, if we used:
1 – Sigma Limits
2 – Sigma Limits?
Assume Normality.