quality control for the future - qcnetqcnet.com/portals/0/events/iw parvin aacc12.pdf · quality...
TRANSCRIPT

Quality Control for the Future:Risk Assessment in Laboratory PracticeCurtis A. Parvin, Ph.D.Manager of Advanced Statistical ResearchQuality Systems Division

2 |
American Statistical Association (ASA) T-Shirt

3 |
Another ASA T-Shirt

4 |
EP23: Figure 5. Risk Assessment
Hazard Identification
• Create a process map• Identify potential failures in each process step• Determine mechanisms in place to prevent or detect a failure
Risk Estimation
• Assess the likelihood or probability of harm for each failure• Assess the severity of harm to a patient from each failure
Risk Estimation
Is the residual riskof harm clinically
acceptable
The Laboratory’s QCP
• Compile set of QC process into QCP• Review QCP for conformance to regulatory and accreditation requirements• Document and implement the set of control processes as the laboratory’s QCP
No
Yes
Risk Control
What control processes are needed to lowerriskto an acceptable level

5 |
EP23: Figure 5. Risk Assessment
Hazard Identification
• Create a process map• Identify potential failures in each process step• Determine mechanisms in place to prevent or detect a failure
Risk Estimation
Assess the likelihood or probability of harm for each failure• Assess the severity of harm to a patient from each failure
Risk Estimation
Is the residual riskof harm clinically
acceptable
The Laboratory’s QCP
• Compile set of QC process into QCP• Review QCP for conformance to regulatory and accreditation requirements• Document and implement the set of control processes as the laboratory’s QCP
No
Yes
Risk Control
What control processes are needed to lowerriskto an acceptable level

6 |
• Sequence of Events Creating Risk of Harm for a Patient (Example)
Probability of Harm
Initiatingcause
Testingprocessfailure
Incorrectresult
generated
Incorrectresult
reportedMisdiagnosis
Hazardousmedicalaction
Patientharmed
P1 P2 P3 P4 P5 P6
Hazardous Situation
• EP23 states;• quantitative estimates of the probabilities in the sequence
leading to patient harm are desirable,• but may not be easily quantifiable.
EP23-A, Figure 6

7 |
Probability of Harm
• If probability estimates are not easily quantifiable, EP23 suggests using descriptive categories such as
• Frequent = once per week• Probable = once per month• Occasional = once per year• Remote = once every few years• Improbable = once in the life of the measuring system
• Note, these are rates of occurrence not probabilities
EP23-A 7.2.1

8 |
Estimating Probability of Harm
Initiatingcause
Testingprocessfailure
Incorrectresult
generated
Incorrectresult
reportedMisdiagnosis
Hazardousmedicalaction
Patientharmed
P1 P2 P3 P4 P5 P6

9 |
Estimating Probability of Harm
Initiatingcause
Patientharmed
P1 P6
•Frequent = once per week•Probable = once per month•Occasional = once per year•Remote = once every few years•Improbable = once in the lifetime of the measuring system
Is this the best we can do?

10 |
Estimating Probability of Harm
Initiatingcause
Testingprocessfailure
Incorrectresult
generated
Incorrectresult
reportedMisdiagnosis
Hazardousmedicalaction
Patientharmed
P1 P2 P3 P4 P5 P6
• P1: The probability that a testing process failure occurs

11 |
P1: Probability of a Failure Mode
• P1 = how likely is a given failure mode going to occur• or more commonly • P1 can be the mean time between failures (MTBF)
Information regarding MTBF may come from• Manufacturer• Historical failure data• Literature
• MTBF can be converted to mean number of patient results between failures (MPBF)• MTBF = 30 days• 150 patient results examined per day (on average)• MPBF = 30 * 150 = 4500 patient results

12 |
Estimating Probability of Harm
Initiatingcause
Testingprocessfailure
Incorrectresult
generated
Incorrectresult
reportedMisdiagnosis
Hazardousmedicalaction
Patientharmed
P1 P2 P3 P4 P5 P6MPBF
• P2: The probability that a testing process failure generates incorrect patient results
13 |
P2: Probability of Producing an Incorrect (Unreliable) Result
• The number of unreliable patient results produced during the existence of an out-of-control condition depends on• The quality required for patient results• The type and magnitude of the out-of-control condition• The power to detect the out-of-control condition• When (how often) QC evaluations are performed
• An out-of-control condition may result in many unreliable patient results being produced

14 |
Unreliable Patient Results
• ISO 15189 Clause 5.6.1: Laboratory QC should assure that patient results meet the quality required for their intended use
• The quality of a patient result depends on the difference between the correct value and the value reported.
• If the error in a patient’s result exceeds the allowable total error (TEa)• The result is considered unreliable (or incorrect).• It creates a hazardous situation for the patient.

15 |
Probability of an Unreliable Result Due to a Systematic Error Condition
16 |
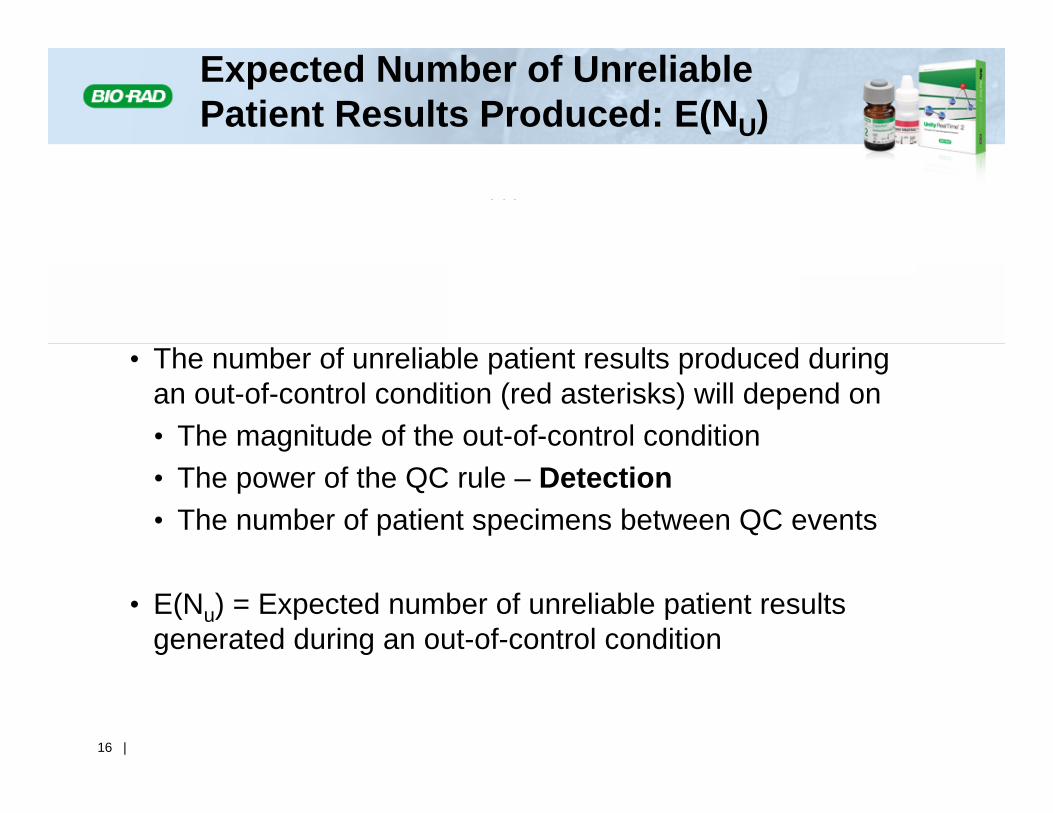
Expected Number of Unreliable Patient Results Produced: E(NU)
• The number of unreliable patient results produced during an out-of-control condition (red asterisks) will depend on• The magnitude of the out-of-control condition• The power of the QC rule – Detection• The number of patient specimens between QC events
• E(Nu) = Expected number of unreliable patient results generated during an out-of-control condition
E(Nu)

17 |
Estimating Probability of Harm
Initiatingcause
Testingprocessfailure
Incorrectresult
generated
Incorrectresult
reportedMisdiagnosis
Hazardousmedicalaction
Patientharmed
MPBF P2 P3 P4 P5 P6E(Nu)
• P3: The probability that incorrect results that are generated will be reported

18 |
P3: Probability of Reporting an Unreliable Patient Result
• The probability of reporting an unreliable result that leads to an incorrect action depends on• The number of unreliable results produced because of an
out-of-control condition• How and when results are reported• The likelihood of identifying and correcting a reported
unreliable result before an incorrect action is taken
19 |
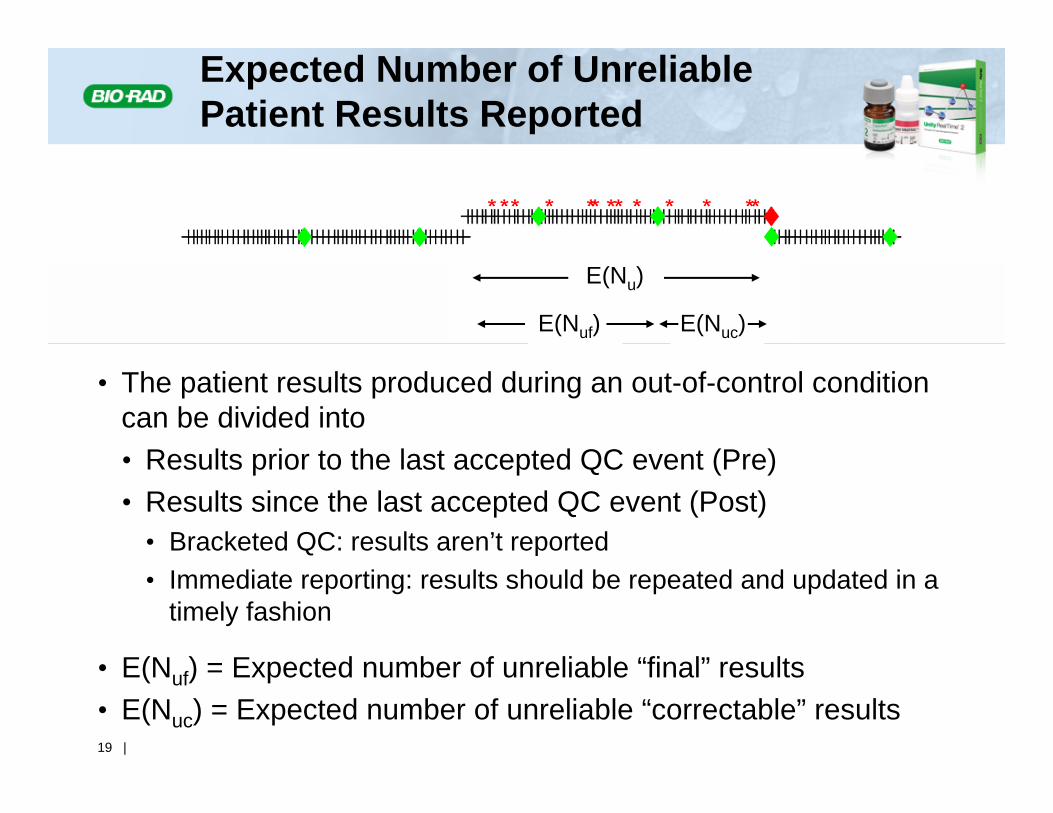
E(Nu)
E(Nuf) E(Nuc)
• The patient results produced during an out-of-control condition can be divided into• Results prior to the last accepted QC event (Pre)• Results since the last accepted QC event (Post)
• Bracketed QC: results aren’t reported• Immediate reporting: results should be repeated and updated in a
timely fashion
• E(Nuf) = Expected number of unreliable “final” results• E(Nuc) = Expected number of unreliable “correctable” results
Expected Number of Unreliable Patient Results Reported

20 |
Estimating Probability of Harm
Initiatingcause
Testingprocessfailure
Incorrectresult
generated
Incorrectresult
reportedMisdiagnosis
Hazardousmedicalaction
Patientharmed
MPBF E(Nu) P4 P5 P6E(Nuf)E(Nuf)
• P4: The probability that an incorrect result leads to a misdiagnosis• P5: The probability that a misdiagnosis leads to a hazardous medical
action• P6: The probability that a hazardous medical action leads to patient
harm
• P4*P5*P6: The probability than an incorrect result leads to patient harm

21 |
Probability of Patient Harm from an Unreliable Patient Result
• The probabilities (P4, P5, P6) are associated with activities outside the laboratory
• Their product equals the probability of patient harm given that an unreliable result has been reported
• Ph|u = P4*P5*P6
• EP23 says;• “medical judgment is used to estimate the overall probability
of harm due to receiving an incorrect result”• Medical literature• Consultation

22 |
Estimating Probability of Harm
Initiatingcause
Testingprocessfailure
Incorrectresult
generated
Incorrectresult
reportedMisdiagnosis
Hazardousmedicalaction
Patientharmed
MPBF E(Nu) E(Nuf) P4 P5 P6

23 |
Estimating Probability of Harm
Initiatingcause
Testingprocessfailure
Incorrectresult
generated
Incorrectresult
reported
Patientharmed
MPBF E(Nu) E(Nuf)Ph|u

24 |
Estimating Probability of Harm: Risk Management + Statistical QC
Initiatingcause
Testingprocessfailure
Incorrectresult
generated
Incorrectresult
reported
Patientharmed
MPBF E(Nu) E(Nuf) Ph|u
Risk ManagementStatistical QC

25 |
Harmed Patients from Failure Mode Occurrence
MPBF
E(Nuf)
E(Nu)
E(Nuc)
** *
Ph|u*E(Nuf)
• Probability of patient harm is• The expected number of patients harmed due to incorrect
results from a failure mode: Ph|u* E(Nuf)• Divided by the average number of patient results
examined between failure mode occurrences: MPBF
Probability of Harm = Ph|u* E(Nuf) / MPBF

26 |
Estimating Probability of Harm
• A quantitative assessment of the probability of harm can be obtained by combining:
• Risk Management activities• the rate of occurrence of identified failure modes• the probability of harm from a incorrect reported result
• Statistical QC design• the expected number of incorrect results reported due
to the occurrence of a failure mode
27 |
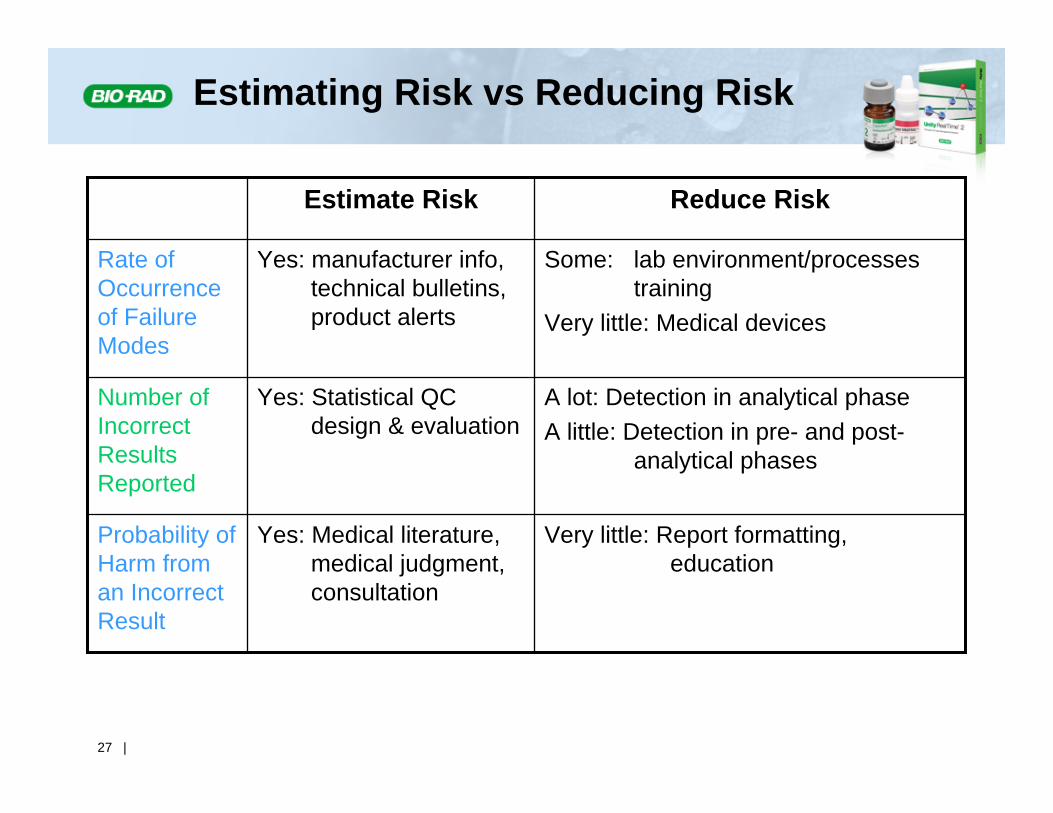
Estimating Risk vs Reducing Risk
Yes: Medical literature, medical judgment, consultation
Yes: Statistical QC design & evaluation
Yes: manufacturer info, technical bulletins, product alerts
Estimate Risk
Very little: Report formatting, education
Probability of Harm from an Incorrect Result
A lot: Detection in analytical phaseA little: Detection in pre- and post-
analytical phases
Number of Incorrect Results Reported
Some: lab environment/processes training
Very little: Medical devices
Rate of Occurrence of Failure Modes
Reduce Risk

28 |
Summary
• The laboratory has two main mechanisms to estimate and reduce the risk of patient harm:
1. Identify as many potential failure modes as possible and seek ways to reduce occurrences of the identified failure modes
Risk management
2. Implement QC strategies that minimize the number of incorrect patient results that are reported when a failure mode does occur
Statistical QC
• The combination enables a laboratory to address the full spectrum of patient risk implications for their operations

29 |
THANK YOU!