quality control for sequencing experiments · 2020. 1. 15. · quality control for sequencing...
TRANSCRIPT


• Support service for bioinformatics
– Academic – Babraham Institute
– Commercial – Consultancy
• Support BI Sequencing Facility
– MiSeq/ HiSeq/ NextSeq-based sequencing service
– Data Management / Processing / Analysis

Interests in QC
• Developed QC for in-house sequencing• Developed QC packages
– FastQC– BamQC– FastQ Screen
• Developed application specific QC– Bismark (bisulphite methylation)– HiCUP (Hi-C genome structure)
• Developed data visualisation QC– SeqMonk (generic sequencing visualisation / analysis)
• RNA-Seq QC• Small RNA QC• Duplication QC

An example of why QC is important…
• Single Cell RNA-Seq
– Each dot is a cell
– An outgroup is clearly visible
– What is it?
PC1
PC2

Genes for PC2 (85 total)
Gene DescriptionArhgef4 Rho guanine nucleotide exchange factor (GEF) 4Cflar CASP8 and FADD-like apoptosis regulator Als2 amyotrophic lateral sclerosis 2 (juvenile) homolog (human) Cxcr2 chemokine (C-X-C motif) receptor 2 Col4a3 collagen, type IV, alpha 3 Sag retinal S-antigen Gpr35 G protein-coupled receptor 35 Acmsd amino carboxymuconate semialdehyde decarboxylaseQsox1 quiescin Q6 sulfhydryl oxidase 1 9430070O13Rik RIKEN cDNA 9430070O13 gene Mrps14 mitochondrial ribosomal protein S14 Scyl3 SCY1-like 3 (S. cerevisiae)Ildr2 immunoglobulin-like domain containing receptor 2Atp1a2 ATPase, Na+/K+ transporting, alpha 2 polypeptideSlamf8 SLAM family member 8Wdr38 WD repeat domain 38Exd1 exonuclease 3'-5' domain containing 1Serf2 small EDRK-rich factor 2

Coverage of Raw Data
Normal Gene
PCA Gene

Using a different read mapper…
Conclusion: The separation in the original graph was a technical artefact of no biological interest. If we'd published this it would have mislead others. Even if we find it we've wasted some time and effort.
PC1
PC2

What is the point of QC?
• Technical problems don't cause pipelines to fail
• Technical problems don't prevent hits being generated
• Technical hits often look biologically real
• Unexpected, interesting effects can easily be missed
• Finding problems through follow-on work is slow and expensive!
• QC saves you time and effort! (and money)

Course Structure
• How does Illumina Sequencing work
• What QC metrics can we work with
• What software can be use to look at these
• How do sequencing experiments go wrong

How Does Illumina Sequencing Work?

Sequencing by Synthesis (SBS)
G A T T C A G

Solexa Sequencing
C
G A T T C A G

Solexa Sequencing
C
G A T T C A G

Solexa Sequencing
C T
G A T T C A G

Solexa Sequencing
C T
G A T T C A G

Solexa Sequencing
C T A
G A T T C A G

Solexa Sequencing
C T A
G A T T C A G

Solexa Sequencing
C T A A
G A T T C A G

Solexa Sequencing
C T A A
G A T T C A G

Solexa Sequencing
C T A A G
G A T T C A G

Solexa Sequencing
C T A A G
G A T T C A G

Solexa Sequencing
C T A A G T
G A T T C A G

Solexa Sequencing
C T A A G T
G A T T C A G

Solexa Sequencing
C T A A G T C
G A T T C A G

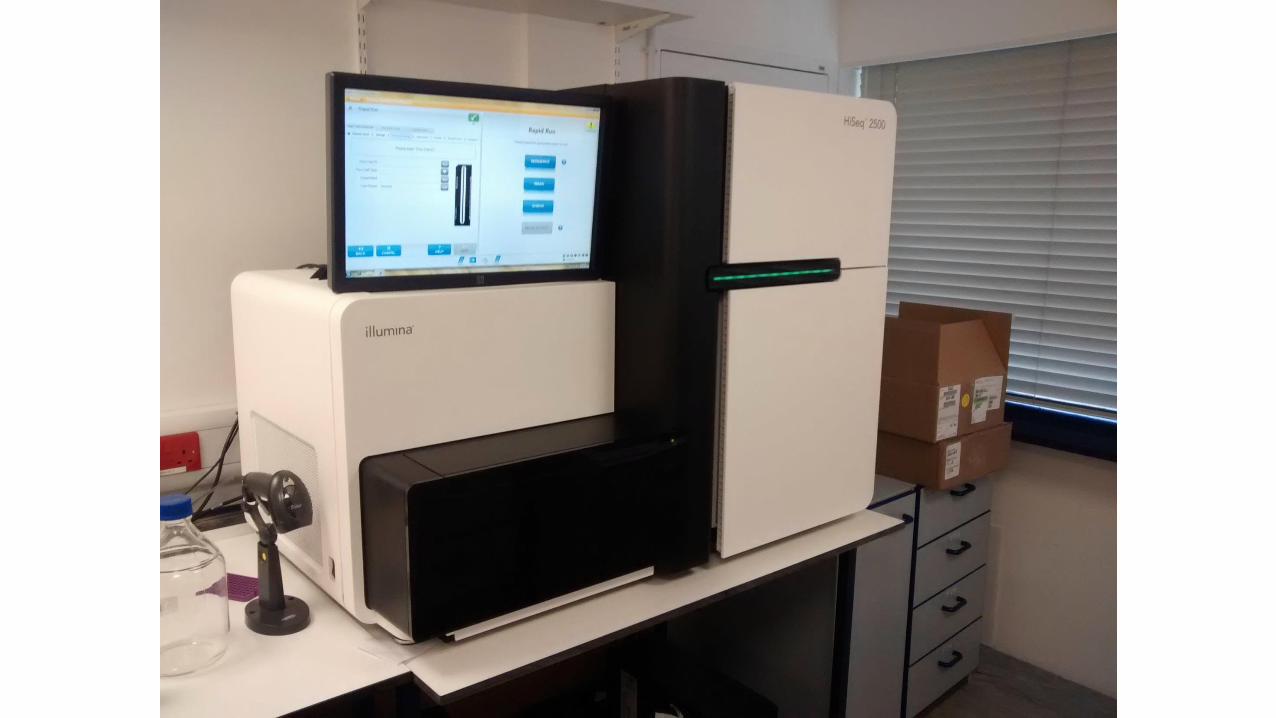
Fridge
Pumps
Microscope


Real Illumina Sequence Data

Creating Clusters
• Single molecule attaches randomly*
• Bridge amplification amplifies*
• Cluster of identical (ish) molecules created
*Newer sequences (x10 and HiSeq4000 use bead guided positioning and isothermal expansion)

Good and Bad things about clusters
Good
• Generates large signal
• Is robust to random mistakes
• Needs a small amount of starting material
Bad
• Bridging limits length
• Molecules in a cluster get out of sync– 2 bases added
– No bases added
– Reaction stalls
• Can get mixed signals if clusters overlap

Different sequencers, same chemistrySequencer Number of lanes Reads per lane Max read length Dyes
iSeq 1 ~4 million 150bp 2
MiniSeq 1 ~7 million 150bp 2
MiSeq 1 ~20 million 300bp 4
NextSeq 1 400 million 150bp 2
HiSeq 2xxx 16 ~200 million 150bp 4
HiSeq 4xxx 16 ~300 million 150bp 4
NovaSeq 8 ~2.5 billion 150bp 2

Sequencing Library Structure
InsertAdapterBarcode Adapter Barcode
InsertAdapter
Primer Read 1
Insert Adapter
PrimerRead 2
Barcode Read
Single End Run(one fastq file)
Paired End Run(two fastq files)
Used to separate libraries – often don't see the fastq file

@HWUSI-EAS611:34:6669YAAXX:1:1:5069:1159 1:N:0:
TCGATAATACCGTTTTTTTCCGTTTGATGTTGATACCATT
+
IIHIIHIIIIIIIIIIIIIIIIIIIIIIIHIIIIHIIIII
@HWUSI-EAS611:34:6669YAAXX:1:1:5243:1158 1:N:0:
TATCTGTAGATTTCACAGACTCAAATGTAAATATGCAGAG
+
DF=DBD<BBFGGGGGGGBD@GGGD4@CA3CGG>DDD:D,B
@HWUSI-EAS611:34:6669YAAXX:1:1:5266:1162 1:N:0:
GGAGGAAGTATCACTTCCTTGCCTGCCTCCTCTGGGGCCT
+
:GBGGGGGGGGGDGGDEDGGDGGGGDHHDHGHHGBGG:GG
FastQ Format Data

A single FastQ Entry
1. Header - starts with @1. Must start with a unique identifier (up to first space)
2. Can often have substructure
2. Base calls (can include N or IUPAC codes)
3. Mid-line - starts with + usually empty
4. Quality scores1. Per base signal:noise assessment
2. ASCII encoded Phred score
@HWUSI-EAS611:34:6669YAAXX:1:1:5266:1162 1:N:0:
GGAGGAAGTATCACTTCCTTGCCTGCCTCCTCTGGGGCCT
+
:GBGGGGGGGGGDGGDEDGGDGGGGDHHDHGHHGBGG:GG

Illumina Header Sections
• Starts with @ (required by fastq spec)• Instrument ID (HWUSI-EAS611)• Run number (34)• Flowcell ID (6669YAAXX)• Lane (5)• Tile (1)• X-position (5069)• Y-position (1159)• [space]• Read number (1)• Was filtered (Y/N) (N) - You wouldn't normally see the Ys• Control number (0 = no control)• Sample number (only if demultiplexed using Illumina's software)
@HWUSI-EAS611:34:6669YAAXX:5:1:5069:1159 1:N:0:

Phred Scores
• Start from (p) - the probability that the reported call is incorrect
• Initial transformation to a Phred score - positive integer from floating point
• Phred = -10 * (int)log10(p)• p=0.1 Phred = 10
• p=0.01 Phred = 20
• p=0.001 Phred = 30
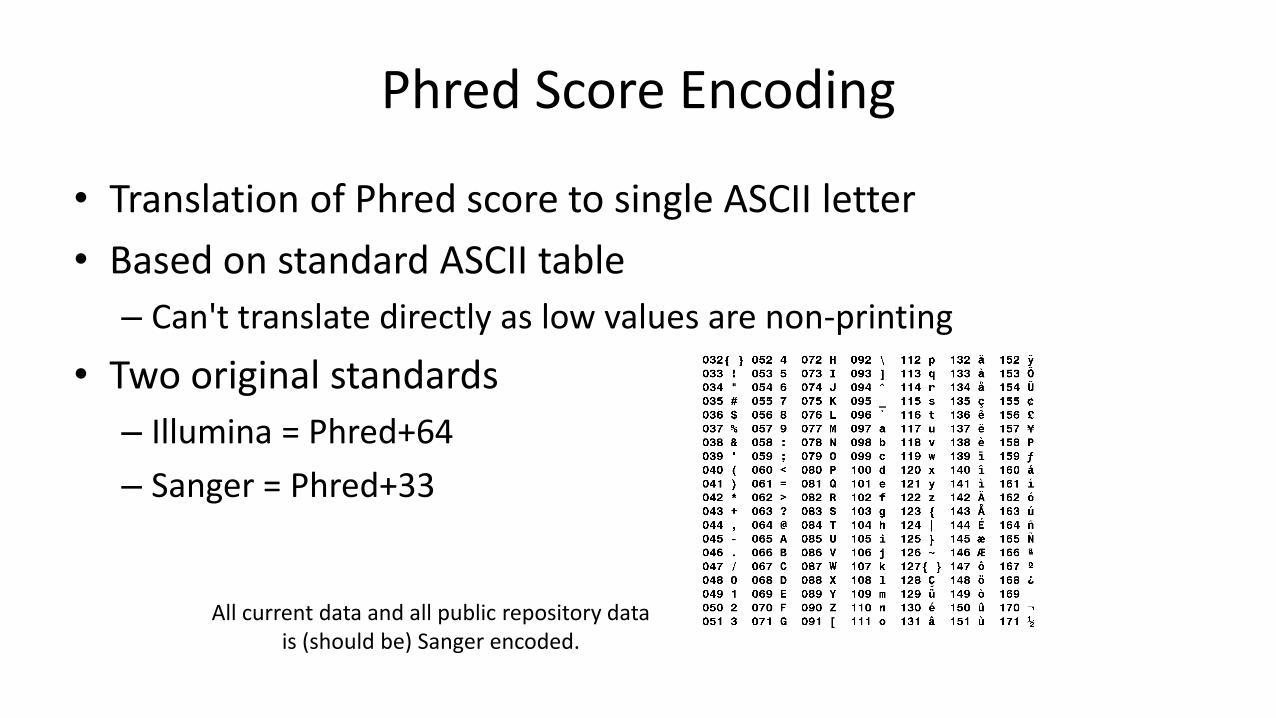
Phred Score Encoding
• Translation of Phred score to single ASCII letter
• Based on standard ASCII table
– Can't translate directly as low values are non-printing
• Two original standards
– Illumina = Phred+64
– Sanger = Phred+33
All current data and all public repository data is (should be) Sanger encoded.

Phred score encoding
:GBGGGGGGGGGDGGDEDGGDGGGGDHHDHGHHGBGG:GG
: = ASCII 58
Phred33 encoding so Phred = 25
p = 10^(25/-10)
p = 0.003

Phred score encoding
:GBGGGGGGGGGDGGDEDGGDGGGGDHHDHGHHGBGG:GG
G = ASCII 71
Phred33 encoding so Phred = 38
p = 10^(38/-10)
p = 1.6e-4

Aligned Data – BAM files
• Expanded file containing alignment data as well as everything in the fastq file
• Two sections
– Header (list of reference seqs and how the file was created)
– Alignments (details of the alignments and sequences)
• Need special programs to read, normally 'samtools'

BAM Header
[andrewss@headstone Sample_lane1]$ samtools view -H lane1000_TTAGGC_test_L001_R1_GRCm38_hisat2.bam
@HD VN:1.0 SO:unsorted
@SQ SN:1 LN:195471971
@SQ SN:10 LN:130694993
@SQ SN:11 LN:122082543
@SQ SN:12 LN:120129022
@SQ SN:13 LN:120421639
…etc…
@PG ID:hisat2 PN:hisat2 VN:2.1.0 CL:"/bi/apps/hisat2/2.1.0/hisat2-align-s --
wrapper basic-0 --dta --sp 1000,1000 -p 7 -t --phred33-quals -x
/bi/scratch/Genomes/Mouse/GRCm38/Mus_musculus.GRCm38 --known-splicesite-infile
/bi/scratch/Genomes/Mouse/GRCm38/Mus_musculus.GRCm38.90.hisat2_splices.txt -U /tmp/17469.unp"

BAM Alignments
• Sections1. Sequence name HWI-D00436:394:CBGLBANXX:1:1101:1222:1861
2. Alignment Flags 16
3. Reference sequence name chr18
4. Start position 5794485
5. Mapping Quality (Phred) 60
6. Alignment (CIGAR) string 50M
7. Paired sequence name *
8. Paired sequence position 0
9. Total insert length 0
10. Called Bases AAAAGATCTCTTGATTTAGAATTTTCTCTCAAATGTGAGGGACTTTTATN
11. Base Quality String (Phred 33) GGGGGGGGGGGGGGGGGGGGGGGGGGGGGGGGGGGGGGGGGGGGGBA<=#
12. Other Tags
[andrewss@headstone Sample_lane1]$ samtools view
lane6045_TTAGGC_Col4_contr_L001_R1_trimmed_GRCm38_hisat2.bam | less
HWI-D00436:394:CBGLBANXX:1:1101:1222:1861 16 chr18 57944851 60 50M *
0 0 AAAAGATCTCTTGATTTAGAATTTTCTCTCAAATGTGAGGGACTTTTATN
GGGGGGGGGGGGGGGGGGGGGGGGGGGGGGGGGGGGGGGGGGGGGBA<=# AS:i:-2 XN:i:0 XM:i:1 XO:i:0 XG:i:0
NM:i:1 MD:Z:49G0 YT:Z:UU NH:i:1

BAM Flags
• A 12-bit binary number with a set of TRUE/FALSE values1. Sequence is paired end2. All reads from this template are aligned3. This read didn't align4. The paired read didn't align5. The read aligned in the reverse orientation6. The paired read aligned in the reverse orientiation7. This is the first read8. This is the second read9. This is not the best alignment for this read10. This read failed upstream QC11. This read is a duplicate12. This is part of a chimeric alignment
https://broadinstitute.github.io/picard/explain-flags.html

Quality Control Metrics
• Per Base Quality Scores
• Library composition– Base level– Sequence Level– Known sequences
• Mapping statistics
• Downstream Quantitation Values

Some Software Packages for Sequence QC

FastQC
• Reads raw fastq files
• Performs multiple checks
– Pass/warn/fail
– Compares to genomic library
• HTML Report
http://www.bioinformatics.babraham.ac.uk/projects/fastqc/

FastQ Screen
• Reads fastq files
• Maps against a range of species / contaminants
• Identifies unexpected sequences in your library
http://www.bioinformatics.babraham.ac.uk/projects/fastq_screen/

MultiQC
• Aggregates QC information from multiple samples
• Large number of programs supported
• Combined HTML report
https://multiqc.info/

What should you look at in your libraries?

Base Call Qualities (Phred scores)
• For most runs, quality should be good for most reads through the whole run
• If quality deteriorates we should understand how and why
• Good (Illumina) quality is generally Phred > 28 – 30
• Concerning (Illumina) quality is Phred < 20

Base Call Qualities – Per Cycle
Ph
red
Sco
re
Cycles of Chemistry

Base Call Qualities – Per CycleR
ead
1R
ead
2

Diagnosing Poor Base Call Qualities
• Not everything is bad
• Can see identify why some parts are bad and others aren't?
• May help to fix future runs

Per-Read Quality
• Are all reads equally affected?
• Is there a subset of reads which are always poor whilst others are good?

Positional Quality
Lanes
Tiles
Top Bottom
Random Patterning
Position SpecificPatterning

Positional Quality

Library GC Content
• Generic summary of library composition at a read level
• Should generally expect a normally distributed set of values centred on the overall GC content
• Can spot subsets with unusual biases

Library GC Content
Specific Contamination Broad Contamination

Library Base Composition
• For every chemistry cycle we can look at the number of ATGC we call
• Most libraries have random start positions so the composition should be the same for all cycles
• Balance between GATC can vary– GC content of the species (GC separates from AT)
– Systematic biases per library type

Library Base Composition
• GC separate to AT
• Lines mostly flat
• Curve at the end
(see later)

Library Base Composition
• 3' RNA Sequence
• High degree of polyA
• Odd composition at 5' end

Library Base Composition
• Bisulphite treated – C is converted to T
• Restriction based fragmentation – can see remains of recognition site at 5' end

Library Base Composition
• Very low diversity
• One or two sequences dominate
Duplication
• The exact same sequence appears more than once in your library
– The sequences come from different biological molecules and the duplication is coincidental• Deep sequencing
• Highly present sequences (repeats for example)
• Restricted diversity libraries (amplicon sequencing, restricted libraries)
– The sequences come from the same biological and the duplication is technical• PCR duplicates

Duplication
• Most sequences are unique
• High diversity (or low coverage)
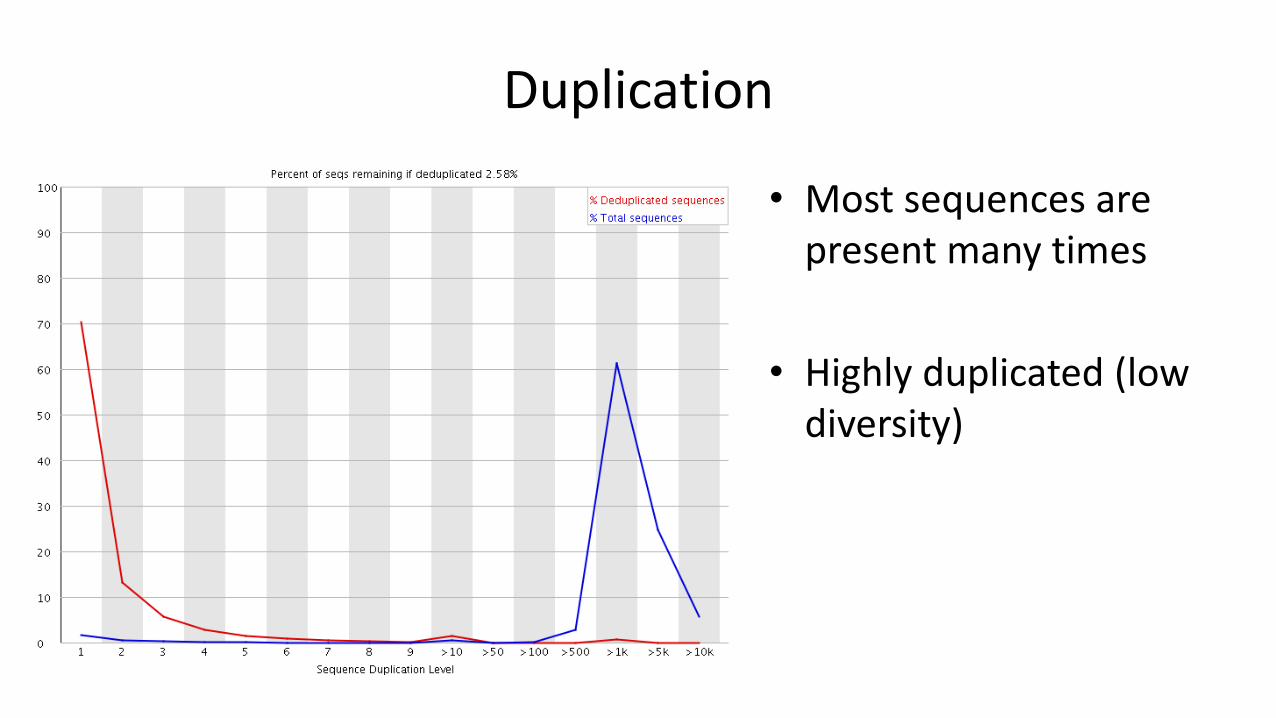
Duplication
• Most sequences are present many times
• Highly duplicated (low diversity)

Overrepresented Sequences
• Extreme duplication – the exact same sequence is a significant proportion of the whole library (which might not be duplicated overall)
• Normally comes from artificial sequences (primers, adapters, vectors etc)
• Can search a database of known sequences to find matches

Overrepresented Sequences
• PolyA – Common in RNA-Seq
• PolyG – Empty space in 2-colour chemistry
• PolyN – Quality too poor to make any calls
• Specific sequences – Normally Adapter Dimers

Adapter Dimers
Insert AdapterAdapter BarcodeBarcode
AdapterAdapter BarcodeBarcode
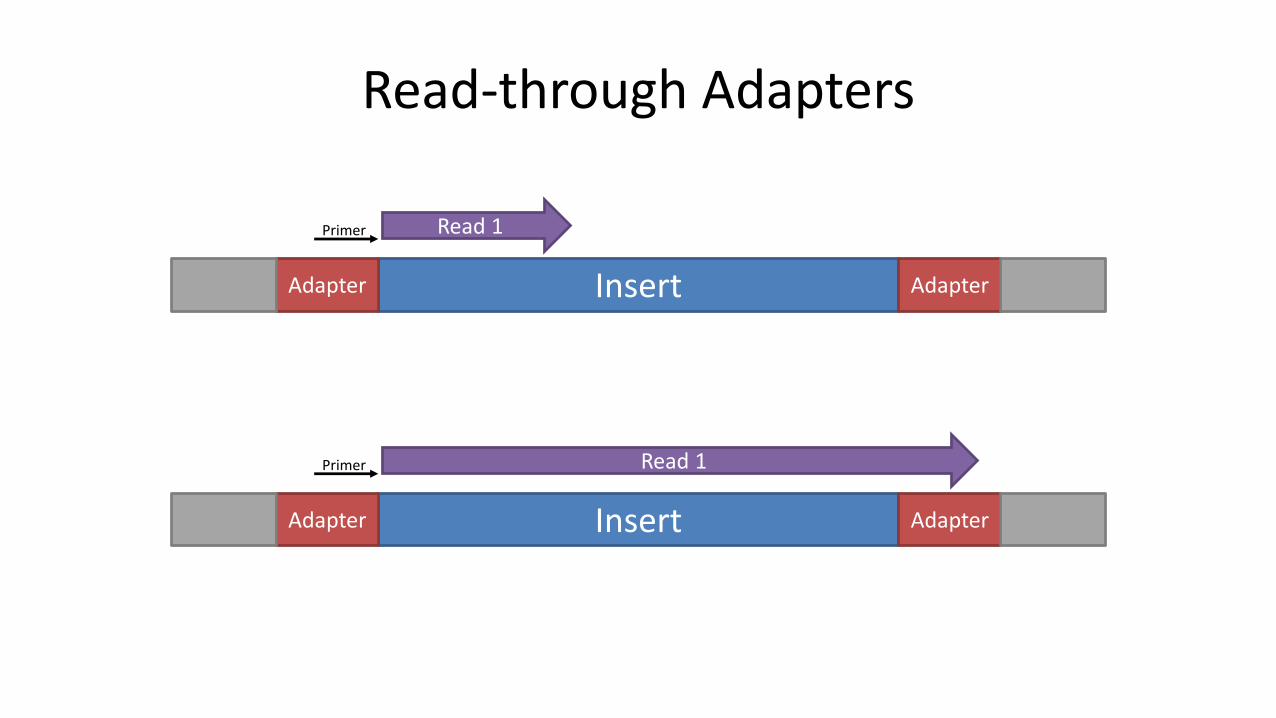
Read-through Adapters
InsertAdapter Adapter
Primer Read 1
InsertAdapter Adapter
Primer Read 1

Measuring Read-though Adapters

Barcode Sequences
Insert AdapterAdapter BarcodeBarcode

Barcode Sequences

Barcode Sequences

Mapping Statistics
Time loading forward index: 00:01:10
Time loading reference: 00:00:05
Multiseed full-index search: 00:20:47
24548251 reads; of these:
24548251 (100.00%) were paired; of these:
1472534 (6.00%) aligned concordantly 0 times
21491188 (87.55%) aligned concordantly exactly 1 time
1584529 (6.45%) aligned concordantly >1 times
94.00% overall alignment rate
Time searching: 00:20:52
Overall time: 00:22:02
If many reads do not map to the expected genome then you will want to know where they come from

Library Screening
• Map your reads against a range of reference genomes– Any species you normally work with
– Common lab contaminants (E coli and Human)
– Artificial sequences (adapters, vectors)
– Known problematic sequences (rRNA)
• Classify matches as– Unique to one species
– Single or multiple mapping

Library Screening

Library Screening

Library Screening

Library Screening

Library Screening
Assemble
Filter contigs
Plot %GC vs Coverage
Sample and blast

Aggregated Statistics
• Individual QC reports are useful but can be difficult to interpret without context
• The simplest way to spot a local QC problem is that one sample doesn't look like the rest
• We can aggregate and plot a range of QC statistics to make this easier

Aggregated Mapping Stats
FastQ Screen

Aggregated Quantitation
• We expect replicated samples to behave similarly to each other
• We expect samples which have been treated differently to differ in their quantitation
• We can use the clustering of samples based on data as a sanity check on sample tracking

Sample Clustering
• Samples cluster into groups based on their experimental groups
• Annotation is likely correct
• There will be differences to find

Sample Clustering
• Samples mostly cluster by group, but with a potential swap
• Don't swap back automatically – look at the data to see why they diverge
Sample Clustering
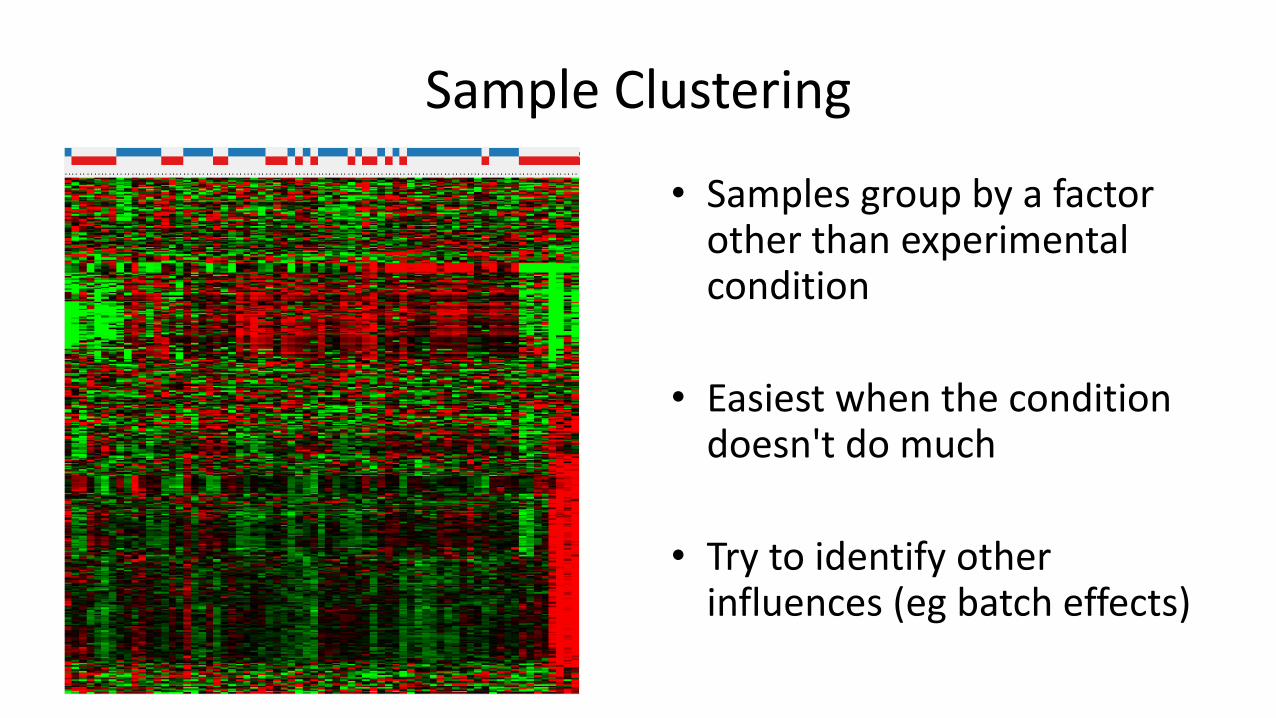
• Samples group by a factor other than experimental condition
• Easiest when the condition doesn't do much
• Try to identify other influences (eg batch effects)

Sample Clustering
WT
KO


Exercise
• Lots of reports of data with problems in “FastQC Reports”
– Look through each report
– Try to determine what might be wrong with the library
– Around 25% of libraries have something unusual in them.