quality assurance project plan (qapp) for study 231 · california department of pesticide...
TRANSCRIPT

California Department of Pesticide Regulation PAM QAPP Sacramento, CA Revision # 1.0 7/7/2006
1
QUALITY ASSURANCE PROJECT PLAN (QAPP)
for
Study # 231: Water Quality Monitoring and Evaluation of PAM/Calcium
Applications
CURES PRISM Project, Summer 2006
(Contract # 04-108-555-0) (Revision 1.0)
Prepared By
Keith Starner
California Department of Pesticide Regulation (DPR)
18 April, 2006

California Department of Pesticide Regulation PAM QAPP Sacramento, CA Revision # 1.0 7/7/2006
2
GROUP A ELEMENTS: PROJECT MANAGEMENT
1. APPROVAL SIGNATURES
California Department of Pesticide Regulation (DPR)
Title: Name: Signature: Date: Project Supervisor
Kean Goh
Project QA Officer
Carissa Ganapathy
Project Leader
Kevin Kelly
San Luis and Delta Mendota Water Authority
Title: Name: Signature: Date:
Grant Applicant Dan Nelson
Coalition for Urban/Rural Environmental Stewardship (CURES)
Title: Name: Signature: Date: Program Coordinator
Jim Markle
Central Valley Regional Water Quality Control Board
Title: Name: Signature: Date: Grant Manager
Phil Crader
QA Officer
Leticia Valadez

California Department of Pesticide Regulation PAM QAPP Sacramento, CA Revision # 1.0 7/7/2006
3
2. TABLE OF CONTENTS Page
Group A: Project Management……………………………………………………………………………..2 1. Approval Signatures……………………………………………………………………………………..2 2. Table of Contents………………………………………………………………………………………...3 3. Distribution List………………………………………………………………………………………….4 4. Project/Task Organization……………………………………………………………………………….5 5. Problem Definition/Background…………………………………………………………………………7 6. Project/Task Description…………………………………………………………………………………8 7. Quality Objectives and Criteria for Measurement Data…………………………………………………10 8. Special Training Needs/Certification……………………………………………………………………11 9. Documents and Records…………………………………………………………………………………12 Group B: Data Generation and Acquisition………………………………………………………………...13 10. Sampling Process Design……………………………………………………………………………….13 11. Sampling Methods………………………………………………………………………………………14 12. Sample Handling Custody………………………………………………………………………………16 13. Analytical Methods……………………………………………………………………………………...16 14. Quality Control………………………………………………………………………………………….17 15. Instrument/Equipment Testing, Inspection, and Maintenance………………………………………….21 16. Instrument/Equipment Calibration and Frequency……………………………………………………...21 17. Inspection/Acceptance of Supplies and Consumables………………………………………………….22 18. Non-Direct Measurements (Existing Data)……………………………………………………………..22 19. Data Management……………………………………………………………………………………….22 Group C. Assessment and Oversight………………………………………………………………………..23 20. Assessments & Response Actions………………………………………………………………………23 21. Reports to Management…………………………………………………………………………………24 Group D. Data Validation and Usability……………………………………………………………………25 22. Data Review, Verification, and Validation Requirements……………………………………………...25 23. Verification and Validation Methods…………………………………………………………………...26 24. Reconciliation with User Requirements………………………………………………………………...27 25. Literature Cited………………………………………………………………………………………….27 Appendix 1. DFG Laboratory Quality Assurance Program Plan…………………………………………...28 Appendix 2. Determination of Organophosphorous Pesticides in Water Samples…………………………59 Appendix 3. Sample Chain of Custody Form………………………………………………………………74 LIST OF FIGURES Figure 1. Organizational Chart……………………………………………………………………………….6 LIST OF TABLES Table 1. (Element 4) Personnel responsibilities…………………………………………………………….5 Table 2. (Element 6) Project schedule timeline……………………………………………………………..9 Table 3. (Element 7) Data quality objectives for field measurements……………………………………..10 Table 4. (Element 7) Data quality objectives for laboratory measurements……………………………….10 Table 5. (Element 8) Specialized personnel training or certification………………………………………11 Table 6. (Element 9) Document and record retention, archival, and disposition information……………..12 Table 7. (Element 11) Sampling locations and sampling methods…………………………………………15 Table 8. (Element 12) Sample handing and custody……………………………………………………….16 Table 9. (Element 13) Field Analytical Methods…………………………………………………………..16 Table 10.(Element 14) Sampling (Field) QC……………………………………………………………….20 Table 11. (Element 14) Analytical QC…………………………………………………………………...…20 Table 12. (Element 15) Testing, Inspection, Maintenance of Sampling Equip. and Analytical Insts………21 Table 13. (Element 16) Testing, Inspection, Maintenance of Sampling Equip. and Analytical Insts………21 Table 14. (Element 21) Reports……………………………………………………………………………..24

California Department of Pesticide Regulation PAM QAPP Sacramento, CA Revision # 1.0 7/7/2006
4
3. DISTRIBUTION LIST
Title: Name (Affiliation): Tel. No.: No. of Copies:
Grant Applicant Dan Nelson (San Luis and Delta
Mendota Water Authority) (209) 826-9696 1
Program Manager Parry Klassen (CURES) (559) 325-9855 1
Project Coordinator Jim Markle (CURES) (916) 253-3670 1
Project Supervisor Kean Goh (DPR) (916) 324-4072 1
Project QA Officer
Carissa Ganapathy (DPR) (916)-322-3082 1
Project Leader Kevin Kelley (DPR) (916) 324-4187 1
Analytical Laboratory Manager David. B Crane (DFG) (916)-358-2859 1
Analytical Laboratory QA Officer Loc Nguyen (DFG) (916) 358-0314 1
Grant Manager Phil Crader (CVRWQCB) (916) 464-4604 Original
Contract QA Officer Laiticia Valadez (CVRWQCB) (916) 464-4634 1

California Department of Pesticide Regulation PAM QAPP Sacramento, CA Revision # 1.0 7/7/2006
5
4. PROJECT/TASK ORGANIZATION 4.1 Involved parties and roles. Parry Klassen is the Executive Director for the non-profit Coalition for Urban/Rural Environmental Stewardship (CURES). He will serve as Program Manager for the project. Kevin Kelley, California Department of Pesticide Regulation (DPR) is the Project Leader for this project. He will be responsible for all field aspects of the project including the organization of field staff, scheduling of sampling days, directing staff in sample collection techniques, sampling frequency and duration, and interactions with the contract laboratory. The State of California Department of Fish and Game Fish and Wildlife Water Pollution Control Laboratory (DFG), Rancho Cordova, California, will be the contract laboratory for all sample analyses. DFG will analyze submitted samples in accordance with all method and quality assurance requirements found in this QAPP.
Table 1. (Element 4) Personnel responsibilities.
Name Organizational Affiliation Title Contact Information (Telephone number, fax number,
email address.)
Phil Crader
CVRWQCB
Grant Manager Ph: (916) 464-4604 Fax: (916) 464-4800
Email: [email protected]
Parry Klassen CURES Program Manager Ph: (559) 325-9855 Fax: (559) 325-9856
Email: [email protected]
Jim Markle CURES Project Coordinator Ph: (916) 253-3670
Email: [email protected]
Laticia Valadez CVRWQCB Contract QA Officer Ph: (916) 464-4634
Email: [email protected]
Dan Nelson San Luis and Delta Mendota
Water Authority Grant Applicant and
Project Manager
Ph: (209) 826-9696 Fax: (209) 826-9698
Email: [email protected]
Kean Goh DPR Project Supervisor Ph: (916) 324-4072 Email: [email protected]
Carissa Ganapathy DPR Project QA Officer Ph: (916) 322-3082 Fax: (916) 322-3243
Email: [email protected]
Kevin Kelley DPR Project Leader Ph: (916) 324-4187 Email: [email protected]
David B. Crane DFG Lab Contract Laboratory
Manager
Ph: (916) 358-2859 Fax: (916) 985-4301
Email: [email protected]
Loc Nguyen DFG Lab Contract Laboratory
QA Officer
Ph: (916) 358-0314 Fax: (916) 985-4301
Email: [email protected] 4.2 Quality Assurance Officer role.

California Department of Pesticide Regulation PAM QAPP Sacramento, CA Revision # 1.0 7/7/2006
6
Carissa Ganapathy is the DPR Quality Assurance Officer. Her role is to establish the quality assurance and quality control procedures found in this QAPP as part of the sampling and related procedures. She will also work with Loc Nguyen, the Quality Assurance Officer for DFG Laboratory by communicating all quality assurance and quality control issues contained in this QAPP to the DFG laboratory. 4.3 Persons responsible for QAPP update and maintenance. Changes and updates to this QAPP may be made after a review of the evidence for change by CVRWQCB’s Grant Manager and Quality Assurance Officer. Keith Starner, DPR, will be responsible for making the changes, submitting drafts for review, preparing a final copy, and submitting the final for signature. 4.4 Organizational chart and responsibilities
Figure 1. Organizational Chart.
Carissa Ganapathy DPR QA Officer
CVRWQCB QA Officer
Jim Markle Project Coordinator
CURES
Parry Klassen Program Manager
CURES
Phil Crader CVRWQCB Grant Manager
Kevin Kelley DPR Project Leader
DPR
David B. Crane Laboratory Manager DFG
Loc Nguyen DFG QA Officer
California Department of Pesticide Regulation PAM QAPP Sacramento, CA Revision # 1.0 7/7/2006
7
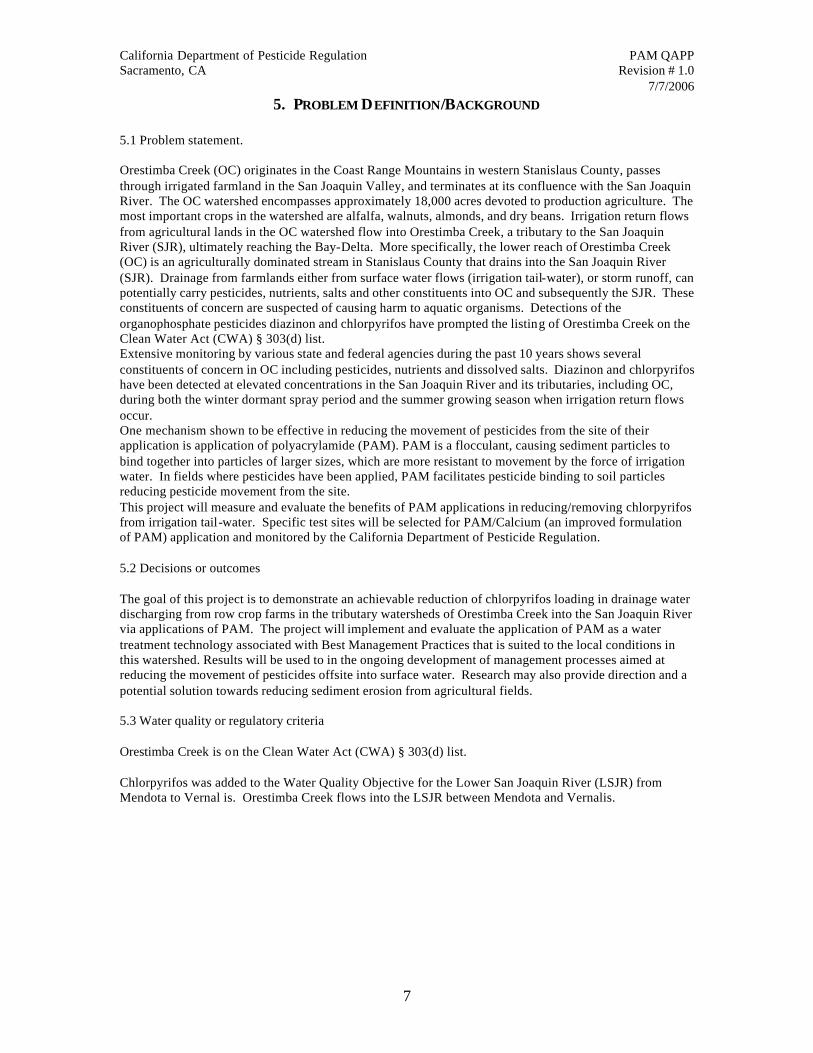
5. PROBLEM DEFINITION/BACKGROUND 5.1 Problem statement. Orestimba Creek (OC) originates in the Coast Range Mountains in western Stanislaus County, passes through irrigated farmland in the San Joaquin Valley, and terminates at its confluence with the San Joaquin River. The OC watershed encompasses approximately 18,000 acres devoted to production agriculture. The most important crops in the watershed are alfalfa, walnuts, almonds, and dry beans. Irrigation return flows from agricultural lands in the OC watershed flow into Orestimba Creek, a tributary to the San Joaquin River (SJR), ultimately reaching the Bay-Delta. More specifically, the lower reach of Orestimba Creek (OC) is an agriculturally dominated stream in Stanislaus County that drains into the San Joaquin River (SJR). Drainage from farmlands either from surface water flows (irrigation tail-water), or storm runoff, can potentially carry pesticides, nutrients, salts and other constituents into OC and subsequently the SJR. These constituents of concern are suspected of causing harm to aquatic organisms. Detections of the organophosphate pesticides diazinon and chlorpyrifos have prompted the listing of Orestimba Creek on the Clean Water Act (CWA) § 303(d) list. Extensive monitoring by various state and federal agencies during the past 10 years shows several constituents of concern in OC including pesticides, nutrients and dissolved salts. Diazinon and chlorpyrifos have been detected at elevated concentrations in the San Joaquin River and its tributaries, including OC, during both the winter dormant spray period and the summer growing season when irrigation return flows occur. One mechanism shown to be effective in reducing the movement of pesticides from the site of their application is application of polyacrylamide (PAM). PAM is a flocculant, causing sediment particles to bind together into particles of larger sizes, which are more resistant to movement by the force of irrigation water. In fields where pesticides have been applied, PAM facilitates pesticide binding to soil particles reducing pesticide movement from the site. This project will measure and evaluate the benefits of PAM applications in reducing/removing chlorpyrifos from irrigation tail-water. Specific test sites will be selected for PAM/Calcium (an improved formulation of PAM) application and monitored by the California Department of Pesticide Regulation. 5.2 Decisions or outcomes The goal of this project is to demonstrate an achievable reduction of chlorpyrifos loading in drainage water discharging from row crop farms in the tributary watersheds of Orestimba Creek into the San Joaquin River via applications of PAM. The project will implement and evaluate the application of PAM as a water treatment technology associated with Best Management Practices that is suited to the local conditions in this watershed. Results will be used to in the ongoing development of management processes aimed at reducing the movement of pesticides offsite into surface water. Research may also provide direction and a potential solution towards reducing sediment erosion from agricultural fields. 5.3 Water quality or regulatory criteria Orestimba Creek is on the Clean Water Act (CWA) § 303(d) list. Chlorpyrifos was added to the Water Quality Objective for the Lower San Joaquin River (LSJR) from Mendota to Vernal is. Orestimba Creek flows into the LSJR between Mendota and Vernalis.

California Department of Pesticide Regulation PAM QAPP Sacramento, CA Revision # 1.0 7/7/2006
8
6. PROJECT/TASK DESCRIPTION 6.1 Work statement and produced products Polyacrylamide (PAM) has been shown to be effective in reducing the movement of pesticides from the site of their application in irrigation tailwater. PAM is a flocculant, causing sediment particles to bind together into particles of larger sizes; larger particles being more resistant to movement by the force of irrigation water. In fields where pesticides have been applied, PAM has the potential to facilitate pesticide binding to soil particles and subsequent clumping of those soil particles, reducing pesticide movement from the field.
This project will measure and evaluate the benefits of PAM applications in reducing the movement of chlorpyrifos from the site of application in irrigation tail-water. The field chosen is in Western Stanislaus County, in a region with a propensity for sediment movement off irrigated fields and into adjacent water bodies. Data obtained will be used to quantify ambient levels of chlorpyrifos in runoff from irrigated fields. The study will also measure and correlate the effects of PAM on the movement of chlorpyrifos in irrigation tail-water. This study is designed to evaluate PAM as a Management Practice aimed at reducing pesticide movement off-site. 6.2. Constituents to be monitored and measurement techniques Critical constituents: 1) Concentrations of chlorpyrifos in PAM-treated and control (not-treated) tailwater will be measured. Water exiting flowmeters will be split into a discharged component and a collected component. The discharged component (majority of flow) will be diverted into tailwater channels and discarded. The remaining component will be continuously collected for the entire runoff duration. It is possible that sample volume will exceed 1 Liter. If this occurs, samples will be collected into larger containers from which an appropriate sub-sample will be taken. Samples will be collected and transported using the procedures outlined in the Laboratory Quality Assurance Plan of the California Department of Fish and Game Office of Spill Prevention and Response (attached). Samples will be analyzed for chlorpyrifos according to procedures outlined in the above document and according to the Determination of Organophosphorous Pesticides in Water Samples of the California Department of Fish and Game’s Fish and Wildlife Water Pollution Control Laboratory (attached). 2) Total volume of tailwater leaving the furrows sampled will be measured. Tailwater will be measured as follows: Plastic buckets containing a pump activated by float-switch will be embedded in the soil at the base of each furrow. Irrigation tailwater will flow into bucket. As the water rises to the appropriate level, the pump will activate. Continual incrementing water-flowmeters (measuring 1/1000 gallon) will be installed inline between pump and discharge opening.

California Department of Pesticide Regulation PAM QAPP Sacramento, CA Revision # 1.0 7/7/2006
9
6.3 Project schedule Table 2. (Element 6) Project schedule timeline.
Activity Anticipated Date (MM/DD/YYYY) Deliverable Deliverable Due Date
Of Initiation Of Completion
Site Survey 04/20/2005 04/20/2005 None None
Selection of Possible Sampling Site
10/01/2005 12/31/ 2005 None None
Application of Pesticide. 05/16/2006 09/01/2006 None None
Sample Collection 05/17/2006 09/01/2006 None None
Perform Laboratory Analysis
05/17/2006 09/16/2006 Results of Analyses
10/01/2006
Prepare Draft Report 10/01/2006 11/30/2006 Draft Report 11/30/2006
Final report 11/30/2006 12/29/2006 Final Report 12/29/2006 6.4 Geographical setting The sample site will be located in Western Stanislaus County, South of the intersection at Dodds Road and Crows Landing (SR-33). 6.5 Constraints Pesticide Application: Chlorpyrifos must be applied according to the label instructions. A chlorpyrifos product has been identified that may be applied fallow fields and pre-planting (application made after bed formation and prior to planting of the crop). Application of chlorpyrifos may be delayed if high winds occur, if pest problems in adjacent fields require the re-scheduling of application equipment, or if other unforeseen obstacles arise. Postponement of chlorpyrifos application is expected to be a temporary occurrence. Site Selection: The project is dependent upon the cooperation of area farmers in Western Stanislaus County. Prior cropping and harvest schedules, the amount of time necessary for farm activities to prepare the field for research, and the grower’s schedule will all play a part in the actual commencement of this study. Although a field has been selected, other potential sites are available if unforeseen problems arise at a future date. Sample collection: Trained personnel to collect samples are on staff. SOPs are available for all phases of sample collection. The appropriate SOPs are attached to this package. Sample collection is dependent upon water delivery to the field. Since the test site is fallow, crop health issues do not apply, and delivery of water to the test site may be delayed due to water needs in planted fields. It is not anticipated that water delivery interruptions will be more than temporary in nature.
California Department of Pesticide Regulation PAM QAPP Sacramento, CA Revision # 1.0 7/7/2006
10
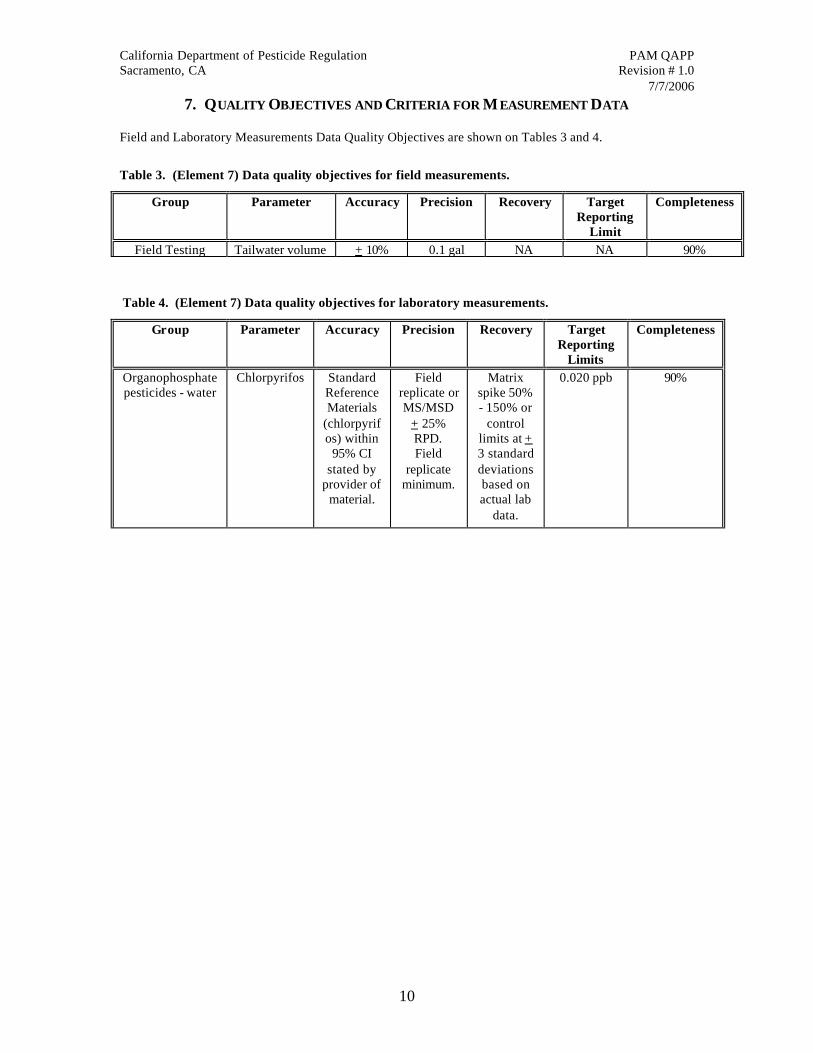
7. QUALITY OBJECTIVES AND CRITERIA FOR M EASUREMENT DATA Field and Laboratory Measurements Data Quality Objectives are shown on Tables 3 and 4.
Table 3. (Element 7) Data quality objectives for field measurements.
Group Parameter Accuracy Precision Recovery Target Reporting
Limit
Completeness
Field Testing Tailwater volume + 10% 0.1 gal NA NA 90%
Table 4. (Element 7) Data quality objectives for laboratory measurements.
Group Parameter Accuracy Precision Recovery Target Reporting
Limits
Completeness
Organophosphate pesticides - water
Chlorpyrifos Standard Reference Materials
(chlorpyrifos) within
95% CI stated by
provider of material.
Field replicate or MS/MSD
+ 25% RPD. Field
replicate minimum.
Matrix spike 50% - 150% or
control limits at + 3 standard deviations based on actual lab
data.
0.020 ppb 90%

California Department of Pesticide Regulation PAM QAPP Sacramento, CA Revision # 1.0 7/7/2006
11
8. SPECIAL TRAINING NEEDS/CERTIFICATION 8.1 Specialized training or certifications. No specialized training or certification is required for this project. At a minimum, all staff shall be familiar with the field guidelines and procedures included in this QAPP. All work shall be performed under the supervision of experienced staff. 8.2 Training and certification documentation. No special training is required. 8.3 Training personnel. No special training personnel are required. Trained field and lab scientists are on staff to conduct this project. If additional training is required, the Project QA Officer will assure that training is completed.
Table 5. (Element 8) Specialized personnel training or certification.
Specialized Training Course Title or
Description
Training Provider
Personnel Receiving Training/
Organizational Affiliation
Location of Records & Certificates
NA
NA
NA
NA
NA
NA
NA
NA

California Department of Pesticide Regulation PAM QAPP Sacramento, CA Revision # 1.0 7/7/2006
12
9. DOCUMENTS AND RECORDS The critical records required for this project include field and laboratory records and technical reports. The DPR Project Leader will collect records for sample collection and laboratory analysis. Samples sent to DFG Laboratory will include a Chain of Custody form. DPR will generate records for samp le receipt and storage, analyses, and reporting. All records generated by this project will be stored at DPR's main office. Table 6 summarizes the document and record retention, archival and disposition minimum requirements for these studies. Copies of this QAPP will be distributed to the parties involved with the project (Section 3, Distribution List). Any future amended QAPPs will be held and distributed in the same fashion. All originals, and subsequent amended QAPPs, will be retained by CURES. Copies of versions, other than the most current, will be discarded so as not to create confusion. All analytical results for water data will be reported in the laboratory's approved format. In addition to the reported data, the laboratory data report will, at a minimum, include a narrative that will discuss any problems or discrepancies, and sufficient calibration and QC information to determine that the method was within control limits at the time that the samples were analyzed. All data stored electronically will include a back-up version stored on an in-house (DPR) computer system routinely backed up to tape.
Table 6. (Element 9) Document and record retention, archival, and disposition information.
Identify Type Needed Retention Archival Disposition
Sample Collection Records
Chains of Custody
Until completion and
approval of final reports
5 years
Archivist may continue storage or dispose of at
the end of 5 years
Field Records
Field Data Sheets
Same as above
5 years
Same as above
Analytical Records
Sample Reports
Same as above
5 years
Same as above
Data
Records
Excel Database
Same as above
Indefinitely
N/A
Assessment
Records
Final Data Reports
Same as above
5 years
Archivist may continue storage or dispose of at
the end of 5 years

California Department of Pesticide Regulation PAM QAPP Sacramento, CA Revision # 1.0 7/7/2006
13
Group B: Data Generation and Acquisition
10: SAMPLING PROCESS DESIGN The goal of this study is to determine what effect polyacrylamide (PAM) added to irrigation water will have on the subsequent mass of the organophosphate insecticide, chlorpyrifos, that leaves the field in irrigation runoff. Therefore, the basic unit for this study is a paired row, consisting of (side by side) a control-row (non-PAM-treated) and a PAM-treated row. Twenty paired rows will be randomly selected across the field. If the field site for this study become inaccessible, an alternate site will be selected. If an appropriate site is not available, the Project Leader will then seek permission from the CURES Project Manager and Regional Board Grant Manager to collect the samples at a later date. A grant extension may be required to accommodate this situation. The plan is to simulate one irrigation event, with subsequent runoff from the field. The irrigation event will closely follow irrigation practices currently used in Western Stanislaus County. Irrigation water will come either from an irrigation canal or from a well. Samples of irrigation water will be collected at the time of irrigation (either from the irrigation canal or from irrigation pipes) and subjected to the same chemical analysis for chlorpyrifos as the runoff samples. A fallow field has been chosen to represent a worst-case scenario, with 100% of the applied chlorpyrifos reaching the soil surface and therefore, creating the highest potential for runoff. The field will be prepared and bedded according to local farm practices. Row width will be approximately 36” furrow-to-furrow, and each row will be 50 - 100 yards in length. The field will be pre-irrigated approximately five to seven days before chlorpyrifos application. Chlorpyrifos will be applied following all label directions at the maximum label rate. A broadcast application will be made either by fixed-wing aircraft or ground-based equipment as appropriate. Irrigation water will be applied twelve to twenty-four hours following application. Irrigation will cease after the appropriate amount of water (per local irrigation practices) has been applied to the field. PAM will be injected into the irrigation water at the head of each PAM-treated row at the onset of irrigation, and continue throughout the entire irrigation event. At the base of the paired rows, irrigation runoff water will collected in plastic buckets. Buckets will be emptied via water pumps controlled with float switches. Water will pass through flowmeters then be split into two portions, one diverted into sample bottles, and the remainder (and greater amount) vented into tailwater ditches. Since the runoff water will be split, samples can be collected continuously for the duration of the runoff event. A minimum of 40 samples will be collected (one per row). However, as the total volume of runoff cannot be estimated, a fresh sample will be collected as each previous sample container fills. Estimates for runoff per row are on the order of 50 to 500 gallons, and will vary row by row. Prior to the onset of sample collection and as each subsequent sample is started, the value on the flow meter will be recorded. Samples will be transported to CDPR’s warehouse and/or the Department of Fish and Game’s (DFG) Analytical Laboratory according to appropriate sample transportation requirements. DFG’s analytical Laboratory will analyze samples. At sample analysis, the total volume of sample water will be measured for each sample. Concentration in each sample will represent the mean concentration in the runoff volume that flowed from the row during that sample period. Mass chlorpyrifos moving out of a row will be (for that row):
S all samples (concentration in each sample X flow from the row during that sampling period).
Results will be analyzed using either parametric or non-parametric statistical methods. Results will be reported as mass of chlorpyrifos moved off the field in control and PAM-treated irrigation water.
California Department of Pesticide Regulation PAM QAPP Sacramento, CA Revision # 1.0 7/7/2006
14
11. SAMPLING M ETHODS Samples will be collected from composite buckets associated with each sampling unit. As water collects in composite buckets it will be pumped through volumetric flowmeters. Discharged water (from flowmeters) will be split into two components. The majority will be returned to tailwater ditches at the foot of the field. The remainder will be continuously collected in pre-labeled sample containers. Prior to the onset of runoff, the reading on the flowmeter will be recorded in the field journal. As each sample container reaches capacity, the reading on the flowmeter will be notated (recorded in field journal) and the sample will be diverted into a second bottle. This process will continue until all runoff from the furrow has ceased. Any water remaining in the sample collection buckets will be measured and the value noted in the field journal. The sample collection equipment will be cleaned prior to initial use and between uses utilizing water and/or a 5% soap solution or equivalent. Water rinses will be discarded at the site of use. Any problems which occur during the sampling process will be documented in the field notebooks. The project leader will be notified, and will determine the impact, if any, on the quality of the data/results. In the laboratory, the exact volume of each sample will be determined prior to extraction. Concentrations of chlorpyrifos will be based on the volume of each sample, and correlated with total measured volume of runoff recorded for that sample in the field journal.

California Department of Pesticide Regulation PAM QAPP Sacramento, CA Revision # 1.0 7/7/2006
15
Table 7 (Element 11) Sampling locations and sampling methods.
Sampling Location† Location ID # Matrix Analytical Parameter‡ Sampling SOP§ Maximum Holding Time§§
Bare Field TBA 001A Water Chlorpyrifos Section 10 7-days Bare Field TBA 001B Water Chlorpyrifos/PAM Section 10 7-days Bare Field TBA 002A Water Chlorpyrifos Section 10 7-days Bare Field TBA 002B Water Chlorpyrifos/PAM Section 10 7-days Bare Field TBA 003A Water Chlorpyrifos/PAM Section 10 7-days Bare Field TBA 003B Water Chlorpyrifos Section 10 7-days Bare Field TBA 004A Water Chlorpyrifos Section 10 7-days Bare Field TBA 004B Water Chlorpyrifos/PAM Section 10 7-days Bare Field TBA 005A Water Chlorpyrifos/PAM Section 10 7-days Bare Field TBA 005B Water Chlorpyrifos Section 10 7-days Bare Field TBA 006A Water Chlorpyrifos/PAM Section 10 7-days Bare Field TBA 006B Water Chlorpyrifos Section 10 7-days Bare Field TBA 007A Water Chlorpyrifos Section 10 7-days Bare Field TBA 007B Water Chlorpyrifos/PAM Section 10 7-days Bare Field TBA 008A Water Chlorpyrifos/PAM Section 10 7-days Bare Field TBA 008B Water Chlorpyrifos Section 10 7-days Bare Field TBA 009A Water Chlorpyrifos Section 10 7-days Bare Field TBA 009B Water Chlorpyrifos/PAM Section 10 7-days Bare Field TBA 010A Water Chlorpyrifos Section 10 7-days Bare Field TBA 010B Water Chlorpyrifos/PAM Section 10 7-days Bare Field TBA 011A Water Chlorpyrifos/PAM Section 10 7-days Bare Field TBA 011B Water Chlorpyrifos Section 10 7-days Bare Field TBA 012A Water Chlorpyrifos/PAM Section 10 7-days Bare Field TBA 012B Water Chlorpyrifos Section 10 7-days Bare Field TBA 013A Water Chlorpyrifos/PAM Section 10 7-days Bare Field TBA 013B Water Chlorpyrifos Section 10 7-days Bare Field TBA 014A Water Chlorpyrifos Section 10 7-days Bare Field TBA 014B Water Chlorpyrifos/PAM Section 10 7-days Bare Field TBA 015A Water Chlorpyrifos/PAM Section 10 7-days Bare Field TBA 015B Water Chlorpyrifos Section 10 7-days Bare Field TBA 016A Water Chlorpyrifos/PAM Section 10 7-days Bare Field TBA 016B Water Chlorpyrifos Section 10 7-days Bare Field TBA 017A Water Chlorpyrifos Section 10 7-days Bare Field TBA 017B Water Chlorpyrifos/PAM Section 10 7-days Bare Field TBA 018A Water Chlorpyrifos/PAM Section 10 7-days Bare Field TBA 018B Water Chlorpyrifos Section 10 7-days Bare Field TBA 019A Water Chlorpyrifos/PAM Section 10 7-days Bare Field TBA 019B Water Chlorpyrifos Section 10 7-days Bare Field TBA 020A Water Chlorpyrifos Section 10 7-days Bare Field TBA 020B Water Chlorpyrifos/PAM Section 10 7-days
† Bare field location outlined in Section 10 Above ‡ Chlorpyrifos = Untreated. Chlorpyrifos/PAM = PAM treated. Order of paired row has been
randomly determined. § Sampling details from Section 10 above. §§ Maximum time from sample collection to extraction and analysis by CDFG laboratory

California Department of Pesticide Regulation PAM QAPP Sacramento, CA Revision # 1.0 7/7/2006
16
12. SAMPLE HANDLING CUSTODY Samples will be collected into pre-labeled sample containers and stored on ice for transport to the DFG lab. Samples are delivered as follows. Environmental samples are delivered to the DFG lab within 48 hours of collection. Samples may be kept at 4°C, in the dark, for up to 7 days. Extraction must be performed within the 7 days of the time of sample collection.
Table 8. (Element 12). Sample handling and custody.
Parameter Container Volume Initial Preservation Holding Time Organophosphate
insecticides Glass 1000 mL Cool to 4oC 7 days
No special handling or custody procedures are needed. The chain of custody form is used as a shipping record. A sample Chain-of-Custody form is attached in Appendix 3. Each sample will be documented on a chain of custody form at the time of collection. The chain of custody will remain with the samples at all times. When the samples are delivered to the lab the sampler will relinquish custody by signing the appropriate space on the chain of custody form. The lab attendant will accept custody by signing the appropriate space on the chain of custody form. Samples may be disposed of when analysis is completed and all analytical quality assurance/quality control procedures are reviewed and accepted.
13: ANALYTICAL M ETHODS Table 9. (Element 13) Field analytical methods.
Analytical Method Achievable Laboratory Limits Analyte
Laboratory / Organization
Project Action Limit (units, wet or dry weight)
Project Reporting Limit (units, wet or
dry weight)
Analytical Method/ SOP
Modified for
Method yes/no
MDLs
Method
Chlorpyrifos
CDFG
µg/L 0.02
SOP# OP-Water
Rev 8 Appendix 2
yes 0.01
EPA 8141A
Problems encountered during the analytical process are immediately brought to the attention of the lead chemist, Abdou Mekebri. Mr. Mekebri analyzes the situation and determines corrective action to be taken by the analyst. If a sample is lost during the procedure, the process is started over using a new sample aliquot. Any problems which occur during field measurements will be documented in the field notebooks. The project leader (Kevin Kelley) will be notified, and will determine the impact, if any, on the quality of the data/results. The cited method has been validated by the contract laboratory. Method validation documentation is on file at DPR and can be accessed by contacting the project QA officer, Carissa Ganapathy.

California Department of Pesticide Regulation PAM QAPP Sacramento, CA Revision # 1.0 7/7/2006
17
14. QUALITY CONTROL
Internal quality control (QC) is achieved by analyzing a series of duplicate, blank, spike and spike duplicate samples to ensure that analytical results are within the specified QC objectives. The QC sample results are used to quantify precision and accuracy and identify any problem or limitation in the associated sample results. The internal QC components of a sampling and analyses program will ensure that the data of known quality are produced and documented. Quality control acceptance limits and frequencies are summarized in Tables 10 and 11 and Appendix 1.QC statistical calculations are described in Appendix 1, Section14. 14.1 Data Quality Objectives and Quality Assurance Objectives Data Quality Objectives (DQOs) and Quality Assurance Objectives (QAOs) are related data quality planning and evaluation tools for all sampling and analysis activities. A consistent approach for developing and using these tools is necessary to ensure that enough data are produced and are of sufficient quality to make decisions for this study. DQOs and Data Use Planning DQOs specify the underlying reason for collection of data, data type, quality, quantity, and uses of data collection. For this program, data is needed for evaluation of management practices effectiveness. Data Quality Category For this study, definitive data using standard US Environmental Protection Agency (EPA) or other reference methods are performed by DFG. Data are analyte-specific. These methods have standardized QC and documentation requirements, providing supporting information necessary to verify all reported results. Quality Assurance Objectives (QAOs) Quality assurance objectives are the detailed QC specifications for precision, accuracy, representativeness, comparability and completeness (PARC). The QAOs presented in this QAPP represent the minimum acceptable specifications that should be considered routinely for field and analytical procedures. The QAOs are then used as comparison criteria during data quality review by the Regional Board to determine if the minimum requirements have been met and the data may be used as planned. 14.2 Development of Precision and Accuracy Objectives Laboratory control spikes (LCSs) are used to determine the precision and accuracy objectives. LCSs are fortified with target compounds to monitor the laboratory precision and accuracy. Field duplicates measure sampling precision and variability for comparison of project data. Acceptable relative percent difference (RPD) is less than 25 for field duplicate analyses. If field duplicate sample results vary beyond these objectives, the results are further evaluated to identify the cause of the variability. The precision and accuracy objectives for this QAPP are listed in Table 4. 14.3 Precision Accuracy Representativeness Completeness (PARC) Definitions Precision Precision measures the reproducibility of repetitive measurements. Precision is evaluated by calculating the RPD between duplicate spikes, duplicate sample analyses or field duplicate samples and comparing it with appropriate precision objectives established in this QAPP. The details of this calculation are included in Appendix 1, Section 14.1. Analytical precision is developed using repeated analyses of identically prepared control samples. Field duplicate samples analyses results are used to measure the field QA and matrix precision. Interpretation of precision data must include all possible sources of variability. The precision objectives for this QAPP are lis ted in Table 4. Accuracy

California Department of Pesticide Regulation PAM QAPP Sacramento, CA Revision # 1.0 7/7/2006
18
Accuracy measures correctness, or how close a measurement is to the true or expected value. Accuracy is measured by determining the percent recovery of known concentrations of analytes spiked into field sample or reagent water before extraction. Accuracy calculations are detailed in Appendix 1, Section 14.2. The accuracy objectives for this QAPP are listed in Tables 3 and 4. Representativeness Representativeness is obtained by using standard sampling and analytical procedures listed and referenced in this QAPP to generate data that are representative of the sites. The representativeness objectives for this QAPP are listed in Table 4. Comparability The comparability of data produced by and for this program is predetermined by the commitment of its staff and contracted laboratories to use standardized methods, where possible, including EPA-approved analytical methods, or documented modifications thereof which provide equal or better results. These methods have specified units in which the results are to be reported. Measurements are made according to standard procedure, or documented modifications thereof which provide equal or better results, using common units such as Celsius, feet, feet/sec, mg/L, µg/L, mg/kg, etc. Analytical procedures are set by the USEPA approval list published in 40 CFR 136. Completeness Completeness is calculated for each method and matrix for an assigned group of samples. Completeness for a data set is defined as the percentage of unqualified and estimated results divided by the total number of the data points. See also Appendix 1, Section 14.3. This represents the usable data for data interpretation and decision-making. Completeness does not use results that are qualified as rejected or unusable, or that were not reported as sample loss or breakage. The overall objective for completeness is 90% for this project (Table 4). 14.4 Field Quality Control Field QC samples are used to assess the influence of sampling procedures and equipment used in sampling. They are also used to characterize matrix heterogeneity. For chlorpyrifos analyses, quality control samples to be prepared in the field will consist of field blanks and field duplicates. The number of field duplicates and field blanks are set to achieve an overall rate of at least 5% of all analyses for a particular parameter. The frequency and acceptance limits of field quality control samples for this project are listed in Table 10. Field Blanks The purpose of analyzing field blanks is to demonstrate that sampling procedures do not result in contamination of the environmental samples. Field blanks will be prepared and analyzed for chlorpyrifos at the rate of one per sample event, along with the associated environmental samples. Field blanks will consist of laboratory-prepared blank water processed through the sampling equipment using the same procedures used for environmental samples. If chlorpyrifos is detected at levels greater than the Reporting Limit (RL), the sampling crew should be notified so that the source of contamination can be identified (if possible) and corrective measures taken prior to the next sampling event. If the concentration in the associated samples is less than five times the value in the field blank, the results for the environmental samples may be unacceptably affected by contamination and should be qualified as below detection at the reported value. Field Duplicates The purpose of analyzing field duplicates is to demonstrate the precision of sampling and analytical processes. Field duplicates will be prepared at the rate of one per sampling event, and analyzed along with the associated environmental samples. Field duplicates will consist of two aliquots from the same composite sample, or of two grab samples collected in rapid succession. If an RPD greater than 25% is confirmed by reanalysis, environmental results will be qualified as estimated. The sampling crew should

California Department of Pesticide Regulation PAM QAPP Sacramento, CA Revision # 1.0 7/7/2006
19
be notified so that the source of sampling variability can be identified (if possible) and corrective measures taken prior to the next sampling event. 14.5 Laboratory Quality Control Laboratory QC is necessary to control the analytical process within method and project specifications, and to assess the accuracy and precision of analytical results. Quality control samples prepared in the contract laboratory will typically consist of equipment blanks, method blanks, laboratory control samples, laboratory duplicates and matrix spike samples. The frequency and acceptance limits of laboratory quality control samples for this project are listed in Table 11. Equipment Blanks The purpose of analyzing equipment blanks (EB) is to demonstrate that sampling equipment is free from contamination. Prior to using sampling equipment for the collection of environmental samples, the laboratory responsible for cleaning and preparation of the equipment will prepare sampler blanks. These will be prepared and analyzed at the rate of one each per piece of sampling equipment. The blanks will be analyzed using the same analytical methods specified for environmental samples. If any analytes of interest are detected at levels greater than the MDL, the source(s) of contamination should be identified and corrected, the affected equipment should be re-cleaned, and new equipment blanks should be prepared and analyzed. Sampler blanks will consist of laboratory-prepared blank water processed through the sampling equipment using the same procedures used for environmental samples. Method Blanks The purpose of analyzing method blanks is to demonstrate that the analytical procedures do not result in sample contamination. Method blanks (MB) will be prepared and analyzed by the contract laboratory at a rate of at least one for each analytical batch. Method blanks will consist of laboratory-prepared blank water processed along with the batch of environmental samples. If the result for a single MB is greater than the acceptance limits the source(s) of contamination should be corrected and the associated samples should be reanalyzed. If reanalysis is not possible, the associated sample results should be qualified as below detection at the reported blank value. Laboratory Control Samples The purpose of analyzing laboratory control samples (LCS) is to demonstrate the accuracy of the analytical method. Laboratory control samples will be analyzed at the rate of one per sample batch. Laboratory control samples will consist of laboratory fortified method blanks. If recovery of any analyte is outside the acceptable range for accuracy, the analytical process is not being performed adequately for that analyte. In this case, if the matrix spikes are also outside the acceptable range, the LCS and associated samples should be reanalyzed. If reanalysis is not possible, the associated sample results should be qualified as low or high biased. Laboratory Duplicates The purpose of analyzing laboratory duplicates is to demonstrate the precision of the analytical method. Laboratory duplicates will be analyzed at the rate of one pair per sample batch. Laboratory duplicates will consist of two analyses of the same sample. If the Relative Percent Difference (RPD) for the analyte is greater than the precision criterion and the absolute difference between duplicates is greater than the RL, the analytical process is not being performed adequately for that analyte. In this case, the laboratory duplicates should be reanalyzed. If reanalysis is not possible, the associated sample results should be qualified as not reproducible due to analytical variability. Matrix Spikes and Matrix Spike Duplicates The purpose of analyzing matrix spikes and matrix spike duplicates is to demonstrate the performance of the analytical method in a particular sample matrix. The number of matrix spikes is set to achieve an overall rate of at least 5% of all analyses for a particular parameter. Each matrix spike and matrix spike duplicate will consist of an aliquot of laboratory-fortified environmental sample. Spikes concentrations should be added at five to ten times the reporting limit for the analyte of interest. If matrix spike recovery of any analyte is outside the acceptable range, the results for that analyte have failed the acceptance criteria.

California Department of Pesticide Regulation PAM QAPP Sacramento, CA Revision # 1.0 7/7/2006
20
If recovery of laboratory control samples is acceptable, the analytical process is being performed adequately for that analyte, and the problem is attributable to the sample matrix. Attempt to correct the problem (by dilution) and re -analyze the samples and the matrix spikes. If the matrix problem can’t be corrected, qualify the results for that analyte as appropriate (low or high biased) due to matrix interference. If the matrix spike duplicate RPD for any analyte is greater than the precision criterion, the results for that analyte have failed the acceptance criteria. If the RPD for laboratory duplicates is acceptable, the analytical process is being performed adequately for that analyte, and the problem is attributable to the sample matrix. An attempt should be made to correct the problem (by dilution, concentration, etc.) and re-analyze the samp les and the matrix spike duplicates. If the matrix problem can’t be corrected, qualify the results for that analyte as not reproducible, due to matrix interference. Tables 10 and 11 present the QC requirements for water samples at specific criteria.
Table 10. (Element 14) Sampling (Field) QC.
Matrix: water Sampling SOP: See section 11 Analytical Parameter(s): pesticides (chlorpyrifos) Analytical Method/SOP Reference: Appendix 2 # Sample locations: 2
Field QC
Frequency/Number per sampling event
Acceptance Limits
Equipment Blanks One time per each piece of equipment for first event only
Below reporting limit
Field Blanks Approximately 5% Below reporting limit Cooler Temperature Measured by analyzing lab at
time of delivery < 4°C
Field Duplicate Pairs Approximately 5% RPD < 25%
Table 11. (Element 14) Analytical QC.
Matrix: water Sampling SOP: See section 11 Analytical Parameter(s): pesticides (chlorpyrifos) Analytical Method/SOP Reference: Appendix 2
Laboratory QC Frequency/Number Acceptance Limits Method Blank 1/batch Below reporting limit Lab. Duplicate 1/batch RPD < 25% Lab. Matrix Spike Approximately 5% 50 – 150 % Lab. Control sample 1/Batch 70-130% Surrogate In all samples and QC 50-150%

California Department of Pesticide Regulation PAM QAPP Sacramento, CA Revision # 1.0 7/7/2006
21
15. INSTRUMENT/EQUIPMENT TESTING, INSPECTION, AND MAINTENANCE
Field measurement equipment will be checked for operation in accordance with the manufacturer’s specifications. Spare parts for sampling equipment will be kept in DPR sampling vehicles. Spare parts for instrument maintenance will be kept in stock at the laboratory. Problems encountered during the instrument testing/maintenance process are immediately brought to the attention of the lead chemist, Abdou Mekebri. Mr. Mekebri analyzes the situation and determines corrective action to be taken by the analyst. If the instrument does not meet response criteria using the lowest concentration calibration standard, the cause of the problem is determined and corrected before proceeding.
Table 12. (Element 15) Testing, inspection, maintenance of sampling equipment and analytical instruments.
Equipment / Instrument
Maintenance Activity, Testing
Activity or Inspection Activity
Responsible Person
Frequency
Invensys Pmm
series flowmeter or
similar
Verify accuracy. If
accuracy check fails, check and use backup
flowmeter.
Kevin Kelley
Prior to use and as needed
GC-FPD
Routine maintenance.
Abdou Mekebri As needed
16. INSTRUMENT/EQUIPMENT CALIBRATION AND FREQUENCY
DFG Laboratory maintains specific calibration practices as part of the DFG Laboratory QAPP and method SOPs (attached). Instrument maintenance and calibration results will be documented as described in the DFG Laboratory QAPP (attached). Additionally, the following SWAMP requirements will be followed: External calibration with 3 – 5 standards covering the range of sample concentrations prior to sample analysis. At low end, the lowest standard at or near the MDL. Linear regression r2 < 0.995 or RSD < 10%. Calibration verification every 10 samples after initial calibration. Standard source different that that used for initial calibration. Recovery 85% - 115%. Problems encountered during the instrument calibration process are immediately brought to the attention of the lead chemist, Abdou Mekebri. Mr. Mekebri analyzes the situation and determines corrective action to be taken by the analyst. If the instrument does not meet calibration criteria, the cause of the problem is determined and corrected before proceeding.
Table 13. (Element 16) Testing, inspection, maintenance of sampling equipment and analytical instruments.
Equipment / Instrument
SOP reference Calibration Description and
Criteria
Frequency of Calibration
Responsible Person
6890/GC/FPD 3600 GC/TSD
Determination of OP
Pesticides in Water Samples
3 to 5-point initial calibration
Beginning of each analytical run
DFG Chemist
California Department of Pesticide Regulation PAM QAPP Sacramento, CA Revision # 1.0 7/7/2006
22
17. INSPECTION/ACCEPTANCE OF SUPPLIES AND CONSUMABLES Gloves, sample containers, and any other consumable equipment used for sampling will be inspected by the sampling crew on receipt and will be rejected/returned if any obvious signs of contamination (torn packages, etc.) are observed. Laboratory solvents, reagents, and other materials used in sample analysis by the DFG Laboratory are demonstrated to be free from interferences or contamination by running method blanks initially and with each sample lot.
18. NON-DIRECT MEASUREMENTS (EXISTING DATA) All measurements taken in this study will be from direct measurement of stated parameters.
19. DATA MANAGEMENT Data will be maintained as established in section 9 above. Copies of field data sheets, copies of chain of custody forms, original preliminary and final lab reports, and electronic media reports will be sent to the Project Manager . The field crew will retain original field logs. The contract laboratory(s) will retain copies of the preliminary and final data reports
Field data sheets are returned to the Project Leader after each sampling event, copied and filed. Sample results from the DFG Laboratory are sent to the Project Leader. After data entry or data transfer procedures are completed for each sample event, data will be inspected for data transcription errors, and corrected as appropriate. After the final QA checks for errors are completed, the data are added to the final database. The production of data tables is generated from this database. Data will be formatted for entry into the SWAMP database. Data will be formatted using Excel such that it can be uploaded into the SWAMP database. All required fields will be completed and all data entries will comply with SWAMP business rules. All QC data will be compared with SWAMP QA criteria and any data out of compliance will be flagged with the appropriate SWAMP data qualifier(s). After completion, the data files are transmitted electronically to the SWAMP Data Management Team staff who review the data prior to uploading the data to the SWAMP database.
California Department of Pesticide Regulation PAM QAPP Sacramento, CA Revision # 1.0 7/7/2006
23
GROUP C: ASSESSMENT AND OVERSIGHT
20. ASSESSMENTS & RESPONSE ACTIONS
Measurement data must be consistently assessed and documented to determine whether project quality assurance objectives (QAOs) have been met, quantitatively assess data quality and identify potential limitations on data use. Assessment and compliance with quality control procedures will be undertaken during the data collection phase of the project:
• Performance assessment of the sampling procedures will be performed by the field sampling crews. Corrective action shall be carried out by the field sampling crew and reported to the quality assurance manager.
• The laboratory is responsible for following the procedures and operating the analytical systems within the statistical control limits. These procedures include proper instrument maintenance, calibration of the instruments, and the laboratory QC sample analyses at the required frequency (i.e., method blanks, laboratory control samples, etc.). Associated QC sample results are reported with all sample results so the project staff can evaluate the analytical process performance.
All project data must be reviewed as part of the data assessment.
Project data review established for this project includes the following steps:
• Initial review of analytical and field data for complete and accurate documentation, chain of custody procedures, analytical holding times compliance, and required frequency of field and laboratory QC samples;
• Evaluation of analytical and field blank results to identify random and systematic contamination;
• Comparison of all spike and duplicate results with project objectives for precision and accuracy;
• Assigning data qualifiers flags to the data as necessary to reflect limitations identified by the process; and
• Calculating completeness by analyte.
Corrective Actions During the course of sample collection and analysis in this study, the laboratory supervisors and analysts, and laboratory QA officer and team members will make sure that all measurements and procedures are followed as specified in this QAPP, and measurements meet the prescribed and acceptance criteria. If a problem arises, prompt action to correct the immediate problem and identify its root causes is imperative. Any related systematic problems must also be identified.
Problems about analytical data quality that require corrective action are documented in the laboratories’ QA/QC Guidance. Problems about field data quality that may require corrective action are documented in the field data sheets.
Site Management
The project QA officer will observe field activities to ensure tasks are conducted according to the project specifications.

California Department of Pesticide Regulation PAM QAPP Sacramento, CA Revision # 1.0 7/7/2006
24
21. REPORTS TO MANAGEMENT
Final reports will be issued by CDPR according to the following table. Quarterly interim reports will not be generated as the time period from onset of sampling to final report will not span more than 6 months.
Table 14. (Element 21) Reports.
Type of Report
Frequency (daily, weekly,
monthly, quarterly,
annually, etc.)
Projected Delivery Dates(s)
Person(s)
Responsible for Report
Preparation
Report Recipients
Draft final report for review
one time only November 30, 2006 Kevin Kelley SWB MAA Coordinator
CURES Project Liason
Final report one time only December 29, 2006 Kevin Kelley SWB MAA Coordinator CURES Project Liason
California Department of Pesticide Regulation PAM QAPP Sacramento, CA Revision # 1.0 7/7/2006
25
GROUP D: DATA VALIDATION AND USABILITY
22. DATA REVIEW, VERIFICATION, AND VALIDATION REQUIREMENTS Data generated by project activities will be reviewed against the data quality objectives cited in Element 7 and the quality assurance/quality control practices cited in Elements 14, 15, 16, and 17. Data will be separated into three categories: 1) Data meeting all data quality objectives, 2) Data meeting failing precision or recovery criteria, and 3) Data failing to meet accuracy criteria. Data meeting all data quality objectives, but with failures of quality assurance/quality control practices will be set aside until the impact of the failure on data quality is determined. Once determined, the data will be moved into either the first category or the last category. Data falling in the first category is considered usable by the project and will be reported without qualification. Data falling in the last category is considered not usable. Data falling in the second category will have all aspects assessed. If sufficient evidence is found supporting data quality for use in this project, the data will be moved to the first category, but will be flagged with a “J” (per EPA specifications) meaning that the result is an estimated value however still considered valid. In cases where field blank results exceed the acceptance criteria, data collected during the associated sample run will be qualified and reported as follows:
• Measured field sample concentrations greater than or equal to 5 times the field blank level will be reported with no qualification.
• Measured field sample concentrations less than 5 times the field blank level will be qualified as “less than” the measured value, e.g. if a field blank is equal to 1.0 µg/L, a measured field concentration of 4.0 µg/L will be reported as <4.0 µg/L.
• Any data qualifications resulting from QC analyses will be reported with the field data as appropriate.

California Department of Pesticide Regulation PAM QAPP Sacramento, CA Revision # 1.0 7/7/2006
26
23. VERIFICATION AND VALIDATION M ETHODS
Laboratory Data Review, Verification and Reporting
The laboratory personnel will verify that the measurement process was “in control” (i.e., all specified data quality objectives were met or acceptable deviations explained) for each batch of samples before proceeding with analysis of a subsequent batch.
The laboratory analyst performing the analyses is responsible for the reduction of the raw data generated at the laboratory bench to calculate the concentrations.
The analytical process includes verification or a quality assurance review of the data. This includes:
• Verifying the calibration samples for compliance with the laboratory and project criteria; • Verifying that the batch QC were analyzed at a proper frequency and the results were
within specifications; • Comparing the raw data (e.g. chromatogram) with reported concentration for accuracy
and consistency; • Verifying that the holding times were met and that the reporting units and quantitation
limits are correct; • Determining whether corrective action was performed and control was re-established and
documented prior to reanalysis of QC or project samples; • Verifying that all project and QC sample results were properly reported and flagged; and • Preparing batch narratives that adequately identify and discuss any problems
encountered.
Specific Quality Control procedures are documented in the laboratory quality assurance manual. After the data have been reviewed and verified, the laboratory reports are signed for release and distributions. Raw data and supporting documentation is stored in confidential files by laboratory document control.
Only data which have met data quality objectives or data which have acceptable deviations explained will be submitted by the laboratory. When QA requirements have not been met, the samples will be reanalyzed when possible and only the results of the reanalysis will be submitted, provided they are acceptable.
Data Validation Data validation (data quality audit) is conducted by the DFG QA Officer to verify whether an analytical method has been performed according to the method and project specifications, and the results have been correctly calculated and reported. The DFG Lab will conduct the data validation prior to submitting the data to DPR. Specific items that are reviewed during data validation are:
• Chain of custody records • Documentation of the laboratory procedures (e.g., standard preparation records, run logs,
data reduction and verification) • Accuracy of data reduction, transcription, and reporting • Adherence to method-specific calibration procedures and quality control parameters • Precision and accuracy of recorded results

California Department of Pesticide Regulation PAM QAPP Sacramento, CA Revision # 1.0 7/7/2006
27
24. RECONCILIATION WITH USER REQUIREMENTS The chlorpyrifos concentration data generated in this project will be used by the end users for the assessment of BMPs for reducing pesticide runoff into surface waters. Data on concentrations of chlorpyrifos generated in this study will be of known and documented quality so that regulatory decision makers and other stakeholders will know the relative accuracy of the measurements being used to support comparisons with monitoring data from previous studies. Unless it is otherwise qualified, the chlorpyrifos data generated in this project will meet the Quality Assurance Objectives listed in Element 14. The final data report will indicate the level of completeness of the data generated and indicate any times in which data meeting the Quality Assurance Objectives was not obtained.
25. LITERATURE CITED None

California Department of Pesticide Regulation Draft PAM QAPP Sacramento, CA Revision 0.0 4/18/2006
APPENDIX 1. DFG LABORATORY QUALITY ASSURANCE PROGRAM PLAN
STATE OF CALIFORNIA DEPARTMENT OF FISH AND GAME
OFFICE OF SPILL PREVENTION AND RESPONSE
LABORATORY QUALITY ASSURANCE PROGRAM PLAN
California Department of Fish and Game Fish and Wildlife Water Pollution Control Laboratory
2005 Nimbus Road Rancho Cordova, CA 95670

Section No. 1 Revision No. 8
Date 12 May 05 Page 1 of 1
SAMPLING AND ANALYTICAL ACTIVITIES
State of California
Department of Fish and Game Office of Spill Prevention and Response
Scientific Program Fish and Wildlife Water Pollution Control Laboratory
Approvals: OSPR Scientific Program Chief: Ken Mayer OSPR Scientific Program Asst. Chief __________________________ and Laboratories Manager: John Turner Laboratory Director, __________________________ Fish and Wildlife Water Pollution David Crane Control Laboratory Quality Assurance __________________________ Officer (Acting): Tom Lew Contract Program QA Officer __________________________ Loc Nguyen

DEPARTMENTAL QUALITY ASSURANCE PROGRAM POLICY
The Fish and Game Departmental (DFG) quality assurance program describes the requirements, controls and responsibilities for implementation of quality assurance principles specified in applicable regulations, codes, and standards applied to the environmental laboratory activities. The program begins with quality assurance training for all new employees, and an orientation to the Departmental quality assurance/quality control practices. The importance of quality assurance is recognized by Department management and is documented within the Office of Spill Prevention and Response for all laboratory operations. The primary commitment of the Departmental Quality Assurance/Quality Control Program is to implement the program activities and requirements committing time and resources ensuring that data are as precise, accurate and complete as required by the data quality objectives of the projects involved.
Section No. 2 Revision No. 5
Date 12 May 05 Page 1 of 1
OFFICE OF SPILL PREVENTION AND RESPONSE
LABORATORY QUALITY ASSURANCE PROGRAM PLAN
TABLE OF CONTENTS
Section Title 1 Title Page 2 Table of Contents 3 Quality Assurance Description 4 Quality Assurance Organization and Responsibilities 5 Data Quality Objectives and Assessment Methods 6 Sampling Procedures 7 Sample Custody 8 Calibration Procedures and Preventive Maintenance 9 Analytical Procedures 10 Data Reduction, Validation and Reporting 11 Internal Quality Control Checks and Frequency 12 System Audits 13 Preventive Maintenance 14 Routine Assessment of Data Precision, Accuracy, and Completeness 15 Corrective Action 16 Quality Assurance Communication with Management 17 Staff Training and Documentation 18 Glossary Appendices A Organizational Chart B Qualifications and Specifications of Key Personnel C SOP’s D Sample Containers, Preservation and Holding Time E Forms F Analytical Methods and Reference Sources G Method Detection Limit Revision 1.11, Federal Register, Vol. 49, No. 209, Friday
October 26, 1984.

Section No. 3 Revision No. 5
Date 12 May 05 Page 1 of 1
3.0 QUALITY ASSURANCE DESCRIPTION
3.1 Overview
The purpose of this document is to describe the State of California Department of Fish and Game's Quality Assurance Program as implemented within the Office of Spill Prevention and Response (OSPR) Laboratories. This program plan summarizes those quality assurance and quality control (QA/QC) elements which ensure the accurate and precise development of Department sampling and analytical results, as is consistent with project objectives. The program plan has been designed to meet requirements of many projects and specifically addresses all elements of the Environmental Protection Agency Office of Environment Information "Guidance for Quality Assurance Project Plans” EPA QA/G-5, EPA/240/R-02/009 December 2002 and “Specifications for Preparing Quality Assurance Project Plans" QAMS-005/80. This plan establishes the quality assurance and quality control procedures common to most of the Laboratory services. When necessary, particular project protocols or Standard Operating Procedures (SOPs) will be used to define any project-specific requirements.
3.1.1 Department Quality Assurance System
Quality assurance is a system for integrating the quality planning, quality assessment and quality improvement efforts of various sections to enable operations to meet specified project needs. Quality assurance of field and laboratory systems is concerned with all activities that have an important effect on the quality of measurements as well as the establishment of methods and techniques to monitor the performance of these systems. In addition, quality assurance is composed of those activities performed on a routine basis to gain an independent assessment of the operation and validity of the product. In summary, quality assurance is an essential system of activities to provide the confidence that quality control methods are performing adequately.
3.1.2 Department Quality Control System
In contrast, quality control is the system of activities which provide a quality product for a data user, consisting of internal laboratory operations which document product quality.
3.2 Summary In summary, this Quality Assurance and Quality Control Program Plan is designed to satisfy the requirements and concerns of the analyst, management, and regulatory agencies concerned with the project.
Section No. 4 Revision No. 6
Date 12 May 05 Page 1 of 2
4.0 QUALITY ASSURANCE ORGANIZATION AND RESPONSIBILITIES 4.1 OSPR Scientific Program Chief
The Scientific Unit Chief is responsible for administrative and financial oversight of all activities within the OSPR Scientific Unit. Organizational chart can be found in Appendix A.
4.2 OSPR Scientific Program Assistant Chief
The Scientific Unit Assistant Chief is responsible for administrative and financial oversight of all activities within the OSPR Scientific Unit's laboratory system.
4.3 Laboratory Directors
Laboratory directors are designated for each of the laboratories within OSPR. The laboratory directors are accountable for all operational activities, including examination of all analytical data, quality assurance parameters, and report preparation and review.
4.4 Quality Assurance Officer (Acting)
The Quality Assurance Officer is responsible for laboratory certification, performance
evaluation studies, and document control. 4.5 Contract Program Quality Assurance Officer
The Project Quality Assurance Officer is responsible for the evaluation of all sample logging/numbering procedures, final evaluation of quality control data for all contract projects, and preparation of QA summary reports.
4.6 Project/Section Leaders
Project Leaders are responsible for daily laboratory activities relating to their individual project assignments. Responsibilities include: making daily work assignments for laboratory staff, generation and review of data and preparation and initial review of all laboratory data reports.
4.7 Laboratory Staff
The responsibilities of the laboratory staff include sample container and glassware preparation, calibration standard and reagent preparation, sample preparation, analysis, and preparation of analytical reports with quality control data for the

Section No. 4 Revision No. 6
Date 12 May 05 Page 2 of 2
project/section leaders and laboratory supervisor. Staff members will be familiar with all general laboratory procedures and quality assurance objectives.

Section No. 5 Revision No. 4
Date 12 May 05 Page 1 of 1
5.0 DATA QUALITY OBJECTIVES AND ASSESSMENT METHODS 5.1 Overview
The primary data quality objective is to provide a product that fulfills all project and/or agency requirements. The requirements for projects are established prior to their commencement. In the absence of specific data requirements, standard methods or verified alternative protocols will be routinely applied.
5.2 Objectives
The data that is produced from the laboratory must be scientifically valid, defensible, comparable, and of known precision and accuracy. Objective measures of data quality such as method blanks, duplicates, spikes, standards, and recoveries will be employed. Acceptance limits will be established for data accuracy and precision. Whenever possible, statistical methods such as confidence limits, significance tests and/or variability measures will be used to evaluate precision and accuracy of data as well as conformance to acceptance limits. Corrective action will be initiated when the quality of the data does not meet established quality standards.
5.3 Standard Operating Procedures
5.3.1 Standard Quality Control Procedures Where appropriate, standard quality control procedures, data reduction, and reporting will be in compliance with requirements in Standard Methods for the Examination of Water and Wastewater, 18th edition (1992), with requirements in USEPA Handbook for Analytical Quality Control in Water and Waste Water Laboratories: EPA-600/4-79-019, and with the requirements in USEPA Test Methods for Evaluation of Solid Waste: Physical/Chemical Methods, SW-846, 3rd edition, Update III, 1996.
5.3.2 Standard Operating Procedures
Written standard operating procedures (SOPs) for receipt of samples, tracking of custody, sample preparation and analysis, use of equipment and instrumentation shall be followed. These SOPs shall include use of standard data logging formats, logbook/worksheet entry procedures, and other written or printed documents relevant to the samples. These SOPs are available on request.
Section No. 6 Revision No. 4 Date 12 May 05
Page 1 of 3
6.0 SAMPLING PROCEDURES 6.1 Objectives
The reason for sampling and the parameters of concern for each sampling event establish the requirements for sample container type and preparation, sample amount and preservation, and the sampling technique. Information on the sampling site is assembled so that a project work plan can be developed for the collection of representative samples.
6.2 Preparation for Sampling
Prior to conducting project field sampling operations, pre-cleaned sample containers and sampling devices are assembled along with the necessary equipment and portable instrumentation. A team of trained personnel with appropriate protective equipment will then conduct actual sampling using established procedures.
6.2.1 Field Quality Measures
Field quality measures such as trip blanks for water control samples, field blanks, duplicates, and background references are employed to assure data quality. Sample filtration, when required, can be performed in the field. Sample preservation is routinely provided by using sample containers with pre-added preservatives. Sampling record sheets and chain-of-custody or record-of-custody forms are completed at the time of sampling to document collection operations. Samples are carefully placed in suitable containers or coolers for prompt transportation to the laboratory. Appendix D summarizes the type of sample container and preservation methods used, as well as the maximum acceptable holding time between sampling and analysis for various types of analyses and matrices. When available and applicable, the holding times, sample container type and preservatives will follow regulatory guidance.
6.2.2 Sampling Site Identification
Sampling sites will be identified in a field logbook or project sampling form used for recording information during the conduct of sampling activities. Each sampling site will be identified by exact location, which may include address, GPS coordinates, well number, or site name. A unique sample site name and/or number is recorded in the field logbook and the sample collection form. The sample site name and/or number is also used to identify the sample on the project sampling form and chain-of-custody form.

Section No. 6 Revision No. 4 Date 12 May 05
Page 2 of 3
6.2.3 Sample Container Inspection
Inspect sample containers for good closure, proper labeling, and correct number and type required for the site. Where split samples are being collected, additional containers will be needed.
6.3 Sample Collection 6.3.1 Sample Identification
When appropriate each sample will be uniquely identified by a number previously designated by the project/section officer. This number will also be used on the project sampling forms. The numbers assigned to splits, duplicate samples, and spiked samples will be coded in such a way to prevent easy identification as blind quality control samples when handled in the laboratory. Labels with adhesive backings and with the sample number on the face will be used. Extra labels will be available. Should more labels be required, they may be prepared with a permanent marking pen in the field, or a permanent marking pen may be used on the sample container. In the latter case, an adhesive label should be prepared and attached to the sample container as soon as the sample is returned to the laboratory. Ziplock bags used to carry samples will be labeled by writing appropriate identification directly on the bag using a permanent marking pen.
6.3.2 Collection of Field Replicate Quality Control Samples
Quality control criteria require that more than one set of samples be collected at a selected number of sampling events. These samples will be used to verify the consistency of results. Appropriate type and number of quality control samples will be specified with each project.
6.3.3 Field Storage of Samples
All sample containers will be kept in chilled storage in the field unless specific sampling protocol stipulates otherwise. Insulated ice chests and frozen plastic-encased coolants (Blue Ice, for example) will be used. For long term field storage of biological samples, dry ice will be used. Ice may also be used in sealed ziplock bags. The sampling team will have sufficient number of ice chests and frozen coolants to assure that samples remain chilled throughout the day. The samples must always be kept in the possession of the sampling team until they are transferred to the custody of the laboratory. Since the ice chests will have to be kept in a locked car or truck, the vehicle should be parked in the shade to the extent possible. Sampling vehicles

Section No. 6 Revision No. 4 Date 12 May 05
Page 3 of 3
should use unleaded fuels. Ice chests will be cleaned with water and stored uncovered after each day. Sealed refrigerants will be washed with water and put into a freezer for reuse. The vehicle will be refilled with fuel after samples are transferred when possible.
6.3.4 Storing and Shipping Samples 6.3.4.1 Storage at the Laboratory
The samples received at the laboratory will be kept in refrigerators or freezers. Temperature will be kept as close as possible to the storage temperature required for each sample matrix and type of analysis. Generally, refrigerators will be kept at 4 +/-2 degrees C, freezers will be kept at -15 +/-5 degrees C or colder. Storage shall be in an environment where the sample identification numbers will remain attached. Mechanical refrigeration units shall be used. The use of ice as a refrigerant for sample storage at the laboratory is not allowed.
6.3.4.2 Shipping
All samples will be refrigerated or frozen during shipment through the use of ice, cold packs, or dry ice. Samples will be shipped in insulated containers. All caps and lids will be checked for tightness prior to shipping. To the extent possible, transporting vehicles will use unleaded fuel.

Section No. 7 Revision No. 4
Date 12 May 05 Page 1 of 3
7.0 SAMPLE CUSTODY
The Department of Fish and Game's chain-of-custody procedures for sample tracking are initiated during the time of actual sample collection by field personnel and maintained throughout the time the samples are in their possession. Chain of custody documents must be initiated and maintained for all samples received by the laboratory.
7.1 Chain of Custody
The person responsible for sample collection must originate the chain-of-custody record. The sampler will clearly label the sample with the project name, sample location, field identification number, the date and time of sampling, and his/her own name and initials. The same information will be entered on the chain-of-custody record along with information concerning the sample type, the analyses to be performed and the sample container. The individual collecting the samples will be responsible for the custody of samples until they are transferred or properly dispatched. If samples are hand-carried to the laboratory by Fish and Game personnel, custody of samples will be transferred to laboratory staff. Shipping containers (ice chests) transported by commercial carrier will be secured with strapping tape. Documentation of the shipment will be kept with a copy of the chain-of-custody record by the person shipping the samples. The original copy of the chain-of-custody record will accompany the sample(s) when transported to a departmental or commercial laboratory.
The laboratory staff person logging the sample(s) in will carefully inspect each sample for chain-of-custody documentation, sample labeling, packing lists, and for the condition of the custody seals, sample packing materials, and the sample containers. Any discrepancies or problems associated with sample shipment will be documented on the chain-of-custody form. In the case of a discrepancy between information on the container and the COC form, the information written on the container will be used and the sample collector or project manager will be notified of the discrepancy. After inspection, the samples will be entered into the laboratory sample receiving logbook, and will be assigned a unique sample identification number. The following information shall be included when samples are logged-in:
• Laboratory number (assigned when samples are submitted)
• Laboratory storage location (refer or freezer no.) • Spill Title (if applicable)
• Suspects name (if applicable) • Index-PCA code (if applicable) • Sampler’s name, address and phone number

Section No. 7 Revision No. 4
Date 12 May 05 Page 2 of 3
• Date received by the laboratory • Analysis requested • Sample identification/location • Sample type (matrix) • Number of containers and container type • Sample preservation • Required report completion date • Signatures of person submitting samples and person receiving samples for the laboratory • Date samples received by the laboratory • Problem description (if applicable) • Incident location (if applicable) • Special instructions (if applicable)
The person logging the samples in will ensure that the samples are either retained in secure storage or are given directly to an authorized analyst. A copy of the chain-of- custody form will be used to provide analysis requirements to the analyst(s). This form will accompany the sample containers and/or prepared extracts as each authorized employee performs a required task on the samples. After all analyses have been completed and disposal of the sample is authorized, a designated sample custodian will make proper disposition of the sample with appropriate documentation. Disposal method and approximate disposal date will be noted in the laboratory log-in records. The completed chain-of-custody form(s) will be retained as a permanent part of the project record.
7.2 Sample Handling, Storage, and Holding Times
All samples will be handled, prepared, transported, and stored in a manner designed to minimize bulk loss, analyte loss, contamination or biological degradation. The
sample containers will be clearly labeled with permanent marker. Soil and tissue samples for organic constituents must be frozen to prevent degradation or
volatilization. Samples will be stored for the maximum sample holding time for the required analyses as specified for the analysis. Samples which do not have a maximum holding time specified, will be stored for the duration of the research or study activity unless the sample is consumed entirely for analysis. Thereafter, the laboratory supervisor or project leader will determine if the sample will be archived. When the holding time interval has passed and samples are approved for disposal, samples and the sample containers will be disposed of properly. It is the sole

Section No. 7 Revision No. 4
Date 12 May 05 Page 3 of 3
responsibility of the laboratory personnel to ensure that all applicable regulations are followed in the disposal of samples or related chemicals. If the contracting officer
should request return of a sample prior to the maximum holding time, it will be returned in a manner that meets Department of Transportation regulations.
Section No. 8 Revision No. 4
Date 12 May 05 Page 1 of 1
8.0 CALIBRATION PROCEDURES AND PREVENTIVE MAINTENANCE
All laboratory instruments and equipment that are used for laboratory measurements will be maintained and calibrated for good operating conditions that meet laboratory accuracy requirements.
The calibration/maintenance techniques will be performed according to a specific calibration standard operating procedure (SOP) which has been specified by the manufacturer's recommendations, an analytical or agency requirement, or by good laboratory practices.
Analytical standards to be used for instrument calibration are obtained from sources that have demonstrated accuracy levels, and are properly stored to ensure accuracy integrity. Calibration chemicals will be logged in and assigned a specific shelf life based on chemical stability. Non-chemical standards, instruments and equipment used for calibration purposes will be re-certified per an established schedule.
Routine maintenance will be performed by qualified laboratory personnel with recommended parts and supplies kept in stock. For some items, the services of an outside vendor will be used. The correct operation of instruments/equipment repaired by vendor services will be verified prior to use on projects.
An established schedule for the routine calibration or maintenance of the instrumentation and equipment will be developed based on manufacturer's recommendations, operational experience, procedural requirements and good laboratory practices. A maintenance log-book will be established for each instrument in which all maintenance will be recorded. Calibration results, which serve as a measure of instrument condition, must be kept with the project data files.

Section No. 9
Revision No. 6 Date 12 May 05
Page 1 of 8
9.0 ANALYTICAL PROCEDURES
For analysis mandated by regulatory agencies, specific methods have been designated for routine analyses with a particular range of concentrations and matrices. If methods are not stipulated, standard methods from a recognized authoritative source will be used for the tests. Analytical methods and reference sources routinely used at the Department of Fish and Game are listed in Appendix F. 9.1 Standard Procedures
All procedures developed and routinely used by the laboratory are documented with laboratory standard operating procedure (SOPs). In addition to the actual test procedure, SOPs include applicable references, acceptance limits, health and safety precautions, trouble-shooting guidelines, quality control requirements, sample preparation and documentation criteria, calculation methods and reporting protocol. Analysts are trained to perform sampling and testing tasks per the established SOP. Each analyst has access to a current copy of the procedure for the methods they perform. When it is not possible to perform an analysis per established procedures, the section supervisor is promptly notified and corrective action may be initiated.
9.2 Method Development
If a suitable standard method is not available, the laboratory technical staff will develop appropriate methods to meet the project requirements. Procedures developed within the laboratory are thoroughly validated to assure accurate, consistent results. Reference materials, replicate analyses, matrix spikes, and procedural blanks are some of the techniques applied to validate procedure development. Based on these techniques, project-specific acceptance limits can be developed, and SOPs can be written.
SOPs are reviewed and updated annually or when a change in procedure is made. The revisions are coordinated through the laboratory Quality Assurance Officer and are distributed to appropriate personnel. Prior versions of the SOPs are retrieved and archived or destroyed.
9.3 Analytical Methods Analytical methodology described in one of the following approved methodology manuals will be used as guidelines for all analytical methods used: • EPA Methods for the Chemical Analysis of Water and Wastes, EPA-600/4-79- 020
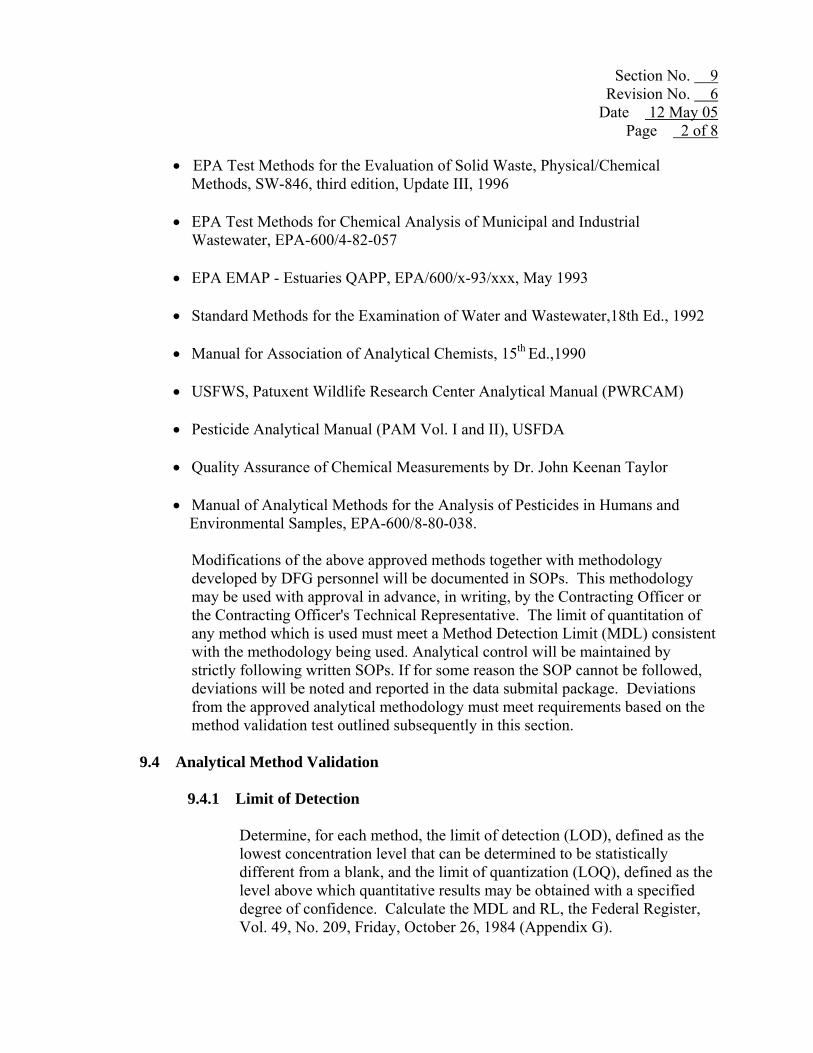
Section No. 9
Revision No. 6 Date 12 May 05
Page 2 of 8
• EPA Test Methods for the Evaluation of Solid Waste, Physical/Chemical Methods, SW-846, third edition, Update III, 1996
• EPA Test Methods for Chemical Analysis of Municipal and Industrial Wastewater, EPA-600/4-82-057
• EPA EMAP - Estuaries QAPP, EPA/600/x-93/xxx, May 1993
• Standard Methods for the Examination of Water and Wastewater,18th Ed., 1992
• Manual for Association of Analytical Chemists, 15th Ed.,1990
• USFWS, Patuxent Wildlife Research Center Analytical Manual (PWRCAM)
• Pesticide Analytical Manual (PAM Vol. I and II), USFDA
• Quality Assurance of Chemical Measurements by Dr. John Keenan Taylor
• Manual of Analytical Methods for the Analysis of Pesticides in Humans and Environmental Samples, EPA-600/8-80-038.
Modifications of the above approved methods together with methodology developed by DFG personnel will be documented in SOPs. This methodology may be used with approval in advance, in writing, by the Contracting Officer or the Contracting Officer's Technical Representative. The limit of quantitation of any method which is used must meet a Method Detection Limit (MDL) consistent with the methodology being used. Analytical control will be maintained by strictly following written SOPs. If for some reason the SOP cannot be followed, deviations will be noted and reported in the data submital package. Deviations from the approved analytical methodology must meet requirements based on the method validation test outlined subsequently in this section.
9.4 Analytical Method Validation 9.4.1 Limit of Detection
Determine, for each method, the limit of detection (LOD), defined as the lowest concentration level that can be determined to be statistically different from a blank, and the limit of quantization (LOQ), defined as the level above which quantitative results may be obtained with a specified degree of confidence. Calculate the MDL and RL, the Federal Register, Vol. 49, No. 209, Friday, October 26, 1984 (Appendix G).

Section No. 9
Revision No. 6 Date 12 May 05
Page 3 of 8
9.4.2 Standard Reference Material Test
To the extent that a standard reference material (NIST or National Research Council of Canada) can be obtained and when appropriate or required, it will be analyzed with each set of samples or every twenty samples for sets greater than twenty. To validate a new or non-standard method for limited use, comparability data will be generated.
All results must be within 65-135% of the 95% certified confidence interval for the reference materials unless otherwise stated.
9.4.3 Sample Duplicate Test
For each set of samples, analyze one sample in duplicate for each analyte in question or one duplicate for every twenty samples.
9.4.4 Spike Recovery Test
One spike recovery test will be run for each set of twenty samples for each analyte on each matrix type analyzed. For method validation, each matrix will be fortified with analyte at the reporting limit. In general, recovery values for sample spikes must be greater than 50 percent for method validation unless otherwise stated.
9.4.5 Method Documentation
Maintain a file containing all validation and modification reports. Upon completion of the validation tests, prepare a data report detailing the results.
9.5 Round-Robin Studies
The DFG laboratories will participate in round-robin studies and/or other standard reference sample programs as an on-going laboratory QC effort.
9.6 Organization of Laboratory
Qualifications of personnel is acknowledged to be very important to the laboratory. When hired, chemists and technicians must have knowledge of laboratory protocol. Such experience can be obtained from laboratory experience in another facility or satisfactory completion of suitable college course work. Anyone conducting analytical procedures in the laboratory is responsible for the accuracy of those procedures and is answerable to the Laboratory Director. New personnel will be trained by a qualified analyst and will report to the appropriate
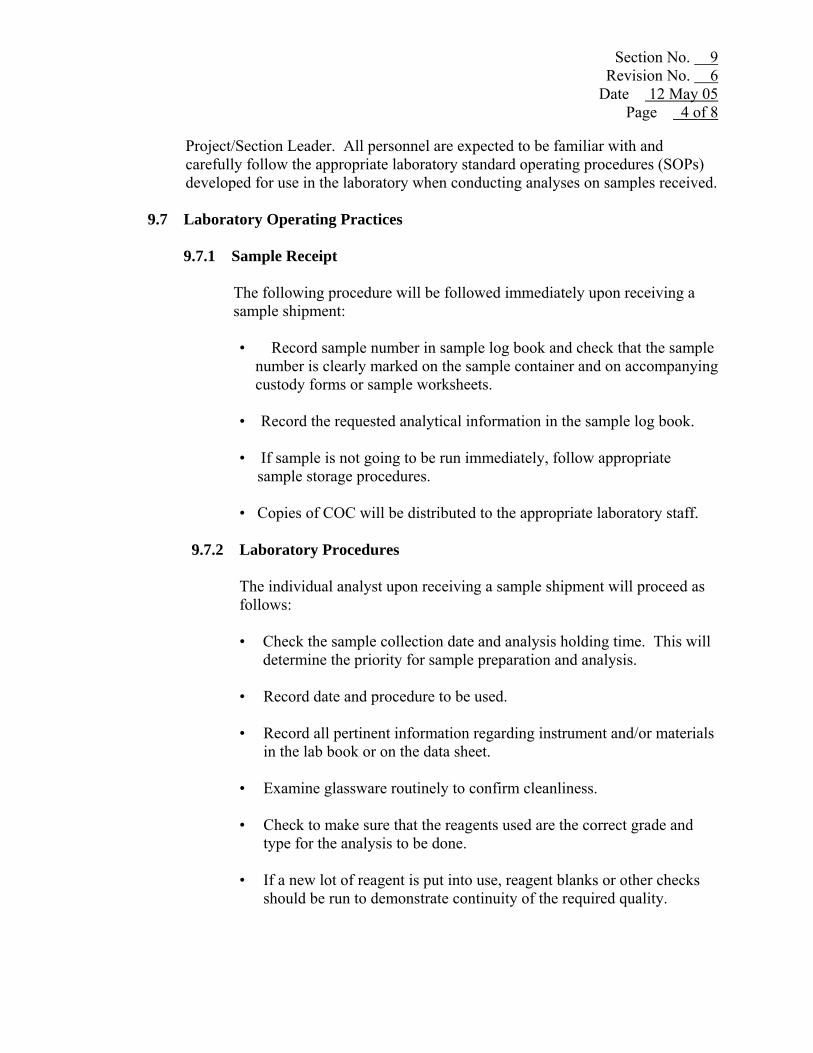
Section No. 9 Revision No. 6
Date 12 May 05 Page 4 of 8
Project/Section Leader. All personnel are expected to be familiar with and carefully follow the appropriate laboratory standard operating procedures (SOPs) developed for use in the laboratory when conducting analyses on samples received.
9.7 Laboratory Operating Practices
9.7.1 Sample Receipt
The following procedure will be followed immediately upon receiving a sample shipment:
• Record sample number in sample log book and check that the sample
number is clearly marked on the sample container and on accompanying custody forms or sample worksheets.
• Record the requested analytical information in the sample log book.
• If sample is not going to be run immediately, follow appropriate sample storage procedures.
• Copies of COC will be distributed to the appropriate laboratory staff.
9.7.2 Laboratory Procedures
The individual analyst upon receiving a sample shipment will proceed as follows:
• Check the sample collection date and analysis holding time. This will determine the priority for sample preparation and analysis.
• Record date and procedure to be used.
• Record all pertinent information regarding instrument and/or materials in the lab book or on the data sheet.
• Examine glassware routinely to confirm cleanliness. • Check to make sure that the reagents used are the correct grade and type for the analysis to be done.
• If a new lot of reagent is put into use, reagent blanks or other checks should be run to demonstrate continuity of the required quality.
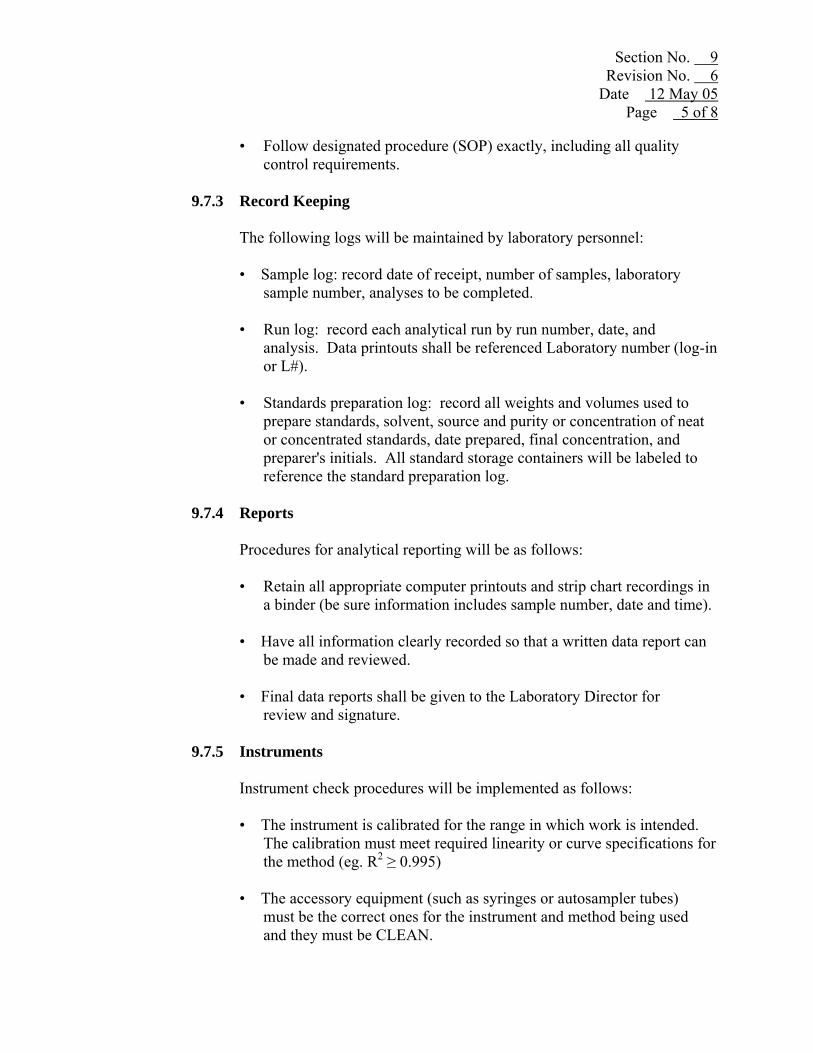
Section No. 9 Revision No. 6
Date 12 May 05 Page 5 of 8
• Follow designated procedure (SOP) exactly, including all quality control requirements.
9.7.3 Record Keeping
The following logs will be maintained by laboratory personnel: • Sample log: record date of receipt, number of samples, laboratory sample number, analyses to be completed. • Run log: record each analytical run by run number, date, and analysis. Data printouts shall be referenced Laboratory number (log-in or L#). • Standards preparation log: record all weights and volumes used to
prepare standards, solvent, source and purity or concentration of neat or concentrated standards, date prepared, final concentration, and preparer's initials. All standard storage containers will be labeled to reference the standard preparation log.
9.7.4 Reports
Procedures for analytical reporting will be as follows: • Retain all appropriate computer printouts and strip chart recordings in a binder (be sure information includes sample number, date and time).
• Have all information clearly recorded so that a written data report can be made and reviewed.
• Final data reports shall be given to the Laboratory Director for review and signature.
9.7.5 Instruments
Instrument check procedures will be implemented as follows: • The instrument is calibrated for the range in which work is intended. The calibration must meet required linearity or curve specifications for the method (eg. R2 ≥ 0.995)
• The accessory equipment (such as syringes or autosampler tubes) must be the correct ones for the instrument and method being used and they must be CLEAN.

Section No. 9 Revision No. 6
Date 12 May 05 Page 6 of 8
• The reagents being used are the proper ones, and they have been checked for interferences by running a blank.
• Analytical results (raw data) are stored in hardcopy or electronically with the project data files. • If the instrument or other equipment does not appear to be working properly, contact the section supervisor IMMEDIATELY. 9.7.6 Quality Assurance Procedure
The following quality assurance procedures form the foundation for
quality control practices in the laboratory. These procedures will be practiced as a matter of routine unless superceded or modified by specific quality assurance requirements of a given project.
9.7.6.1 Chemical Analysis – General
• At least one method blank will be run for each set of samples of one matrix type to determine whether interferences are introduced. Method blanks will be run through the complete analytical method along with the sample set. Blanks shall be run with a minimum frequency of one blank per 20 samples unless otherwise specified.
• At least one sample will be fortified or one SRM of similar matrix to that of the samples will be used and run with each set of samples to measure the analytical accuracy. When appropriate, the sample will be spiked with the analyte(s) at the expected level in the sample or at mid- range of the standard curve. A minimum of one fortified sample or SRM will be run with each sample set of 20 samples or less.
• At least one sample or fortified sample will be prepared in duplicate and analyzed with each set of samples of one matrix
type to measure analytical precision. A minimum of one duplicate will be analyzed for each set of 20 samples or less.
• Prepare new standards as needed according to the guidelines in section 8.0. Record all the required information in the standards preparation log. Freshly-made standards should be compared to the response of existing calibration standards or reference standards before using in order to verify the
reliability of the new standard.

Section No. 9 Revision No. 6
Date 12 May 05 Page 7 of 8
• When washing glassware, follow procedures outlined in method SOPs.
• All QA procedures used will be documented and stored with the results in the project files. • Additional periodic checks of accuracy or precision will be required as deemed necessary by laboratory supervisor.
9.7.6.2 Review of Quality Control/Analytical Data • All quality control/analytical data will be reviewed for correctness of the analytical, calibration, and data reduction
procedures used, and initialed by the section supervisor, QAO or laboratory director before the accompanying data may be
reported.
• If after being reviewed, a set of data are determined to be out of control, the laboratory director shall be notified and an appropriate course of corrective action will be prescribed.
(See sections 11, 14, and 15 for data evaluation criteria and corrective measures.) The analyst shall keep records of the corrective measures taken. No additional analytical data will be generated until the problem has been identified and corrected.
9.7.7 Laboratory Safety
• Safety glasses will be worn in designated laboratory areas at all times. Laboratory visitors will be issued safety glasses when necessary. • Lab coats or aprons will be worn while working with any solvents, acids, caustics, condensers, or designated instrumentation. • Walkways, exits, and safety shower/eyewash stations will be clear of debris at all times. • No horseplay of any kind will be tolerated. • No food or drink will be allowed in laboratory areas.

Section No. 9 Revision No. 6
Date 12 May 05 Page 8 of 8
• Additional safety and emergency procedures outlined in the Standard Operating Procedures will be followed. • Refer to laboratory Injury and Illness Prevention Plan for additional safety measures.
9.7.8 Laboratory Cleanliness
• Glassware will be washed and prepared for use in accordance with the procedures set forth the method SOPs. • Clean glassware will be returned to its proper place as soon as it has been cleaned appropriately and properly capped.
• Counter tops will be kept clean.
• Spills will be cleaned up immediately. • Broken glassware will be placed in a specified container.
9.7.9 Records
Records on all relevant data are to be easily located in files that pertain to a specific analysis, question, or project.
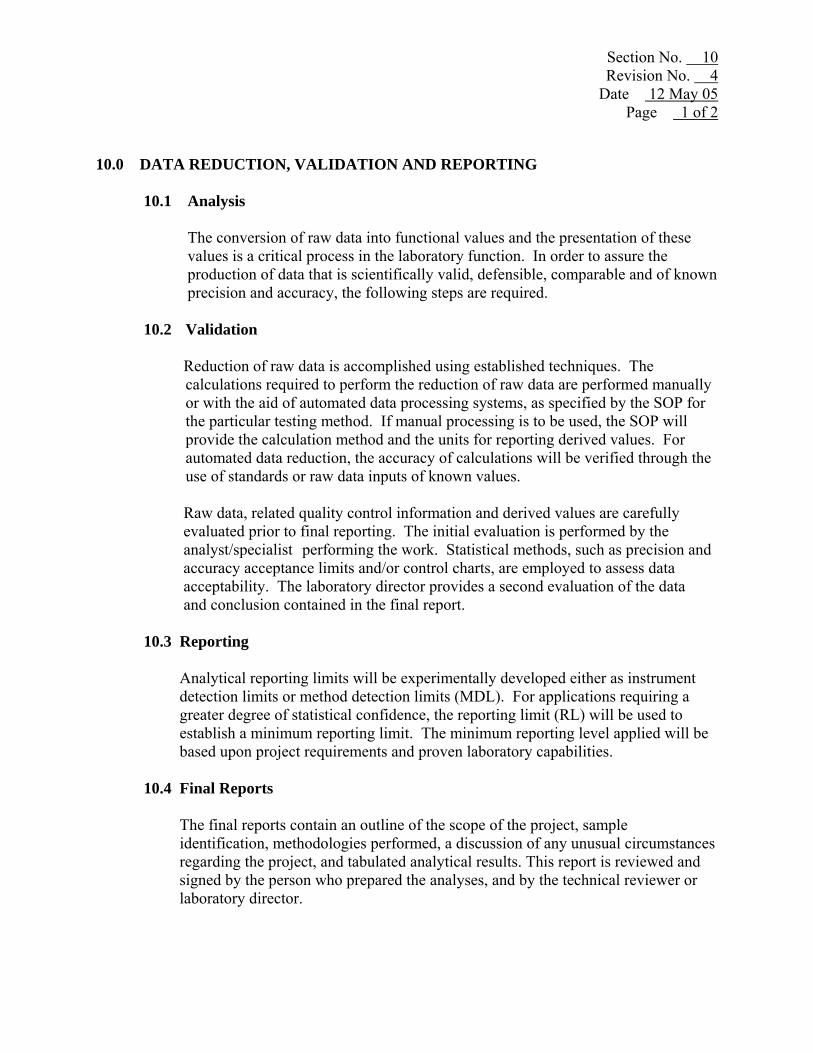
Section No. 10 Revision No. 4
Date 12 May 05 Page 1 of 2
10.0 DATA REDUCTION, VALIDATION AND REPORTING
10.1 Analysis
The conversion of raw data into functional values and the presentation of these values is a critical process in the laboratory function. In order to assure the production of data that is scientifically valid, defensible, comparable and of known precision and accuracy, the following steps are required.
10.2 Validation
Reduction of raw data is accomplished using established techniques. The calculations required to perform the reduction of raw data are performed manually or with the aid of automated data processing systems, as specified by the SOP for the particular testing method. If manual processing is to be used, the SOP will provide the calculation method and the units for reporting derived values. For automated data reduction, the accuracy of calculations will be verified through the use of standards or raw data inputs of known values. Raw data, related quality control information and derived values are carefully evaluated prior to final reporting. The initial evaluation is performed by the analyst/specialist performing the work. Statistical methods, such as precision and
accuracy acceptance limits and/or control charts, are employed to assess data acceptability. The laboratory director provides a second evaluation of the data and conclusion contained in the final report.
10.3 Reporting
Analytical reporting limits will be experimentally developed either as instrument detection limits or method detection limits (MDL). For applications requiring a greater degree of statistical confidence, the reporting limit (RL) will be used to establish a minimum reporting limit. The minimum reporting level applied will be based upon project requirements and proven laboratory capabilities.
10.4 Final Reports
The final reports contain an outline of the scope of the project, sample identification, methodologies performed, a discussion of any unusual circumstances regarding the project, and tabulated analytical results. This report is reviewed and signed by the person who prepared the analyses, and by the technical reviewer or laboratory director.

Section No. 10 Revision No. 4
Date 12 May 05 Page 2 of 2
10.5 Record Keeping and Maintenance
Instrument logbooks will be maintained with each instrument. A record will be made of any conditions or incidents the analyst encounters which are in any way unusual, or deviate from the SOP.
When maintenance is required, a record will be made of the symptom, the repair performed, and the individual performing the repair.
All observations, electronic records, and most printouts, and other raw material generated in the course of any analysis will be saved. They will be filed with reference to laboratory log number, date, batch number, analyst, and other information deemed pertinent. Also recorded in the laboratory notebook or bench sheets will be all weights or other types of raw data generated in the laboratory but not printed on a hard copy by the data generating device. All documentation in the laboratory notebook or bench sheets will be made in ink. Corrections to notebooks or other data records will be made by crossing a single inked line through the error, entering and initialing the correction, and recording the date.
The records to be maintained in the laboratory include such items as sample tracking records, notebooks, bench sheets, instrument read-out records, computer printouts, quality control data, and raw data. The records will be maintained for the life of the project and they will be provided to the organizations contracting for the research or studies upon request.

Section No. 11 Revision No. 5
Date 12 May 05 Page 1 of 2
11.0 INTERNAL QUALITY CONTROL CHECKS AND FREQUENCY Quality control checks are routinely performed in the WPCL operations. These checks
may be increased or modified to meet the needs of a particular analysis or project. 11.1 QA Samples
Internal quality assurance samples (fortified samples and duplicates, appropriate reference materials, duplicate samples, and method or procedural blanks) will be analyzed with each set or every twenty analyses being performed. These internal quality assurance analyses are conducted for the parameters being monitored by that analytical procedure. In addition, the compounds contained in the quality assurance sample will be representative of those compounds being monitored. Accuracy is measured by calculating percent recovery for laboratory control spikes (fortified reagent sample) and matrix spikes (fortified samples) and certified reference materials (CRMs or SRMs). Accuracy is also determined for CRMs by comparing the analysis results with the certified values. CRM results are acceptable if they are within 65-135% of the 95th percentile confidence interval of the consensus values for the certified materials.
The results of all QA analyses and the percent recoveries for fortified samples and
reference materials will be calculated and documented. 11.2 Duplicate Samples
One duplicate sample and/or a matrix spike duplicate or laboratory control spike duplicate will be analyzed for each set of twenty samples analyzed. The relative percent difference for each constituent is calculated as follows:
RPD = {(D1-D2)/[(D1+D2)/2]}x100 Where, RPD = Relative Percent Difference D1 = First Sample Value D2 = Second Sample Value (duplicate)
The results of all duplicate determinations and the calculated relative percent difference will be reported with the data sets. For RPD, use a control limit of 25 percent unless otherwise specified by a project specific QAPP. If either sample value is less than the MDL, the notation of "ND" (not detected) will be reported. If the precision falls outside the control limits, the analysis results will be reported with the appropriate data qualifier.

Section No. 11 Revision No. 5
Date 12 May 05 Page 2 of 2
11.3 Fortified Matrix (MS/MSD) Sample Analyses
When required, matrix spike and matrix spike duplicate analyses will be conducted at a rate of five percent. The spike will be added prior to any digestion, extraction, or distillation steps as a check on the sample preparation and analysis. An amount of analyte will be added to the sample that is ten times the MDL or equivalent to the analyte concentration. Recovery values are calculated as follows:
Recovery = [(Da-D)/Ds]x100 Where, Recovery = Percent Recovery Da = Analysis value of fortified sample D = Analysis value of sample without spike Ds = Amount of spike added
Recovery values for fortified samples must be greater than 50 percent except where a specific method (SOP) or project specific QAPP require a different acceptable range. Exceptions shall be noted in the project specific data quality objectives. When a specific method and analyte require a different acceptable recovery range, as determined by actual spike recovery runs, the acceptable range shall be noted in the Standard Operating Procedure for that method. If the recovery falls outside of the acceptable recovery range, the analysis results will be qualified or rejected. If the results are rejected, the batch of samples associated with the rejected results may need to be re-analyzed. When sample concentrations are less than the MDL, the value of "0" will be used as the sample result concentration for purposes of calculating spike recoveries. All fortified sample results will be reported with the data package.
If the percent recovery for matrix spike is unacceptable, there might be an interference due to the matrix. The sample will be diluted to lower the interference and re-analyzed. If dilution doesn’t work, the method of standard additions will be used. If matrix interference is determined to be the cause of unacceptable recoveries, the data will be qualified.
11.4 Method Blanks
Method blanks will be analyzed at a minimum of once for every batch of samples. Blank concentrations should not exceed the reporting limit for the analyte. If blank values exceed the reporting limit, the source of the contamination should be investigated and corrected, and the results associated with the contaminated blank re-analyzed or qualified. All blank analysis results will be reported with the data package.

Section No. 12 Revision No. 6
Date 12 May 05 Page 1 of 1
12.0 SYSTEM AUDITS The system audit is an on-site review which provides a qualitative appraisal of a project
data set. 12.1 System Audit
The Quality Assurance Officer or person acting in that capacity conducts a QA/QC evaluation of each project when data are reported. This evaluation includes a review of QC data, logbooks and other documentation. A report of the
findings is submitted to the laboratory director and project lead chemist. The project lead chemist may be required to re-analyze samples associated with the unsatisfactory findings.

Section No. 13 Revision No. 3
Date 12 May 05 Page 1 of 1
13.0 PREVENTATIVE MAINTENANCE Maintenance on analytical instruments will be performed by WPCL chemists or by
manufacturer’s service personnel. An inventory of critical spare parts (for gas chromatographs - septa, syringes, column ferrules, backup column, etc.; for atomic adsorption spectrophotometers -- AA lamps, quartz cell, plastic tubing, etc.) will be maintained on hand.
Fume hoods will be checked quarterly. The results and the ventilation capacity across the
face of the fume hood and the inspection date will be posted on an exterior wall of the fume hoods.
Equipment manuals containing trouble-shooting SOPs will be kept near the instruments.
Instrument operators are responsible for daily maintenance and for maintaining instrument logs. These logs will contain the date, operator’s initials and description of routine maintenance procedures. Each entry into the run log will be initialed by the individual making the entry.

Section No. 14 Revision No. 2
Date 12 May 05 Page 1 of 1
14.0 ROUTINE ASSESSMENT OF DATA PRECISION, ACCURACY, AND COMPLETENESS
14.1 Precision
Precision shall be assessed with each sample set for each analysis type. Precision will be expressed in terms of relative error as the percent deviation of the duplicate results from the original results obtained. The equation for determining precision is:
RPD = (D1-D2)/[(D1+D2)/2]x100 Where RPD = Relative Percent Difference D1 = First Sample Value D2 = Second Sample Value (duplicate) 14.2 Accuracy Accuracy will be assessed on a regular basis in each set of samples for each
analysis type by comparison of the analytical results of internal QA samples provided or approved by the QA Officer with accepted concentrations. Accuracy
will be expressed in terms of percent recovery. Percent recovery is calculated as follows:
Percent Recovery = [(Da-D)/Ds]x100 Where, Da = Analysis value of fortified sample D = Analysis value of sample without spike Ds = Amount Spiked 14.3 Completeness
Completeness shall be assessed for each sample set and for each analysis type. The comparison for completeness will consist of a comparison of the number and type of analyses scheduled to be performed with those analyses successfully completed. Completeness shall be expressed as the percentage of analyses successfully completed relative to the number of analyses scheduled to be performed for each analysis type.

Section No. 15 Revision No. 3
Date 12 May 05 Page 1 of 1
15.0 CORRECTIVE ACTION Corrective action includes a variety of activities starting with the individual analyst
applying the elements of quality control to a particular task. At this level, the corrective action takes the form of problem identification based on spike, calibration, or recovery results that exceed acceptance limits. Appropriate action to be taken at this stage includes checking calculations or calibrations, preparing new standards or spiking solutions, re-analyzing samples or re-extracting and re-analyzing samples. If the above actions do not correct the matter, the laboratory director is notified. Project work requiring the use of the problem method or defective instrument will be suspended until the problem has been resolved.
A review of data from reference standards, blind duplicates and standards may also
indicate a necessity for corrective action. In these instances, corrective action for out-of-limit values are normally requested by the Quality Assurance Officer.
The data generated during the period of problem identification will not be reported,
unless additional analysis is not possible due to restricted sample availability, or time constraints. In this case, the result will be reported with qualifications that have been clearly identified and approved by project officials.
All corrective actions are recorded in laboratory notebooks, instrument logbooks, or
electronically with project data packages. These records are maintained at least eight years (unless otherwise required by project specific QAPP) in files at the laboratory. These are always available for review during external audits. These records include the analyst’s comments on the corrective action such as calibrations, preparing new standards or spiking solutions, or re-analyzing samples and the results of corrective action.
The final disposition of documents is consistent with agency record-keeping procedures.
Paper copies of all laboratory notebooks, benchsheets, instrument logbooks, and electronic data packages are part of the permanent archives.

Section No. 16 Revision No. 3
Date 12 May 05 Page 1 of 1
16.0 QUALITY ASSURANCE COMMUNICATION WITH MANAGEMENT Communication with all levels of management concerning quality subjects is an ongoing
process and routine quality issues are communicated to appropriate levels of management. The results of performance audit evaluation sample analyses are provided to the laboratory director, as well as to the lead chemists and analysts. If significant QA problems are experienced or observed in any aspect of lab operations, the laboratory director is promptly notified.

Section No. 17 Revision No. 1
Date 12 May 05 Page 1 of 1
17.0 STAFF TRAINING AND DOCUMENTATION
17.1 Hiring Process
People often begin their careers at the Water Pollution Control Laboratory (WPCL) as temporary employees. Under these circumstances, screening and reference confirmation is undertaken by the laboratory director and/or lead chemists. If/when the employee becomes permanently hired by CDFG or SJSUF, she/he completes and signs the agency employment documents, and those papers are retained in the employee’s personnel file.
New employees hired by CDFG and SJSUF provide documentation of skills they already possess via publications, detailed resumes, letters of recommendation, and self-certification. Written management and/or peer performance reviews are maintained in the individual’s personnel files. Every staff member is formally evaluated annually using a combination of self and supervisor evaluation. Job descriptions are reviewed and may be updated at that time.
17.2 Safety Training and Meetings
On a yearly basis, all staff attend at least one safety seminar. In addition, staff attend the laboratory’s regular safety meetings. The agendas from all staff meetings which include health and safety concerns will be signed by the attendees, and copies will be retained in the safety meeting file.

Section No. 18 Revision No. 1
Date 12 Mar 92 Page 1 of 2
18.0 Glossary Accuracy - combination of bias and precision of an analytical procedure, which reflects the closeness of a measured value to a true value.
Bias - consistent deviation of measured values from the true value, caused by systematic errors in a procedure.
Calibration check standard - standard used to determine the state of calibration of an instrument between periodic recalibrations. Confidence coefficient - the probability, %, that a measurement result will lie within the confidence interval or between the confidence limits. Confidence interval - set of possible values within which the true value will lie with a specified level of probability. Confidence limit - one of the boundary values defining the confidence interval.
Detection limits - Various limits in increasing order are: Instrument detection limit (IDL)-the constituent concentration that produces a signal greater than five times the signal/noise ratio of the instrument. This is similar in many respects, to "critical level" and "criterion of detection." The latter limit is stated as 1.645 times the s of blank analyses.
Lower limit of detection (LLD) - the constituent concentration in reagent water that produces a signal 2(1.645) s above the mean of blank analyses. This sets both
Type I and Type II errors at 5 %. Other names for this limit are "detection limit" and "limit of detection" (LOD).
Method detection limit (MDL) - the constituent concentration that, when processed through the complete method, produces a signal with a 99% probability that it is
different from the blank. For seven replicates of the sample, the mean must be 3.14s above the blank where it is the standard deviation of the seven replicates. The MDL will be larger than the LLD because of the few replications and
the sample processing steps and may vary with constituent and matrix. Limit of quantization (LOQ) - the constituent concentration that produces a signal sufficiently greater than the blank that it can be detected within specified limits by
good laboratories during routine operating conditions. Typically it is the concentration that produces a signal 10s above the reagent water blank.
Duplicate - usually the smallest number of replicates (two) but specifically herein refers to duplicate samples, i.e. two samples taken at the same time from one location. Internal standard - a pure compound added to a sample extract just before instrumental analysis to permit correction for inefficiencies. Laboratory control standard - a standard, usually certified by an outside agency, used to measure the bias in a procedure. For certain constituents and matrices, use National Institute of Standards and Technology (NIST)* Standard Reference Materials when they are available. Precision - measure of the degree of agreement among replicate analyses of a sample, usually expressed as the standard deviation.

Section No. 18 Revision No. 1
Date 12 Mar 92 Page 2 of 2
Quality assessment - procedure for determining the quality of laboratory measurements by use of data from internal and external quality control measures. Quality assurance - a definitive plan for laboratory operation that specifies the measures used to produce data of known precision and bias. Quality control - set of measures within a sample analysis methodology to assure that the process is in control. Random error - the deviation in any step in an analytical procedure that can be treated by standard statistical techniques. Replicate - repeated operation occurring within an analytical procedure. Surrogate standard - a pure compound added to a sample in the laboratory just before processing so that the overall efficiency of a method can be determined. Type I error - also called alpha error, is the probability of deciding a constituent is
present when it actually is absent. Type II error - also called beta error, is the probability of not detecting a constituent when
it actually is present. ----------- *Formerly National Bureau of Standard (NBS).

APPENDIX A
ORGANIZATIONAL CHART

Dave Crane Laboratory Director
Petroleum/ Hazmat Chemistry (Inland)
Lead Chemist Charles (Bob) Todd
Chemists Jim McCall
Terry Chappelle
Bioaccumulation Monitoring
Lead Chemist
Kathleen Regalado
Chemists Gary Munoz
Leo Gilman Matt Hicks
Senior Lab Asst
Laurie Smith
Pesticide Investigations and
Monitoring
Lead Chemist Abdou Mekebri
Chemists
Gloria Blondina Gregor Baltzell
Mary Curry Sarah Mohammed
Ify Nnoli Martice Vasquez
Lab Technician
Rafiah Mohammed
Inorganic Chemistry
Lead Chemist
Patricia Bucknell
Chemists Cerasela Onuta Kelley Paxton Jennifer Riley Wilson Durant
AdministrationCharlene Lane
MST Pam Hall
OT
FacilitiesGary Forkner
F&W Technician
Field Collections
Environ. Sci
Glenn Sibbald
Retired Annuitant Jack Linn
Quality Assurance/Safety/Data Management
Tom Lew Staff Chemist/Safety Officer/Acting QA Officer
Loc Nguyen
Chemist/Contract Pgrm QA Officer
Ken Westerink LIMS Consultant
Petroleum Chemistry Laboratory
(Marine)
Lead Chemist Susan Sugarman
Staff Chemist
Marida Martin
Chemist Shane Stahl

APPENDIX B
QUALIFICATIONS AND SPECIFICATIONS OF KEY PERSONNEL (Resumes Available upon Request)
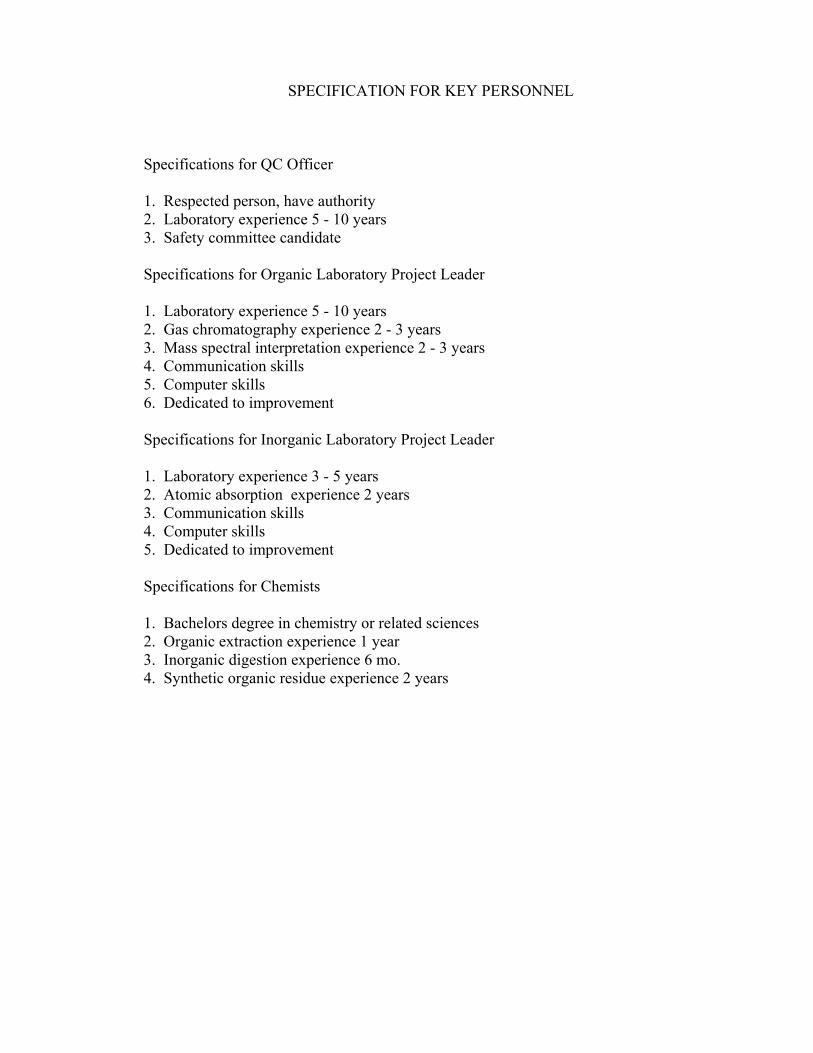
SPECIFICATION FOR KEY PERSONNEL Specifications for QC Officer 1. Respected person, have authority 2. Laboratory experience 5 - 10 years 3. Safety committee candidate Specifications for Organic Laboratory Project Leader 1. Laboratory experience 5 - 10 years 2. Gas chromatography experience 2 - 3 years 3. Mass spectral interpretation experience 2 - 3 years 4. Communication skills 5. Computer skills 6. Dedicated to improvement Specifications for Inorganic Laboratory Project Leader 1. Laboratory experience 3 - 5 years 2. Atomic absorption experience 2 years 3. Communication skills 4. Computer skills 5. Dedicated to improvement Specifications for Chemists 1. Bachelors degree in chemistry or related sciences 2. Organic extraction experience 1 year 3. Inorganic digestion experience 6 mo. 4. Synthetic organic residue experience 2 years

APPENDIX C
SOP’s
(Standard Operating Procedures for specific methods are available on request)

APPENDIX D
SAMPLE CONTAINERS, PRESERVATION AND HOLDING TIME

Samples Analyzed for Synthetic Organics Polynuclear Aromatic Hydrocarbons or Petroleum Hydrocarbons
Sample Type Sample Size Containers Preservation Holding Time Water One gallon Glass 1,2 4o C, pH 5-9 7 days 3 Animal Whole Al foil -20o C 6 mo. Vegetation One pint Al foil -20o C 6 mo. Sediment One pint Glass 1 -20o C 14 days 2
1. Previously rinsed with petroleum ether and dried, with Teflon liner in lids.
2. Sample must be extracted within the specified days and analyzed within 40 days of extraction.
3. PAHs are light sensitive, therefore, sample extracts and standards must be stored in foil wrapped containers.
Samples Analyzed for Trace Elements
Sample Type Sample Size Containers Preservation Holding Time Water 500 ml LPE1 HNO3 to pH<2 6 mo.2 Animal Whole Plastic bag -20o C 6 mo. Sediment One pint LPE1 1 -20o C 6 mo.
1. Previously soaked and rinsed with 1N HNO3. 2. Six months except mercury and TBT which are 28 days.

APPENDIX E
FORMS

APPENDIX F
ANALYTICAL METHODS AND REFERENCE SOURCES

APPENDIX G
METHOD DETECTION LIMIT AND REPORTING LIMIT

California Department of Pesticide Regulation Draft PAM QAPP Sacramento, CA Revision 0.0 4/18/2006
APPENDIX 2. DETERMINATION OF ORGANOPHOSPHOROUS PESTICIDES IN WATER
SAMPLES
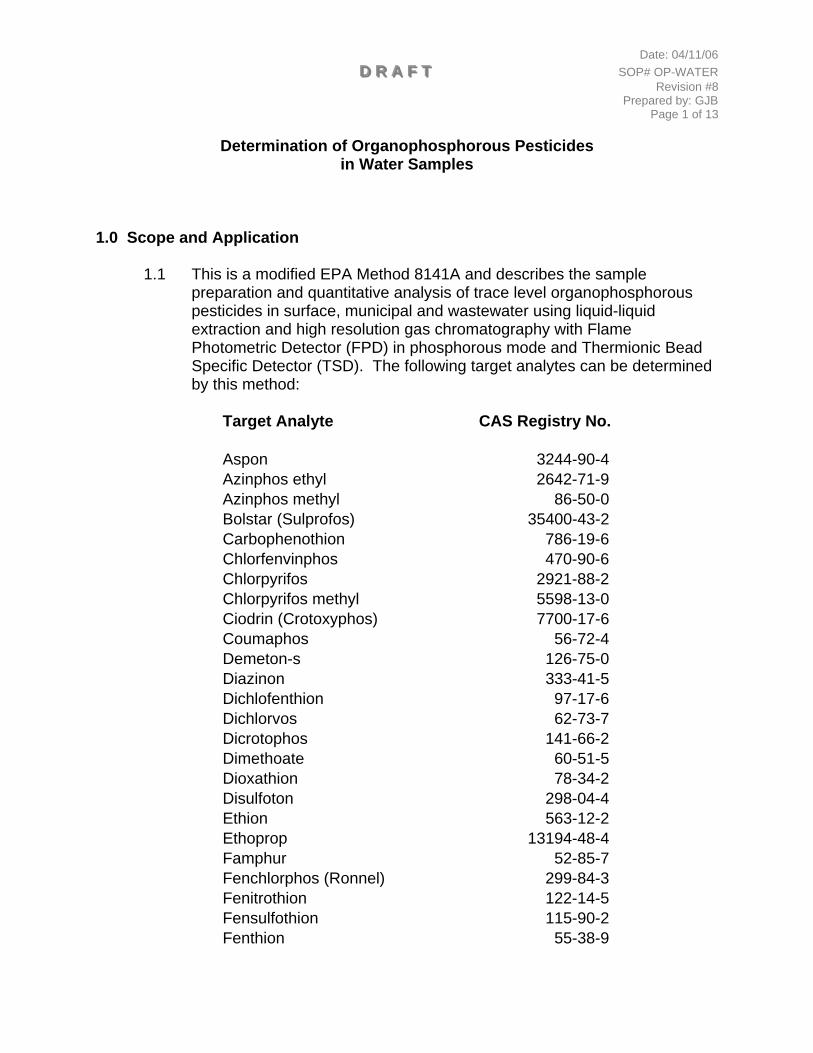
Date: 04/11/06
DDD RRR AAA FFF TTT SOP# OP-WATER Revision #8
Prepared by: GJB Page 1 of 13
Determination of Organophosphorous Pesticides
in Water Samples
1.0 Scope and Application
1.1 This is a modified EPA Method 8141A and describes the sample preparation and quantitative analysis of trace level organophosphorous pesticides in surface, municipal and wastewater using liquid-liquid extraction and high resolution gas chromatography with Flame Photometric Detector (FPD) in phosphorous mode and Thermionic Bead Specific Detector (TSD). The following target analytes can be determined by this method:
Target Analyte CAS Registry No.
Aspon 3244-90-4 Azinphos ethyl 2642-71-9 Azinphos methyl 86-50-0 Bolstar (Sulprofos) 35400-43-2 Carbophenothion 786-19-6 Chlorfenvinphos 470-90-6 Chlorpyrifos 2921-88-2 Chlorpyrifos methyl 5598-13-0 Ciodrin (Crotoxyphos) 7700-17-6 Coumaphos 56-72-4 Demeton-s 126-75-0 Diazinon 333-41-5 Dichlofenthion 97-17-6 Dichlorvos 62-73-7 Dicrotophos 141-66-2 Dimethoate 60-51-5 Dioxathion 78-34-2 Disulfoton 298-04-4 Ethion 563-12-2 Ethoprop 13194-48-4 Famphur 52-85-7 Fenchlorphos (Ronnel) 299-84-3 Fenitrothion 122-14-5 Fensulfothion 115-90-2 Fenthion 55-38-9

Date: 04/11/06
DDD RRR AAA FFF TTT SOP# OP-WATER Revision #8
Prepared by: GJB Page 2 of 13
Fonofos (Dyfonate) 944-22-9 Leptophos 21609-90-5 Malathion 121-75-5 Merphos 150-50-5 Methidathion 950-37-8 Mevinphos (Phosdrin) 7786-34-7 Molinate 2212-67-1 Naled (Dibrom) 300-76-5 Parathion, Ethyl 56-38-2 Parathion, Methyl 298-00-0 Phorate 298-02-2 Phosmet 732-11-6 Phosphamidon 13171-21-6 Sulfotep 3689-24-5 Terbufos 13071-79-9 Tetrachlorvinphos 22248-79-9 Thiobencarb 28249-77-6 Thionazin 297-97-2 Tokuthion 34643-46-4 Trichlorfon 52-68-6 Trichloronate 327-98-0 Triphenyl phosphate (surrogate) 115-86-6
1.2 The estimated detection limit for each analyte is listed in Table 1. The actual MDL may differ from those listed, depending upon the nature of interferences in the sample matrix. Validation of the target analytes produced recoveries greater than 70 percent for most analytes. Some target compounds are widely accepted as having lower recoveries, as listed in Section 9.3.3. The range of percent recoveries for each analyte is also included in Table 1.
1.3 If possible, unknowns in the sample will be qualitatively confirmed for compound identification by Gas Chromatography with a Mass Spectrometer – Ion Trap Detector (GC/MS-ITD).

Date: 04/11/06
DDD RRR AAA FFF TTT SOP# OP-WATER Revision #8
Prepared by: GJB Page 3 of 13
______________________________________________________________ Table 1. Organophosphorous pesticides analyzed, their Minimum Detection Limits
(MDL), Reporting Limits (RL) and Range of Percent Recovery in water. Target Analytes MDL (µg/l) RL (µg/l) Recovery Range (%)*
Aspon 0.030 0.050 85 – 105 Azinphos ethyl 0.030 0.050 95 – 110 Azinphos methyl (Guthion) 0.030 0.050 50 – 90 Bolstar (Sulprofos) 0.030 0.050 80 – 95 Carbophenothion 0.030 0.050 90 – 100 Chlorfenvinphos 0.030 0.050 80 – 100 Chlorpyrifos 0.010 0.020 80 – 100 Chlorpyrifos methyl 0.020 0.050 95 – 110 Ciodrin (Crotoxyphos) 0.030 0.050 90 – 110 Coumaphos 0.040 0.050 50 – 90 Demeton-s 0.040 0.050 30 – 80 Diazinon 0.005 0.020 95 – 110 Dichlofenthion 0.030 0.050 95 – 105 Dichlorvos 0.030 0.050 85 – 105 Dicrotophos 0.030 0.050 20 – 70 Dimethoate 0.030 0.050 90 – 100 Dioxathion 0.030 0.050 50 – 90 Disulfoton 0.010 0.050 80 – 95 Ethion 0.020 0.050 80 – 105 Ethoprop 0.030 0.050 80 – 100 Famphur 0.030 0.050 90 – 105 Fenchlorphos (Ronnel) 0.030 0.050 90 – 105 Fenitrothion 0.030 0.050 90 – 110 Fensulfothion 0.030 0.050 40 – 80 Fenthion 0.030 0.050 80 – 100 Fonofos (Dyfonate) 0.020 0.050 85 – 110 Leptophos 0.030 0.050 80 – 100 Malathion 0.030 0.050 95 – 105 Merphos 0.030 0.050 85 – 110 Methidathion 0.030 0.050 95 – 105 Mevinphos (Phosdrin) 0.030 0.050 80 – 90 Molinate 0.100 0.200 65 – 100 Naled (Dibrom) 0.030 0.050 40 – 80 Parathion, Ethyl 0.030 0.050 85 – 110
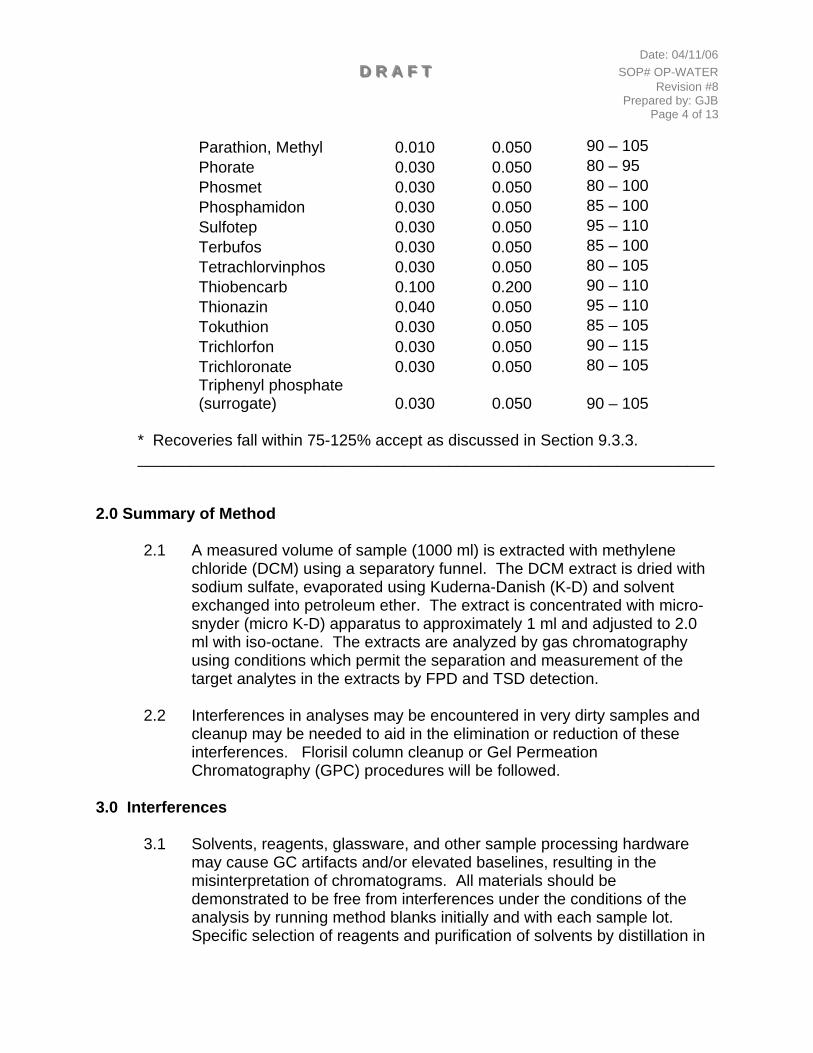
Date: 04/11/06
DDD RRR AAA FFF TTT SOP# OP-WATER Revision #8
Prepared by: GJB Page 4 of 13
Parathion, Methyl 0.010 0.050 90 – 105 Phorate 0.030 0.050 80 – 95 Phosmet 0.030 0.050 80 – 100 Phosphamidon 0.030 0.050 85 – 100 Sulfotep 0.030 0.050 95 – 110 Terbufos 0.030 0.050 85 – 100 Tetrachlorvinphos 0.030 0.050 80 – 105 Thiobencarb 0.100 0.200 90 – 110 Thionazin 0.040 0.050 95 – 110 Tokuthion 0.030 0.050 85 – 105 Trichlorfon 0.030 0.050 90 – 115 Trichloronate 0.030 0.050 80 – 105 Triphenyl phosphate (surrogate) 0.030 0.050
90 – 105
* Recoveries fall within 75-125% accept as discussed in Section 9.3.3. _________________________________________________________________
2.0 Summary of Method
2.1 A measured volume of sample (1000 ml) is extracted with methylene chloride (DCM) using a separatory funnel. The DCM extract is dried with sodium sulfate, evaporated using Kuderna-Danish (K-D) and solvent exchanged into petroleum ether. The extract is concentrated with micro-snyder (micro K-D) apparatus to approximately 1 ml and adjusted to 2.0 ml with iso-octane. The extracts are analyzed by gas chromatography using conditions which permit the separation and measurement of the target analytes in the extracts by FPD and TSD detection.
2.2 Interferences in analyses may be encountered in very dirty samples and
cleanup may be needed to aid in the elimination or reduction of these interferences. Florisil column cleanup or Gel Permeation Chromatography (GPC) procedures will be followed.
3.0 Interferences
3.1 Solvents, reagents, glassware, and other sample processing hardware may cause GC artifacts and/or elevated baselines, resulting in the misinterpretation of chromatograms. All materials should be demonstrated to be free from interferences under the conditions of the analysis by running method blanks initially and with each sample lot. Specific selection of reagents and purification of solvents by distillation in

Date:04/11/06
DDD RRR AAA FFF TTT SOP# OP-WATER Revision #8
Prepared by: GJB Page 5 of 13
all-glass systems are required. High-purity distilled-in-glass solvents are commercially available.
An effective way of cleaning laboratory glassware is by rinsing with polar and non-polar solvents before use. The cleaning procedure used must be tested by analyzing procedural blanks prior to analyzing samples.
3.2 Phthalates are common laboratory contaminants that are used widely as
plasticizers. Sources of phthalate contamination include plastic lab-ware, plastic tubing, plastic gloves, plastic coated glassware clamps, and have been found as a contaminant in Na2SO4.
Polytetrafluoroethylene (PTFE) can be used instead of polypropylene or polyethylene to minimize this potential source of contamination. However, use of PTFE lab-ware will not necessarily preclude all phthalate contamination. Na2SO4 can be solvent rinsed to eliminate contaminants.
3.3 Matrix interferences may be caused by contaminants that are co-extracted
from the sample. The extent of matrix interferences will vary considerably from source to source. A Florisil or GPC cleanup procedure can be used to overcome many of these interferences, but unique samples may require additional cleanup approaches to achieve the MDL listed in Table 1.
4.0 Apparatus and Laboratory Supplies 4.1 Separatory funnel. 2000-ml, with TFE-fluorocarbon stopcock, ground
glass or TEF stopper. 4.2 Automatic shaker designed to fit 2 liter separatory funnels with rpm and timer controls.
4.3 Beakers. Borosilicate glass, 400 mL
4.4 Chromatographic Column. 300 cm x 22 cm borosilicate glass chromatography column with Teflon stopcock.
4.5 Glass wool. Pyrex - solvent washed prior to use.
4.6 Kuderna-Danish (K-D) Apparatus.
4.6.1 Concentrator tube. 15 mL, graduate (Kontes K0570012-0500, or equivalent). A ground stopper, 19/22 joint, is used to prevent evaporation of extracts.

Date:04/11/06
DDD RRR AAA FFF TTT SOP# OP-WATER Revision #8
Prepared by: GJB Page 6 of 13
4.6.2 Evaporation flask. 500 mL (Kontes K-570050-0500, or equivalent), attached to concentrator tube with blue clamp (Kontes K-662750-0012).
4.6.3 Snyder column. Three ball (Kontes K-503000-0121, or equivalent).
4.6.4 Micro-Snyder column. Alltech 9058 or equivalent.
4.6.5 Boiling chips. Hengar granules, high purity amphoteric alundum - extracted with acetone and petroleum ether. Note that boiling chips can be a significant source of contamination if not properly cleaned.
4.7 Water bath. Blue M, 115 V, thermostatically controlled with stainless steel
cover to fit K-D apparatus, installed in a fume hood.
4.8 GC vials. GC autosampler vials, borosilicate glass, 2 mL with PTFE-lined screw cap.
4.9 Analytical balance. Capable of weighing 0.1 mg. 4.10 Drying oven. 4.11 Disposable Pasteur Pipettes. 2 mL, rinsed with solvents before use. 4.12 Glass filter funnel. Fluted, 75 mm or larger. 4.13 Graduated cylinder. 1000 ml, 250 mL and 100 mL. 4.14 Culture tubes. 13 x 100 mm with PTFE lined screw cap. 4.15 Analytical systems
4.15.1 Gas chromatograph. Agilent 6890 equipped with dual FPD detectors with phosphorous filters, split-splitless injector in pulsed splitless mode with EPC, a 7683 autosampler and dual capillary columns (J&W Scientific) connected to a single injection port using a "Y" press fit connector. Section 9 describes the acquisition and analysis procedures while Table 2 lists the operating parameters.
4.15.2 Gas chromatograph. Varian 3600, equipped with dual Thermionic Specific Detectors (TSD), direct and Septum Programmable Injector (SPI), a 8200 autosampler and dual megabore columns (J&W Scientific). Section 9 describes the acquisition and analysis procedures while Table 3 lists the operating parameters.
4.15.3 Data System. Hewlett-Packard, to collect and record GC data,
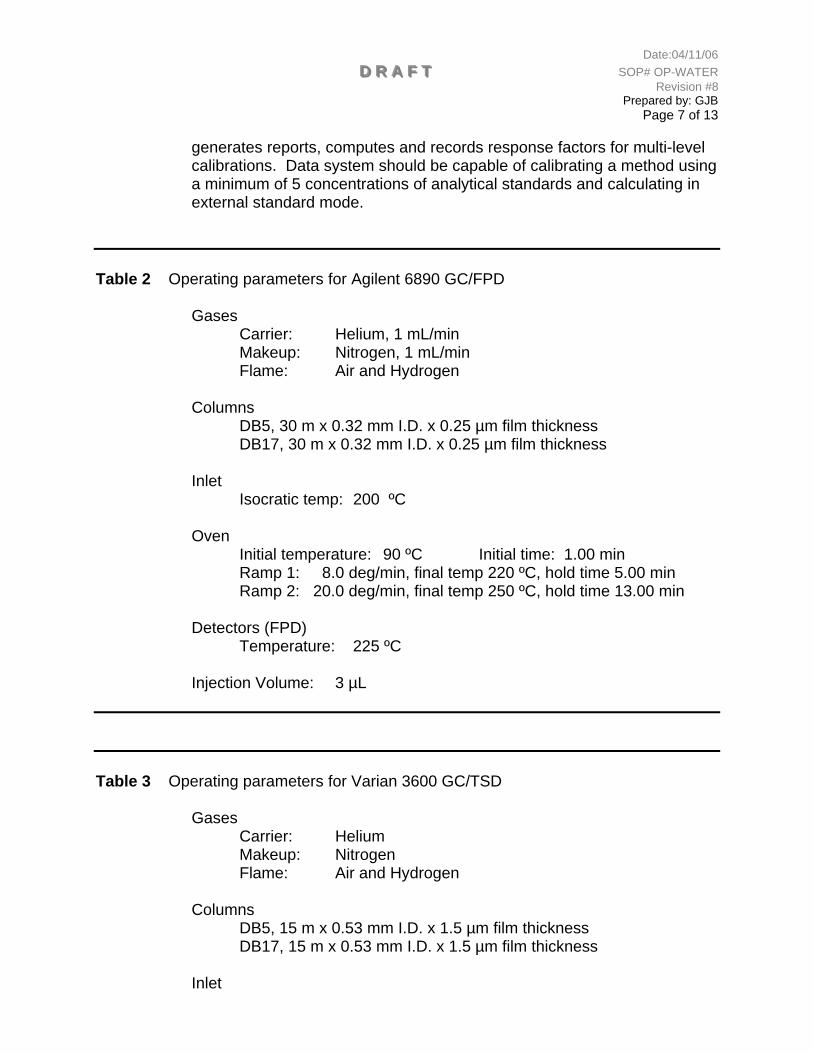
Date:04/11/06
DDD RRR AAA FFF TTT SOP# OP-WATER Revision #8
Prepared by: GJB Page 7 of 13
generates reports, computes and records response factors for multi-level calibrations. Data system should be capable of calibrating a method using a minimum of 5 concentrations of analytical standards and calculating in external standard mode.
Table 2 Operating parameters for Agilent 6890 GC/FPD
Gases Carrier: Helium, 1 mL/min Makeup: Nitrogen, 1 mL/min Flame: Air and Hydrogen Columns DB5, 30 m x 0.32 mm I.D. x 0.25 µm film thickness DB17, 30 m x 0.32 mm I.D. x 0.25 µm film thickness Inlet Isocratic temp: 200 ºC Oven Initial temperature: 90 ºC Initial time: 1.00 min Ramp 1: 8.0 deg/min, final temp 220 ºC, hold time 5.00 min Ramp 2: 20.0 deg/min, final temp 250 ºC, hold time 13.00 min Detectors (FPD) Temperature: 225 ºC Injection Volume: 3 µL
Table 3 Operating parameters for Varian 3600 GC/TSD
Gases Carrier: Helium Makeup: Nitrogen Flame: Air and Hydrogen Columns DB5, 15 m x 0.53 mm I.D. x 1.5 µm film thickness DB17, 15 m x 0.53 mm I.D. x 1.5 µm film thickness Inlet

Date:04/11/06
DDD RRR AAA FFF TTT SOP# OP-WATER Revision #8
Prepared by: GJB Page 8 of 13
Isocratic temp: 190 ºC Oven Initial temperature: 190 ºC Initial time: 3.00 min Ramp 1: 5.0 deg/min, final temp 250 ºC, hold time 10.00 min Detectors (TSD) Temperature: 225 ºC Injection Volume: 3 µL
5.0 Reagents, materials, gases and standards 5.1 Reagent water is defined as water in which an interferent is not observed
at method detection limit of each parameter of interest. Deionized (DI) water was used for method validation and as method blank.
5.2 Petroleum ether (PE), acetone, methylene chloride (DCM), diethyl ether,
isooctane. Pesticide residue quality or equivalent.
5.3 Sodium sulfate. Anhydrous granular reagent grade, rinsed with PE prior to use.
5.4 Nitrogen. Ultra-pure (99.99999%) for GC/FPD/TSD 5.5 Helium. Ultra-pure (99.99999%) for GC/FPD/TSD 5.6 Air. Compressed, breathing quality for GC/FPD/TSD
5.7 Hydrogen. Ultra high purity for GC/FPD/TSD 5.8 Stock standards. Individual stock standards (100 µg/ml) are purchased as
certified solutions from ChemService as well as premixed solutions of 8140 and 8141A, as shown in Table 4. Additional compounds analyzed are prepared as WPCL solution “OP Mix C”

Date:04/11/06
DDD RRR AAA FFF TTT SOP# OP-WATER Revision #8
Prepared by: GJB Page 9 of 13
Table 4 Organophosphorous analyte spiking solutions and standard curves.
EPA 8140 Analytes EPA 8141A Analytes OP Mix C AnalytesAzinphos methyl(Guthion) Aspon Dimethoate Bolstar (Sulprofos) Azinphos ethyl Malathion Chlorpyrifos Carbophenothion Methidathion Coumaphos Chlorfenvinphos Molinate Demeton-s Chlorpyrifos methyl Parathion,Ethyl Diazinon Ciodrin (Crotoxyphos) Sulfotep Dichlorvos Dichlofenthion Thiobencarb Disulfoton Dicrotophos Ethoprop (Prophos) Dioxathion Fenchlorphos (Ronnel) Ethion Fensulfothion Famphur Fenthion Fenitrothion Merphos Fonofos (Dyfonate) Mevinphos (Phosdrin) Leptophos Naled (Dibrom) Phosmet (Imidan) Parathion, Methyl Phosphamidon Phorate Terbufos Tetrachlorvinphos Thionazin (Zinophos) Tokuthion Trichlorfon (Dylox) Trichloronate
6.0 Sample Collection, Preservation, and Storage 6.1 Samples are collected in one liter amber glass bottles and iced or
refrigerated at 4 °C from time of collection until extraction.
6.2 All samples must be extracted within 7 days and completely analyzed within 40 days of extraction.
7.0 Sample Extraction
7.1 Remove water samples from refrigerator and transfer contents to a pre-cleaned 2-liter separatory funnel. Immediately add 1.0 ml of the 200 ppb OP pesticide surrogate solution to every sample. For Method Blank, add 1.0 ml of the 200 ppb OP pesticide surrogate solution (TPP) to 1 liter DI water. For laboratory control spike (LCS) and matrix spikes (MS/MSD) also add 1.0 ml of 200 ppb OP pesticide spiking solution for each mix (8140, 8141A and Mix C)

Date:04/11/06
DDD RRR AAA FFF TTT SOP# OP-WATER Revision #8
Prepared by: GJB Page 10 of 13
7.2 Add 60 ml of methylene chloride (DCM) to the empty bottle, replace the
cap and rinse the bottle. Pour the DCM into the separatory funnel and repeat with another 60 mL aliquot of DCM. Extract the sample by shaking the funnel for 5 minutes on the auto-shaker with periodic venting to release excess pressure. Allow organic layer to separate from the water phase for a minimum of 10 minutes. Collect the methylene chloride extract in a 400 ml beaker.
7.3 Add a second 120 ml volume of methylene chloride to the separatory
funnel and repeat the extraction procedure a second time, combining the extracts in the beaker.
7.4 Set up and label pre-cleaned K-D flasks with concentrator tubes and
attached with a blue clamp on ring stands in the fume hood. Add 0.5 ml iso-octane as “keeper” and a solvent rinsed micro-boiling chip to each K-D concentrator tube. Place a filter funnel containing a plug of pre-cleaned glass wool in the bottom of the funnel and place the funnel in the top of the K-D flask. Add about two inches of solvent rinsed sodium sulfate to the funnel.
7.5 Pour the combined extracts from the beaker through sodium sulfate into
the K-D flask. Rinse the beaker with about 10 mL of DCM and add this rinse to the sodium sulfate. Repeat with another 10 mL DCM rinse. Rinse the sodium sulfate with an additional portion of DCM (~10-20 mL).
7.6 Place a Snyder column on the K-D flask, clamp with a green clamp and
place the flask on the hot water bath set at 78-82 oC. Evaporate solvent on the hot water bath. When the apparent volume of solvent in the concentrator tube is 5-10 mL, add 20-30 mL of petroleum ether through the top of the Snyder column. Repeat this procedure when the apparent volume is again at 5-10 mL. When the reflux line falls below the top of the Snyder column, the K-D apparatus should be removed from the hot water bath. Dry outer KD apparatus with a Kimwipe to prevent condensation water from entering the concentrator tube. Upon cooling, remove the concentrator tube from the K-D apparatus.
7.7 Place a clean micro-Snyder column on the concentrator tube with a blue
clamp, add a new micro boiling chip and place in a 400 mL beaker containing water heated to approximately 78 oC on a hot plate. If the solvent does not begin to boil, remove the tube from the bath immediately, allow it to cool slightly, add a new micro boiling stone to prevent it from bumping and place it back in the bath.
7.8 When the solvent has been evaporated to 0.5-1 mL remove the tube from
the bath and allow it to cool in a test tube rack. Dry outer KD apparatus with a Kimwipe to prevent condensation water from entering the concentrator tube. Remove the micro-Snyder column and add iso-octane

Date:04/11/06
DDD RRR AAA FFF TTT SOP# OP-WATER Revision #8
Prepared by: GJB Page 11 of 13
to the concentrator tube to reach a final volume of 2.0 mL. Mix the tube contents by tapping the bottom of the tube causing a vortex which will rinse the sides of the tube. A Vortex Genie mixer may be used for this step.
7.9 Transfer the solution from the concentrator tube to a culture tube and cap
with a Teflon faced cap. Place extracts in a refrigerator for storage until analysis or cleanup, if necessary.
7.10 When ready for analysis, transfer extract to labeled GC vials and cap.
8.0 Cleanup Procedure 8.1 Cleanup of dirty samples may be necessary due to interferences in the analysis of baseline or co-elution with target analytes of the sample extract. Follow the in-house SOP for Florisil® column or GPC method, as needed. 9.0 Analytical Procedure
9.1 The final extract will be analyzed on an Agilent 6890 GC/FPD and a Varian 3600 GC/TSD.
9.1.1 Chromatographic conditions for operating the Agilent 6890
GC/FPD are found in Table 2. 9.1.2 Chromatographic conditions for operating the Varian 3600 GC/TSD are found in Table 3. 9.2 GC acquisition 9.2.1 Pour several isooctanes into GC vials using the same lot as used for samples with each GC run. 9.2.2 Pour standard curves into GC vials using 20, 50, 100, 200 and 500 ppb Std 8140 and 8141A and 50, 100, 200 and 500 ppb OP Mix C in isooctane. Pour extra vials of a midlevel concentration for use as CCV (to be analyzed every 20 samples or less). 9.2.3 Create sequence file and sequence table on computer. Use the WPCL login number for “Data Subdirectory” and “Save As” sequence name. 9.2.4 Acquire data and recap each vial daily to preserve sample integrity.

Date:04/11/06
DDD RRR AAA FFF TTT SOP# OP-WATER Revision #8
Prepared by: GJB Page 12 of 13
9.3 Analysis 9.3.1 Recalibrate OP curves and analyze samples in external standard mode. Add a printed chromatogram and report for each standard and sample to folder. 9.3.2 Certain analytes will coelute on a given column. However, using two columns with different polarities will allow for confirmation of target analytes. 9.3.3 EPA Method 8141A cites the following common analytical difficulties encountered for target analytes: 9.3.3.1 The water solubility of Dichlorvos (DDVP) is 10 g/L at 20EC, and recovery is poor from aqueous solution. 9.3.3.2 Naled is converted to Dichlorvos (DDVP) on column by debromination. This reaction may also occur during sample workup. The extent of debromination will depend on the nature of the matrix being analyzed. The analyst must consider the potential for debromination when Naled is to be determined. 9.3.3.3 Trichlorfon rearranges and is dehydrochlorinated in acidic, neutral, or basic media to form Dichlorvos (DDVP) and hydrochloric acid. If this method is to be used for the determination of organophosphates in the presence of Trichlorfon, the analyst should be aware of the possibility of rearrangement to Dichlorvos to prevent misidentification. 9.3.3.4 Demeton (Systox) is a mixture of two compounds; O,O-diethyl O-[2-(ethylthio)ethyl]phosphorothioate (Demeton-O) and O,O-diethyl S-[2- (ethylthio)ethyl]phosphorothioate (Demeton-S). Two peaks are observed in all the chromatograms corresponding to these two isomers. It is recommended that the early eluting compound (Demeton-S) be used for quantitation. 9.3.3.5 Dioxathion is a single-component pesticide. However, several extra peaks are observed in the chromatograms of standards. These peaks appear to be the result of spontaneous oxygen-sulfur isomerization. Because of this, Dioxathion is not
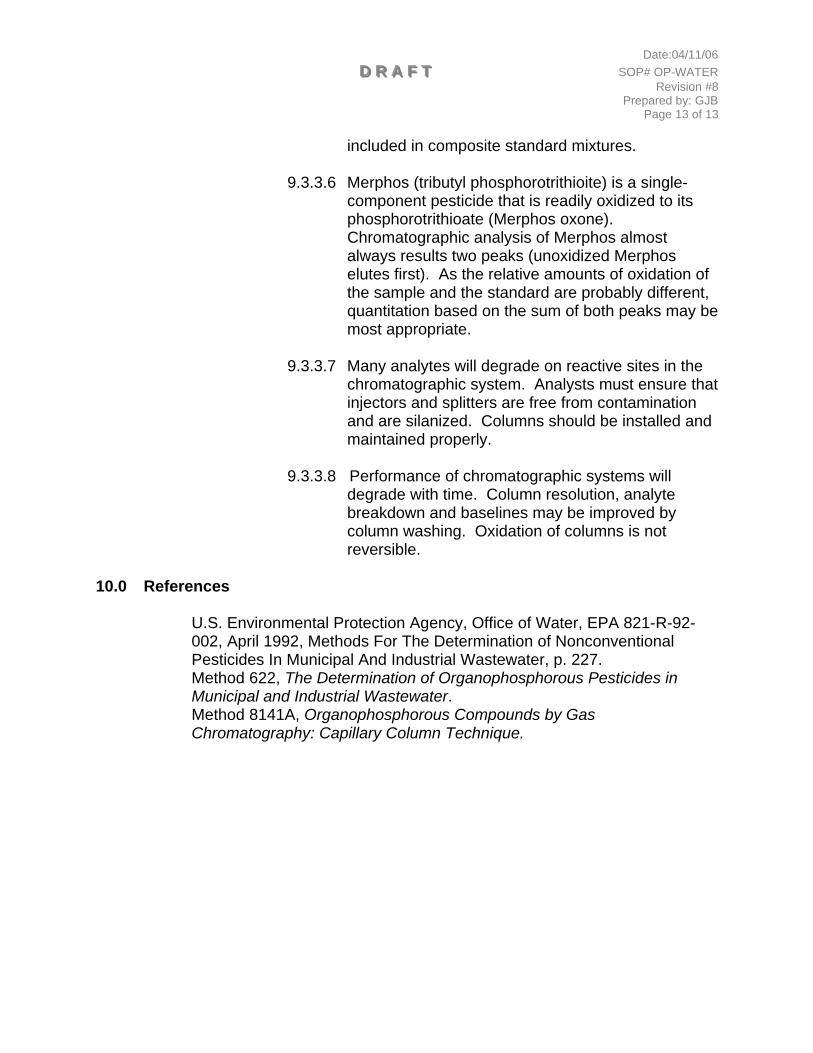
Date:04/11/06
DDD RRR AAA FFF TTT SOP# OP-WATER Revision #8
Prepared by: GJB Page 13 of 13
included in composite standard mixtures. 9.3.3.6 Merphos (tributyl phosphorotrithioite) is a single- component pesticide that is readily oxidized to its phosphorotrithioate (Merphos oxone). Chromatographic analysis of Merphos almost always results two peaks (unoxidized Merphos elutes first). As the relative amounts of oxidation of the sample and the standard are probably different, quantitation based on the sum of both peaks may be most appropriate. 9.3.3.7 Many analytes will degrade on reactive sites in the chromatographic system. Analysts must ensure that injectors and splitters are free from contamination and are silanized. Columns should be installed and maintained properly. 9.3.3.8 Performance of chromatographic systems will degrade with time. Column resolution, analyte breakdown and baselines may be improved by column washing. Oxidation of columns is not reversible. 10.0 References
U.S. Environmental Protection Agency, Office of Water, EPA 821-R-92-002, April 1992, Methods For The Determination of Nonconventional Pesticides In Municipal And Industrial Wastewater, p. 227. Method 622, The Determination of Organophosphorous Pesticides in Municipal and Industrial Wastewater.
Method 8141A, Organophosphorous Compounds by Gas Chromatography: Capillary Column Technique.

California Department of Pesticide Regulation Draft PAM QAPP Sacramento, CA Revision 0.0 4/18/2006
APPENDIX 3. SAMPLE CHAIN OF CUSTODY FORM

California Department of Chain of Custody Record California Department of
Fish and Game and Lab Result Report Pesticide Regulation
(use dark ink only) Environmental Monitoring
1001 I Street
Sacramento, CA 95812-4015
Study # Date Sampled Time SiteYear
Sample numbers: Organophosphates Amount Detected Reporting LimitWater
OP Chlorpyrifos
BU
TSS
1. Obtained sampling containers and sampled Date/Time Extracted by: Date
2. Relinquished samples after transport Date/Time Analyzed by: Date
3. QA staff receiving Date/Time Approved by: Date
4. Relinquished to CDFA Lab Date/Time Method # Lab sample #
5. Date/Time Received by at lab Date/Time
6. Date/Time Logged in by lab Date/Time
Sample number
Laboratory Results Section: Lab results relate only to the sample tested
Month Day
4/18/2006 Lab report page____of____