quality and determinants of risk … and determinants of risk reporting - evidence from germany and...
TRANSCRIPT

ACRN Journal of Finance and Risk Perspectives
Vol. 1, Issue 2, p. 1-16, Dez. 2012
ISSN 2305-7394
1
QUALITY AND DETERMINANTS OF RISK REPORTING
- EVIDENCE FROM GERMANY AND AUSTRIA
Susanne Leitner-Hanetseder1
1Department of Accounting and Auditing, Kepler University of Linz, Austria
Abstract. While risk reporting disclosures have been required in Germany
since 1999, equal requirements have become mandatory in Austria and all
member states of the European Union only since 2005. The analysis
conducted includes the risk reporting disclosures of all non-financial
companies listed in the German prime stock market (DAX-30) and Austrian
prime stock market (ATX). The purpose of this study is to investigate
information quality of risk reporting disclosures within the annual reports of
Austrian and German listed companies by using a scoring model. As most
industries (except finance industry) have been affected by the financial crisis
in the second half of 2008, also the risk reporting could be affected by the
financial crisis. To identify the impact of the financial crisis on risk
reporting the study analysis the risk reporting disclosures of the financial
years 2007 and 2008. Based on these data, also a multiple regression model
was used to identify specific determinants on information quality of risk
reporting disclosures. The findings indicate that information quality of risk
reporting increases over time and index and quantity of risk information
disclosures are a determinant for the information quality of risk reporting.
KEYWORDS: risk reporting, scoring model, regression model, quantity of
risk reporting disclosures, quality of risk reporting disclosures
Framework of Risk Reporting in Germany and Austria
The German and Austrian Commercial Code requires a management report (the so
called Lagebericht) by individual entities classified as companies with limited liability
in § 289 dHGB (German Commericial Code) and § 243 UGB (Austrian Commerical
Code) as well as by groups in § 315 dHGB and § 267 UGB. In Germany/Austria risk
reporting is a mandatory part of the management report since 1999/2005 and shall
include a description of the principal risks and uncertainties of a company. However,
neither the German/Austrian Commerical Code nor the corresponding legislation
material specifies the risk reporting requirements. This was left to the private standard-
setters of Germany and Austria. Since the transformation of the Fair Value Directive
(2001/65/EC) German and Austrian entities are also required to disclose financial risk
management objectives and policies and the entity’s exposure to price risk, credit risk,
liquidity risk and cash flow risk. With the introduction of the new German legislation
(BilMoG) and modernisation of the Austrian GAAP (URÄG 2008), companies have to

QUALITY AND DETERMINANTS OF RISK REPORTING –
EVIDENCE FROM GERMANY AND AUSTRIA
2
describe the main features of the group’s internal control and risk management in
relation to the process for preparing (consolidated) accounts since 2009.
Empirical Study
Population and Data
The study conducted explores risk reporting disclosures for the years 2007 and 2008 by
analysing a sample of 43 German and Austrian group accounts. The target population of
this survey are listed companies in the German and Austrian prime stock market (DAX-
30 and ATX). Financial institutions are excluded from the population. The reasons for
the exclusion are twofold: First, risk reporting of financial institutions is not comparable
to other industries. Second, the finance industry had been affected by the current crisis
several months before other industries and including these companies would have
reduced the comparability and subsequently the validity of the findings. Finally, the
current target population includes 26 companies which are listed in the German prime
stock market DAX-30 and 17 companies which are listed in the Austrian prime stock
market ATX.
By comparing companies which are listed in the prime German stock market
(DAX-30) and prime Austrian stock market the study analyses whether there is an
influence on the quality of risk reporting according to the country index and size of a
company. As table 1 shows the total assets and sales of DAX-30 companies are on
average higher than ATX companies. Also the BRAVAIS-PEARSON CORRELATION
COEFFICIENT shows a significant correlation between total assets ( pbr = 0,485) or sales
( pbr = 0,533) and the index a company is listed in.
Table 1: Total assets and sales of German and Austrian publicly traded companies
Companies listed in ATX
total assets sales
n 17 17
Mean 4.797.200.000,00 4.247.400.000,00
Std. Deviation 5.870.590.000,00 6.599.720.000,00
Min. 3.086.301,00 3.609.812,00
Max. 21.400.000.000,00 25.500.000.000,00
25%-Quantil 552.450.000,00 468.380.000,00
Median 1.735.300.000,00 1.731.200.000,00
75 %-Quantil 8.645.600.000,00 4.457.500.000,00
Companies listed in DAX-30
total assets Sales
n 26 26
Mean 62.845.000.000,00 36.921.000.000,00

ACRN Journal of Finance and Risk Perspectives
Vol. 1, Issue 2, p. 1-16, Nov. 2012
ISSN 2305-7394
3
Std. Deviation 67.014.200.000,00 32.877.600.000,00
Min. 3.470.000.000,00 2.460.000.000,00
Max. 263.000.000.000,00 114.000.000.000,00
Companies listed in DAX-30
25%-Quantil 14.665.000.000,00 10.752.000.000,00
Median 28.824.000.000,00 19.908.000.000,00
75 %-Quantil 106.600.000.000,00 61.826.000.000,00
Parameters of the Scoring Model
In order to evaluate the quality of risk reporting disclosures of German and Austrian
listed companies in the DAX-30 and ATX a scoring model was used. This scoring
model equates to the greatest possible extent to the scoring model of Ewelt et al. (2009)
and meets the criteria of the recommendations of the private standard setting bodies in
Austria and Germany. In the following scoring model, the quality of risk reporting is
determined by 5 parameters (form, disclosure of risk management, disclosure of overall
risks, disclosure of individual risks and disclosure of financial risks) which are analyzed
by several research questions (see table 2).
Table 2: Scoring model
Parameter Research questions:
I. F
orm
1. Is the risk report disclosed in a self-contained section of the management report and is the risk
report marked by a headline?
2. Is the risk report excluded from the reporting of prospects?
3. Are rewards presented outside the risk report?
4. Has the risk report a clear structure?
5. Are risks separated into adequate categories and types?
6. Are financial risks presented in the risk report?
II.
Ris
k
ma
na
gem
en
t
1. Does the risk report include the forecasting horizon?
2. Does the risk report include a definition of „risk” and „risk management“?
3. Does the risk report include the objectives and the strategy to achieve the objectives?

QUALITY AND DETERMINANTS OF RISK REPORTING –
EVIDENCE FROM GERMANY AND AUSTRIA
4
4. Are disclosures about the risk communication understandable?
5. Are there any disclosures about the company’s implementation of risk management?
6. Is the process of risk management demonstrated?
7. Are the methods to identify risks presented?
8. Are there any disclosures concerning the tasks of risk management and the internal review
process?
9. Does the risk report explain materiality in context to risks?
III.
ov
era
ll r
isk
1. Are risks which may lead to an insolvency presented or does the risk report include a negative
statement if a risk of insolvency is not existing?
2. Are risk concentrations demonstrated?
3. Are there any interdependences between risks?
4. Does the risk report include a general statement about the risk situation of the group?
5. Are the priorities concerning risks presented?
IV.
Ind
ivid
ua
l
ris
ks
1. How are individual risks described and possible consequences explained?
2. Are quantitative information concerning an individual risk demonstrated?
3. How are measurement and methods to quantify individual risks presented?
4. How are techniques presented to handle an individual risk?
IV.
Fin
an
cia
l
ris
ks
1. How does the company report about the risks of financial instruments?
2. How does the company report about price risks?
3. How does the company report about credit risks?
4. How does the company report about liquidity risks and cash flow risks?
5. Does the risk report include techniques to handle risks?
Factors to determine information quality
After evaluating the information quality of risk reporting in the disclosures of
companies in the prime stock markets in Germany and Austria by a scoring model, the
analysis is extended to the determinants of the information quality on risk reporting.

ACRN Journal of Finance and Risk Perspectives
Vol. 1, Issue 2, p. 1-16, Nov. 2012
ISSN 2305-7394
5
According to prior literature three determinants (quantity of risk reporting disclosures,
firm size and index) are analyzed regarding the impact of information quality.
A vast literature is related to the quantity of corporate disclosures. Therefore, the
quantity of risk reporting can be defined by the number of words (for example see
Deegan and Rankin, 1996, Neu et al., 1998); the number of sentences (Buhr, 1998), the
number of pages (Cowen et al., 1987) and the percentage of pages (Adams et al., 1995).
In the study conducted, the quantity of risk reporting is defined by the number of pages.
According to the descriptive data in table 3 an increase in risk reporting can be
determinated within the years 2007 and 2008. This increase in the quantity of the
disclosure of risk reporting may be caused by the financial crisis or by a general
increase of the quantity in disclosures of risk reporting (see Lenz and Diehm, 2010).
However, an increase in the quantity of risk reporting disclosures is not essentially
related with an increase of the information quality. If the quality does not increase by an
increase of quantity an information overload may exist. An information overload results
in the fact that users of disclosures are not able to screen decision usefulness
information (see Ewelt et al., 2009). According to Ewelt et al., 2009, an increase of the
quantity of risk reporting disclosures results in declining information quality.
Several accounting studies have already provided evidence there is a positive
relationship between company size and information quality (see Ewelt et al., 2009;
Abraham and Cox, 2009). In the following study quality is determinated by sales and
total assets of the group.
Fischer and Vielmeyer (2004) proved that the quality of risk reporting varies with
the index a company is listed. Based on the empirical findings that the quantity of risk
reporting disclosures, firm size and index may be an important determinant of the
quality of risk reporting leads to the following assumptions:
Hypothesis: The quality of risk reporting is influenced by the quantity of risk reporting, firm size
and/or the index a company is listed.
Research Method
In order to test this relationship the following regression model is tested:
IndexAssetsTotalSalesQuantityQualitynInformatio t 43210
In the regression model, the information quality of risk reporting is the dependent
variable. The independent variables shall capture the influence of size of the firm, index
and quantity of risk reporting. The size of the firm is measured by the variable total
assets and sales. The variable index is a dummy variable index and is coded 0, when the
enterprise is listed in the ATX. It is coded 1, when the enterprise is listed in the DAX-
30. The relevance of quantity is represented by the number of pages used for risk
reporting. Altogether, five independent variables are included in the regression model to
explain the attitudes of enterprises towards risk reporting.
QUALITY AND DETERMINANTS OF RISK REPORTING –
EVIDENCE FROM GERMANY AND AUSTRIA
6
Results
General Aspects
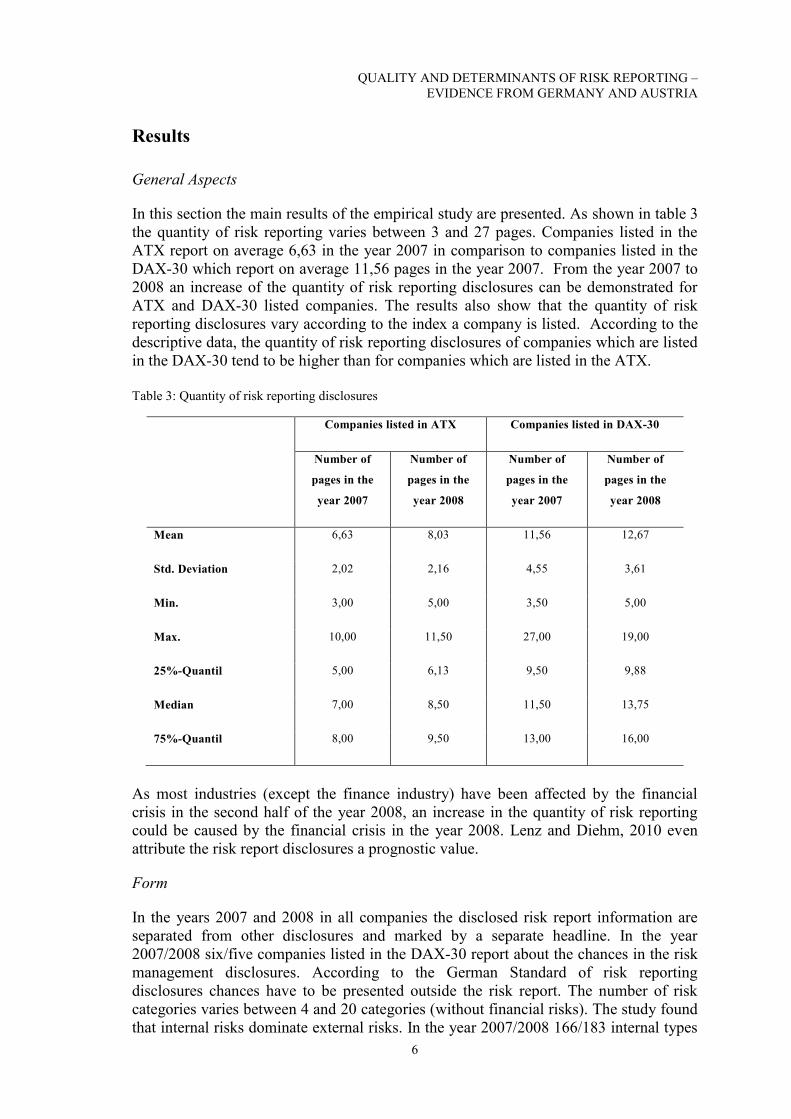
In this section the main results of the empirical study are presented. As shown in table 3
the quantity of risk reporting varies between 3 and 27 pages. Companies listed in the
ATX report on average 6,63 in the year 2007 in comparison to companies listed in the
DAX-30 which report on average 11,56 pages in the year 2007. From the year 2007 to
2008 an increase of the quantity of risk reporting disclosures can be demonstrated for
ATX and DAX-30 listed companies. The results also show that the quantity of risk
reporting disclosures vary according to the index a company is listed. According to the
descriptive data, the quantity of risk reporting disclosures of companies which are listed
in the DAX-30 tend to be higher than for companies which are listed in the ATX.
Table 3: Quantity of risk reporting disclosures
Companies listed in ATX Companies listed in DAX-30
Number of
pages in the
year 2007
Number of
pages in the
year 2008
Number of
pages in the
year 2007
Number of
pages in the
year 2008
Mean 6,63 8,03 11,56 12,67
Std. Deviation 2,02 2,16 4,55 3,61
Min. 3,00 5,00 3,50 5,00
Max. 10,00 11,50 27,00 19,00
25%-Quantil 5,00 6,13 9,50 9,88
Median 7,00 8,50 11,50 13,75
75%-Quantil 8,00 9,50 13,00 16,00
As most industries (except the finance industry) have been affected by the financial
crisis in the second half of the year 2008, an increase in the quantity of risk reporting
could be caused by the financial crisis in the year 2008. Lenz and Diehm, 2010 even
attribute the risk report disclosures a prognostic value.
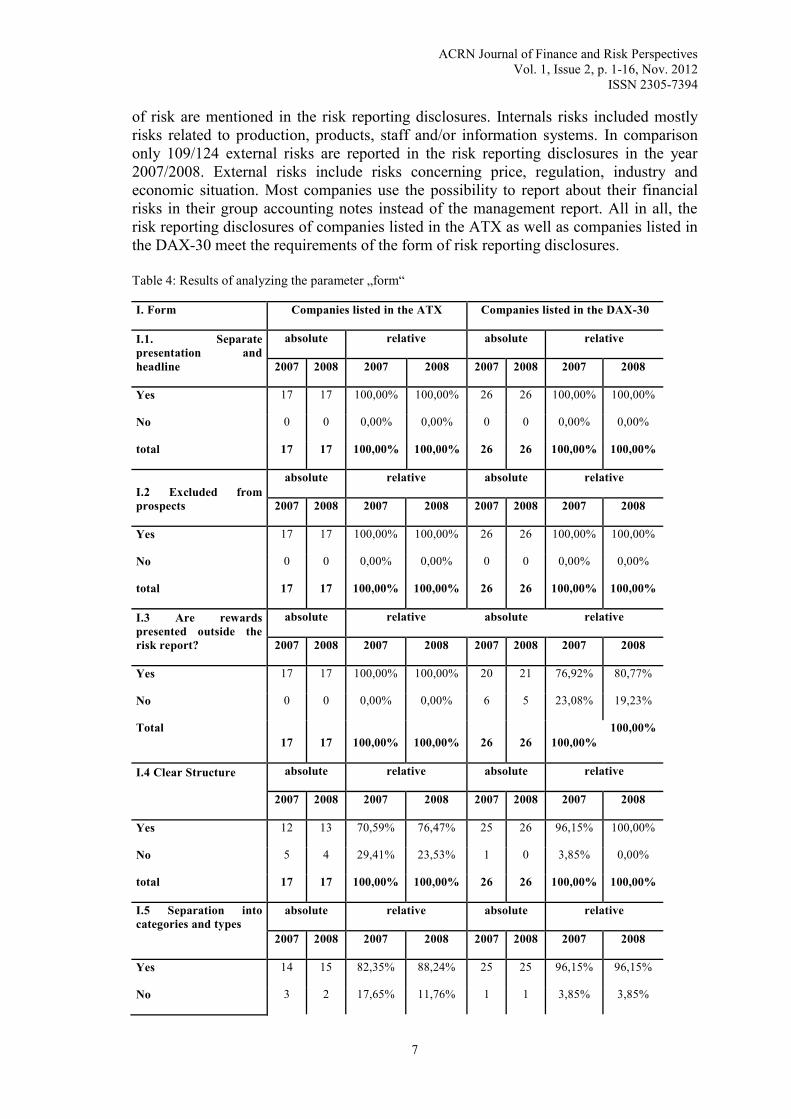
Form
In the years 2007 and 2008 in all companies the disclosed risk report information are
separated from other disclosures and marked by a separate headline. In the year
2007/2008 six/five companies listed in the DAX-30 report about the chances in the risk
management disclosures. According to the German Standard of risk reporting
disclosures chances have to be presented outside the risk report. The number of risk
categories varies between 4 and 20 categories (without financial risks). The study found
that internal risks dominate external risks. In the year 2007/2008 166/183 internal types
ACRN Journal of Finance and Risk Perspectives
Vol. 1, Issue 2, p. 1-16, Nov. 2012
ISSN 2305-7394
7
of risk are mentioned in the risk reporting disclosures. Internals risks included mostly
risks related to production, products, staff and/or information systems. In comparison
only 109/124 external risks are reported in the risk reporting disclosures in the year
2007/2008. External risks include risks concerning price, regulation, industry and
economic situation. Most companies use the possibility to report about their financial
risks in their group accounting notes instead of the management report. All in all, the
risk reporting disclosures of companies listed in the ATX as well as companies listed in
the DAX-30 meet the requirements of the form of risk reporting disclosures.
Table 4: Results of analyzing the parameter „form“
I. Form Companies listed in the ATX Companies listed in the DAX-30
I.1. Separate
presentation and
headline
absolute relative absolute relative
2007 2008 2007 2008 2007 2008 2007 2008
Yes 17 17 100,00% 100,00% 26 26 100,00% 100,00%
No 0 0 0,00% 0,00% 0 0 0,00% 0,00%
total 17 17 100,00% 100,00% 26 26 100,00% 100,00%
I.2 Excluded from
prospects
absolute relative absolute relative
2007 2008 2007 2008 2007 2008 2007 2008
Yes 17 17 100,00% 100,00% 26 26 100,00% 100,00%
No 0 0 0,00% 0,00% 0 0 0,00% 0,00%
total 17 17 100,00% 100,00% 26 26 100,00% 100,00%
I.3 Are rewards
presented outside the
risk report?
absolute relative absolute relative
2007 2008 2007 2008 2007 2008 2007 2008
Yes 17 17 100,00% 100,00% 20 21 76,92% 80,77%
No 0 0 0,00% 0,00% 6 5 23,08% 19,23%
Total
17 17 100,00% 100,00% 26 26 100,00%
100,00%
I.4 Clear Structure
absolute relative absolute relative
2007 2008 2007 2008 2007 2008 2007 2008
Yes 12 13 70,59% 76,47% 25 26 96,15% 100,00%
No 5 4 29,41% 23,53% 1 0 3,85% 0,00%
total 17 17 100,00% 100,00% 26 26 100,00% 100,00%
I.5 Separation into
categories and types
absolute relative absolute relative
2007 2008 2007 2008 2007 2008 2007 2008
Yes 14 15 82,35% 88,24% 25 25 96,15% 96,15%
No 3 2 17,65% 11,76% 1 1 3,85% 3,85%

QUALITY AND DETERMINANTS OF RISK REPORTING –
EVIDENCE FROM GERMANY AND AUSTRIA
8
total 17 17 100,00% 100,00% 26 26 100,00% 100,00%
I.6 Presentation of
financial risks in the
management report
absolute relative absolute relative
2007 2008 2007 2008 2007 2008 2007 2008
Yes 1 0 94,12% 100,00% 3 3 88,46% 88,46%
No 16 17 5,88% 0,00% 23 23 11,54% 11,54%
total 17 17 100,00% 100,00% 26 26 100,00% 100,00%
Risk Management
Only one company gives some information about the forecasting horizon in the
financial year 2008. The term “risk” is neither defined in the law nor in the literature,
that is why the definition of the term “risk” has to be explained to the users in the risk
management report. In the financial year 2007 or 2008 only eight (18,60 %) or ten
(23,25 %) of the considered companies explain their understanding of “risk”. The
companies of the ATX fulfill the requirement to explain “risk” in comparison with the
companies of the DAX-30 almost equally. The majority defines risk as a negative
deviate from the expected value or another comparative value. More than 36 (83,72 %)
or 37 (86,05 %) of the considered companies present the objectives and strategy of risk
management. In general, companies which are listed in the DAX-30 fulfill the
requirement better than ATX companies do. Concerning risk communication attention
is paid to information process within the group accounts. In the financial years 2007 or
2008 in 29 (67,44 %) or 30 (69,77 %) risk management reports provide an appropriate
information of risk communication. Companies which are listed in the DAX-30 offer
more information about their risks than companies which are listed in the ATX. At least,
36 (83,72 %) or 38 (88,37 %) of the considered companies make a statement about the
implementation of risk management. The presentation of the process of risk
management is necessary to see how the companies handle risks. Although an
information about the process of risk management is only mandatory for companies
which are listed in the DAX-30, 30 (69,77 %) or 31 (72,09 %) of the considered
companies present the process of risk management reporting in the financial year 2007
or 2008. Reporting on methods in order to identify risks is important for users as to get
an idea how companies recognize potential risks and take necessary measures against it.
The willingness to provide information about such risks is small. It is obvious, that the
number of methods to identify risks is limited. For example risk inventory, market
analyses or interviews with employees are methods mentioned in the risk reports. In the
financial year 2007 seven companies (16,28%) explained the internal review process.
The number of companies explaining the tasks of risk management and the internal
review process declined in the financial year 2008 to twelve. Furthermore, the German
and Austrian regulations require information about risks that could affect decisions of
the users of risk reports. This scope is extensive. Therefore, companies should define
their understanding of materiality in the context to risks. In 2007 19 companies provided
adequate information in comparison to only 18 companies in the year 2008.

ACRN Journal of Finance and Risk Perspectives
Vol. 1, Issue 2, p. 1-16, Nov. 2012
ISSN 2305-7394
9
Table 5: Results of analyzing the parameter risk management reporting
II. Risk management Companies listed in the ATX Companies listed in the DAX-30
II.1. Forecasting horizon
absolute relative absolute relative
2007 2008 2007 2008 2007 2008 2007 2008
Yes 0 0 0,00% 0,00% 0 1 0,00% 3,85%
No 17 17 100,00% 100,00% 26 25 100,00% 96,15%
total 17 17 100,00% 100,00% 26 26 100,00% 100,00%
II.2. Definition of "risk"
absolute relative absolute relative
2007 2008 2007 2008 2007 2008 2007 2008
Yes 3 4 17,65% 23,53% 5 6 19,23% 23,08%
No 14 13 82,35% 76,47% 21 20 80,77% 76,92%
total 17 17 100,00% 100,00% 26 26 100,00% 100,00%
II.3 Objectives and strategy
of risk management
absolute relative absolute relative
2007 2008 2007 2008 2007 2008 2007 2008
Yes 12 12 70,59% 70,59% 24 25 92,31% 96,15%
No 5 5 29,41% 29,41% 2 1 7,69% 3,85%
total 17 17 100,00% 100,00% 26 26 100,00% 100,00%
II.4. Communication about
risk management
absolute relative absolute relative
2007 2008 2007 2008 2007 2008 2007 2008
Yes 6 7 35,29% 41,18% 23 23 88,46% 88,46%
No 11 10 64,71% 58,82% 3 3 11,54% 11,54%
total 17 17 100,00% 100,00% 26 26 100,00% 100,00%
II.5. Implementation of risk
managment
absolute relative absolute relative
2007 2008 2007 2008 2007 2008 2007 2008
Yes 13 14 76,47% 82,35% 23 24 88,46% 92,31%
No 4 3 23,53% 17,65% 3 2 11,54% 7,69%
total 17 17 100,00% 100,00% 26 26 100,00% 100,00%
II.6. Process of risk
management
absolute relative absolute relative
2007 2008 2007 2008 2007 2008 2007 2008
Yes 8 9 47,06% 52,94% 22 22 84,62% 84,62%
No 9 8 52,94% 47,06% 4 4 15,38% 15,38%
total 17 17 100,00% 100,00% 26 26 100,00% 100,00%
II.7. Methods to identify
risks
absolute relative absolute relative
2007 2008 2007 2008 2007 2008 2007 2008

QUALITY AND DETERMINANTS OF RISK REPORTING –
EVIDENCE FROM GERMANY AND AUSTRIA
10
Yes 3 5 17,65% 29,41% 11 13 42,31% 50,00%
No 14 12 82,35% 70,59% 15 13 57,69% 50,00%
total 17 17 100,00% 100,00% 26 26 100,00% 100,00%
II.8. Internal review
process
absolute relative absolute relative
2007 2008 2007 2008 2007 2008 2007 2008
Yes 3 6 17,65% 35,29% 4 6 15,38% 23,08%
No 14 11 82,35% 64,71% 22 20 84,62% 76,92%
total 17 17 100,00% 100,00% 26 26 100,00% 100,00%
II.9. Materiality of risks
absolute relative absolute relative
2007 2008 2007 2008 2007 2008 2007 2008
Yes 5 6 29,41% 35,29% 14 12 53,85% 46,15%
No 12 11 70,59% 64,71% 12 14 46,15% 53,85%
total 17 17 100,00% 100,00% 26 26 100,00% 100,00%
Overall Risks
According to the Austrian and German regulations companies have to present risks
which may lead to an insolvency. Furthermore, companies have to make a negative
statement, if there is no risk of insolvency. Even with the beginning of the financial
crisis not a single company reported risks which may lead to an insolvency or any risk
concentrations in the group. 28 companies explicitly reported a negative statement
implying that there is no risk of insolvency. In the years 2007 and 2008 the number of
companies making a general statement about the risk situation of the group increased
from 25 to 28 companies. However, most of the companies which made a general
statement about the risk situation of the group are companies listed in the DAX. An
increasing number of 13 companies which are listed in the DAX-30 also reported in the
year 2008 the priority of risks in their risk reporting disclosures, whereas only one
company which is listed in the ATX reports about the priority of risks.

ACRN Journal of Finance and Risk Perspectives
Vol. 1, Issue 2, p. 1-16, Nov. 2012
ISSN 2305-7394
11
Table 6: Results of analyzing the parameter “overall risks”
III. Overall risks Companies listed in the ATX Companies listed in the DAX-30
III.1. Report of risk which may
lead to insolvency or a negative
statement of it
absolute relative absolute relative
2007 2008 2007 2008 2007 2008 2007 2008
Yes 0 0 0,00% 0,00% 0 0 0,00% 0,00%
Negative statement 8 8 47,06% 47,06% 20 20 76,92% 76,92%
No 9 9 52,94% 52,94% 6 6 23,08% 23,08%
Total 17 17 100,00% 100,00% 26 26 100,00% 100,00%
III.2. Risk concentrations
absolute relative absolute relative
2007 2008 2007 2008 2007 2008 2007 2008
Yes 0 0 0,00% 0,00% 0 0 0,00% 0,00%
no 17 17 100,00% 100,00% 26 26 100,00% 100,00%
Total 17 17 100,00% 100,00% 26 26 100,00% 100,00%
III.3. Interdependences between
risks
absolute relative absolute relative
2007 2008 2007 2008 2007 2008 2007 2008
Yes 0 0 0,00% 0,00% 0 0 0,00% 0,00%
In relation to risks which could
lead to insolvency 1 1 5,88% 5,88% 5 6 19,23% 23,08%
No 16 16 94,12% 94,12% 21 20 80,77% 76,92%
Total 17 17 100,00% 100,00% 26 26 100,00% 100,00%
III.4. General statement about
risks
absolute relative absolute relative
2007 2008 2007 2008 2007 2008 2007 2008
Yes 4 5 23,53% 29,41% 21 23 80,77% 88,46%
No 13 12 76,47% 70,59% 5 3 19,23% 11,54%
Total 17 17 100,00% 100,00% 26 26 100,00% 100,00%
III.5. Priority of risks
absolute relative absolute relative
2007 2008 2007 2008 2007 2008 2007 2008
Yes 1 1 5,88% 5,88% 7 13 26,92% 50,00%
No 16 16 94,12% 94,12% 19 13 73,08% 50,00%
Total 17 17 100,00% 100,00% 26 26 100,00% 100,00%

QUALITY AND DETERMINANTS OF RISK REPORTING –
EVIDENCE FROM GERMANY AND AUSTRIA
12
Individual Risks
With regard to the presentation of risks and their qualitative consequences in the
financial year 2007 two reports of risk managements were assessed with “inadequate”,
eight with “adequate” and 29 with “highly detailed”. In 2008 the reporting of risk
management showed a slight tendency to rise. Only two reports were assessed with
“inadequate reported”. Four reports of risk management were “adequate” and at least 35
were “highly detailed”. In 2007 and 2008 two companies of the ATX did not report any
individual risks or explained their possible consequences. According to the German
requirements, risks do not need to be quantified unless several criteria are met. In the
financial years 2007 and 2008 quantitative estimates are only made by three DAX-30
companies. These three companies disclosed the methods and estimates used to quantify
individual risks. Furthermore, companies have to present the handling techniques for
existing specific risks. As shown in table 7 companies which are listed in the DAX-30
report about their handling techniques and mostly highly detailed and fulfill the criteria
better than companies which are listed in the ATX do.
Table 7: Results of analyzing the parameter “individual risks”
IV. Individual Risks Companies listed in ATX Companies listed in DAX-30
IV.1. Presentation of risks and
explanation of possible
consequences?
absolute relative absolute relative
2007 2008 2007 2008 2007 2008 2007 2008
No statement 2 2 11,76% 11,76% 0 0 0,00% 0,00%
Inadequate 2 1 11,76% 5,88% 2 1 7,69% 3,85%
Adequate 4 3 23,53% 17,65% 4 1 15,38% 3,85%
Highly detailed 9 11 52,94% 64,71% 20 24 76,92% 92,31%
Total 17 17 100,00% 100,00% 26 26 100,00% 100,00%
IV.2. Estimated quantitative
consequence of an individual
risk
absolute relative absolute relative
2007 2008 2007 2008 2007 2008 2007 2008
Yes 0 0 0,00% 0,00% 3 3 11,54% 11,54%
No 17 17 100,00% 100,00% 23 23 88,46% 88,46%
Total 17 17 100,00% 100,00% 26 26 100,00% 100,00%
IV.3. Are methods to quantify
individual risks presented?
absolute relative absolute relative
2007 2008 2007 2008 2007 2008 2007 2008
No statement 0 0 0,00% 0,00% 0 0 0,00% 0,00%
Inadequate 0 0 0,00% 0,00% 0 0 0,00% 0,00%
Adequate 0 0 0,00% 0,00% 1 0 33,33% 0,00%
Highly detailed 0 0 0,00% 0,00% 2 3 66,67% 100,00%
Total 0 0 0,00% 0,00% 3 3 100,00% 100,00%

ACRN Journal of Finance and Risk Perspectives
Vol. 1, Issue 2, p. 1-16, Nov. 2012
ISSN 2305-7394
13
IV.4. Information to handle an
individual risk
absolute relative absolute relative
2007 2008 2007 2008 2007 2008 2007 2008
No statement 2 1 11,76% 5,88% 0 0 0,00% 0,00%
Inadequate 4 4 23,53% 23,53% 2 1 7,69% 3,85%
Adequate 5 5 29,41% 29,41% 6 4 23,08% 15,38%
Highly detailed 6 7 35,29% 41,18% 18 21 69,23% 80,77%
Total 17 17 100,00% 100,00% 26 26 100,00% 100,00%
Financial Risks
The German and Austrian GAAP also requires special disclosures for financial
instruments. The analysis shows that quality of risk management objectives and policies
for financial instruments differ. As presented in table 8, companies which are listed in
the DAX-30 present their financial risk disclosure more detailed than companies listed
in the ATX. Although, at least all companies which are listed in the ATX report about
their risk management objectives and policies for financial instruments. Whereas in
2007/2008 four/two companies which are listed in the DAX-30 do not report about their
risk management objectives and policies. The results also indicate that companies report
their price and liquidity/cash flow risks mostly detailed. Only a small number of
companies reports inadequately about their price and liquidity/cash flows. Room for
improvements exists for credit risks. However, all companies report their handling
techniques concerning financial risks.
Table 8: Results of analyzing the parameter “financial instruments”
V. Financial risks Companies listed in ATX Companies listed in DAX-30
V.1. Risk management
objectives and policies
absolute relative absolute relative
2007 2008 2007 2008 2007 2008 2007 2008
No statement 0 0 0,00% 0,00% 4 2 15,38% 7,69%
Inadequate 8 6 47,06% 35,29% 5 4 19,23% 15,38%
Adequate 5 7 29,41% 41,18% 8 8 30,77% 30,77%
Highly detailed 4 4 23,53% 23,53% 9 12 34,62% 46,15%
Total 17 17 100,00% 100,00% 26 26 100,00% 100,00%
V.2. Price risk
absolute relative absolute relative
2007 2008 2007 2008 2007 2008 2007 2008
No statement 0 0 0,00% 0,00% 0 0 0,00% 0,00%
Inadequate 2 2 11,76% 11,76% 2 0 7,69% 0,00%
Adequate 4 3 23,53% 17,65% 4 4 15,38% 15,38%
Highly detailed 11 12 64,71% 70,59% 20 22 76,92% 84,62%

QUALITY AND DETERMINANTS OF RISK REPORTING –
EVIDENCE FROM GERMANY AND AUSTRIA
14
Total 17 17 100,00% 100,00% 26 26 100,00% 100,00%
V.3. Credit risk
absolute relative absolute relative
2007 2008 2007 2008 2007 2008 2007 2008
No statement 0 0 0,00% 0,00% 1 1 3,85% 3,85%
Inadequate 5 5 29,41% 29,41% 7 5 26,92% 19,23%
Adequate 7 6 41,18% 35,29% 7 9 26,92% 34,62%
Highly detailed 5 6 29,41% 35,29% 11 11 42,31% 42,31%
Total 17 17 100,00% 100,00% 26 26 100,00% 100,00%
V.4.Liquidity and cash
flow risk
absolute relative absolute relative
2007 2008 2007 2008 2007 2008 2007 2008
No statement 1 0 5,88% 0,00% 2 1 7,69% 3,85%
Inadequate 4 3 23,53% 17,65% 4 3 15,38% 11,54%
Adequate 1 3 5,88% 17,65% 3 2 11,54% 7,69%
Highly detailed 11 11 64,71% 64,71% 17 20 65,38% 76,92%
Total 17 17 100,00% 100,00% 26 26 100,00% 100,00%
V.5. Techniques to
handle risks
absolute relative absolute relative
2007 2008 2007 2008 2007 2008 2007 2008
Yes 17 17 100,00% 100,00% 26 26 100,00% 100,00%
No 0 0 0,00% 0,00% 0 0 0,00% 0,00%
Total 17 17 100,00% 100,00% 26 26 100,00% 100,00%
General statement about the quality of risk reporting
In this section the main results of the empirical study are presented. As table 9 shows no
company receives all points of the scoring model. In 2007 companies listed in the DAX-
30 received 27 points on average for their risk reporting. Companies listed in the ATX
got on average only 21 points. Table 9 provides evidence that companies which are
listed in the DAX-30 report their risk reporting information with higher quality than
companies which are listed in the ATX. These results are similar to those of Ewelt, C. et
al., 2009. Ewelt et al., 2009 found that DAX-30 companies show the highest quality of
risk reporting in comparison to other German indexes. As the number of individual risks
increased in 2008, the financial crisis might had an effect on risk reporting. But as
companies are affected by financial crisis in the second half of 2008, an increasing
number of risks in 2008 indicates that companies show risks which are on the horizon.

ACRN Journal of Finance and Risk Perspectives
Vol. 1, Issue 2, p. 1-16, Nov. 2012
ISSN 2305-7394
15
Table 9: Results of evalutation
Companies listed in
ATX
Companies listed in the
DAX-30
Evaluation
in points
in 2007
Evaluation
in points
in 2008
Evaluation
in points
in 2007
Evaluation
in points
in 2008
Mean 21 23 27 28
Median 22 23 27 30
Stand.
Deviation 5 4 4 4
Min. 13 15 17 17
Max. 28 31 36 36
25%-Quantil 18 19 25 26
75%-Quantil 25 27 30 31
Maximum points of the scoring model = 42
Results of regression model
The results of the regression model are summarised in the table below. The author finds
statistical evidence that the information quality of risk reporting is influenced by the
quantity of risk reporting. The results of the regression model show that quality
increases significantly with the number of pages of risk reporting which are disclosed.
The study also shows that index influences the quality of risk reporting. According to
the results, companies which are listed in the DAX-30 have statistically a higher quality
of risk reporting. The study found no evidence that the firm size influences the
information quantity of risk reporting disclosures statistically significant.
Table 10: Results of multiple linear regression model
Regression
coefficient
(Beta) T Sig. VIF
Number of
pages 0,58 5,75 0,00 1,70
Sales -0,04 -0,29 0,77 2,89
Total assets -0,03 -0,26 0,80 2,74
Index 0,26 2,61 0,01 1,62
N= 86, R²= 0,511, adjusted R²= 0,486

QUALITY AND DETERMINANTS OF RISK REPORTING –
EVIDENCE FROM GERMANY AND AUSTRIA
16
Conclusions
This paper attempted to establish a scoring model for the analysis of the information
quality of risk reporting. As indicated above, according to German and Austrian GAAP
the scoring model included five parameters (form, risk management, overall, individual
and financial risks). The analyses show that no company fulfils all criteria of the scoring
model and information quality of risk reporting is not uniform across companies.
Furthermore, there is a steady increase of the information quality of risk reporting from
2007 to 2008. The results of the multiple regression model indicate that the quantity of
risk reporting and the index a company is listed in, are statistically significant in
determining the information quality of risk reporting disclosures.
The study faces the following limitations. First, only two periods of reporting are
analyzed. Second, the sample includes only German and Austrian companies in the
prime stock market. Second, the results of a scoring model are always influenced by a
validity problem. Third, the evaluation of a scoring model requires the identification of
a vast number of dimensions to information quality that potentially exist. However,
these aspects offer fruitful avenues for further research.
References
Abraham, S. and Cox, P. 2007, Analysing the determinants for narrative risk information in UK FTSE
100 annual reports, The British Accounting Review, pp. 227-248.
Adams, C. A., Coutts, A. and Harte G., 1995, Corporate equal opportunities (non-)disclosure, The British
Accounting Review, pp. 87-108.
Buhr, N., 1998, Environmental performance, legislation and annual report disclosure: the case of acid rain
and Falconbridge, Accounting, Auditing and Accountability Journal, pp. 163-190.
Cowen, S. S.; Ferreri, L. B. and Parker, L. D. (1987), The Impact of corporate characteristics on social
responsibility disclosure: a typology and frequency-based analysis, Accounting, Organizations
and Society, pp. 111-122.
Deegan, C. and Rankin, M. 1996, Do Australian companies report environmental news objectively? An
analysis of environmental disclosures by firms prosecuted successfully by the Environmental
Protection Authority, Accounting, Auditing & Accountability Journal, pp. 50-67.
Ewelt, C.; Knauer, T. and Sieweke, M. 2009, Mehr = besser? Zur Entwicklung des Berichtsumfangs in
der Unternehmenspublizität am Beispiel der risikoorientierten Berichterstattung deutscher
Aktiengesellschaften, Zeitschrift für kapitalmarktorientierte und internationale
Rechnungslegung, pp. 706-715.
Fischer, T. M. and Vielmeyer, U. 2004: Analyse von Risk Disclosure Scores: Risikoorientierte
Unternehmenspublizität der DAX 100-Unternehmen, Zeitschrift für kapitalmarktorientierte und
internationale Rechnungslegung, pp. 459-474.
Lenz, H. and Diehm, J. 2010, Einfluss der Finanz- und Wirtschaftskrise auf die Risikoberichterstattung
im SDAX, Zeitschrift für kapitalmarktorientierte und internationale Rechnungslegung, pp. 385-
394.
Neu, D., Warsame, H. and Pedwell, K. 1998, Managing public impressions: environmental disclosures in
annual reports, Accounting, Organizations and Society, pp. 265-282.