qualitative comparison of non-destructive methods for
TRANSCRIPT

Article
JOURNAL OFC OM P O S I T EM AT E R I A L S
Qualitative comparison ofnon-destructive methods forinspection of carbon fiber-reinforced polymer laminates
Janez Rus1 , Alex Gustschin2, Hubert Mooshofer3,Jan-Carl Grager1, Klaas Bente4, Mate Gaal4, Franz Pfeiffer2,5
and Christian U. Grosse1
Abstract
In the rapidly expanding composite industry, novel inspection methods have been developed in recent years. Particularly
promising for air-coupled testing are cellular polypropylene transducers which offer better impedance matching to air
than piezoelectric transducers. Furthermore, broadband transmitters (laser-induced ultrasound and thermoacoustic
emitters) and receivers (optical microphones) have opened a completely new chapter for advanced contact-free ultra-
sound inspection. X-ray dark-field radiography offers a different approach to detect porosity and microcracks, employing
small angle X-ray scattering. These innovative ultrasonic and radiographic alternatives were evaluated in comparison
with well-established inspection techniques. We applied thirteen different non-destructive methods to inspect the same
specimen (a carbon fiber-reinforced polymer laminate with induced impact damage): air-coupled ultrasound testing
(using piezoelectric transducers, broadband optical microphones, cellular polypropylene transducers, and a thermoa-
coustic emitter), laser-induced ultrasound testing, ultrasonic immersion testing, phased array ultrasonic testing, optically
excited lock-in thermography, and X-ray radiography (projectional absorption and dark-field, tomosynthesis, and micro-
computed tomography). The inspection methods were qualitatively characterized by comparing the scan results. The
conclusions are advantageous for a decision on the optimal method for certain testing constraints.
Keywords
Carbon fiber-reinforced polymer, air-coupled ultrasound, optically excited lock-in thermography, X-ray micro-computed
tomography, X-ray dark-field radiography
Introduction
Generally, reconstructed images obtained by inspectionmethods deliver only a more or less accurate approxi-
mation of the reality. Each non-destructive testingmethod has its own characteristic footprint, whichalters information about the observed feature – it acts
as a filter function. By comparing results of differentmethods, it is possible to distinguish between filter
effects and the true conditions of the material anddefects. In this paper, we aim to isolate both in orderto investigate which of the imaged features are only
imaging artifacts and which deliver beneficial informa-tion for evaluation. More appropriate conclusions
about the inspected object can thus be made.Furthermore, we emphasize that the combination of
1Chair of Non-Destructive Testing, Centre for Building Materials,
Technical University of Munich, Germany2Chair of Biomedical Physics, Munich School of Bioengineering, Technical
University of Munich, Germany3Siemens AG, Corporate Technology, Germany48.4 Acoustic and Electromagnetic Methods, Federal Institute for
Materials Research and Testing (Bundesanstalt fur Materialforschung und
-prufung BAM), Germany5Department of Diagnostic and Interventional Radiology, School of
Medicine (Klinikum rechts der Isar), Technical University of Munich,
Germany
Corresponding author:
Janez Rus, Technical University of Munich, Centre for Building Materials,
Chair of Non-Destructive Testing, Franz-Langinger-Strasse 10, 81245
Munich, Germany.
Email: [email protected]
Journal of Composite Materials
0(0) 1–13
! The Author(s) 2020
Article reuse guidelines:
sagepub.com/journals-permissions
DOI: 10.1177/0021998320931162
journals.sagepub.com/home/jcm
different imaging methods deliver additional informa-
tion about the specimen that cannot be obtained by a
single method.There are few recent publications dealing with a sim-
ilar comparison. Grosse et al.1 include results from air-
coupled ultrasound (ACU), immersion testing and
optically excited lock-in thermography (OLT) asapplied to impact damage and flat-bottom holes.
Ultrasound (US) immersion testing and X-ray micro-
computed tomography (mCT) were applied and
compared to inspect impact damages in carbon fiber-reinforced polymer (CFRP) in Ehrlich et al.2 The
damaged area determined by the mCT was significantly
larger than the one obtained by US testing. Maierhofer
et al.3 compared the images obtained by different
arrangements of passive (immediate after the impact)and active thermography with the C-scans of contact
phased array ultrasonic testing (PAUT) and ACU. The
specimen was an impacted CFRP plate. Abou-Khousa
et al.4 compared X-ray computed tomography, nearfield millimeter wave, shearography and immersion
testing US methods on honeycomb composite speci-
mens. Their results show an advantage of X-ray com-
puted tomography in lateral resolution compared toother methods. Wang et al.5 compared X-ray computed
tomography, terahertz imaging and immersion US test-
ing on glass fiber-reinforced polymer composites with
delaminations. They demonstrated that for the speci-
men tested, terahertz imaging has higher contrast thanX-ray computed tomography and higher lateral
and axial resolution than immersion US testing.
Schumacher et al.6 applied US, thermography, eddy
current, and X-ray methods (radiography, laminogra-phy and mCT) to CFRP laminate samples. They con-
clude that each of the methods can contribute different
information to overall evaluation of the specimen.
Hakim et al.7 compared different variations of ther-mography testing methods on CFRP samples. Papa
et al.8 compared the results of electronic speckle pat-
tern interferometry and PAUT on basalt composite
laminates with induced low-velocity impact damages.
Grager et al.9 used various ACU testing setups toinspect CFRP samples with flat-bottom holes, foam
core CFRP sandwich and an impact specimen that is
used in the present study. We therefore included their
results in this work to make a side-by-side comparisonto other non-destructive testing (NDT) methods. Their
results show the advantage of the broadband optical
microphone as an alternative to the piezoelectric US
receivers in its good spatial scan resolution. However,in contrary to our results, which were also achieved
with a newer and more sensitive version of the optical
microphone, they described the problems with lower
sensitivity and scan artifacts at the damage boundary.
Further description of this effect is given in Results ofthe comparison and discussion section.
X-ray dark-field radiography is a relatively newmethod that uses spatial intensity modulation on themicron scale to generate a contrast based on smallangle X-ray scattering.10 It is sensitive to electron den-sity modulations on the micron scale and is suitable fordetection of porosity, microcracks11 and fiber orienta-tion.12 Recently, some progress was reported in termsof field of view and scanning speed13 making thismethod of interest for an evaluation and comparisonwith other approaches.
In this work, we compare a broader spectrum ofinspection methods than in the previous researchbeing described in the literature. Furthermore, weinclude recently developed, more efficient, non-contact techniques using broadband US excitationand detection. By setting them side-by-side with theconventional and established methods,14,15 their poten-tials can be evaluated. Additionally, we compare vari-ous radiographic methods on the same example.
Piezoelectric and cellular polypropylene (cPP) trans-mitter, thermoacoustic emitter (TAE), and laser pulsewere used as contact-free US sources. Piezoelectric andcPP receiver and different versions of broadband opti-cal microphones were used for US detection in air inthrough-transmission setups. Other methods that aresuitable for impact damage inspection in monolithicCFRP materials are also used in this study, namely,PAUT, immersion testing, OLT, and X-ray radiogra-phy methods (projectional absorption and dark-field,tomosynthesis and mCT). The purpose of our study isto get a broader overview of this extended group of testmethods for CFRP plate inspection. Evaluating theresults delivered by various methods deepens ourunderstanding of their shortcomings and advantages.Hence better decisions can be made for a specificinspection task between the different alternatives.
Specimen description
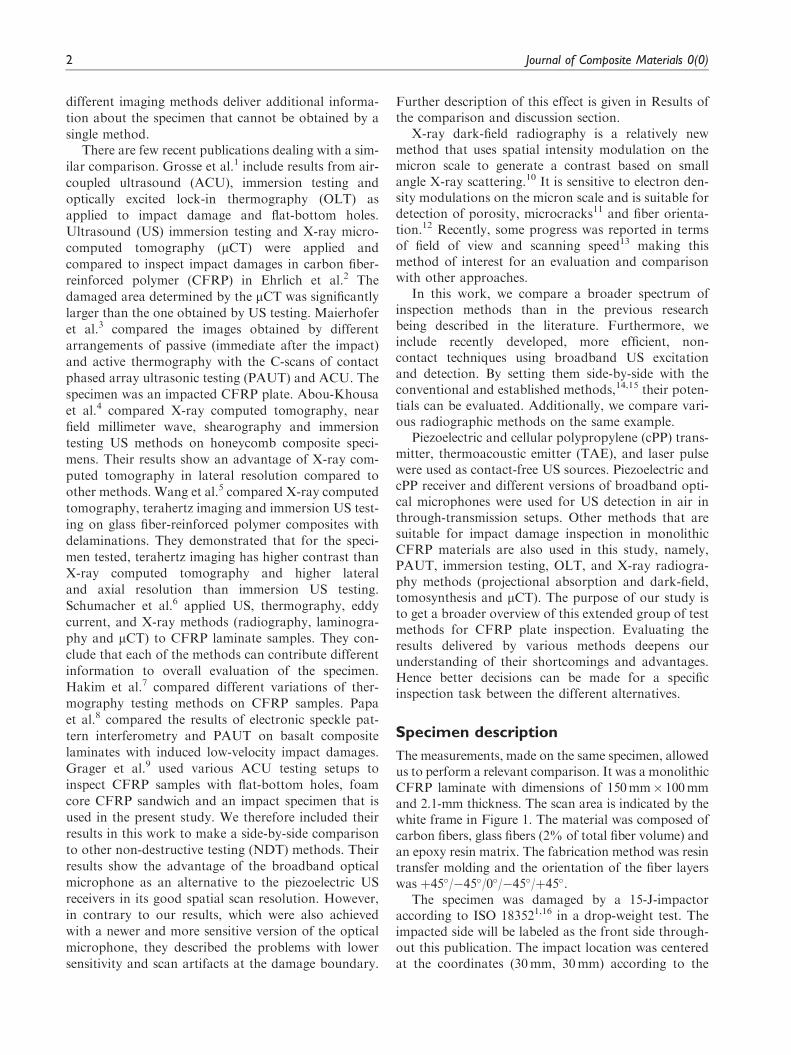
The measurements, made on the same specimen, allowedus to perform a relevant comparison. It was a monolithicCFRP laminate with dimensions of 150mm� 100mmand 2.1-mm thickness. The scan area is indicated by thewhite frame in Figure 1. The material was composed ofcarbon fibers, glass fibers (2% of total fiber volume) andan epoxy resin matrix. The fabrication method was resintransfer molding and the orientation of the fiber layerswas þ45�/�45�/0�/�45�/þ45�.
The specimen was damaged by a 15-J-impactoraccording to ISO 183521,16 in a drop-weight test. Theimpacted side will be labeled as the front side through-out this publication. The impact location was centeredat the coordinates (30mm, 30mm) according to the
2 Journal of Composite Materials 0(0)
scan coordinate system depicted in Figure 1. The diam-
eter of the hemispherical impactor was 15.75mm.Impact damage is a feature that is frequently
inspected in CFRP – a common material used in aero-
space and lightweight engineering. Due to its high prac-
tical relevance and its complex defect shape, it is an
optimal feature to compare different NDT methods.
It can be described as consisting of chaotically distrib-
uted median and lateral cracks and overlaying delami-
nations of different sizes and shapes.We chose impact damage to compare the inspection
methods for two reasons. Firstly, it is practically rele-
vant: impact is one of the most common causes of
damage which can emerge either during production
(drop/impact of the tools) or during the utilization of
the investigated object. Secondly, it has a complex
defect shape, which can be described as consisting of
chaotically distributed median and lateral (closed and
open) cracks and overlaying delaminations of different
sizes and shapes. Capability of the inspection methods
to detect the specific details of the defect shape can thus
be evaluated. CFRP is a common material used in
aerospace and lightweight engineering, where meeting
the adequate quality standards is of high importance.
Impact damage significantly alters the macroscopic
material properties of the CFRP structures, which
need to be regularly inspected when used for safety-
sensitive applications.
Methods description
In the following subchapters, a brief description is
given of the test methods selected for comparison.
Experimental equipment is identified together with
the scan parameters. Separately, we explain how
each of the C-scans was obtained. All of the ACU
testing methods were conducted in classical
through-transmission configuration with the US emit-
ter placed on the front side of the specimen. The US
excitation voltage was in a unipolar square shape. The
number of pulses is labeled separately for each of the
ACU method. Unless otherwise stated, no data aver-
aging was applied.
Air coupled ultrasound: Piezoelectric transducers and
optical microphones
Four scans were made using different piezoelectric
transmitter and receiver (piezoelectric, optical micro-
phone) combinations (Figure 2(a) to (e)).9,17–20
Individual experimental setups are described in sepa-
rate subsections.The Eta100, Eta250 and Eta450 are versions of opti-
cal microphones produced by Xarion Laser Acoustics.
Their sensitivity (0.35mV/Pa, 10mV/Pa and 100mV/
Pa at 1 kHz) increases and their self-noise (1.5mPa,
50 lPa at 1 kHz, and 5 lPa at 500 kHz) decreases (mea-
sured at bandwidth of 1Hz) with a higher version
number, as specified by the manufacturer. Optical
microphones are able to detect sound waves without
any moving parts.21,22 They therefore have a signifi-
cantly broader frequency range (from less than kHz
to several MHz) compared to conventional air-
coupled US sensors. Detection via Fabry-P�erot inter-ferometer (etalon) eliminates one air-solid interface in
the measurement configuration. The diameter of the
Figure 1. Front (a) and back (b) side of the specimen plate. The white frame indicates the scanned area.
Rus et al. 3

laser beam is approximately 0.2mm and the length ofthe etalon 2mm. This results in the small aperture ofthe optical microphones, which enables a higher spatialresolution compared to conventional piezoelectricreceivers.
Emitter: Piezoelectric transducer 200 kHz – receiver:
Piezoelectric transducer 200 kHz. A pair of focused piezo-electric transducers AirTech 200 from Hillger NDTwith 200 kHz nominal frequency and bandwidth of21 kHz (-6 dB) was used.9,20 The diameters of theiroscillators were 11.1mm, their near-field length18mm, and the diameter of their soundfield in focus3mm (-6 dB). Sensitivity (transfer ratio in air) of thetransducer pair was -33 dB. 10 pulses with amplitude of142V were excited by the USPC AirTech 4000 (HillgerNDT) electronics. Gain at reception was 48 dB.Scanning spatial resolution was set to 0.1mm. Signalswere filtered using an IIR-band-pass filter (190 kHz–210 kHz, of 8th order). C-scans were obtained by plot-ting the maximum amplitude value within the timewindow of the burst signal length (Figure 2(a)).
Emitter: Piezoelectric transducer 200 kHz – receiver: Eta100
optical microphone. The same AirTech 200 transducer asdescribed previously was used as the US source.19 Onthe receiver side, the first version of the optical micro-phone: Eta100 prototype was used to capture the US.8 pulses with amplitude of 200V were excited by theUSPC AirTech 4000 (Hillger NDT) electronics. Digitalgain at reception was 20 dB. The receiver was located2 cm away from the back side of the specimen. C-scanswere obtained by plotting the maximum amplitudevalue of the captured burst signal (Figure 2(b)).
Emitter: Piezoelectric transducer 200 kHz – receiver: Eta250
optical microphone. The same AirTech 200 transducerwas used as US source.9,20 On the receiver side, anEta250 optical microphone was used to capture theUS with 8-mm air gap to the specimen. The scanningspatial resolution was set to 0.1mm. Signals at eachscan position were filtered with an IIR-band-passfilter (190 kHz–210 kHz, of 8th order). 10 pulses withamplitude of 200V were excited by the USPC AirTech4000 (Hillger NDT) electronics. Digital gain at recep-tion was 5.7 dB. The typical burst signal length was100 ms. C-scans were obtained by plotting the maxi-mum amplitude value within the 20 ms (Figure 2(c))and 60 ms (Figure 2(d)) time window, starting withthe first break of the signal.
Emitter: Piezoelectric transducer 400 kHz – receiver: Eta450
optical microphone prototype. Focused piezoelectric trans-ducer Sonoair CF 400 from Sonotec with nominal fre-quency of 400 kHz and bandwidth of 25 kHz (-6 dB, as
measured by Eta450 optical microphone) was used as aUS source.18 The diameter of its oscillator was 20mm,its near-field length 5 cm, and the diameter of its sound-field in focus 4mm (-6 dB). Sensitivity (transfer ratio inair) of the transducer pair was -31 dB, as measured bythe manufacturer. 8 pulses with amplitude of 400Vwere excited by the Sonotec electronics. Gain at recep-tion was 20 dB. On the receiver side, a prototype of theEta450 was used. Specimen to microphone distancewas set to 12mm and the scanning grid size to0.25mm. The signal was filtered with a band-passfilter (Butterworth 350 kHz–450 kHz). To obtain theC-scans, the peak amplitude value (at nominal frequen-cy of the US source) was plotted in greyscale (Figure 2(e)).
Air coupled ultrasound: Cellular polypropylenetransducers (cPP) and Eta250 optical microphone
cPP has significantly lower acoustic impedance thanconventional piezoelectric ceramics.9,23 The impedancematch to air is improved by flat voids constructedwithin the cPP. Consequently, cPP transducers aremore efficient at US generation and reception in air.That was the motivation for choosing it for the con-struction of air-coupled transducers for non-destructivetesting.23 Transmission of some wooden samples hasshown that the signal-to-noise ratio of ferroelectretcPP transducers is about 6 dB higher than of commer-cially available transducers.24 Sensitivity of the in-house cPP receivers has not yet been measured, butcan be calculated approximately as shown in Gaalet al.23 It amounts around 2.5mV/Pa for transducersat 250 kHz and 3.9mV/Pa for transducers around80 kHz. We have measured sound pressure level of146 dB (rel. to 20 mPa) in the focus of a similar trans-mitter (250 kHz middle frequency, 19mm aperture and50mm focusing radius) as used in our experiment.
Another focused cPP transmitter with a peak fre-quency of 247 kHz, near-field length 6.5 cm and aper-ture size of 19mm was used as a US source. A focusedcPP receiver with near-field length 2.5 cm, aperture sizeof 11mm and a peak frequency of 280 kHz was locatedat the opposite side of the specimen plate. Both trans-ducers had a bandwidth of 20% (-6 dB) and the diam-eter of their soundfield in focus 2.5mm (-6 dB).25 Thecorresponding C-scan results are shown in Figure 2(f).
For a second cPP-experiment, the emitter wasreplaced with one having a lower peak frequency of127 kHz and a bandwidth of about 16%. It was unfo-cused and had a soundfield diameter (-6 dB) of approx-imately 6mm. The reason for this was that at theoriginal testing frequency (247 kHz), the received USpressure level was too low to be detected by theEta250 optical microphone. The Eta250 signal was
4 Journal of Composite Materials 0(0)
band-pass filtered (105 kHz–145 kHz; of 8. order IIR).The C-scan results are shown in Figure 2(g). The elec-tronic device used for both cPP transmitters was USPCAirTech 4000 (Hillger NDT). Additionally, the trans-mitters included an electrical matching network trans-forming the incoming 140V to 1.8 kV to generate adouble pulse for 247 kHz cPP transmitter and 5pulses for 127 kHz cPP transmitter. The maximumamplitude within the time window of the burst signalis coded in greyscale for both experiments with cPP.
Air coupled ultrasound: Thermoacoustic emitter(TAE) and Eta450 optical microphone
A TAE generates US directly in air by an increase inthe air’s internal energy through heat.26 In comparisonto conventional resonant transducers, TAEs induce sig-nificantly shorter pulses – typically around 1 ms.Consequently, TAEs have a broader frequency range,which potentially allows for a broadband spectral anal-ysis of the testing specimen. Typically, US is excited bya short-time (ms) electrical discharge over a thin con-ductive film, applied on a carrier substrate.
For the CFRP impact specimen, a TAE with aspherically curved glass substrate with a 200 nmindium tin oxide film was used.27 The glass wascurved with a radius of 92.5mm to achieve acousticfocusing. A concentric electrode design caused aradial current flow. The thermoacoustically activeindium tin oxide area had an inner radius of 10mmand an outer radius of 26mm. The excitation electron-ics consisted of the USPC 4000 Airtech (Hillger NDT),a voltage divider, an Agilent 33500B (KeysightTechnologies) arbitrary waveform generator (AWG)and an in-house power amplifier.
The spatial scan resolution was 0.15mm, the TAEexcitation voltage 375V, the peak power was 18 kWand the width of a single pulse was 2 ms. The shortpulse emitted by TAE was comparatively broadband:742 kHz (-6 dB) with the center frequency at 410 kHz.At this frequency the sound pressure level was approx-imately 115 dB (ref. to 20 lPa). An Eta450 opticalmicrophone was used as a receiver on the oppositeside of the specimen. The signal was averaged 3times. The difference between maximum and minimumamplitude value in the time window of the pulse widthwas plotted to generate the C-scan (Figure 2(h)).
Laser induced ultrasound in combination with theEta450 optical microphone
Nd-YAG frequency-doubled, q-switched pulse laserwith a wavelength of 532 nm (green light) was used togenerate the US waves on the front side of the speci-men.28 The laser beam diameter was 8mm (95%
intensity level). The shock wave was induced in thethermoelastic regime (no ablation). The laser sourcewas part of the US excitation system provided byXarion Laser Acoustics. The US was captured on theback side of the specimen plate using the Eta450. Whenscanning, the optical microphone was located approx.4mm away from the specimen. The setup was the sameas used for the local ultrasonic resonance spectroscopyexperiment described in Rus and Grosse.29
The increment length of the scan was 0.2mm andthe scanning speed 4mm/s. To obtain the C-scan, themean amplitude of the captured signal in a frequencydomain between 500 kHz and 4MHz was coded ingreyscale (Figure 2(i)).
Immersion ultrasonic testing
For immersion tests, the US testing system USPC3040S DAC from Hillger NDT was used with aH10MP15 focused probe from GE Sensing &Inspection Technologies GmbH.16 It has a relativebandwidth of more than 80%, a nominal frequencyof 10MHz and a focal length of 15mm in water. Thetransducer diameter was 5.0mm. The scanning spatialresolution was 0.48mm. The specimen was notdegassed before being immersed in water.
C-scans were obtained by plotting the maximumamplitude value in a specific time window.For Figure 2(j), this window was set on the US echofrom the back side of the specimen; for Figure 2(k), thiswindow was set on the US echo from the reflectorlocated on the opposite side of the specimen in thewater, according to the US source (double throughtransmission technique).
Phased array ultrasonic testing (PAUT)
An Olympus OmniScan MX2 with 5L64-A2 phasedarray contact sensor was used in experiment.30 It is a5MHz linear array comprising 64 piezoelectric ele-ments with total aperture length of 38mm. A C-scanwas generated while sweeping the sensor head perpen-dicularly to the array orientation with the maximumspeed of 15.5mm/s. The sensor head location wasspecified by a wheel displacement encoder. The sensorhead was directly in contact with the front side of thespecimen. Water was used as a couplant. The scan res-olution was 0.17mm in sweep direction and 0.6mm inarray element direction. The amplitude of the backwallecho is shown in Figure 2(l).
Optically excited lock-in thermography (OLT)
The infrared camera used in this setup was IRCAMEquus 327k SM PRO.16 It has a spectral range between1.5 lm and 5 lm wavelengths with the resolution of 640
Rus et al. 5
Pixel� 512 Pixel. A wide-angle lens with a focal lengthof 28mm was used for the tests. For external opticalexcitation, a PAR-64 Profi Floorspot halogen lampemitter with the maximum power of 1,000W wasused together with a ESG 570F signal generatorfrom Edevis GmbH. The camera and the lamp werelocated on the same side of the specimen. The lock-infrequency was set to 0.05Hz. In Figure 3, the phaseshift between the incident and reflected wave is codedin greyscale. The phase range was chosen in a range inwhich the damage is most visible.
X-ray radiography methods
Projectional absorption radiography and tomosynthesis. Atomosynthesis scan was performed using a GEPhoenix v|tome|x S system operating the microfocustransmission X-ray tube at an acceleration voltage of30 kV and a current of 500 mA. The sample wasmounted exactly between the source and detector(1,000� 1,000 pixel) resulting in a magnificationfactor of two, an effective pixel size of 100 mm and afield of view of 10 cm� 10 cm. 100 projections werecaptured in the �20� range with 2 s exposure timeeach. A projection perpendicular to the platesurface is shown (inverted, normalized transmission)in Figure 4 (a). The tomosynthesis was reconstructedby a standard filtered back-projection using the samesoftware as described below for mCT. The greyscalewas windowed respective to the full range of the filteredback-projection to make the damage as visible as pos-sible and comparable to the absorption image. It ismost visible in the planes corresponding to the back-most layer of the plate (Figure 4(b)).
Projectional X-ray dark-field radiography. The X-ray dark-field radiographs were acquired with a lab-basedTalbot-Lau grating interferometer operated at 50 kVpand 50W tube power (X-RAY WorX SE 160, tungstenreflection target). The detector was an XRD 4343CT(Varex Imaging) with a pixel size of 150 mm. The systemis arranged in a symmetric geometry employing twoabsorption gratings and one phase grating, all with aperiod of 10 mm and an inter-grating distance of 0.85m,achieving a mean visibility of about 33%. Every dark-field frame was acquired by a phase stepping with 11steps and an exposure time of 2 s each. Since the field-of-view in the sensitive configuration (sample 5 cm infront of the phase grating, 75 mm effective pixel size) islimited to about 3 cm� 2 cm, the sample was imaged in12 exposures and stitched together after processing.The shown radiograph (Figure 4(c)) displays the nega-tive natural logarithm of the relative visibility drop(V/V0) close to the maximum dynamic range in theacquired data.
Micro-computed tomography (lCT). The mCT scans were
performed using the same X-ray system and geometry
as for the tomosynthesis. The acceleration voltage was
increased to 50 kVp (200 mA) for a better penetration at
increased transmitted thicknesses. Two mCT scans were
performed with a 360� rotation of the specimen. The
first had the same geometry as the tomosynthesis and
was conducted with 1,601 angular projections at an
exposure time of 20 s each. The second was performed
at 4� magnification (5-cm� 5-cm field of view, 50-mmeffective pixel size) with 1,001 angular projections at
15 s exposure time. The volumetric images were recon-
structed from the projections by the X-AID FDK
Reconstruction Suite Version 2019.11.4 by Mitos
GmbH. Selected slices from the 3D data are shown
in Figure 4(d) and (e), where the greyscale values up
to a constant factor represent the effective X-ray atten-
uation coefficient. For both measurements, the range of
greyscale values was adapted similarly for a clear visu-
alization of the damage.
Results of the comparison and discussion
In Figure 2, we collected the C-scans of each of the US
methods described in the previous chapter. OLT and
radiography results are shown separately in Figures 3
and 4, respectively. On the right side above each
C-scan, its contrast-to-noise ratio (CNR) is labeled. It
is defined as
CNR ¼ SF � SD
rN;
where SF is the mean value of the C-scan amplitudes in
the damage-free region, SD the mean value of the C-
scan amplitudes in the region of the impact damage,
and rN standard deviation of the C-scan amplitudes in
the damage-free region. Please note that for Figure 2(i)
to (l) the noise levels in the damage-free region are
overestimated, because the structures in the laminate
(e.g. fiber bundles in different directions) are visible
there. The lower CNR does not signify the lower qual-
ity of these C-scans, marked with the symbol (*).In the previous chapter, a description is given for
each US method, and how the amplitude scalar
values were extracted from the A-scans for each scan-
ning position. They are coded in greyscale to avoid
subjectivity and are expressed in a relative range
according to the minimum and maximum amplitude
value of each scan (linear scale). It is possible to qual-
itatively compare the shape of the damaged area
obtained by different methods and compare the
signal-to-noise ratio of the scan image. We can examine
which details of the impact damage are visible by a
6 Journal of Composite Materials 0(0)
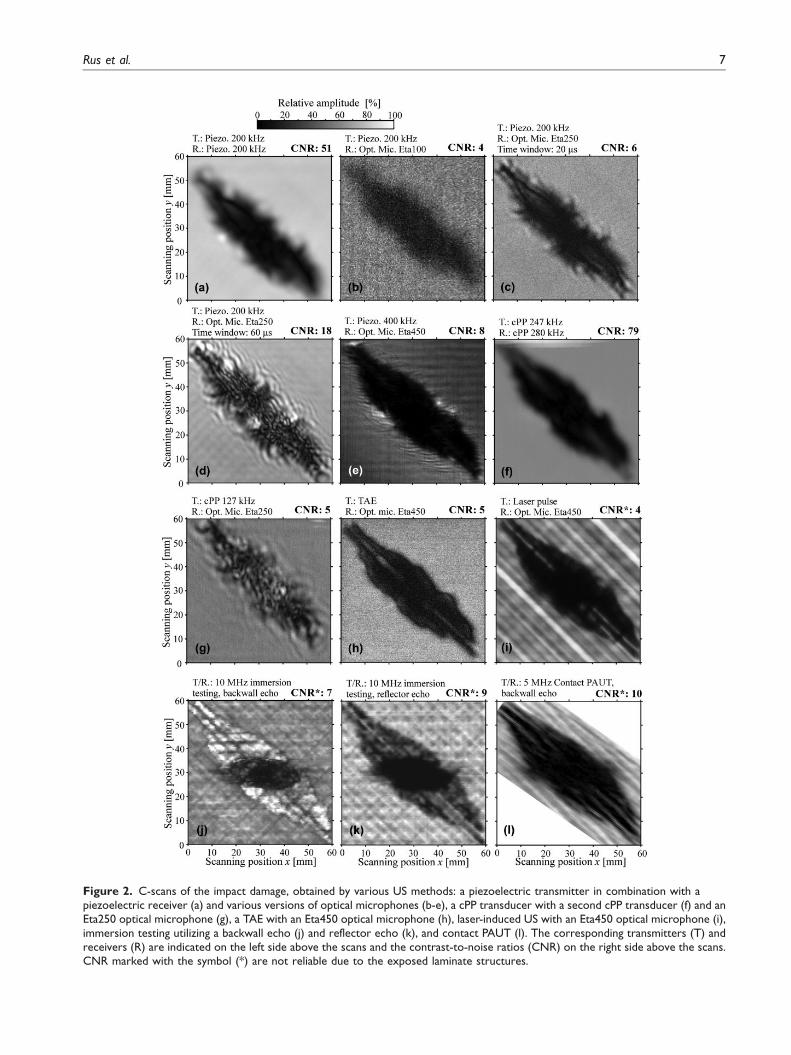
Figure 2. C-scans of the impact damage, obtained by various US methods: a piezoelectric transmitter in combination with apiezoelectric receiver (a) and various versions of optical microphones (b-e), a cPP transducer with a second cPP transducer (f) and anEta250 optical microphone (g), a TAE with an Eta450 optical microphone (h), laser-induced US with an Eta450 optical microphone (i),immersion testing utilizing a backwall echo (j) and reflector echo (k), and contact PAUT (l). The corresponding transmitters (T) andreceivers (R) are indicated on the left side above the scans and the contrast-to-noise ratios (CNR) on the right side above the scans.CNR marked with the symbol (*) are not reliable due to the exposed laminate structures.
Rus et al. 7

single method. By observing the boundary of thedefected area, we can observe the level of spatial aver-aging of the specific method caused by the transducer’saperture. The detected damage surface can also becompared.
ACU inspection with the piezoelectric transmitterand receiver yields good contrast (Figure 2(a)) betweenthe damaged and damage-free area. The results are spa-tially blurred due to the 3-mm diameter of the trans-ducers’ soundfield in the focus. Detectability of thedamage and resolution of the inspection processcould be improved by using transducers of higher nom-inal frequency, which is however limited by attenuationlevel of US in the tested material.
The first model of the optical microphone (Eta100prototype) had low sensitivity in this measurement con-figuration, which leads to a lower signal-to-noise ratio(Figure 2(b)). With each newer model of the opticalmicrophone, the sensitivity was increased, which canbe seen by the improvement in the quality of the scanimage (Figure 2(b) to (e)). Spatial resolution isimproved when the piezoelectric receiver is replacedby the optical microphone because of the small sensor’sacoustic aperture. This is however negated by theimage artifacts that blur the boundary and the interiorof the damage (Figure 2(c), (d), and (g)). They arecaused by mechanical interference, thickness resonan-ces, and delamination clapping, while the US wavetrain travels through the chaotically cracked anddelaminated area. These local defect resonances have
their characteristic frequencies typically in the range
above several 10 kHz, but mostly below the plate thick-
ness resonance frequency.29,31 These effects are more
pronounced, when the US is detected over a wide fre-
quency range e.g. by optical microphones. The effect of
the measurement time gate width on these artifacts, in
which the maximum amplitude is extracted to create a
C-scan, can be observed by comparing Figure 2(c) with
(d). These resonance artifacts are only present if the
time window length is extended, which shows that the
resonance effects occur after the first break of the US
wave. No artifacts are present in Figure 2(h) when
using the TAE and Eta450 optical microphone
because the evaluated time gate width is reduced to
the length of the US pulse (2 ms). The increase of the
US amplitude transmitted through the plate at the
left-side and right-side of the damage boundary at
scanning position y¼ 30 can be explained similarly
for Figure 2(e).When applying a higher US frequency (400 kHz
instead of 200 kHz), the shape of the damaged area is
more pronounced and the artifacts at the damage
boundary reduced (Figure 2(e)). This higher testing fre-
quency allows for a more accurate determination of the
damage surface, since higher US frequencies are dissi-
pated more in the damaged area. Consequently,
boundaries of the damage are clearer and the contrast
between damaged and undamaged area is higher.
A similar improvement could also be achieved by
Figure 3. OLT phase images of the front (a) and back (b) side of the specimen.
8 Journal of Composite Materials 0(0)

increasing the testing frequency of the conventional
setup using a pair of piezoelectric transducers.CPP transducers (Figure 2(f)) provide contrast
improvement over conventional piezoelectric trans-
ducers (Figure 2(a)). Spatial blurring appears to be
slightly reduced. Please note, that the testing frequency
was lowered for the Figure 2(g), since the cPP trans-
mitter had been used in the combination with an
Eta250 optical microphone. Apart from this, the
ACU inspection with piezoelectric transducers of
increased frequency (400 kHz) was applicable, since a
more sensitive Eta450 optical microphone was avail-
able for this measurement. We expect an improvement
of cPP inspection results while using Eta450 instead of
Eta250 optical microphone.TAE generate short (ms) US pulses matching the
broadband frequency characteristics of the optical
microphone. This and the laser-excited US inspection
are the only couplant-free methods described in this
paper that allows MHz-range US inspection. The con-
tour of the damage surface is well visible due to
high-frequency US, which was focused on the small
specimen surface. However, it is challenging to induce
high-energy short-lasting US pulses. The signal-
to-noise ratio is therefore lower in Figure 2(h). We
want to emphasize that TAE is still in the development
process and the full performance potential has not been
tested yet (e.g. maximum pulse energy).Laser US is able to generate short-lasting, high-
energy US shock waves in higher frequency range
(MHz) with repeatability suitable to be used for
C-scan generation. Almost no US in the frequency
range from 500 kHz to 4MHz is transmitted through
the plate in the delaminated area. This provides a good
Figure 4. X-ray radiographs: absorption projection (a), tomosynthesis (b), dark-field projection (c), and selected mCT slices of fullfield of view (d) and reduced field of view (e). Positions of cross-sectional images are marked with dotted lines in the background.
Rus et al. 9

contrast between damaged and damage-free plate area(Figure 2(i)). The damage area determined qualitativelyby the laser US is comparable to the one determined byimmersion testing (Figure 2(j) and (k)), which is oftenreferred to as the most accurate method to evaluate thesize of damage.
As it is the case for all the ACU methods in ourexperiment, no reliable conclusions about the interiorof the damage (overlying delaminations, cracks andporosity) can be made.
Comparing all the ACU methods (including thelaser US method) with the radiography methods(Figure 4), we can conclude that none of these deliverreliable information about the interior of the damagedarea (also when the amplitude is expressed in logarith-mic scale). At the first additional solid-to-air transitioncaused by an internal delamination or crack, almost allof the transmitted US is dissipated. Overlying delami-nations, cracks and porosity cannot be reliably distin-guish by ACU methods used in our experiments.
This is not the case for immersion testing (Figure 2(j) and (k)). Defect and material structure are clearlyvisible. The approximate true size of the defect can beeasily determined by examining the C-scan obtained bythe reflector echo (located behind the specimen plate),since the US in this case travels twice through the dam-aged area (Figure 2(k)). Since US are being reflectedfrom the back side of the specimen, we can distinguishadditional details about the damage, for example thearea with a higher density of cracks lies directly underthe impact location (Figure 2(j)). The adjacent brighterregions of the impact damage are caused by resonancesdue to the delamination of the last ply. This is thedominant damage pattern in this region, which canalso be seen in the following mCT evaluation.
PAUT inspection results are presented in Figure 2(l). The data are shown only within the trace, whichwas covered by the linear movement of the probe. Theresult shows a good contrast. The material structure isvisible, however less clear than in the case of the moresensitive immersion inspection. The object shape differsfrom the one obtained by the immersion testing or bythe laser US method. As with every contact inspectionmethod, its applicability depends on the surface qualityand its smoothness.
The orientation of several fiber layers can be deter-mined by immersion testing method (Figure 2(j) and(k)). With the measurement setup, where US was excit-ed by the laser pulse and detected by optical micro-phone Figure 2(i), we can distinguish the orientationof the surface fiber layer on the receiver side.
In Figure 3, results of the OLT applied to both sidesof the plate are shown.
In the case of OLT, the inspection can be performedsingle-sided. However, it was found that the results
strongly depend on the side from which the inspection
is performed. As shown in Figure 3(a) the inspection
from the front side shows only a small fraction of the
damaged area, while the inspection from the back side
provides a result that corresponds well with the US
inspection methods (Figure 3(b)). The delamination
that is located near to the opposite surface of the
plate is difficult to be detected by one-sided OLT,
and the damage size is strongly underestimated. In
non-defective areas of the sample, the induced heatwave is reflected on the back of the sample. In areas
where only the last layer is delaminated, the reflection
occurs only a few tenths of a millimeter earlier. These
small differences are very challenging for OLT to
detect.In Figure 4, radiography results are shown: absorp-
tion projection (a), tomosynthesis (b), dark-field pro-
jection (c) and mCT (d, e). The volumetric mCT data of
the full field of view (100-mm effective pixel size)
(Figure 4(d)) and reduced field of view (50-mm effective
pixel size) (Figure 4(e)) are shown in selected cross-sectional images. Their positions are marked with
dotted lines in the background, respectively.Absorption-based techniques (Figure 4(a), (b), (d),
and (e)) deliver a significant contrast between the glass
and the carbon fibers due to a strong difference in
X-ray attenuation of silicon and carbon in the used
energy range. The central part of the damage is only
slightly visible in a single X-ray absorption projection.
The lateral cracks are not distinguishable. The medial
cracks are more pronounced in the tomosynthesis and
defects between fiber bundles are recognizable.However, glass fibers below and above the examined
layer are blurred, which is a typical feature of tomosyn-
thesis. In the dark-field projection image, the central
part of the damage delivers a high contrast compared
to the remaining outer area and the glass fibers are
almost invisible. As evident from the mCT data, this
bright area features a high density of microcracks.
Therefore, projectional dark-field might be an efficient
technique to detect such a kind of morphology without
the need for high resolution and object rotation, as is
the case with tomosynthesis and mCT.In Figure 4(d), the cross-sectional frame, on which
the delaminated surface appears the largest (0.6mm
from the back surface) is shown. However, the
damage boundaries are not well pronounced since the
closed cracks do not deliver a significant contrast in
X-ray attenuation and partial volume artifacts limit
the sensitivity to very narrow delaminations. The sur-
face of the damaged area obtained by mCT is therefore
smaller and less accurate than compared to the US
inspection methods. In Figure 4(e), a detailed structure
can be seen in the central region of the damaged area.
10 Journal of Composite Materials 0(0)

The high resolution scan reveals the voids between the
displaced fiber bundles and the microscopic cracks.
Conclusion
The comparison of different methods is a basis for deci-
sion making regarding an inspection task with certain
framework conditions. In the conclusion, we suggest
optimal inspection methods for specific applications.If the inspection process is to be automated and
performed quickly, ACU is the most elegant solution
for the specimens with suitable geometry (plates), espe-
cially if they are sensitive to liquid couplants. For
larger impact damages and delaminations, where sub-
millimeter resolution is not required, the transmission
with cPP transducers or classical piezoelectric trans-
ducers delivers the highest contrast and is the most
cost-effective. On the other hand, if the precise
damage surface is of additional value or if the
damage size is too small to be conventionally detected,
we suggest using a 400 kHz piezoelectric transducer in
combination with an Eta450 optical microphone.Furthermore, if even higher sensitivity for damage
detection and increased spatial resolution is required,
we recommend laser-induced US or immersion testing.
These two methods are capable to detect the delamina-
tion with the smallest opening of all of the methods
described in this paper; mCT at this point is limited
by resolution and hardly detects any delaminations
with openings below the voxel size. Laser-induced US
is advantageous if the specimens cannot be immersed in
water (e.g. big-sized, corrosive, fragile or hot speci-
mens) or if the laser safety standards are easier to be
realized for a specific application than the handling of
the specimen in water. While it is possible with immer-
sion testing to analyze the inner structure of the
damage (worse than with mCT), the laser-induced US
is strongly dissipated over the entire area of the damage
on the other hand. This shows that laser-induced US is
a good indicator for the presence of the damage in the
frequency range considered in this work.PAUT is an elemental and accurate method and is a
good alternative for thicker and larger parts that have a
testing surface smooth enough to assure good coupling.
It is especially advantageous for parts that require
single-sided inspection. However, contact US inspec-
tion is more challenging to be automated.OLT is a suitable solution for near-surface damage
inspection of materials that are not thermally sensitive.
Larger areas can be investigated integrally without an
extensive scanning arrangement.TAE offer a potential to increase the time resolution
of a scan due to the short pulses that they are capable
of emitting. Next to the laser-induced ultrasound, these
offer a possibility for single-sided ACU inspection and
better depth resolution.If the detailed three-dimensional structure of the
defect is to be studied, mCT still does not have a per-
suasive alternative. It is suitable for detection of density
changes, inclusions, voids, open cracks and for the
determination of the fiber orientation. However, a
compromise between resolution and scanned range
should be made while being subjected to the following
limitations. First, the scanned volume in mCT has to be
rotated in the field of view of the imaging device, which
makes large, but thin objects difficult to inspect.
Furthermore, scan time is a limiting factor and makes
high-volume quality control of even small parts quite
challenging. The data handling as well as the recon-
struction and automated evaluation requires special-
ized hardware and software solutions and increases
the efforts immensely. Therefore, mCT is most effective
in research and development or process control, where
a detailed understanding of the material structure and
properties is required. However, mCT data might help
for model building, simulation and validation of results
and for conclusions drawn from other methods. mCTcan be of high value, especially when microscopic prop-
erties have to be correlated to macroscopic material
performance or physical interactions at the micron-
scale are studied, which are exploited in other inspec-
tion methods.For flat, large objects, X-ray CT variants such as
tomosynthesis/laminography can be considered if
only the meridian cracks are to be detected. Thus,
the scan time can be significantly reduced compared
to mCT.The porosity and presence of microcracks can be
detected specifically by X-ray dark-field radiography
without object rotation, much lower system resolution
and higher speed. It might have advantages over US
when impact damages in more complex sample geom-
etries have to be inspected. Additionally, dark-field
projections from different orientations can deliver
additional information about the orientation of the
microcracks and the fiber structure.12
In contrast to mCT, US inspection methods are able
to directly detect the mechanical properties of the dam-
aged area, since they significantly affect the mechanical
wave propagation (US damping, reflection, scattering,
etc.). It is therefore possible to selectively detect fea-
tures that are crucial for the specimens’ macroscopic
mechanical properties (delaminations, closed and
open cracks, etc.).For further improvement of the inspection process,
there is a potential advantage in combining different
test methods. For example, the mCT data can be
fused with US inspection data. Additional information
Rus et al. 11

could consequently be obtained, which is not achiev-able if both methods are considered separately.
For example, exact in-depth location and size of theclosed cracks can only be obtained by comparingFigure 4(d) with Figure 2(i), (j) or (k). mCT data sug-gest that the detached layers at 0.6-mm depth from theback side of the plate extends over the entire damagesurface, the value of which can more precisely be deter-mined by US inspection. Complementary use of thesetwo methods is advantageous for plate inspection, sincemedial cracks can be better detected by X-ray radiog-raphy and lateral cracks by US methods. Furthermore,the approximate location of the damaged area can bemore efficiently determined by US for larger testingobjects. The detailed structure of the damage can besubsequently analyzed by the focused application ofmore rigorous X-ray radiography methods.
Declaration of conflicting interests
The author(s) declared no potential conflicts of interest with
respect to the research, authorship, and/or publication of this
article.
Funding
The author(s) disclosed receipt of the following financial sup-
port for the research, authorship, and/or publication of this
article: The authors acknowledge the German Federal
Ministry of Education and Research for financial support.
ORCID iD
Janez Rus https://orcid.org/0000-0002-2287-1531
References
1. Grosse CU, Goldammer M, Grager JC, et al.
Comparison of NDT techniques to evaluate CFRC –
results obtained in a MAIzfp round robin test. In:
Tagungsband WCNDT, Munich, Germany, 2016.2. Ehrlich I, Dinnebier H and Jost C. Comparison of impact
delaminations in CFRP using different test methods.
J Achieve Mater Manuf Eng 2015; 73: 128–138.3. Maierhofer C, Krankenhagen R, R€ollig M, et al.
Quantification of impact damages in CFRP and GFRP
structures with thermography and ultrasonics. Proc
QIRT 2018; 933–940.4. Abou-Khousa MA, Ryley A, Kharkovsky S, et al.
Comparison of X-ray, millimeter wave, shearography
and through-transmission ultrasonic methods for inspec-
tion of honeycomb composites. AIP Conf Proc 2007; 894:
999–1006.5. Wang J, Zhang J, Chang T, et al. A comparative study of
non-destructive evaluation of glass fiber reinforced poly-
mer composites using terahertz, X-ray, and ultrasound
imaging. Int J Precis Eng Manuf 2019; 20: 963–972.6. Schumacher D, Meyendorf N, Hakim I, et al. Defect
recognition in CFRP components using various NDT
methods within a smart manufacturing process. AIP
Conf Proc 2018; 1949: 020024.7. Hakim I, May D, Abo Ras M, et al. Quantifying voids
effecting delamination in carbon/epoxy composites: static
and fatigue fracture behavior. Proc SPIE 9806, Smart
Materials and Nondestructive Evaluation for Energy
Systems 2016: 98060H. DOI: 10.1117/12.2222032.8. Papa I, Ricciardi MR, Antonucci V, et al. Comparison
between different non-destructive techniques methods to
detect and characterize impact damage on composite
laminates. J Compos Mater 2020; 54: 617–631.9. Grager JC, Kotschate D, Gamper J, et al. Advances in
air-coupled ultrasonic testing combining an optical
microphone with novel transmitter concepts. In: 12th
ECNDT, Gothenburg, Schweden, 2018.10. Pfeiffer F, Bech M, Bunk O, et al. Hard-X-ray dark-field
imaging using a grating interferometer. Nat Mater 2008;
7: 134–137.11. Senck S, Scheerer M, Revol V, et al. Microcrack charac-
terization in loaded CFRP laminates using quantitative
two- and three-dimensional X-ray dark-field imaging.
Compos A Appl Sci Manuf 2018; 115: 206–214.12. Prade F, Schaff F, Senck S, et al. Nondestructive char-
acterization of fiber orientation in short fiber reinforced
polymer composites with X-ray vector radiography. NDT
& E Int 2017; 86: 65–72.13. Kageyama M, Okajima K, Maesawa M, et al. X-ray
phase-imaging scanner with tiled bent gratings for
large-field-of-view nondestructive testing. NDT & E Int
2019; 105: 19–24.14. Meyendorf N, Nagy PB and Rokhlin S. Nondestructive
materials characterization with applications to aerospace
materials. Berlin, Heidelberg: Springer-Verlag, 2004,
p.67.15. Ida N and Meyendorf N. Handbook of advanced nonde-
structive evaluation. Cham: Springer, 2019.16. Grager JC. Quantitative impact- und
Porosit€atscharakterisierung an CFK-Werkstoffen mittels
zerst€orungsfreier Prufmethoden. Master’s Thesis, Chair
of Non-Destructive Testing, Technical University of
Munich, Germany, 2014.17. Rus J, Kulla D, Grager JC, et al. Air-coupled ultrasonic
inspection of fiber-reinforced plates using an optical
microphone. In: DAGA Deutsche Jahrestagung fur
Akustik (2019), Rostock, Germany, 2019, pp.763–766.
Deutsche Gesellschaft fur Akustik.18. L�opez Baos A. Laser-based air-coupled ultrasonic testing
of CFRP plates. Master’s thesis, Chair of Non-
Destructive Testing, Technical University of Munich,
Germany, 2018.19. Guruschkin E. Beruhrungslose Prufung von
Faserverbundwerkstoffen mit Luftultraschall. Master’s
Thesis, Chair of Non-Destructive Testing, Technical
University of Munich, Germany, 2015.20. Gamper J. Entwicklung eines neuen Messkonzepts
zur luftgekoppelten Ultraschallprufung von
Faserverbundwerkstoffen. Master’s Thesis, Chair of
Non-Destructive Testing, Technical University of
Munich, Germany, 2017.
12 Journal of Composite Materials 0(0)

21. Fischer B. Optical microphone hears ultrasound. Nature
Photon 2016; 10: 356–358.22. Preisser S, Rohringer W, Liu M, et al. All-optical highly
sensitive akinetic sensor for ultrasound detection andphotoacoustic imaging. Biomed Opt Express 2016; 7:4171–4186.
23. Gaal M, Caldeira R, Bartusch J, et al. Air-coupled ultra-sonic ferroelectret receiver with additional bias voltage.IEEE Trans Ultrason Ferroelectr Freq Control 2019; 66:1600–1605.
24. V€ossing KJ, Gaal M and Niederleithinger E. Air-coupledferroelectret ultrasonic transducers for nondestructivetesting of wood-based materials. Wood Sci Technol
2018; 52: 1527–1538.25. Gaal M, Bartusch J, Dohse E, et al. Focusing of ferroe-
lectret air-coupled ultrasound transducers. AIP Conf
Proc 2016; 1706: 080001.26. Lange PD and John WS. On thermophones. Proc R Soc
A: Math Phys Eng Sci 1915; 91: 239–241.
27. Daschewski M, Boehm R, Prager J, et al. Physics ofthermo-acoustic sound generation. J Appl Phys 2013;114: 114903.
28. Rus J, Fischer B and Grosse CU. Photoacoustic inspec-tion of CFRP using an optical microphone. Proc SPIE,
Optical Measurement Systems for Industrial Inspection XI
2019: 1105622. DOI: 10.1117/12.2525021.29. Rus J and Grosse CU. Local ultrasonic resonance spec-
troscopy: a demonstration on plate inspection.J Nondestruct Eval 2020; 39: 31.
30. Setz R. Experimentelle Impakt-, Ondulations- und
Porosit€atscharakterisierung an CFK-Probek€orpern mittels
zerst€orungsfreier Prufmethoden. Master’s Thesis, Chair ofNon-Destructive Testing, Technical University ofMunich, Germany, 2015.
31. Hettler J, Tabatabaeipour M, Delrue S, et al. Detectionand characterization of local defect resonances arisingfrom delaminations and flat bottom holes.J Nondestruct Eval 2017; 36: 2.
Rus et al. 13