qualiphy broadr-reach manual
TRANSCRIPT

QPHY-BroadR-Reach BroadR-Reach Serial Data
Operator’s Manual
Revision B – November, 2013 Relating to the Following Release Versions:
• Software Version Rev. 7.3
• BroadR-Reach Script Rev. 7.3
• Style Sheet Rev. 1.2.

700 Chestnut Ridge Road Chestnut Ridge, NY, 10977-6499 Tel: (845) 425-2000, Fax: (845) 578 5985 teledynelecroy.com
© 2013 by Teledyne LeCroy. All rights reserved.
Teledyne LeCroy and other product or brand names are trademarks or requested trademarks of their respective holders. Information in this publication supersedes all earlier versions. Specifications are subject to change without notice.
922533 Rev B November 2013

QPHY-BroadR-Reach Software Option
TABLE OF CONTENTS
INTRODUCTION TO QUALIPHY BROADR-REACH ..................................................... 5 Required Equipment ..................................................................................................................................... 5
USING QUALIPHY BROADR-REACH ........................................................................... 6
QUALIPHY COMPLIANCE TEST PLATFORM .............................................................. 7 Oscilloscope Option Key Installation ............................................................................................................. 9 Typical (Recommended) Configuration ......................................................................................................... 9 Remote (Network) Configuration .................................................................................................................. 9 Oscilloscope Selection .................................................................................................................................. 9 Accessing the QPHY-BroadR-Reach Software using QualiPHY ................................................................ 10 Customizing QualiPHY ................................................................................................................................ 12 Creating Custom Configurations ................................................................................................................. 13 QPHY-BroadR-Reach Operation ................................................................................................................ 15
BROADR-REACH MEASUREMENT PREPARATION ................................................. 16 Required Test Modes .................................................................................................................................. 16 Physical Setup ............................................................................................................................................ 16
QPHY-BROADR-REACH TEST CONFIGURATIONS .................................................. 17
QPHY-BROADR-REACH VARIABLES ........................................................................ 18
QPHY-BROADR-REACH LIMIT SETS ......................................................................... 19
QPHY-BROADR-REACH TEST DESCRIPTIONS ....................................................... 20 Test 1 - Transmitter Output Droop ....................................................................................................... 20 Test 2 - Transmitter Jitter (Master) and Transmit Clock Frequency .................................................... 22 Test 3- Transmitter Jitter (Slave) and Transmit Clock Frequency ....................................................... 24 Test 4 - Transmitter Distortion Test ..................................................................................................... 26 Test 5 - Transmitter Power Spectral Density (PSD) ............................................................................ 30
922533 Rev B 3

TABLE OF FIGURES Figure 1 - Report menu in QualiPHY General Setup................................................................................ 7 Figure 2 - The Test Report includes a summary table with links to the detailed test results ............. 8 Figure 3 - QualiPHY main menu and compliance test Standard selection menu ............................... 10 Figure 4 - QualiPHY configuration selection menu. .............................................................................. 11 Figure 5 - QualiPHY test item selection menu ....................................................................................... 12 Figure 6 - Variable Setup and Limits Manager windows ....................................................................... 14 Figure 7 - Start button ............................................................................................................................... 15 Figure 8 - Example of pop-up connection diagram and dialog box .................................................... 15 Figure 9 - Example of RJ45/UTP adapter ................................................................................................ 16 Figure 10 - Example of Custom SMA Breakout fixture .......................................................................... 17 Figure 11 – Definition of Droop Measurement ....................................................................................... 20 Figure 12 – Transmitter Output Droop .................................................................................................... 21 Figure 13 – Transmitter Output Droop Test Results .............................................................................. 21 Figure 14 – Transmitter Jitter (Master) and Transmit Clock Frequency .............................................. 23 Figure 15 – Transmitter Jitter (Master) and Transmit Clock Frequency Test Results ........................ 23 Figure 16 – Transmitter Jitter (Slave) and Transmit Clock Frequency Setup ..................................... 24 Figure 17 – Transmitter Jitter (Slave) and Transmit Clock Frequency ................................................ 25 Figure 18 – Transmitter Jitter (Slave) and Transmit Clock Frequency Test Results .......................... 25 Figure 19 – Connection Diagram for Transmitter Distortion Test using TF-ENET-B ......................... 26 Figure 20 – Disturbing Sine Wave Characteristics ................................................................................ 27 Figure 21 – Transmitter Distortion Test Setup ....................................................................................... 27 Figure 20 – Transmitter Distortion .......................................................................................................... 28 Figure 19 – Transmitter Distortion Test Results .................................................................................... 29 Figure 20 – Transmitter Power Spectral Density (PSD) ........................................................................ 31 Figure 21 – Transmitter Power Spectral Density (PSD) Test Results .................................................. 31
4 922533 Rev B

QPHY-BroadR-Reach Software Option
INTRODUCTION TO QUALIPHY BROADR-REACH QPHY-BroadR-Reach is an automated test package performing all of the normative real time oscilloscope tests for sources in accordance with the BroadR-Reach Physical Layer Transceiver Specification For Automotive Applications, v.2.0.
The software can be run on any Teledyne LeCroy Zi and Xi Series oscilloscope with at least 1 GHz bandwidth and a sample rate of at least 10GS/s (WaveRunner series and up). The oscilloscope must also be equipped with QPHY-BroadR-Reach and either the JTA2 (standard on all Zi series oscilloscopes), SDAII, or SDAIII options. Required Equipment
• Real time Teledyne LeCroy Oscilloscope meeting the above requirements (at least 1 GHz bandwidth, and sample rate of at least 10GS/s)
o All LabMaster 9 Zi-A oscilloscopes
o All SDA/DDA/WaveMaster 8 Zi-A oscilloscopes
o SDA/DDA/WavePro 725Zi-A and higher bandwidth oscilloscopes
o WaveRunner 610 Zi and higher bandwidth oscilloscopes
o WaveRunner 104 MXi-A /Xi-A Series and higher bandwidth oscilloscopes
Note: If a WaveRunner Xi oscilloscope is being used, the XWEB option is additionally required.
• QPHY-BroadR-Reach and either the JTA2, SDAII, or SDAIII options
Note: SDA software is included on all SDA and DDA oscilloscope models. JTA2 is standard on all Zi series oscilloscopes.
• MATLAB Runtime Component 7.7 is required to run the MATLAB script for the distortion test
o Available for download from Teledyne LeCroy website
• A pair of SMA cables of equal length. Depending upon the oscilloscope model SMA/BNC adapters may also be required.
Note: A Teledyne LeCroy ZD1000 Differential Probe or greater can alternatively be used
• AWG for Distortion Test - Teledyne LeCroy WaveStation 2022 or equivalent AWG
• Test Fixture - Teledyne LeCroy recommends the use of the TF-ENET-B (Ethernet test fixture)
with QPHY-BroadR-Reach if an RJ45 connection is available. Equivalent test fixtures may also be used.
Note: The TF-ENET-B requires a RJ45 input. Due to the variety of different potential connectors on the UTP (Unshielded Twisted Pair) cable, the operator will be responsible for providing a method to connect the UTP cable to the RJ45 input on the TF-ENET-B. Alternatively, a custom SMA breakout fixture can be used. See Physical Setup for more information.
922533 Rev B 5

USING QUALIPHY BROADR-REACH QualiPHY BroadR-Reach guides the user, step-by-step, through each of the tests described in the BroadR-Reach specification: BroadR-Reach Physical Layer Transceiver Specification For Automotive Applications, v.2.0. To do this, the user must set up a test session.
Before beginning testing, users choose the test configuration they wish to run. There are two pre-loaded test configurations. They are:
• Demo
• Run Live with pauses, single ended inputs on row A
These pre-loaded configurations provide quick and easy ways to begin compliance testing (see the QPHY-BroadR-Reach Test Configurations section for details on each configuration). If the user does not want to run any of these configurations, they can create their own custom configuration (see the Creating Custom Configurations section for details).
The pre-loaded configurations are set up to run all of the tests required for compliance. If this is not what the user wants, the variables can be modified (see the QPHY-BroadR-Reach Variables section of this manual). The variables are pre-loaded with the standard settings for compliance testing; however, the user may choose to create their own configuration with the variables set as desired.
6 922533 Rev B

QPHY-BroadR-Reach Software Option
QUALIPHY COMPLIANCE TEST PLATFORM QualiPHY is Teledyne LeCroy’s compliance test framework which leads the user through the compliance tests. QualiPHY displays connection diagrams to ensure tests run properly, automates the oscilloscope setup, and generates complete, detailed reports. The QualiPHY software application automates the test and report generation.
Figure 1 - Report menu in QualiPHY General Setup
922533 Rev B 7

See the QualiPHY Operator’s Manual for more information on how to use the QualiPHY framework.
Figure 2 - The Test Report includes a summary table with links to the detailed test results
8 922533 Rev B

QPHY-BroadR-Reach Software Option
Oscilloscope Option Key Installation The required option keys must be purchased to enable the QPHY-BroadR-Reach compliance tests. Call Teledyne LeCroy Customer Support to place an order and receive the codes.
1. ... Enter the key and enable the purchased option as follows: 2. ... From the oscilloscope menu select Utilities Utilities Setup... 3. ... Select the Options tab and click the Add Key button. 4. ... Enter the Key Code(s) using the on-screen keyboard. 5. ... Restart the oscilloscope to activate the options after installation.
Typical (Recommended) Configuration QualiPHY software can be executed from the oscilloscope or a host computer. The first step is to install QualiPHY. Please refer to the QualiPHY Operator’s Manual for installation instructions.
Teledyne LeCroy recommends running QualiPHY on an oscilloscope equipped with Dual Monitor Display capability (Option DMD-1 for oscilloscopes where this is not standard). This allows the waveform and measurements to be shown on the oscilloscope LCD display while the QualiPHY application and test results are displayed on a second monitor.
By default, the oscilloscope appears as a local host when QualiPHY is executed in the oscilloscope. Follow the steps under Oscilloscope Selection (as follows) and check that the IP address is 127.0.0.1.
Remote (Network) Configuration It is also possible to install and run QualiPHY on a host computer, controlling the oscilloscope with a Network/LAN Connection.
The oscilloscope must already be configured, and an IP address (fixed or network-assigned) must already be established.
Oscilloscope Selection Set up the oscilloscope using QualiPHY over a LAN (Local Area Network) by doing the following:
1. ... Make sure the host computer is connected to the same LAN as the oscilloscope. If unsure, contact your system administrator.
2. ... From the oscilloscope menu, select Utilities Utilities Setup... 3. ... Select the Remote tab. 4. ... Verify the oscilloscope has an IP address and the control is set to TCP/IP. 5. ... Run QualiPHY in the host computer and click the General Setup button. 6. ... Select the Connection tab. 7. ... Enter the IP address from step 4 (previous). 8. ... Click the Close button.
QualiPHY is now ready to control the oscilloscope.
QualiPHY tests the oscilloscope connection after clicking the Start button. The system prompts you if there is a connection problem. QualiPHY’s Scope Selector function can also be used to verify the connection. Please refer to the QualiPHY Operator’s Manual for explanations on how to use Scope Selector and other QualiPHY functions.
922533 Rev B 9

Accessing the QPHY-BroadR-Reach Software using QualiPHY This topic provides a basic overview of QualiPHY’s capabilities. Please refer to the QualiPHY Operator’s Manual for detailed information.
Access the QPHY-BroadR-Reach software using the following steps:
1. Wait for the oscilloscope to start and have its main application running.
2. Launch QualiPHY from the Analysis menu if installed on the oscilloscope or from the desktop icon if installed on a host computer.
3. From the QualiPHY main window (as follows), select Standard, then BroadR-Reach from the pop-up menu (if not already selected). If you check the Pause on Failure box (circled) QualiPHY prompts to retry the measure whenever a test fails.
Figure 3 - QualiPHY main menu and compliance test Standard selection menu
continued
10 922533 Rev B

QPHY-BroadR-Reach Software Option
4. Click the Configuration button in the QualiPHY main menu:
5. Select a configuration from the pop-up menu:
Figure 4 - QualiPHY configuration selection menu.
6. Click Start.
7. Follow the pop-up window prompts.
922533 Rev B 11

Customizing QualiPHY The predefined configurations in the Configuration screen cannot be modified. However, you can create your own test configurations by copying one of the standard test configurations and making modifications. A description of the test is also shown in the description field when selected.
Figure 5 - QualiPHY test item selection menu
12 922533 Rev B
QPHY-BroadR-Reach Software Option
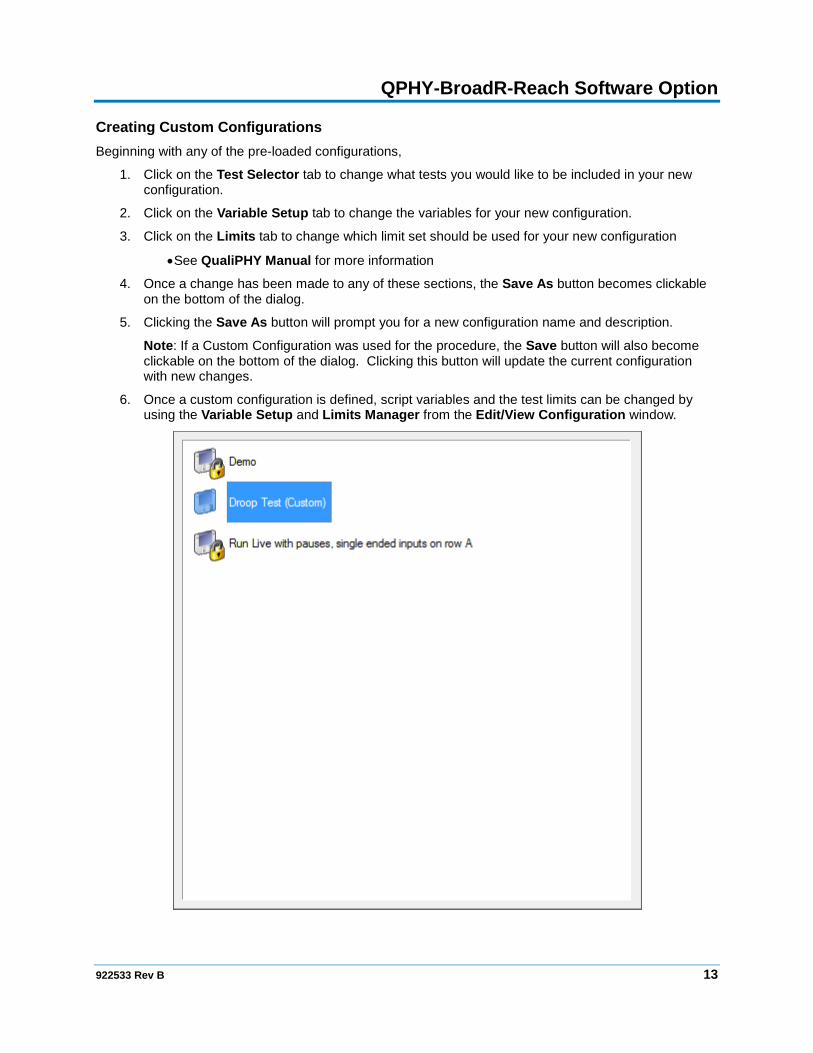
Creating Custom Configurations Beginning with any of the pre-loaded configurations,
1. Click on the Test Selector tab to change what tests you would like to be included in your new configuration.
2. Click on the Variable Setup tab to change the variables for your new configuration.
3. Click on the Limits tab to change which limit set should be used for your new configuration
• See QualiPHY Manual for more information
4. Once a change has been made to any of these sections, the Save As button becomes clickable on the bottom of the dialog.
5. Clicking the Save As button will prompt you for a new configuration name and description.
Note: If a Custom Configuration was used for the procedure, the Save button will also become clickable on the bottom of the dialog. Clicking this button will update the current configuration with new changes.
6. Once a custom configuration is defined, script variables and the test limits can be changed by using the Variable Setup and Limits Manager from the Edit/View Configuration window.
922533 Rev B 13

Figure 6 - Variable Setup and Limits Manager windows
14 922533 Rev B

QPHY-BroadR-Reach Software Option
QPHY-BroadR-Reach Operation After pressing Start in the QualiPHY menu, the software instructs how to set up the test using pop-up connection diagrams and dialog boxes.
Figure 7 - Start button
Figure 8 - Example of pop-up connection diagram and dialog box
922533 Rev B 15

BROADR-REACH MEASUREMENT PREPARATION Before beginning any test or data acquisition, the oscilloscope should be warmed for at least 20 minutes. Calibration is automatic under software control and no manual calibration is required. This procedure will be run again if the temperature of the oscilloscope changes by more than a few degrees.
Required Test Modes The QPHY-BroadR-Reach script requires the operator to place the DUT (Device Under Test) in the required test modes. The script will prompt the user to do so before each specific test but it is recommended that the operator ensures the DUT is capable of being placed in the required test modes before beginning testing.
Physical Setup If the operator is using the TF-ENET-B the following steps shall be completed for proper setup:
1. If the oscilloscope has BNC inputs, BNC/SMA adapters will need to be connected to Channels 2 and 3.
2. Place the TF-ENET-B board in front of or next to the oscilloscope. Ensure that it is close enough that the SMA cables will reach.
3. Connect the 2 SMA cables on one end to the CH4 section of the TF board. They will connect to the J33 and J54 outputs.
4. Connect the other end of each cable to Channel 2 and 3. The positive end should be connected to Channel 2 and the negative end should be connected to Channel 3.
5. Connect the RJ45 end of the UTP/RJ45 adapter (an example of such adapter is shown below) to the J64 input on the Channel 4 section of the TF board.
Figure 9 - Example of RJ45/UTP adapter
16 922533 Rev B

QPHY-BroadR-Reach Software Option
Due to the variety of different potential connectors on the UTP cable, the operator may choose to create a SMA Breakout fixture which will mate with their connector.
Figure 10 - Example of Custom SMA Breakout fixture
QPHY-BROADR-REACH TEST CONFIGURATIONS Test configurations include variable settings, limit sets, and test selections. See the QPHY-BroadR-Reach Variables section for a description of each variable value and its respective default value. See the QPHY-BroadR-Reach Test Limits for more information about the default test limits.
Demo This configuration will run all of tests using saved waveforms. However, the script will prompt the user as if the script was using live waveforms but the operator shall just press OK to continue with the demo. This configuration will pause after each test to give the operator a chance to review the results. This configuration will not save waveforms used during the test.
Run Live with pauses, single ended inputs on Row A This configuration will acquire live data using single ended inputs and will pause after each test. The waveforms will be saved to the directory defined in the SaveWaveformPath variable.
922533 Rev B 17

QPHY-BROADR-REACH VARIABLES Acquire Live Data If this is set “True”, the script will perform an acquisition after setting the horizontal scale. You can set this “False” if the waveform(s) being tested are in Memories or will be recalled into Memories.
Demo Mode If this is set “On” then: “AcquireLiveData” is overridden as if it was set “False”, “SignalIsDifferential” is overridden as if it was set “True”, “DifferentialSignalSource” is overridden as if it was set to “M1” and the appropriate waveforms will be automatically recalled into M1 as needed.
Differential Signal Source This will specify the signal source when "SignalIsDifferential" is set to “True”. This is the difference between the single ended signals of the differential pair. Potential inputs include all of the channels, all of the memories and the first four Math functions. Input Row
Specifies the input row for oscilloscopes with multiple input rows. Input Row A (upper) is default.
Measured Symbol Rate Specifies the symbol rate to use in the distortion test. If test mode 2 is run this value is replaced by the precise measured symbol rate. If you do not plan to run Test Mode 2 then please set this variable to a precisely measured symbol rate from your signal.
Save Waveform Path
The test waveforms will be saved to this path (if “Save Waveforms” is set to yes). The directory will be the DUT name entered at the beginning of the test.
Save Waveforms
Specifies whether waveforms will be stored into a subdirectory of the Save Waveform Path.
Signal Is Differential
Specifies whether the input signal is differential. If set to false the oscilloscope will calculate the difference between Signal Source P and Signal Source N to serve as the differential signal.
Signal Source N
Specifies the negative side of a pair of singled ended signals. The default is Channel 3.
Signal Source P
Specifies the positive side of a pair of singled ended signals. The default is Channel 2.
Stop On Test
Specifies if the user would like to stop and view the results after each time the results are saved. This gives the user a chance to acquire new data or adjust the settings before proceeding with the test.
Test Mode 4 – Distortion – Disturber The BroadR-Reach spec requires a disturbing sine wave, Vd, to be applied to the test fixture during the distortion test. This variable enables the distortion test to be performed with or without the disturbing sine wave applied to the test fixture. The default is Yes.
18 922533 Rev B

QPHY-BroadR-Reach Software Option
QPHY-BROADR-REACH LIMIT SETS The limits in use by QPHY-BroadR-Reach are specified in the BroadR-Reach Physical Layer Transceiver Specification For Automotive Applications, v.2.0.
922533 Rev B 19

QPHY-BROADR-REACH TEST DESCRIPTIONS For additional information about the tests supported by QPHY-BroadR-Reach please refer to the BroadR-Reach Physical Layer Transceiver Specification For Automotive Applications, v.2.0. The descriptions in the following tests will refer to various sections of this document. Test 1 - Transmitter Output Droop
This test measures the transmitter output droop as specified in Section 5.4.1. This test requires that the DUT be placed in test mode 1.
What is Measured:
The magnitude of both the positive and negative droop is measured with respect to the initial peak value after the zero crossing and the value 500 ns after the initial peak. A passing droop value must be less than 26.9%.
Figure 11 – Definition of Droop Measurement
Test Methodology:
The oscilloscope is set to the maximum sample rate, 200 ns/div, and to trigger on a negative edge. The acquired signal has two bits of enhanced resolution (ERES) applied to it in order to limit the bandwidth of the oscilloscope to a value which is suitable for this measurement. The initial peak is measured on both the +1 (Vpk+) and -1 (Vpk-) symbols. The initial peak is determined by measuring the maximum or minimum value on a gated portion of the waveform. The droop value is measured 500 ns from the initial peak on both the +1 (Vdrooped+) and -1 (Vdrooped-) symbols. The droop for each symbol is calculated by 100 x (Vdrooped/Vpk). The calculated droop values are then compared to 26.9% using pass/fail testing.
20 922533 Rev B

QPHY-BroadR-Reach Software Option
Figure 12 – Transmitter Output Droop
Shown on this screen:
• F1 is the input differential signal which the measurements will be performed on
In the measurement section:
• T1 is the zero crossing time of the positive edge and t2 is the zero crossing time of the negative edge.
• Vpk+ is the maximum value of input signal and Vpk- is the minimum value of input signal.
• Vdrooped+ is the value 500 ns after the maximum value and Vdrooped- is the value 500 ns after the minimum value.
• Droop+ is the droop calculated on the +1 symbol and Droop- is the droop calculated on the -1 symbol.
• Q7 compares Droop+ to 26.9% and Q8 compares the Droop- to 26.9%.
Figure 13 – Transmitter Output Droop Test Results
922533 Rev B 21

Test 2 - Transmitter Jitter (Master) and Transmit Clock Frequency
This test measures the MDI output jitter, JTXOUT, as specified in Section 5.4.3 and the transmit clock frequency as specified in Section 5.4.5. This test requires that the DUT be placed in test mode 2.
What is Measured:
The oscilloscope captures a 1 ms acquisition at 10 GS/s relative to an unjittered reference resulting in 10 Mpts. By sampling in this manner, very low frequency components are filtered out. The RMS of JTXOUT is then calculated and compared to 50 ps. Using the same acquired signal the symbol rate is also measured. Additionally, the rise and fall times are calculated for informational purposes.
Test Methodology:
The oscilloscope is set to acquire 10 Mpts at 10 GS/s. The acquired signal has two bits of enhanced resolution (ERES) applied to it in order to limit the bandwidth of the oscilloscope to a value which is suitable for this measurement. The RMS value of the jitter track for the acquired signal is calculated. The calculated value is then compared to 50 ps using pass/fail testing. The bit rate (half of the symbol rate) of the acquired signal is also measured and the compared to 33.3 MHz +/- 100 ppm using pass/fail testing. Lastly, the 10%-90% rise and fall times are calculated for information purposes.
22 922533 Rev B

QPHY-BroadR-Reach Software Option
Figure 14 – Transmitter Jitter (Master) and Transmit Clock Frequency
Shown on this screen:
• F1 is the input differential signal which the measurements will be performed on
• F2 is a TIE-track of input signal.
In the measurement section:
• P1 is a RMS of the jitter track.
• P2 is the rise time (10%-90%) of input signal and P3 is the fall time (10%-90%) of input signal.
• P4 is the bitrate (half the symbol rate) of input signal.
• Q2 is compares the RMS value of the jitter track to 50 ps.
• Q5 compares the bitrate to 33.3 MHz +/- 3.33 mHZ (100 ppm)
Figure 15 – Transmitter Jitter (Master) and Transmit Clock Frequency Test Results
922533 Rev B 23

Test 3- Transmitter Jitter (Slave) and Transmit Clock Frequency
This test measures slave jitter, TX_TCLK, as specified in Section 5.4.3 and the transmit clock frequency as specified in Section 5.4.5. This test requires that the Slave is receiving valid signals from a compliant PHY operating as the Master and is configured as shown below. This test requires the DUT to be placed in test mode 3.
Figure 16 – Transmitter Jitter (Slave) and Transmit Clock Frequency Setup
What is Measured:
The oscilloscope captures a 1 ms acquisition at 10 GS/s relative to an unjittered reference resulting in 10 Mpts. By sampling in this manner, very low frequency components are filtered out. The RMS of TX_TCLK is then calculated and should be less than 0.01 UI. Using the same acquired signal the symbol rate is also measured. Additionally, the rise and fall times are calculated for informational purposes.
Test Methodology:
The oscilloscope is set to acquire 10 Mpts at 10 GS/s. The acquired signal has two bits of enhanced resolution (ERES) applied to it in order to limit the bandwidth of the oscilloscope to a value which is suitable for this measurement. The RMS value of the jitter track for the acquired signal is calculated. The calculated value is then compared to 0.01 UI using pass/fail testing. The bit rate (half of the symbol rate) of the acquired signal is also measured and the compared to 33.3 MHz +/- 50 ppm using pass/fail testing. Lastly, the 10%-90% rise and fall times are calculated for information purposes.
24 922533 Rev B

QPHY-BroadR-Reach Software Option
Figure 17 – Transmitter Jitter (Slave) and Transmit Clock Frequency
Shown on this screen:
• F1 is the input differential signal which the measurements will be performed on
• F2 is a TIE-track of input signal.
In the measurement section:
• P1 is a RMS of the jitter track.
• P2 is the rise time (10%-90%) of input signal and P3 is the fall time (10%-90%) of input signal.
• P4 is the bitrate (half the symbol rate) of input signal.
• Q2 is compares the RMS value of the jitter track to 150 ps.
• Q5 compares the bitrate to 33.3 MHz +/- 3.33 mHZ (100 ppm)
Figure 18 – Transmitter Jitter (Slave) and Transmit Clock Frequency Test Results
922533 Rev B 25

Test 4 - Transmitter Distortion Test
This test measures the peak distortion of the transmitter and checks to see if it is within the specified limits described in Section 5.4.2. The DUT is required to be placed in test mode 4 for this test.
What is Measured:
The oscilloscope captures ten records with one sample per UI, at ten equally spaced starting phases. The acquired waveform is then saved and processed by the MATLAB distortion script provided in the specification.
Disturbing Sine Wave Setup:
This test can be run with or without a disturbing sine wave as defined by the Test Mode 4 – Distortion – Disturber variable on the Variable Setup tab. If a disturbing sine wave is used the connection diagram will prompt you to use the 1000Base-T Template Test section of the TF-ENET-B. This section of the test fixture allows the DUT to be subjected to the disturbing sine wave, but allows very little of the disturbing sine wave to reach the oscilloscope.
Figure 19 – Connection Diagram for Transmitter Distortion Test using TF-ENET-B
26 922533 Rev B

QPHY-BroadR-Reach Software Option
The disturbing sine wave shall be applied with the following characteristics.
Figure 20 – Disturbing Sine Wave Characteristics
Test Methodology:
The oscilloscope is set to acquire a 500 kS at 10 GS/s. The acquired signal has one and a half bits of enhanced resolution (ERES) applied to it in order to limit the bandwidth of the oscilloscope to a value which is suitable for this measurement. Ten records are taken, saved to file, and then passed through the MATLAB script from the specification. The MATLAB script removes the disturbing sine wave and measures peak distortion at equally spaced phases of the symbol period. To pass, the MATLAB script must measure less than 15mV distortion for all 10 records.
In order to properly line up the samples it is important that the exact symbol rate is used. If Test Mode 2 was run during this session the measured symbol rate can be used, otherwise it can be entered as a variable. It is important that the oscilloscope, DUT, and disturbing sine wave source are all frequency locked to the transmitter reference clock.
Figure 21 – Transmitter Distortion Test Setup
922533 Rev B 27

Figure 22 – Transmitter Distortion
Shown on this screen:
• F2 is the input differential signal which the measurements will be performed on
In the measurement section:
• P1 is recording the passing number of measured distortion values
• P2 is recording the number of measured distortion values
• P3 is displaying the last measured distortion value returned from the MATLAB script
• P4 is displaying the percentage of measured distortion values which have passed
• Q4 compares the percentage of passing values to 100%
28 922533 Rev B

QPHY-BroadR-Reach Software Option
Figure 23 – Transmitter Distortion Test Results
If the values are being properly returned from the MATLAB script then you will see the values displayed in the main QualiPHY menu in real time.
If the MATLAB script is not properly returning values you will see “NoneV” listed as the distortion test result. In this scenario verify that the Matlab Runtime Component 7.7 is properly installed.
922533 Rev B 29

Test 5 - Transmitter Power Spectral Density (PSD)
This test calculates the PSD of the transmitter and checks to see if it is outside of the specified mask described in Section 5.4.4. This test will also measure the maximum PSD value for informational purposes. The DUT is required to be placed in test mode 5 for this test.
What is Measured:
A FFT of the acquired signal is calculated and then averaged using a boxcar filter. The FFT is then tested against the provided mask in Figure 5.5 of Section 5.4.4.
Test Methodology:
The oscilloscope is set to acquire 1 Mpts at 10 GS/s. The PSD is calculated by performing a FFT on the acquired signal. A boxcar filter of length 60 is applied to the FFT. A pass/fail mask test is then performed using the PSD and the specified mask. A passing result indicates that the entire PSD is contained within the mask. P1 measures the maximum of the FFT for informational purposes. The test will run until a passing result is measured or 300 sweeps have been performed.
30 922533 Rev B

QPHY-BroadR-Reach Software Option
Figure 24 – Transmitter Power Spectral Density (PSD)
Shown on this screen:
• F2 is a Power Spectrum of the input signal with a Boxcar filter applied to it
In the measurement section:
• P1 is the maximum value of the Power Spectrum
• Q1 checks to see if the Power Spectrum is contained by the mask
Figure 25 – Transmitter Power Spectral Density (PSD) Test Results
Thank you for reading the QPHY-BroadR-Reach Operator’s Manual. If you have any further questions please contact your local Teledyne LeCroy representative for assistance.
922533 Rev B 31

