qualcomm incorporated · qwbs, qualcomm cdma technologies, qct, qualcomm technology licensing, qtl,...
TRANSCRIPT

Table of Contents
UNITED STATESSECURITIES AND EXCHANGE COMMISSION
Washington, D.C. 20549
FORM 10-K (Mark One)[X]
ANNUAL REPORT PURSUANT TO SECTION 13 OR 15(d) OF THE SECURITIES EXCHANGEACT OF 1934
For the fiscal year ended September 26, 2004
OR
[ ]
TRANSITION REPORT PURSUANT TO SECTION 13 OR 15(d) OF THE SECURITIESEXCHANGE ACT OF 1934
For the transition period from to .
Commission file number 0-19528
QUALCOMM Incorporated(Exact name of registrant as specified in its charter)
Delaware 95-3685934
(State or other jurisdiction of (I.R.S. Employerincorporation or organization) Identification No.)
5775 Morehouse Drive San Diego, California 92121-1714
(Address of principal executive offices) (Zip Code)
Registrant’s telephone number, including area code: (858) 587-1121
Securities registered pursuant to Section 12(b) of the Act:
None
Securities registered pursuant to Section 12(g) of the Act:
Common Stock, $0.0001 par value(Title of Class)
Indicate by check mark whether the registrant (1) has filed all reports required to be filed by Section 13 or 15(d) of the Securities Exchange Act of 1934 during thepreceding 12 months (or for such shorter period that the registrant was required to file such reports), and (2) has been subject to such filing requirements for the past 90 days.
YES [X] NO [ ]
Indicate by check mark if disclosure of delinquent filers pursuant to Item 405 of Regulation S-K (Section 229.405 of this chapter) is not contained herein, and will not becontained, to the best of registrant’s knowledge, in definitive proxy or information statements incorporated by reference in Part III of this Form 10-K or any amendment to thisForm 10-K. [ ]
Indicate by check mark whether the registrant is an accelerated filer (as defined in Rule 12b-2 of the Act).
YES [X] NO [ ]

Table of Contents
State the aggregate market value of the voting and non-voting common equity held by non-affiliates computed by reference to the price at which the common equity waslast sold, or the average bid and asked prices of such common equity, as of the last business day of the registrant’s most recently completed second fiscal quarter.
The aggregate market value of the voting and non-voting common equity held by non-affiliates of the registrant as of March 26, 2004 was $48,250,582,026.*
The number of shares outstanding of the registrant’s common stock was 1,639,081,639 as of November 1, 2004.
DOCUMENTS INCORPORATED BY REFERENCE
Portions of the registrant’s Definitive Proxy Statement to be filed with the Commission pursuant to Regulation 14A in connection with the registrant’s 2005 AnnualMeeting of Stockholders, to be filed subsequent to the date hereof, are incorporated by reference into Part III of this Report. Such Definitive Proxy Statement will be filed withthe Securities and Exchange Commission not later than 120 days after the conclusion of the registrant’s fiscal year ended September 26, 2004.
* Excludes the Common Stock held by executive officers, directors and stockholders whose ownership exceeds 5% of the Common Stock outstanding at March 26, 2004.This calculation does not reflect a determination that such persons are affiliates for any other purposes.
Table of Contents
QUALCOMM INCORPORATEDForm 10-K
For the Fiscal Year Ended September 26, 2004Index
Page
PART I Item 1. Business 1
Overview 1 Wireless Telecommunications Industry Overview 5 The Evolution of Wireless Standards 6 Operating Segments 8 Research and Development 13 Sales and Marketing 13 Competition 14 Patents, Trademarks and Trade Secrets 16 Employees 18 Available Information 18 Executive Officers 18 Risk Factors 20
Item 2. Properties 33 Item 3. Legal Proceedings 34 Item 4. Submission of Matters to a Vote of Security Holders 36
PART II Item 5. Market for Registrant’s Common Equity, Related Stockholder Matters and Issuer Purchases of Equity Securities 37 Item 6. Selected Consolidated Financial Data 39 Item 7. Management’s Discussion and Analysis of Financial Condition and Results of Operations 40 Item 7A. Quantitative and Qualitative Disclosure about Market Risk 58 Item 8. Financial Statements and Supplementary Data 59 Item 9. Changes in and Disagreements with Independent Registered Public Accounting Firm on Accounting and Financial Disclosure 59 Item 9A. Controls and Procedures 59 Item 9B. Other Information 60
PART III Item 10. Directors and Executive Officers of the Registrant 61 Item 11. Executive Compensation 61 Item 12. Security Ownership of Certain Beneficial Owners and Management 61 Item 13. Certain Relationships and Related Transactions 61
Item 14. Principal Accounting Fees and Services 61
PART IV Item 15. Exhibits and Financial Statement Schedules 62 EXHIBIT 21 EXHIBIT 23.1 EXHIBIT 31.1 EXHIBIT 31.2 EXHIBIT 32.1 EXHIBIT 32.2

Table of Contents
TRADEMARKS AND TRADE NAMES
QUALCOMM®, QUALCOMM CDMA University®, QUALCOMM Wireless Business Solutions®, OmniTRACS®, OmniOne®, GlobalTRACS™, TruckMAIL™,OmniExpress®, QConnect™, T2™, Eudora®, QCP-®, QCT®, MSM™, CSM™, MSM5500®, MSM6000®, MSM6025™, MSM6050™, MSM6100™, MSM6150™,MSM6200™, MSM6250™, MSM6275™, MSM6280™, MSM6300™, MSM6500™, MSM6550™, MSM6700™, MSM6800™, MSM7200™, MSM7500™, MSM7600™,CSM5500™, CSM6700™, CSM6800™ gpsOne™, radioOne®, SnapTrack®, BREW®, BREW SDK®, BINARY RUNTIME ENVIRONMENT FOR WIRELESS®,MediaFLO™, QPoint™ and QCHAT® are trademarks and/or service marks of QUALCOMM Incorporated. QUALCOMM, QUALCOMM Wireless Business Solutions,QWBS, QUALCOMM CDMA Technologies, QCT, QUALCOMM Technology Licensing, QTL, QUALCOMM Wireless Systems, QWS, QUALCOMM Wireless & InternetGroup, QWI, QUALCOMM Internet Services, QIS, QUALCOMM Consumer Products, QCP, QUALCOMM Strategic Initiatives, QSI and SnapTrack are trade names ofQUALCOMM Incorporated.
cdmaOne® is a trademark of the CDMA Development Group, Inc. CDMA2000® is a registered trademark and certification mark of the Telecommunications IndustryAssociation. Globalstar™ is a trademark and service mark of Globalstar, L.P., and Globalstar® is a trademark of Loral Qualcomm Satellite Services, Inc.
All other trademarks, service marks and/or trade names appearing in this document are the property of their respective holders.
Table of Contents
In this document, the words “we,” “our,” “ours” and “us” refer only to QUALCOMM Incorporated and not any other person or entity.
PART I
Item 1. Business
This Annual Report (including the following section regarding Management’s Discussion and Analysis of Financial Condition and Results of Operations) containsforward-looking statements regarding our business, financial condition, results of operations and prospects. Words such as “expects,” “anticipates,” “intends,” “plans,”“believes,” “seeks,” “estimates” and similar expressions or variations of such words are intended to identify forward-looking statements, but are not the exclusive means ofidentifying forward-looking statements in this Annual Report. Additionally, statements concerning future matters such as the development of new products, enhancements ortechnologies, sales levels, expense levels and other statements regarding matters that are not historical are forward-looking statements.
Although forward-looking statements in this Annual Report reflect the good faith judgment of our management, such statements can only be based on facts and factorscurrently known by us. Consequently, forward-looking statements are inherently subject to risks and uncertainties and actual results and outcomes may differ materially fromthe results and outcomes discussed in or anticipated by the forward-looking statements. Factors that could cause or contribute to such differences in results and outcomesinclude without limitation those discussed under the heading “Risk Factors” below, as well as those discussed elsewhere in this Annual Report. Readers are urged not to placeundue reliance on these forward-looking statements, which speak only as of the date of this Annual Report. We undertake no obligation to revise or update any forward-looking statements in order to reflect any event or circumstance that may arise after the date of this Annual Report. Readers are urged to carefully review and consider thevarious disclosures made in this Annual Report, which attempt to advise interested parties of the risks and factors that may affect our business, financial condition, results ofoperations and prospects.
We were incorporated in 1985 under the laws of the state of California. In 1991, we reincorporated in the state of Delaware. We operate and report using a 52-53 weekfiscal year ending the last Sunday in September. Our 52-week fiscal years consist of four equal quarters of 13 weeks each, and our 53-week fiscal years consist of three 13-week fiscal quarters and one 14-week fiscal quarter. The financial results for our 53-week fiscal years and our 14-week fiscal quarters will not be exactly comparable to our52-week fiscal years and our 13-week fiscal quarters. Each of the fiscal years ended September 30, 2004, 2003, and 2002 include 52 weeks. For presentation purposes, allfiscal periods presented or discussed in this report have been presented as ending on September 30. For example, our 2004 fiscal year ended on September 26, 2004, but wepresent our 2004 fiscal year as ending on September 30, 2004.
Overview
In 1989, we publicly introduced the concept that a digital communication technique called CDMA could be commercially successful in wireless communicationapplications. CDMA stands for Code Division Multiple Access and is one of the three main technologies currently used in digital wireless communications networks. CDMAand the two other main digital wireless communications technologies, TDMA (which stands for Time Division Multiple Access) and GSM (which is a form of TDMA andstands for Global System for Mobile Communications) are the digital technologies used to transmit a wireless phone user’s voice or data over radio waves using the wirelessphone operator’s network. CDMA works by converting speech into digital information, which is then transmitted in the form of a radio signal over the phone network. Thesedigital wireless phone networks are complete phone systems comprised primarily of base stations, or “cells,” which are geographically placed throughout a service or coveragearea. Once communication between a wireless phone user and a base station is established, the system detects the movement of the wireless phone user and thecommunication is handed off to another base station, or cell, as the wireless phone user moves throughout the service area.
Because we led the development and commercialization of CDMA technology, we own significant intellectual property, including patents, patent applications and tradesecrets, portions of which we license to other companies and implement in our own products. The wireless communications industry generally recognizes that a companyseeking to develop, manufacture and/or sell products that use CDMA technology will require a license from us.
1
Table of Contents
There are currently four versions of CDMA technology recognized worldwide as public wireless standards. The version known as cdmaOne was the first commerciallydeployed CDMA-based phone system and is popularly referred to as a second generation technology. The other three versions of CDMA are popularly referred to as thirdgeneration (3G) technologies and known commonly throughout the wireless industry as:
• CDMA2000, including 1X, 1xEV-DO (where DO refers to Data Optimized) and 1xEV-DV (where DV refers to Data and Voice);
• Wideband CDMA (WCDMA) or Universal Mobile Telecommunications Systems (UMTS); and
• Time Division Duplex CDMA, such as Time Division Synchronous-CDMA (TD-SCDMA) and Time Division Duplexing-CDMA (TDD-CDMA).
CDMA2000 and WCDMA are deployed today in commercial mobile phone networks throughout the world. In addition to increasing voice capacity, these 3G CDMAtechnologies enable greater data capacity and higher data rates.
Our revenues. We generate revenues by licensing portions of our CDMA technology to other manufacturers of CDMA products (such as wireless phones and the hardwarerequired to establish and operate a CDMA wireless network). Revenues are generated through licensing fees and royalties on CDMA-based products sold by our licensees.We also sell products and services, which include the following, all of which are described in greater detail below:
• CDMA-based integrated circuits (also known as chips) and the related software used in wireless phones (also known as subscriber units and handsets) and wirelessnetworks;
• Radio Frequency chips used in wireless phones and sold in conjunction with our CDMA-based integrated circuits;
• Messaging and other services and related equipment and software used by transportation and other companies to communicate with and track their equipment fleets;
• Software products and services related to BREW (which stands for Binary Runtime Environment for Wireless), a package of products that enable software
developers to create applications, or programs, to run on mobile phones. BREW includes porting tools and technical assistance for device manufacturers and theBREW Distribution System (BDS) that allows for over-the-air distribution of applications to mobile phones and coordinates billing and payment for wirelessoperators; and
• Software and hardware development services.
We make strategic investments to promote the development of new CDMA products as well as the adoption of CDMA by more mobile phone service providers. We alsoprovide products and services to service providers and other customers of Globalstar LLC, a company that operates a worldwide, low-Earth-orbit satellite-basedtelecommunications system.
Our engineering resources. We have significant engineering resources, including engineers with substantial expertise in CDMA technology. Using these engineeringresources, we expect to continue to develop new versions of CDMA, develop new technologies that use CDMA, participate in the formulation of new wirelesstelecommunications standards and technologies and assist in deploying wireless voice and data communications networks around the world.
Our integrated circuits business. We develop and supply CDMA-based integrated circuits and system software for use in wireless voice and data communications,multimedia functions and global positioning. Our integrated circuit products and software are used in wireless devices, particularly phones, and infrastructure equipment. Thewireless integrated circuits include the Mobile Station Modem (MSM), Radio Frequency (RF) and Power Management (PM) devices. The wireless phone integrated circuitsand software perform voice and data communication, multimedia and global positioning functions, radio conversion between radio and baseband signals and powermanagement. The infrastructure equipment integrated circuits provide the core baseband CDMA modem functionality in the operator’s equipment. These software productsare the systems that control the phone and the functionality imbedded in our integrated circuit products. Because of our broad and unique experience in designing anddeveloping CDMA-based products, we not only design the integrated circuit, but, by designing the RF devices, PM devices and accompanying software products, we therebydesign the entire supporting system. This
2
Table of Contents
approach enables us to optimize the performance of the wireless phone itself with improved product features, as well as the integration and performance of the networksystem. Our design of the entire system also allows CDMA systems and devices manufactured by our customers to come to market faster. We provide our integrated circuitsand related system software, including reference designs and tools, to many of the world’s leading wireless phone and infrastructure equipment manufacturers. We plan to addadditional features and capabilities to our future integrated circuit products to help our customers reduce the costs and size of their products and to simplify our customers’design processes. We also design and create multimode and multiband integrated circuits incorporating other wireless standards for global roaming markets. In addition, wewill continue to provide high quality support to enable our customers to reduce the time required to design their products and bring their products to market faster.
Our asset tracking and messaging business. We design, manufacture and sell equipment and provide satellite and terrestrial-based two-way data messaging and positionreporting services to transportation companies, private fleets, construction equipment fleets and other enterprise companies throughout parts of the world. These productspermit our customers to track the location of their vehicles or other assets and to communicate with them en route. These products and services use commercially availablesatellite and wireless terrestrial-based networks to permit this communication. Our customers use these products to communicate with drivers, monitor vehicle location andperformance, provide automated driver logs, fuel tax reporting, security and enhanced customer service. Our products, which collect and transmit this data, are also integratedwith our customers’ operations software, such as dispatch, payroll and accounting, so our customers can better manage their information and operations. Using our assettracking and messaging infrastructure, we also provide a managed wireless data service, QConnect, to other service providers. For example, we provide the QConnect serviceto CardioNet, a provider of outpatient cardiac telemetry technology services, where we manage the wireless data service connectivity between CardioNet mobile monitoringdevices and the CardioNet Monitoring Center.
Our phone software and related services business. We provide our BREW (Binary Runtime Environment for Wireless) product and services to network operators, handsetmanufacturers and application developers. We support the development and delivery of over-the-air wireless applications and services. The BREW product and servicesinclude the BREW SDK (software development kit) for developers, the BREW applications platform (i.e. software programs) and interface tools for device manufacturers,and the BREW Distribution System that enables network operators to get applications from developers to market and coordinate the billing and payment process. The BREWplatform is a software application that provides an open, standard platform for wireless devices, which means that BREW can be made to interface with many softwareapplications, including those developed by others. We make the BREW SDK available, free of charge, to any qualified person or company interested in developing a newproduct for wireless communications. BREW leverages the capabilities available in integrated circuits and system software, enabling our customers to develop feature-richapplications and content while reducing memory and maximizing system performance of the wireless phone itself. BREW can be used on wireless phones and other devicesthat support wireless technologies other than CDMA2000, such as GSM, GPRS (General Packet Radio System), EDGE (Enhanced Data Rates for GSM Evolution) andWCDMA. We also provide QChat, which enables push-to-chat functionality on CDMA-based wireless devices, and QPoint, which enables operators to offer E-911 andlocation-based applications and services.
Subscriber growth. In September 2004, EMC World Cellular Information Service (EMC), a researcher and publisher of wireless industry market intelligence, forecast thatthere will be 1.7 billion mobile phone users, also referred to as subscribers, by the end of this calendar year and that the figure will grow to nearly 2.5 billion globally by theend of 2009. Wireless networks based on cdmaOne and CDMA2000 have been commercially deployed in 69 countries around the world. In July 2004, In-Stat/MDR, aprovider of research, assessments and market forecasts of semiconductor and advanced communications equipment and services, published a report estimating thatCDMA2000 and WCDMA will capture the largest market share in terms of number of subscribers by 2009. The CDMA Development Group (CDG) is an internationalconsortium of companies that joined together to lead the adoption and evolution of CDMA wireless systems around the world. According to the CDG, from 2002 through thefirst half of 2004, the CDMA subscriber base increased by an average of 30% per year, making it the fastest growing wireless standard of all leading cellular technologies. InJune 2004, the CDG reported that there were more than 212 million CDMA subscribers worldwide. CDMA is the leading mobile phone technology in North America withmarket share of 47% at June 2004 according to the CDG. As reported by the CDG, the North America CDMA market has nearly 86 million subscribers at June 2004,representing annual growth of 24%. In the Asian Pacific market, the largest and fastest-growing region for CDMA, CDMA operators added nearly 26 million subscribersduring the year ended June 2004, bringing the total number of CDMA subscribers in this region to over 88 million, an increase of 41% over the prior year. In January 2002,China Unicom
3
Table of Contents
launched its nationwide CDMA network, and in September 2004, China Unicom announced that it had nearly 26 million CDMA subscribers. In Latin America and theCaribbean, the number of CDMA subscribers grew by 18% during the year ended June 2004, reaching nearly 35 million through 40 CDMA operators.
Next generation technologies. We have already developed and deployed the next generation of our CDMA technology, or what is being called 3G. Our 3G technology,CDMA2000 1X, was first deployed commercially in October 2000 in South Korea. Another 3G technology, CDMA 1xEV-DO, was first deployed commercially inJanuary 2002 in South Korea. As of September 2004, South Korea has accumulated over 31 million CDMA2000 subscribers according to operator web sites. As ofSeptember 2004, there are over nine million 1xEV-DO subscribers, most of which are in South Korea. As of September 2004, there are at least 107 commercial 3G operatorslocated in 48 countries. In the United States there are 14 operators that have commercially deployed CDMA2000 1X, making CDMA2000 1X the first 3G technology to becommercially available in North America. In September 2004, more than 500 different models of CDMA2000 user devices are being sold across all markets, according topublic reports made available at www.cdg.org.
Further investments. We continue to invest heavily in research and development focused on extending the market for CDMA-based products and services. We aredeveloping and commercializing CDMA technology and products to support high-speed wireless Internet access and multimode, multiband, multinetwork products that canuse cdmaOne, CDMA2000 1X/1xEV-DO, GSM/GPRS/EDGE, Wireless Local Area Network (WLAN), WCDMA, HSDPA (High Speed Downlink Packet Access), FLO andall OFDM (Orthogonal Frequency Division Multiplexing) networks. Among the technologies we are developing that will use these networks are BREW, Push-to-Talk overCellular, the MediaFLO content distribution and GPS position location technologies.
We are devoting significant research and development resources to developing high-speed wireless data and Internet access products using our CDMA technology,including efforts to meet and exceed the standards for 3G products set by the International Telecommunications Union (ITU). Many CDMA wireless phone network operatorsthat have integrated new features, such as Internet access, GPS position location and advanced multimedia capabilities like digital photos and video clips, into their products,made possible by our 3G CDMA2000 1X technology, have experienced increased numbers of subscribers, handset replacements and average revenue per user. Our 1xEV-DOtechnology also permits CDMA wireless network providers to separately process voice transmissions and data transmissions, allowing them to optimize each type oftransmission. We believe the transfer rate of 1xEV-DO will satisfy the demand for high-speed, cost-effective, fixed and mobile alternatives for Internet access, competingwith digital subscriber line, cable and satellite networks.
Wireless Local Area Networks (WLAN), such as Wi-Fi (Wireless Fidelity), are complementary to Wide Area Networks (WAN), such as CDMA2000 and WCDMA. Theyboth provide affordable high-speed wireless access to the World Wide Web. The high-speed data air link and limited coverage of Wi-Fi is well suited for private networks(e.g. enterprises, campuses and homes) and certain public “hot spots” (e.g. airports, conference halls and coffee shops) where data usage is expected to be high in a limitedportable and stationary environment, whereas 3G CDMA networks are ideally suited for geographically diverse voice and data coverage (e.g. cities, highways andneighborhoods). Because wireless operators are looking to use Wi-Fi to extend their coverage indoors and include Wi-Fi services in their monthly billing structure, we havebegun developing our own core chip for handling Wi-Fi services based on the 802.11 standard and plan to incorporate it into our future multimode 3G CDMA chips. Thissame customer-focused and business-driven approach is intended to be used to analyze and adopt any other type of wireless technology or service that may exist or is beingdeveloped.
We intend to continue our active support of CDMA-based systems and the technologies and features CDMA permits in order to grow our royalty revenues and integratedcircuit and software revenues. We also plan to continue to broadly grant royalty-bearing licenses to our technology and patents for CDMA and other wireless applications.From time to time, we may also make acquisitions to meet certain technology needs, to access development resources or to pursue new business opportunities. InOctober 2004, we completed the acquisition of all of the outstanding capital stock of Iridigm Display Corporation, a privately held display technology company, and TrigenixLimited, a privately held mobile user interface company, for a total of approximately $193 million in cash and the exchange of stock options with an estimated aggregate fairvalue of approximately $17 million. The convergence of consumer electronics products, including cameras, MP3 players, camcorders, GPS receivers and game consoles, intowireless devices is driving the increased adoption of 3G CDMA. With the inclusion of color displays in all types of phones,
4
Table of Contents
including models at the low end of the market, the cost of the display has become an even more significant driver in the overall cost of the handset. Iridigm’s patented displaytechnology should cost significantly less to manufacture than a comparable liquid crystal display (LCD) because it requires fewer processing steps to produce, thus enablingadvanced multimedia capabilities on all tiers of mobile devices, while providing performance, power consumption and cost benefits as compared to alternative displaytechnologies. Our acquisition of Iridigm will accelerate the time to market for Iridigm’s display technology, which fits our overall strategy of rapidly increasing the capabilityof wireless devices while driving down cost, size and power consumption. Operators and device manufacturers need a secure modular approach for customizable phone userinterfaces for the branding of handsets offered to their subscribers. Our acquisition of Trigenix complements our BREW offering by adding Trigenix’s user interfacedevelopment tools to enhance our BREW user interface capabilities and time-to-market.
We are developing our MediaFLO content distribution system and FLO (Forward Link Only) technology for delivery of low cost multimedia content to multiplesubscribers. On November 1, 2004, we announced plans for a subsidiary, MediaFLO USA, Inc. (MediaFLO USA), that will deploy and operate a nationwide mediacastnetwork to deliver high-quality video and audio programming to third generation mobile devices in the 700 MHz spectrum for which we hold licenses. The mediacast networkwill be based on our FLO technology and will use the MediaFLO media distribution system for content aggregation, delivery and viewing. MediaFLO USA is expected torequire approximately $800 million in funding over the next four to five years, some of which may be provided by third parties.
We make strategic investments to promote the worldwide adoption of CDMA products and services. Our strategy has been to invest in CDMA operators (also known aswireless phone operators, wireless network operators, wireless service providers or wireless operators), licensed device manufacturers and start-up companies that we believeopen new markets for CDMA technology, support the design and introduction of new CDMA-based products or possess unique capabilities or technology. Most of ourstrategic investments entail a high degree of risk and will not become liquid until more than one year from the date of investment, if at all. To the extent such investmentsbecome liquid and meet strategic objectives, we attempt to make regular periodic sales of our interests in these investments that are recognized in investment income(expense). In some cases, we make strategic investments in early stage companies, which require us to consolidate or record our equity in losses of those companies. Theselosses will adversely affect our financial results until we exit from or reduce our exposure to these investments. We also provide financing to CDMA operators to facilitate themarketing and sale of CDMA equipment by licensed manufacturers. We have a commitment to provide equipment financing to customers of Ericsson on a shared basis withrespect to Ericsson’s sale of CDMA infrastructure equipment. In November 2001, we acquired controlling interests in two CDMA operators in Brazil (the Vésper OperatingCompanies). We sold these two CDMA operators in fiscal 2004. We had a net cash inflow from strategic investments in fiscal 2004 and plan to continue to reduce the level ofinvestment in wireless operators, other than investments in our MediaFLO USA subsidiary, from the levels of fiscal 2003 and before.
Giving Back. At QUALCOMM, we are not only committed to being good corporate citizens, but also good neighbors in the communities we call home. We contributecollectively as a corporation, and we participate in ways that touch people’s lives on a personal level. We encourage our employees to give their time and considerable talentsto the community, and their significant volunteer efforts are evident in, for example, schools, the arts, feeding the homeless and serving on the advisory boards of not-for-profit organizations. Every year, our goal is to donate approximately one to two percent of our pretax profits to community causes, with a focus on programs that promoteeducation, health and human services, and culture and the arts. Our charitable giving and volunteerism programs are based on respect for community organizations,cooperative leadership development and philanthropic creativity.
Wireless Telecommunications Industry Overview
From an international perspective, the International Telecommunications Union (ITU) is the central telecommunication standards setting organization. The ITU isrecognized as an impartial, international organization within which governments and the private sector work together to advance the development of communicationstechnology. The ITU’s standardization activities foster the growth of new technologies, such as mobile telephony, mobile broadcast and the Internet, as well as the emergingglobal information infrastructure which handles a mix of voice, data and rich multimedia signals. The ITU develops internationally-agreed technical and operating standards tofoster seamless interconnection of the world’s communication networks and their subsystems. As the world of telecommunications, information technology and mediacontent distribution rapidly converge, the role of the ITU is to forge new recommendations that promote the interoperability of equipment and facilitate the development ofadvanced communication networks. The ITU’s objective is to identify sound technical recommendations, which are then developed into internationally recognized ITUrecommendations.
The Telecommunications Industry Association (TIA) is the leading U.S. based non-profit trade association serving the communications and information technologyindustry. Through its worldwide activities, the TIA facilitates business development opportunities and a competitive market environment. The TIA provides a market-focusedforum for its member companies, which manufacture or supply the products and services used in global communications. The TIA facilitates the convergence of newcommunications networks while working towards creating a competitive and innovative market environment. The TIA is a major contributor of voluntary industry standardsthat support global trade and commerce in communications products and systems.
Other Standards Development Organizations (SDO), including, among others, the Telecommunications Industry Association (TIA) in the United States, the EuropeanTelecommunications Standards Institute (ETSI), the Telecommunications Technology Association (TTA) in Korea, the Association of Radio Industries and Businesses(ARIB) in Japan, and the Institute for Electrical and Electronic Engineers (IEEE), are non-profit standards and trade associations that also serve the communications andinformation technology industry. Through their worldwide activities, these organizations work together, in conjunction with the ITU, to develop common specifications tofacilitate global business development opportunities. They each provide a market-focused forum for their member companies, which manufacture or supply the products andservices used in global communications. They also facilitate the convergence of new communications networks while working towards creating a competitive and innovativemarket environment. Each organization contributes voluntary industry standards that support global trade and commerce in communications products and systems.
5
Table of Contents
None of these organizations have the enforcement authority or the ability to protect intellectual property rights. These organizations merely ask participating companies todeclare whether they believe they hold patents essential for compliance with a particular standard and whether they are willing to license such patents on a royalty-free basis oron a royalty- basis on fair, reasonable and nondiscriminatory terms.
Usage of mobile phones and other types of wireless telecommunications equipment has increased dramatically in the past decade. It is estimated that there will be nearly2.5 billion mobile subscribers worldwide by 2009, based on forecasts made in September 2004 by EMC. Growth in the market for wireless telecommunications services hastraditionally been fueled by demand for voice communications. There have been several factors responsible for this increasing demand, including:
• increased privacy, call clarity and security of digital networks based on digital second and third generation wireless technology standards;
• lower cost of service, including flat-rate and bundled long-distance call pricing plans;
• an increasingly mobile workforce with increased need for wireless voice communications;
• a consumer base that desires to be accessible, informed and entertained within a mobile environment;
• wireless networks becoming the primary communications infrastructure in developing countries due to the higher costs of and longer time required for installingwireline networks; and
• regulatory environments worldwide favoring increased competition in wireless telecommunications.
In addition to the tremendous demand for wireless voice services, wireless service providers are increasingly focused on providing wireless data services through mobilephones, including wireless access to the Internet, multimedia entertainment and position location services. In March 2004, International Data Corporation (IDC), a globalmarket intelligence and advisory firm in the technology and telecommunications industries, estimated that over one billion people will be using the Internet by 2007. InMay 2004, iGillott Research, a market strategy consultancy focused on the wireless and mobile communications industry and collaborative applications, estimated that in 2007over 450 million wireless subscribers will use the Internet via handsets. We believe the growing availability of 3G-enabled handsets capable of performing a wide variety ofconsumer and enterprise applications will accelerate consumer demand for many wireless data services on a global basis and lead to an increased replacement rate in mobiledevices using our technology and integrated circuits. High-speed and low cost data connectivity are important to the consumer and are driving the evolution of wirelessstandards. We expect that the spread of high-speed, cost-effective wireless data access will encourage the development of other remote supervision, position location andtelematic automobile applications. However, the demand for such services is at an early stage of development.
The adoption of wireless standards for mobile communications by individual countries is generally based on economic criteria and the technology preference of thetelecommunication service providers operating in those countries. Approximately a decade ago, the European Community developed regulations requiring the use of atelecommunication standard known as Global System for Mobile Communications, commonly referred to as GSM. The use of this second generation wireless standard hasspread throughout the world and is currently the basis for approximately 73% of the digital mobile communications in use according to EMC. The majority of the more thanone billion GSM subscribers are expected to migrate to third generation CDMA services before the end of this decade.
The Evolution of Wireless Standards
The significant growth in the use of wireless phones worldwide and demand for enhanced network functionality requires constant innovation to further improve networkreliability, expand capacity and introduce new types of services. To meet these requirements, progressive generations of wireless telecommunications technology standardshave evolved.
First Generation. The first generation of wireless telecommunications, widely adopted in the late 1980s, was based on analog technology. While this generation helpedincrease the adoption of wireless telecommunications, the technology was characterized by inherent capacity limitations, minimal data transfer capabilities, low security,inconsistent service levels and significant power consumption.
Second Generation. As the deployment of mobile phone systems grew, the limitations of analog technology drove the development of second generation, digital-basedtechnologies, which are the primary technology standards
6
Table of Contents
in use today. Second generation digital technology provided for significantly enhanced efficiency within a broadcast spectrum as well as greatly increased capacity comparedto analog systems. Second generation technologies also enabled numerous enhanced services, including paging, e-mail and facsimile, connections to computer networks,greater privacy, lower prices, a greater number of service options and greater fraud protection. The three main second-generation digital technologies are CDMA, calledcdmaOne or IS-95A/B, a technology we developed and patented, TDMA and GSM, a form of TDMA.
Our second generation CDMA technology offers 10 to 20 times the capacity of analog systems and more than three times the capacity of TDMA- and GSM-based systemsthrough more efficient utilization of wireless operators’ licensed spectrum. Some of the advantages of CDMA technology over both analog and TDMA- and GSM-basedtechnologies include enhanced call security, increased network capacity, network flexibility, compatibility with Internet protocols, lower power requirements, higher capacityfor data and faster access to data (Internet), higher data throughput rates and easier transition to 3G networks. GSM has the benefit of roaming, being readily available as aresult of the GSMA’s mandate. Currently, GSM low end handsets are somewhat lower priced than CDMA handsets, although this differential is diminishing.
Many GSM operators are deploying 2.5G mobile packet data technologies, such as GPRS and EDGE (Enhanced Data Rates for GSM Evolution), as a bridging technology,while they wait for 3G WCDMA devices to become readily available. We do not believe that GPRS and EDGE effectively compete with 3G CDMA-based packet dataservices, either on a cost or performance basis, although these technologies have been deployed in GSM networks.
Third Generation. As demand for wireless networks that carry both data and voice traffic at faster speeds has increased significantly, several 3G wireless standards wereproposed to the ITU by a variety of companies and alliances. These proposals include both CDMA- and TDMA-based technologies. A technology standard selected for 3Gmust efficiently support significantly increased data speeds and capacity over limited spectrum bandwidth, thereby enabling new and enhanced services and applications suchas mobile e-commerce, position location and mobile multimedia web browsing, including music and video downloads.
CDMA-Based 3G Technology. In May 2000, the ITU adopted the 3G standard known as IMT-2000, which encompasses five terrestrial operating modes, three of thembased on our CDMA intellectual property.
The three IMT-2000 CDMA modes are:
(1) CDMA2000, also known as Multi-Carrier, which includes CDMA2000 1X/1xEV-DO/1xEV-DV;
(2) WCDMA, also known as Direct Spread or UMTS; and
(3) Time Division Duplex, also known as TDD or TD-SCDMA.
The two operating modes not based on CDMA are DECT+ and UWC-136, also known as Enhanced Data Rates for GSM Evolution (EDGE) for IS-136 TDMA and GSM-based networks.
The two current commercial versions of CDMA2000 are: CDMA2000 1X and 1xEV-DO. These versions use a 1.25 megahertz (MHz) channel bandwidth to provide bothvoice communications and high-speed wireless data. CDMA2000 1X/1xEV-DO utilizes the same standard channel bandwidth as existing cdmaOne systems and, as a result, iscompatible with wireless telecommunications operators’ existing network equipment, making the migration to 3G simple and affordable. We believe CDMA2000 1X providesapproximately twice the voice capacity of cdmaOne and six to eight times that of TDMA-based networks. Additionally, a hybrid approach that utilizes signals from both theGPS satellite constellation and CDMA cell sites, and is also available for non-CDMA networks, has enabled CDMA system operators to meet the Federal CommunicationsCommission (FCC) mandate requiring wireless operators to implement enhanced 911 (E911) wireless emergency location services. In the future, the performance ofCDMA2000 1X and 1xEV-DO is expected to increase. Other enhancements, such as multicast services, higher-resolution displays, longer battery life, push-to-talk servicesand voice over Internet protocol are becoming available to improve the user experience and operator profitability.
Commercial deployment of CDMA2000 1X began in October 2000 in South Korea where more than 31 million, or approximately 85%, of the nation’s total mobile serviceusers were using this technology by the end of September 2004. Commercial deployment of CDMA2000 1X in North America, Brazil and Romania began in December 2001.KDDI commercially deployed CDMA2000 1X in Japan in April 2002 and reported more than 15 million CDMA2000 1X subscribers as of August 2004. In January 2002,China Unicom launched its nationwide CDMA network and had nearly 26 million CDMA subscribers at the end of September 2004. In May 2003, Reliance Infocommlaunched its nationwide CDMA network in India and had over nine million subscribers at the end of September 2004.
Commercial deployment of CDMA2000 1xEV-DO began in January 2002 in South Korea with the introduction of SKT’s high-speed mobile multimedia and broadcastservice called “June.” As of September 2004, SKT and KTF
7
Table of Contents
reported more than nine million CDMA2000 1xEV-DO subscribers in Korea. Today, more than 80% of the CDMA market is in various stages of 1xEV-DO deployments andtrials. For example, Verizon Wireless in the United States and KDDI in Japan began their nationwide roll-out of 1xEV-DO services on October 1, 2003 and November 28,2003, respectively. As of September 2004, KDDI had more than one million 1xEV-DO subscribers. On August 2, 2004, Eurotel, a CDMA450 operator in the CzechRepublic, became the first European operator to deploy 1xEV-DO in Europe. Sprint PCS has also announced its plans to begin its nationwide roll-out of 1xEV-DO-basedservices starting in the autumn of 2004. As of October 2004, ten wireless phone operators have commercially deployed our CDMA2000 1xEV-DO technology in SouthKorea, the United States, Japan, Brazil, Guatemala, Romania and the Czech Republic. More than a dozen other operators have publicly announced trials and are in the processof rolling out 1xEV-DO commercially over the next 12 months.
We are seeing greater adoption of 1xEV-DO among operators worldwide. Consequently, commercial deployments of 1xEV-DV are uncertain, yet may possibly occur inthe future.
The European Community has focused primarily on the second mode of the IMT-2000 standard, known as WCDMA, which is based on our underlying CDMAtechnology. Most all of the world’s leading wireless phone and infrastructure manufacturers have licensed our technology, enabling them to utilize this WCDMA mode of the3G technology. Our 3G CDMA licensees include Siemens, Nokia, Ericsson, Motorola, Lucent, Samsung, LG Electronics, Hitachi, NEC, Nortel, Toshiba, Sanyo, Sharp,Fujitsu, Denso, Agilent, Alcatel, Matsushita, Mitsubishi, and Kyocera, among others. We expect a significant growth in the WCDMA subscriber base over the next five yearsmostly in Japan (led by NTT DoCoMo) and Europe; thus, we have allocated a significant amount of engineering, production and business resources to adequately support thislarge growth opportunity.
The TD-SCDMA mode is the least developed of the 3G CDMA alternatives. Support for the development of this version of the 3G technologies has been provided by theChinese government.
The three 3G CDMA wireless operating modes discussed above are all based on the underlying core principles of CDMA technology; however, the CDMA2000 modeenables a direct and relatively more economical conversion for current cdmaOne networks. WCDMA has been specifically designed to operate in GSM networks. We willcontinue to develop integrated circuits for the CDMA2000 and WCDMA modes, and expect to develop integrated circuits for all other modes of the 3G standard based onCDMA. In addition, our intellectual property rights include core and primary patents utilized by each of the 3G CDMA alternatives, and the royalty rate to be paid to us bysubscriber unit licensees for 3G CDMA products is no less than the rate that a licensee will pay for second generation cdmaOne products.
These three 3G CDMA wireless operating modes require separate implementations and are not interchangeable from a technological perspective. While the fundamentalcore technologies are derived from CDMA and are covered by our patents, they each require unique infrastructure products, network design and management. They arehowever being linked through multimode wireless devices.
Operating Segments
Consolidated revenues from international customers as a percentage of total revenues were 79% in fiscal 2004, 77% in fiscal 2003 and 69% in fiscal 2002. During fiscal2004, 43% and 18% of our revenue was from customers and licensees based in South Korea and Japan, respectively, as compared to 45% and 15% during fiscal 2003,respectively, and 39% and 18% during fiscal 2002, respectively.
Risks related to our conducting business with customers and licensees outside of the United States are described in Risk Factors – “We are subject to the risks of our andour licensees conducting business outside of the United States.” Additional information regarding our operating segments is provided in the Notes to our ConsolidatedFinancial statements. See “Notes to Consolidated Financial Statements, Note 10 – Segment Information.”
QUALCOMM CDMA Technologies Segment (QCT)
QCT is a leading developer and supplier of integrated circuits and system software for wireless voice and data communications multimedia functions and globalpositioning products. QCT offers software and integrated circuits for wireless handsets and infrastructure equipment. These products provide customers with advancedwireless technology, enhanced component integration and interoperability, and reduced time to market. QCT provides integrated circuits and system software to many of theworld’s leading wireless handset and infrastructure manufacturers. In fiscal 2004, QCT shipped approximately 137 million MSM integrated circuits for CDMA wirelessdevices worldwide. QCT revenues comprised 63% of total consolidated revenues in both fiscal 2004 and 2003 and
8
Table of Contents
54% of total consolidated revenues in fiscal 2002. Four major customers, Kyocera Wireless, LG Electronics, Motorola Inc. and Samsung Electronics Company constitute asignificant portion of QCT’s revenues, such that the loss of any one of these customers could potentially reduce our revenues and harm our ability to achieve or sustainacceptable levels of operating results. QCT has subcontracted all of the manufacturing and assembly, and most of the testing, of its integrated circuits. QCT depends on alimited number of third parties to perform these functions, some of which are only available from single sources with which QCT does not have long-term contracts.
QCT sells products to both wireless phone and infrastructure manufacturers. For wireless phone manufacturers, QCT’s products include baseband and system software,radio frequency, intermediate frequency, and power management devices. These highly integrated products enable manufacturers to design very small, feature-rich handsetswith longer standby and talk times that support existing cdmaOne and 3G services. For wireless infrastructure manufacturers, QCT offers CDMA integrated circuits andsystem software that provide wireless standards-compliant processing of voice and data signals to and from wireless handsets. In addition to the key components in a wirelesssystem, QCT provides our customers with system reference designs and development tools to assist in customizing features and user interfaces, to integrate our products withcomponents developed by others, and to test interoperability with existing and planned networks. Together, the phone and infrastructure products and services form a completesystem for the wireless communications industry. QCT is also closely aligned with manufacturers and operators in product plans, design specifications and developmenttimelines.
Our gpsOne wireless location feature has enabled a host of new value-added, high-precision location-based services such as friend finder, child safety, personal directionfinding and mobile yellow page services, and has enabled CDMA system operators to meet the FCC’s E911 mandate. Using a hybrid approach that utilizes signals from boththe GPS satellite constellation and cell sites, the gpsOne feature enhances location services availability, expands terrain coverage, accelerates the location determinationprocess and provides better accuracy for callers, whether during emergency situations or while using GPS-enabled commercial applications. E911 deployments by CDMAoperators in the United States are well under way. Approximately 50 million gpsOne-enabled terminals are in use today, supporting well in excess of 130 high-precisionlocation-based services in Japan, South Korea, Thailand, Brazil and China.
We have developed 1xEV-DO technology designed to provide reliable, cost-effective and always-on wireless data and Internet access to consumers. It is fully compatiblewith existing cdmaOne and CDMA2000 1X technologies, and has been standardized as part of the CDMA2000 mode of the 3G standard. The versatility of 1xEV-DO allowsthe technology to be embedded in phones, laptop and handheld computers, and other fixed, portable and mobile devices; 1xEV-DO enables manufacturers to deliver productswith access to services that were previously only available through wired connections to the Internet or enterprise networks. The 1xEV-DO technology allows operators toleverage their current infrastructure investment and maintain compatibility with existing phone equipment. We designed and developed a complete package of products,including both infrastructure and phone integrated circuits, in support of the industry-wide movement to standardize, develop and deploy 1xEV-DO technology in CDMA2000networks.
Our MSM series integrated circuits are the primary integrated circuits in a CDMA wireless phone. Our Cell Site Modem (CSM) series integrated circuits are the primaryintegrated circuits in a wireless service provider’s base station equipment. The CSM5500 and MSM5500 integrated circuits offer 1xEV-DO handset and infrastructuremodems for high-speed data. These products support the 1xEV-DO standard, as well as CDMA2000 1X, and offers compatibility with IS-95 A/B CDMA systems.
QCT’s MSM6xxx family of products, incorporating radioOne technology, enables tiered products for CDMA2000 1X, 1xEV-DO, WCDMA and GSM/GPRS/EDGEnetworks. RadioOne technology MSMs, combined with accompanying companion RF components, perform the receive and transmit functions for wireless devices withoutrequiring additional intermediate frequency components, thereby enabling manufacturers to reduce total device cost and size. The MSM6000 CDMA2000 1X integratedcircuit is an entry-level product optimized for voice and short message service applications. The MSM6025 provides voice and limited data capabilities to support demand byoperators worldwide for lower-tier handsets that also support data services. The MSM6050 integrated circuit offers basic data services for entry-level multimedia devices andgpsOne for position location services. The MSM6100 integrated circuit and system software is a highly integrated CDMA2000 1X multimedia product enabling lower systemcosts for manufacturers developing handsets with advanced multimedia applications. There are in excess of 120 separate handset designs expected to come to market in thenext 12 months based on the MSM6000, MSM6025, MSM6050 and MSM6100. Many of these are being sold today.
9
Table of Contents
Extending the MSM6xxx family of integrated circuits, we have also announced the development of the MSM6150 integrated circuit and system software for CDMA20001X and the MSM6550 integrated circuit and system software for CDMA2000 1X, 1xEV-DO and multimode GSM/GPRS. These highly integrated products address globalmarket requirements for higher quality video and graphics performance on wireless devices. We began providing samples to customers of the MSM6300, a single-baseband3G product for multimode and multiband CDMA2000 1X and GSM/GPRS, in September 2002. The MSM6300 and accompanying radioOne RF integrated circuits comprisethe first world-phone integrated circuit enabling global roaming across wireless networks. In March 2003, Samsung was the first customer to introduce product based on thisintegrated circuit. In fiscal 2004, the MSM6300 has also been used in products introduced by LG, Motorola and Samsung into the China market. In fiscal 2003, we beganproviding initial samples to customers of the high-capacity, high-speed MSM6500 integrated circuit and system software that supports CDMA2000 1X, CDMA2000 1xEV-DO and roaming on GSM/GPRS systems. We also announced the CSM6800 integrated circuit and the MSM6800 integrated circuit and system software for the wirelesstechnology standard CDMA2000 1xEV-DO revision A to provide cost-competitive products for both infrastructure and multimedia-enabled devices. Revision A results ingreater data rates on the link from the handset to the network and reduced response times, as well as other improvements.
Leveraging our expertise in CDMA we have developed integrated circuits for manufacturers and operators deploying the WCDMA version of 3G. We began shippingsamples to customers of the MSM6200 integrated circuit in June 2002, and to date several customers including Samsung, LG Electronics, Sanyo, Option and NovatelWireless, have introduced mobile phones and data cards, which are modem devices that insert into laptop computers to facilitate access to the Internet via wireless networks.The MSM6200 integrated circuit and system software is a highly integrated system for WCDMA/GSM/GPRS and includes Bluetooth connectivity and a host of multimediafeatures. Our next generation WCDMA product, the MSM6250 integrated circuit, is a cost-effective, feature-rich multimedia and position location product that operates on allGSM/GPRS and WCDMA networks worldwide. Through fiscal 2004, we have signed 25 separate WCDMA licensing agreements with device manufacturers that haveselected our MSM6200 and/or MSM6250 integrated circuits to support commercial WCDMA network deployments throughout China, Europe, South Korea, Taiwan and theUnited States.
In fiscal 2004, we announced the development of two new products to support advanced data services for High Speed Downlink Packet Access (HSDPA), a nextgeneration feature of the WCDMA standard. The two new products are the MSM6275 and the MSM6280 radioOne integrated circuits and system software which are highperformance products that deliver HSDPA, as well as roam on GSM/GPRS/EDGE systems. We expect to provide samples of our first high-performance HSDPA integratedcircuit, the MSM6275, to customers in the first quarter of fiscal 2005.
In fiscal 2004, we also announced the Convergence Platform, three chipset products that address all major 3G air interfaces and incorporates popular digital electronicsfunctionalities into wireless devices. The Convergence Platform includes the MSM7200, which supports WCDMA/HSDPA and GSM/GPRS/EDGE; the MSM7500, whichsupports CDMA2000 1xEV-DO and GSM/GPRS; and the MSM7600, which supports CDMA2000 1xEV-DO, CDMA2000 1xEV-DV, WCDMA/HSPA andGSM/GPRS/EDGE. The Convergence Platform products will enable portable business, high-fidelity entertainment, interactive 3D gaming and other advanced multimedia,connectivity and position location applications which are all easily integrated into communications devices to leverage the convenience of wireless.
QUALCOMM Technology Licensing Segment (QTL)
QTL grants licenses to use portions of our intellectual property portfolio, which includes certain patent rights essential to and/or useful in the manufacture and sale ofCDMA (including, without limitation, cdmaOne, CDMA2000 1X/1xEV-DO/1xEV-DV, TD-SCDMA and WCDMA) products. QTL receives revenue from license fees aswell as ongoing royalties based on worldwide sales by licensees of products incorporating or using our intellectual property. The license fees are generally nonrefundable andmay be paid in one or more installments. Ongoing royalties are nonrefundable and are generally based upon a percentage of the net selling price of licensed products.Revenues generated from royalties are subject to quarterly and annual fluctuations. QTL revenues comprised 27%, 26% and 29% of total consolidated revenues in fiscal 2004,2003 and 2002, respectively.
QUALCOMM Wireless & Internet Segment (QWI)
QWI revenues comprised 12%, 13% and 16% of total consolidated revenues in fiscal 2004, 2003 and 2002, respectively. The three divisions aggregated into QWI are:
QUALCOMM Internet Services (QIS)
The QIS division provides technology to support and accelerate the growth of the wireless data market. The BREW (Binary Runtime Environment for Wireless) platform isan application execution environment that provides an open platform for wireless devices, which means that BREW can be made to interface with many software applications,including those developed by others. The BREW platform is part of a complete package of products for wireless applications development, device configuration, applicationdistribution, and billing and payment. The BREW platform currently leverages the capabilities available in QCT’s integrated circuits and system software, enablingdevelopment of feature-rich applications and content while reducing memory overhead and maximizing
10
Table of Contents
system performance. The BREW product and services include the BREW SDK (software development kit) for developers, the BREW applications platform (i.e. softwareprograms) and interface tools for device manufacturers, and the BREW Distribution System that enables network operators to deliver applications and content to market whileproviding settlement of the billing and payment process. The BREW platform also includes BREW extensions, such as virtual machines, browsers and other interpreters thatprocess executable content, such as JAVA midlets, XHTML, HTML, JavaScript and Flash. Commercial BREW-based services enable consumers to customize their handsetsby downloading applications over-the-air from an operator’s application download server.
In November 2001, KTF, a leading wireless phone operator in South Korea, launched the world’s first commercial BREW-enabled applications service. KTF’s BREW-enabled wireless data service runs on a CDMA2000 1X high-speed data network as well as EV-DO. Thirty-six additional operators have since commercially launched BREWservices including Verizon Wireless, Alltel, US Cellular, and Midwest Cellular in the US, KDDI in Japan, Telstra in Australia, BellSouth in Colombia, VIVO in Brazil andChina Unicom, as well as other operators. Additionally, Reliance, the largest CDMA operator in India, has signed a definitive agreement to launch BREW services in therapidly growing India wireless market.
In January 2002, we announced a multi-year licensing agreement with Nextel for QChat, a technology developed to provide a reliable method of instant connection andtwo-way communication between users via their mobile phones. Using QChat, users may speak with other users virtually instantaneously at the push of a button. It enablesone-to-one (private) and one-to-many (group) calls over 3G CDMA networks. The technology also allows over-the-air upgrades of handset software, management of groupmembership by subscribers and ad-hoc creation of chat groups. It uses standard voice-over Internet protocol technologies. This means sending voice information in digitalform over Internet protocol-based data networks (including CDMA) in discrete packets rather than the traditional circuit-switched protocols of the public switched telephonenetwork.
QUALCOMM Wireless Business Solutions (QWBS)
We provide satellite and terrestrial-based two-way data messaging and position reporting services to transportation companies, private fleets, construction equipment fleetsand other enterprise companies. The satellite-based OmniTRACS mobile communications system was first introduced in the United States in 1988. Through September 2004,we have shipped over 520,000 satellite-based mobile communications systems (OmniTRACS and TruckMAIL) and over 22,000 terrestrial-based mobile communicationssystems (OmniExpress, T2 Untethered TrailerTRACS, GlobalTRACS and LINQ), which currently operate in over 39 countries. Message transmission and position trackingfor the OmniTRACS and TruckMAIL systems are provided by use of leased Ku-band and C-band transponders on commercially available geostationary earth orbit satellites.The OmniExpress, T2 Untethered TrailerTRACS, GlobalTRACS and LINQ systems use wireless digital terrestrial networks for messaging transmission, and the GPSconstellation for position tracking. These mobile communications systems help transportation companies, private fleets and construction equipment fleets improve theutilization of assets and increase efficiency and safety by improving communications between drivers, machines and dispatchers. System features include status updates, loadand pick-up reports, position reports at regular intervals, and vehicle and driving performance information.
In the United States and Mexico, we manufacture and sell OmniTRACS, TruckMAIL, OmniExpress, T2 Untethered TrailerTRACS and GlobalTRACS mobilecommunications equipment, sell related software packages and provide ongoing messaging and maintenance services. We have sold OmniTRACS, TruckMAIL andOmniExpress systems for use by private trucking fleets, service vans, marine vessels, trains, federal emergency vehicles, and for oil and gas pipeline control and monitoringsites. Our GlobalTRACS system is sold to the construction equipment industry, providing wireless access to equipment operating data and location, regardless of equipmenttype or manufacturer. Message transmissions for operations in the United States are formatted and processed at our Network Management Center in San Diego, California,with a fully-redundant backup Network Management Center located in Las Vegas, Nevada. We estimate the Network Management Center currently processes over sevenmillion messages and position reports per day.
In fiscal 2004, we began shipping T2 Untethered TrailerTRACS for private fleets and for-hire carriers. The T2 Untethered TrailerTRACS product is an advanced, stand-alone wireless system that provides rapid-status visibility into trailer locations and operational events and vehicle position reporting for improved fleet utilization and security.Features include sophisticated on-board hardware, advanced power management, complete network services, cargo and door sensors and data integration capabilities usingstate-of-the-art, multimode communications. We recently announced the availability of a Vehicle Immobilization Device and a Security Integration Package for the
11
Table of Contents
OmniTRACS satellite mobile communication system. The new security features offer enhanced protection to high-value and hazardous materials cargo and personnel.
In addition to the United States, the OmniTRACS system is currently operating throughout Europe and in the Middle East, Argentina, Brazil, Canada, Mexico, China,Japan and South Korea. Outside of the United States, Mexico and Europe, we work with distributors or through joint ventures to provide the OmniTRACS service andproducts in foreign markets. We generate revenues from the OmniTRACS system through license fees, sales of network products and terminals, messaging and service fees.Service providers that operate network management centers for a region under our granted licenses provide OmniTRACS messaging services.
QUALCOMM Government Technologies (QGOV)
The QGOV division (formerly known as QUALCOMM Digital Media, or QDM) provides development, hardware and analytical expertise to United States government(USG) agencies involving wireless communications technologies. We have developed, produced and shipped second generation CDMA secure wireless terrestrial phones forthe USG that operate in enhanced security modes (referred to as Type 1) and incorporate end-to-end encryption. Additionally, OmniTRACS products and services are beingmarketed for USG worldwide applications and were sold to the USG during fiscal 2004. Based on the percentage of QGOV revenues to our total consolidated revenues, theUSG is not a major customer.
The QGOV division included the former Digital Cinema business prior to June 2004. In June 2004, we were notified that a competing digital cinema compressiontechnology was selected by the motion picture studio consortium tasked with technology selection for digital cinema applications. As such, we are no longer pursuing theDigital Cinema business.
QUALCOMM Strategic Initiatives Segment (QSI)
We make strategic investments to promote the worldwide adoption of CDMA products and services for wireless voice and Internet data communications, including CDMAoperators, licensed device manufacturers and companies that support the design and introduction of new CDMA-based products or possess unique capabilities or technology.We make strategic investments in early stage companies and, from time to time, venture funds to support the adoption of CDMA and the use of the wireless Internet. InNovember 2001, we acquired controlling interests in two CDMA operators in Brazil (Vésper Operating Companies). We sold these two operators in fiscal 2004. We have asignificant investment in Inquam Limited (Inquam). Inquam owns, develops and manages wireless communications systems, either directly or indirectly, with the primaryintent of deploying CDMA-based technology.
Other Businesses
MediaFLO
We are developing the MediaFLO Content Distribution System (MDS) and FLO technology for delivery of low cost multimedia content to multiple subscribers. The MDSwill provide network operators the ability to enhance their multimedia service offering capabilities via efficient scheduling of content delivery. Network operators can utilizethe MDS with their current unicast networks and with multicast networks, which are soon to be available, operating on CDMA2000 1xEV-DO or WCDMA. The MDS is notair-interface specific and thus can be utilized by CDMA2000, WCDMA and FLO technology operators alike. FLO is a multicast technology specifically designed for marketswhere dedicated spectrum is available and where regulations permit high-power transmission, thereby reducing the number of towers required to provide market coverage.FLO technology is complementary to existing cellular networks because interactive services are supported within the mobile device using the CDMA2000 1X, 1xEV-DO orWCDMA cellular link and is intended as an enhancement of other multimedia multicasting technologies.
On November 1, 2004, we announced plans for our MediaFLO USA subsidiary, which is expected to begin commercial operations in 2006. MediaFLO USA will offer anationwide FLO technology based network as a shared resource for wireless operators in the United States and their customers. The wireless multimedia U.S. operator plansto use our nationwide 700 MHz spectrum and will be responsible for procuring and distributing the common content made available to all of its wireless operator customers.Distribution, marketing, billing and customer relationships are expected to remain with the wireless operator partners. Effective as of the beginning of fiscal 2005, we expectto present the operating results of MediaFLO USA in the QSI segment. We ultimately intend to spin off our ownership interest in MediaFLO USA to our stockholders.
12
Table of Contents
QUALCOMM Wireless Systems (QWS)
We provide services and sell products under new commercial agreements to Globalstar LLC (New Globalstar) and its service providers and other customers. NewGlobalstar operates a worldwide, low-Earth-orbit satellite-based telecommunications system. We received membership interests in New Globalstar in fiscal 2004 as a result ofits emergence from bankruptcy related to our claims as a creditor. At September 30, 2004, we held an approximate 3.8% interest in New Globalstar. On October 5, 2004, wereceived an additional ownership interest in New Globalstar as partial consideration for the sale of mobile phones. As a result, we currently hold an approximate 6.7% interestin New Globalstar.
QUALCOMM Consumer Products (QCP)
In February 2000, we sold our terrestrial-based CDMA wireless consumer phone business to Kyocera Wireless (Kyocera). As part of the agreement with Kyocera, weformed a subsidiary to provide services to Kyocera on a cost-plus basis to support Kyocera’s phone business. This arrangement expired in February 2003, and Kyoceraoffered employment to substantially all employees of the subsidiary. During fiscal 2003 and 2002, revenues from this arrangement were $39 million and $105 million,respectively, and earnings before taxes were not significant.
Research and Development
The wireless telecommunications industry is characterized by rapid technological change, requiring a continuous effort to enhance existing products and develop newproducts and technologies. Our research and development team has a strong and proven track record of innovation in wireless communications technologies. Our research anddevelopment expenditures in fiscal 2004, 2003 and 2002 totaled approximately $720 million, $523 million and $452 million, respectively. Research and developmentexpenditures in fiscal 2004, 2003 and 2002 were primarily related to integrated circuit product and other initiatives to support multimedia applications, high-speed wirelessInternet access and multimode, multiband, multinetwork products, including CDMA2000 1X/1xEV-DO, WCDMA and HSDPA.
In fiscal 2004, we opened three new research and development centers in North Carolina, Texas, Germany and India. The centers support our global CDMA developmentactivities and ongoing efforts to advance CDMA technologies. We intend to use our substantial engineering resources and expertise to develop new technologies, applicationsand services and make them available to licensees to help grow the wireless telecommunications market and generate new or expanded licensing opportunities. In addition tointernally sponsored research and development, we perform contract research and development for various government agencies and commercial contractors.
Sales and Marketing
QCT markets and sells products in the United States through a sales force based in San Diego, California, and internationally through a direct sales force based in SouthKorea, Japan, China, Taiwan, Germany and the United Kingdom. QCT’s sales and marketing strategy is to achieve design wins with technology leaders in our targetedmarkets by, among other things, providing high performance products combined with superior field application and engineering support.
The QIS division of QWI develops and sells business-to-business products and services to companies worldwide. The sales and marketing team is headquartered in SanDiego with offices worldwide. The QIS sales and marketing strategy is to enter into contracts with companies in target markets by providing comprehensive technology andservices to help them provide next-generation wireless data services that combine wireless Internet, data and voice capabilities.
The QWBS division of QWI markets and sells products through a sales force, partnerships, and distributors based in the United States, Europe, the Middle East, Argentina,Brazil, Canada, China, Japan, South Korea and Mexico. QWBS’s sales and marketing strategy is to enter into contracts with companies in our target markets by providinghigh-value wireless fleet management products and services to the transportation and logistics and construction equipment industries.
Marketing activities include participation in technical conferences, business cases, competitive analyses and other marketing collateral, publication of customerdeployments, new product information and educational articles in industry journals, maintenance of our World Wide Web site and direct marketing to prospective customersand prospective licensees. We also developed and maintain a World Wide Web site (www.3Gtoday.com) dedicated to highlighting commercial 3G wireless services andproducts around the world.
13
Table of Contents
Our CDMA Development Center in China is a 36,000 square foot facility in Beijing in what is popularly known as ‘China’s Silicon Valley.’ The center provides training,support and equipment testing services primarily to manufacturers and mobile operators in China, as well as supporting research and development of 3G wireless standardsbased on CDMA. The center houses the QUALCOMM CDMA University which offers classroom and hands-on training programs on CDMA2000 and WCDMA. The centeralso offers a highly-integrated test program designed to enable time and cost savings when bringing products to market. The center and its staff are focused on providing Chinawith the resources to enable the most timely development of its mobile communications industry using our technologies and applications, such as cdmaOne, CDMA20001X/1xEV-DO, GSM1x and gpsOne. The center also supports the transfer of certain hardware and software technologies for product development and manufacturing tolicensed manufacturers, as well as network design and optimization methods to operators and government bodies in China.
Competition
Competition in the wireless telecommunications industry in the United States and throughout the world continues to increase at a rapid pace, as businesses and foreigngovernments realize the market potential of telecommunications services. We have facilitated competition in the CDMA market by licensing a large number of manufacturers.Although we have attained a major position in the industry, many of our current and potential competitors may have advantages over us, including:
• longer operating histories and presence in key markets;
• greater name recognition;
• access to larger customer bases; and
• greater sales and marketing, manufacturing, distribution, technical and other resources than we have.
These competitors may have more established relationships and greater technical, marketing, sales and distribution capabilities and greater access to channels in marketsnot currently deploying wireless communications technology. These competitors also have established or may establish financial or strategic relationships among themselvesor with our existing or potential customers, resellers or other third parties. These relationships may affect customers’ decisions to purchase products or license technologyfrom us. Accordingly, new competitors or alliances among competitors could emerge and rapidly acquire significant market share to our detriment. In addition, many of thesecompanies are licensees of our technology and have established market positions, trade names, trademarks, patents, copyrights, intellectual property rights and substantialtechnological capabilities. We may face competition throughout the world with new technologies and services introduced in the future as additional competitors enter themarket place for products based on 3G standards. Although we intend to continuously develop improvements to existing technologies, as well as potentially new technologies,there may be a continuing competitive threat from companies introducing alternative versions of wireless technologies. We also expect that the price we charge for ourproducts and services may continue to decline as competition intensifies.
QCT Segment. The markets in which our QCT segment operates are intensely competitive. QCT competes worldwide with a number of United States and internationalsemiconductor designers and manufacturers. As a result of the trend toward global expansion by foreign and domestic competitors and technological and public policychanges, we anticipate that additional competitors will enter this market. We believe that the principal competitive factors for CDMA integrated circuit providers to ouraddressed markets are product performance, level of integration, quality, compliance with industry standards, price, time to market, system cost, design and engineeringcapabilities, new product innovation and customer support. The specific bases on which we compete against alternative CDMA integrated circuit providers vary by productplatform. We also compete against alternative wireless communications technologies including, but not limited to, GSM/GPRS/EDGE, TDMA and analog.
QCT’s current competitors include major semiconductor companies such as Texas Instruments, STMicroelectronics, Freescale, VIA Telecom, NEC, Infineon and Philips,as well as major telecommunication equipment companies such as Motorola, Nokia, Ericsson, Samsung and Matsushita, who design their own integrated circuits and softwarefor certain products. QCT also faces competition from some start-up ventures.
Our competitors may devote a significantly greater amount of their financial, technical, marketing and other resources to aggressively market competitivetelecommunications systems or to develop and adopt competitive digital cellular technologies, and those efforts may materially and adversely affect QCT. Moreover,competitors may
14
Table of Contents
offer more attractive product pricing or financing terms than we do as a means of gaining access to the wireless telecommunications markets.
We have entered into licensing agreements with certain companies, including Philips, Motorola, Lucent, Texas Instruments, VIA Telecom, PrairieComm, NEC, EoNexTechnologies and Infineon. These licenses permit the licensees to manufacture CDMA-based integrated circuits using certain of our intellectual property for sale to CDMA-based phone manufacturers. In exchange for granting the licenses, we are entitled to receive license fees, royalties (payable as a percentage of the selling price of theintegrated circuits) and/or royalty-free cross-licenses, which allow us to use these companies’ CDMA and, in some cases, non-CDMA intellectual property for specifiedpurposes. In every case, the phone manufacturers’ sales of CDMA-based phones are subject to the payment of royalties to us on the products into which the integrated circuitsare incorporated in accordance with the manufacturers’ separate licensing arrangements with us. We license our CDMA intellectual property to the competitors of our QCTsegment to support the deployment of CDMA-based systems and technologies worldwide in order to grow our royalty revenues from customers licensed to sell CDMAphones and equipment. We believe that, if the use of CDMA expands sufficiently, QCT’s business will also grow, even if we lose market share. Also, our QTL segment willreceive royalties from sales of CDMA integrated circuits by certain competitors of QCT. To date, most cdmaOne and CDMA2000 phone manufacturer licensees have electedto purchase their CDMA-based integrated circuits from us.
QTL Segment. As part of our strategy to generate new and ongoing licensing revenues, significant resources are allocated to develop leading edge technology for thetelecommunications industry. We face competition in the development of intellectual property for future generations of digital wireless communications technology andservices.
On a worldwide basis, we currently compete primarily with two digital wireless telecommunications technologies, TDMA and GSM/GPRS. TDMA has been deployedprimarily in the United States and Latin America. Variations of TDMA have also been deployed in other countries, such as PDC (Personal Digital Cellular) in Japan and PAS(Personal Access System) in China. GSM has been extensively utilized in Europe, much of Asia other than Japan and Korea, and certain other markets. To date, GSM hasbeen more widely adopted than CDMA, however, CDMA technologies have been adopted for all third generation wireless systems. WCDMA, a technology designed as analternative to CDMA2000, is an approved 3G standard and has been adopted by several European, Japanese and United States operators. We expect that, although aconsiderable number of limited systems have been placed in service (e.g., the largest commercial WCDMA system is that of NTT DoCoMo in Japan with over six millionsubscribers as of September 30, 2004), widespread WCDMA networks will not begin commercial operation until late 2004 or later. In addition, many GSM operators havedeployed or are expected to deploy GPRS, a packet data technology, as a 2.5G bridge technology, and some GSM operators plan to deploy EDGE, while waiting for thirdgeneration WCDMA to become available and/or more cost effective for their system. A limited number of operators have started testing OFDMA (Orthogonal FrequencyDivision Multiplexing Access) technology, a multi-carrier transmission technique not based on CDMA technology, that divides the available spectrum into many carriers,with each carrier being modulated at a low data rate relative to the combined rate for all carriers.
QWI Segment. Existing competitors of our QWBS division offering alternatives to our OmniTRACS, TruckMAIL, OmniExpress, T2 Untethered TrailerTRACS,GlobalTRACS, QConnect, EutelTRACS, OmniOne and LINQ system products are aggressively pricing their products and services and could continue to do so in the future.In addition, these competitors are offering new value-added products and services similar in many cases to our existing or developing technologies. Emergence of newcompetitors, particularly those offering low cost terrestrial-based products and current as well as future satellite-based systems, may impact margins and intensify competitionin new markets. Similarly, some original equipment manufacturers of trucks and truck components are beginning to
15
Table of Contents
offer built-in, on-board communications and position location reporting systems that may impact our margins and intensify competition in our current and new markets.
Competitors to our BREW platform are continuing to develop their products with a focus on client, provisioning, and billing products and services. These competitors areattempting to offer value added products and services similar, in many cases, to our existing or developing BREW technologies. In some cases, competitors are continuing toexplicitly attempt to displace only certain components or areas of the greater BREW offering, such as only the runtime client/device environment portion of BREW. Inaddition, certain competitors in the computing industry and device manufacturing space are now beginning to more aggressively attempt to replicate the entire BREW systemoffering that includes both runtime device environments and billing/distribution systems. Similarly, some operators are creating internally developed solutions by piecingtogether several components or are being pressured by governments to adopt alternatives to our products and services. Emergence of these and other new competitors mayadversely impact our margins and market share.
Patents, Trademarks and Trade Secrets
We rely on a combination of patents, copyrights, trade secrets, trademarks and proprietary information to maintain and enhance our competitive position. We have beengranted more than 1,300 United States patents and have over 2,000 patent applications pending in the United States. The vast majority of such patents and patent applicationsrelate to our CDMA digital wireless communications technology. We also have and will continue to actively file for patent protection outside the United States and havereceived numerous CDMA patents with broad coverage throughout most of the world, including China, Japan, South Korea, Europe, Brazil, India and elsewhere.
The standards bodies and the ITU have been informed that we hold essential intellectual property rights for the 3G standards that are based on CDMA. We have committedto the ITU to license our essential patents for these CDMA standards on a fair and reasonable basis free from unfair discrimination.
Under our CDMA license agreements, licensees are generally required to pay us a non-refundable license fee as well as ongoing royalties based on a percentage of the netselling price of CDMA subscriber, infrastructure, test and integrated circuits products. License fees are paid in one or more installments, while royalties generally continuethroughout the life of the licensed patents. Our CDMA license agreements generally provide us rights to use certain of our licensees’ technology and intellectual propertyrights to manufacture and sell certain CDMA products (e.g. CDMA application specific integrated circuits or ASICs, subscriber units and/or infrastructure equipment). Inmost cases, our use of our licensees’ technology and intellectual property is royalty free. However, under some of the licenses, if we incorporate certain of the licensedtechnology or intellectual property into certain of our products, we are obligated to pay royalties on the sale of such products. Under their existing agreements with us, twoentities are entitled to share in a percentage of the royalty revenues that we receive from third parties for their sale of certain CDMA products. Our sharing obligations underone of these arrangements expire in fiscal 2005 and the other in fiscal 2006.
As part of our strategy to generate licensing revenues and support worldwide adoption of our CDMA technology, we license to other companies the rights to design,manufacture and sell products utilizing certain portions of our CDMA intellectual property. The following table lists the majority of our current CDMA licensees:
16

Table of Contents
SubscriberAL Communications Co., Ltd.Alps Electric Co., Ltd.Amoi Mobile Co., Ltd.Appeal Telecom Co., Ltd.Axesstel, Inc.Axio Wireless, Inc.Beijing Telecommunications Equipment FactoryBellwave, Inc.Benq CorporationCasio Computer Co., Ltd.CEC Telecom Co., Ltd.Compal Electronics, Inc.Curitel Communications, Inc.Cyberlane Inc.Dalian Daxian Group Co., Ltd.Dalian Huanyu Mobile Technological Co., Ltd.Datang Telecom Technology Co., Ltd.Denso CorporationeAnywhere Tech, Inc.Eastern Communications Co., Ltd.ERON Technologies CorporationETRONICS CorporationFlextronics International Ltd.Fujitsu LimitedGarmin CorporationGiga Telecom, Inc.Glenayre Electronics, Inc.Growell Telecom Co., Ltd.Guangzhou Southern Hi-Tech Co., Ltd.Haier Group CompanyHigh Tech Computer CorporationHisense Group Co., Ltd.Hitachi Kokusai Electric Inc.Hitachi, Ltd.Hon Hai Precision Industry Co., Ltd.Huawei Technologies Co., Ltd.Hyundai Syscomm, Inc.Inventec Appliances Corp.Kenwood CorporationKoninklijke Philips Electronics N.V.Konka Group Co., Ltd.KTF Technologies Inc.Kyocera CorporationLangchao Group Co., Ltd.Legend Mobile Communications Technology Ltd.LG Electronics, Inc.Lucent Technologies Inc.Matsushita Electronic Components Co., Ltd.Maxon Telecom Co., Ltd.Mitsubishi Electric CorporationMobile System Technologies, Inc.Motorola, Inc.NEC CorporationNG Industrial Ltda.Ningbo Bird Co., Ltd.NOKIA CorporationNovatel Wireless Inc.Option NV S.A.palmOne, Inc.Panasonic Mobile Communications Co., Ltd.Pantech Co., Ltd.Research In Motion LimitedSamsung Electronics Co.Sanyo Electric Co., Ltd.Seiko Instruments Inc.Sejin Electron Inc.Sendum Wireless CorporationShanghai Huntel Technologies Co., Ltd.SHARP CorporationSiemens AktiengesellschaftSierra Wireless, Inc.SK Telecom Co., Ltd.Sony CorporationSynertek, Inc. -Sewon Telecom Ltd. - -Telson Electronics Co., Ltd. - -Wide Telecom Co., Ltd.TCL CorporationTechfaith Wireless Communication Technology LimitedTelefonaktiebolaget LM EricssonTeleion Wireless, Inc.
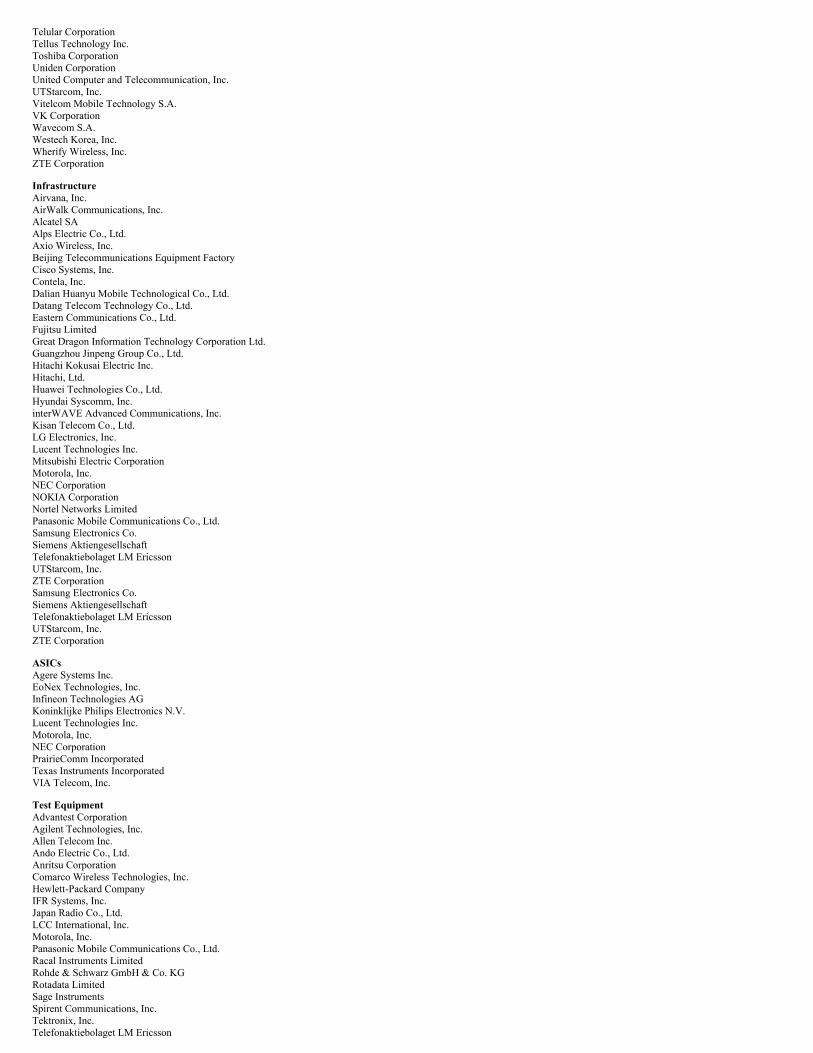
Telular CorporationTellus Technology Inc.Toshiba CorporationUniden CorporationUnited Computer and Telecommunication, Inc.UTStarcom, Inc.Vitelcom Mobile Technology S.A.VK CorporationWavecom S.A.Westech Korea, Inc.Wherify Wireless, Inc.ZTE Corporation
InfrastructureAirvana, Inc.AirWalk Communications, Inc.Alcatel SAAlps Electric Co., Ltd.Axio Wireless, Inc.Beijing Telecommunications Equipment FactoryCisco Systems, Inc.Contela, Inc.Dalian Huanyu Mobile Technological Co., Ltd.Datang Telecom Technology Co., Ltd.Eastern Communications Co., Ltd.Fujitsu LimitedGreat Dragon Information Technology Corporation Ltd.Guangzhou Jinpeng Group Co., Ltd.Hitachi Kokusai Electric Inc.Hitachi, Ltd.Huawei Technologies Co., Ltd.Hyundai Syscomm, Inc.interWAVE Advanced Communications, Inc.Kisan Telecom Co., Ltd.LG Electronics, Inc.Lucent Technologies Inc.Mitsubishi Electric CorporationMotorola, Inc.NEC CorporationNOKIA CorporationNortel Networks LimitedPanasonic Mobile Communications Co., Ltd.Samsung Electronics Co.Siemens AktiengesellschaftTelefonaktiebolaget LM EricssonUTStarcom, Inc.ZTE CorporationSamsung Electronics Co.Siemens AktiengesellschaftTelefonaktiebolaget LM EricssonUTStarcom, Inc.ZTE Corporation
ASICsAgere Systems Inc.EoNex Technologies, Inc.Infineon Technologies AGKoninklijke Philips Electronics N.V.Lucent Technologies Inc.Motorola, Inc.NEC CorporationPrairieComm IncorporatedTexas Instruments IncorporatedVIA Telecom, Inc.
Test EquipmentAdvantest CorporationAgilent Technologies, Inc.Allen Telecom Inc.Ando Electric Co., Ltd.Anritsu CorporationComarco Wireless Technologies, Inc.Hewlett-Packard CompanyIFR Systems, Inc.Japan Radio Co., Ltd.LCC International, Inc.Motorola, Inc.Panasonic Mobile Communications Co., Ltd.Racal Instruments LimitedRohde & Schwarz GmbH & Co. KGRotadata LimitedSage InstrumentsSpirent Communications, Inc.Tektronix, Inc.Telefonaktiebolaget LM Ericsson

UbiNetics Holdings plcWilltek Corporation
Non-Standard SystemsSOMA Networks, Inc.
Cable and RepeatersEC Telecom Inc.EMS Technologies, Inc.United Computer and Telecommunication, Inc.
17
Table of Contents
Employees
As of September 30, 2004, we employed approximately 7,600 full-time, part-time and temporary employees. During fiscal 2004, the number of employees increased byapproximately 200, despite a reduction of approximately 1,000 employees in Brazil related to discontinued operations, primarily due to substantial increases in engineeringresources.
Available Information
Our Internet address is www.qualcomm.com. There we make available, free of charge, our annual report on Form 10-K, quarterly reports on Form 10-Q, current reports onForm 8-K and any amendments to those reports, as soon as reasonably practicable after we electronically file such material with, or furnish it to, the Securities and ExchangeCommission (SEC). Our SEC reports can be accessed through the investor relations section of our Web site. The information found on our Web site is not part of this or anyother report we file with or furnish to the SEC.
The public may read and copy any materials that we file with the SEC at the SEC’s Public Reference Room located at 450 Fifth Street NW, Washington, DC 20549. Thepublic may obtain information on the operation of the Public Reference Room by calling the SEC at 1-800-SEC-0330. The SEC also maintains electronic versions of ourreports on its website at www.sec.gov.
Executive Officers
Our executive officers and their ages as of September 30, 2004 are as follows:
Irwin Mark Jacobs, age 70, one of the founders of the Company, has served as Chairman of the Board of Directors and Chief Executive Officer of the Company since itbegan operations in July 1985. He served as the Company’s president prior to May 1992. Before joining the Company, Dr. Jacobs was executive vice president and a directorof M/A-COM. From October 1968 to April 1985, Dr. Jacobs held various executive positions at LINKABIT (M/A-COM LINKABIT after August 1980), a company he co-founded. During most of his period of service with LINKABIT, Dr. Jacobs was chairman, president and chief executive officer and was at all times a director. Dr. Jacobsreceived his B.E.E. degree from Cornell University and his M.S. and Sc.D. degrees from the Massachusetts Institute of Technology. Dr. Jacobs is a member of the NationalAcademy of Engineering and the American Academy of Arts and Sciences and was awarded the National Medal of Technology in 1994.
Anthony S. Thornley, age 58, was appointed President in February 2002 and Chief Operating Officer of the Company in July 2001. He served as Chief Financial Officerfrom March 1994 to February 2002 and as Executive Vice President from November 1997 to July 2001. Prior to joining the Company, he was with Nortel, atelecommunications equipment manufacturer, for sixteen years in various financial and information systems management positions, including Vice President Finance and IS,Public Networks, Vice President Finance NT World Trade and Corporate Controller Nortel Limited. He has also worked for Coopers and Lybrand. Mr. Thornley is a directorof Callaway Golf. Mr. Thornley received his B.S. degree in Chemistry from the University of Manchester, England.
William E. Keitel, age 51, was appointed Executive Vice President in December 2003, and has served as Chief Financial Officer since February 2002. He joined theCompany in 1996 and has worked in senior management roles within corporate finance, serving as Senior Vice President and Corporate Controller from May 1999 toFebruary 2002, and as Vice President and Corporate Controller from October 1997 to May 1999. Previously, Mr. Keitel served in various senior finance roles for Nortel, atelecommunications equipment manufacturer, from 1983 until 1996. Mr. Keitel received a M.B.A. from Arizona State University and a B.A. degree in BusinessAdministration from the University of Wisconsin.
Steven R. Altman, age 43, has served as Executive Vice President of the Company since November 1997. He also has served as President of the Company’s TechnologyLicensing division, which is responsible for, among other things, licensing the Company’s intellectual property, since September 1995. He served as General Counsel of theCompany from October 1989 through September 2000. He was named Vice President in December 1992, was promoted to Senior Vice President in February 1996 and waspromoted to Executive Vice President in November 1997. Prior to joining the Company in October 1989, he was a business lawyer in the San Diego law firm of Gray, Cary,Ware & Freidenrich, where he specialized in intellectual property, mergers and acquisitions, securities and general corporate matters. Mr. Altman received a B.S. degree fromNorthern Arizona University and a J.D. from the University of San Diego.
18

Table of Contents
Roberto Padovani, age 50, was appointed Executive Vice President and Chief Technology Officer in January 2002. He joined the Company in 1986 where he has beeninvolved in the design, development and standardization of second and third generation CDMA systems. Prior to joining QUALCOMM, Dr. Padovani was involved in thedesign and development of satellite communication systems, secure video systems and error-correcting coding equipment at M/A-COM LINKABIT in San Diego.Dr. Padovani received a Laureate degree from the University of Padova, Italy and a M.S. and Ph.D. degrees from the University of Massachusetts, Amherst, all in Electricaland Computer Engineering. He is a Fellow of the Institute of Electrical and Electronics Engineers.
Paul E. Jacobs, age 41, has served as Group President of the QUALCOMM Wireless & Internet Group since July 2001. He oversees the QUALCOMM TechnologyLicensing division, the QUALCOMM Internet Services division, the QUALCOMM Wireless Business Solutions division and the QUALCOMM Government Technologiesdivision along with Corporate Marketing, Standards and the QUALCOMM Technology and Ventures division. He has served as Executive Vice President of the Companysince February 2000. He served as President of the Consumer Products division from February 1997 to February 2000 and as Senior Vice President of the Company and VicePresident and General Manager of the Consumer Products division from April 1995 to February 1997. He joined the Company in September 1990 as Senior Engineer.Dr. Jacobs holds a B.S. degree in Electrical Engineering and Computer Science, M.S. degree in Electrical Engineering and Ph.D. degree in Electrical Engineering andComputer Science from the University of California, Berkeley. Dr. Paul Jacobs is the son of Dr. Irwin Mark Jacobs, Chairman of the Board of Directors and Chief ExecutiveOfficer of the Company.
Sanjay K. Jha, age 41, was appointed Group President in February 2004 and Executive Vice President in December 2003. He has served as President of QUALCOMMCDMA Technologies since January 2003. He served as Senior Vice President from August 2000 to March 2002 and subsequently, Senior Vice President and GeneralManager from March 2002 to January 2003 of QUALCOMM Technologies & Ventures. From October 1996 to July 2000, Dr. Jha led the integrated circuits engineering groupthrough five generations of baseband and RF chipset development within QUALCOMM CDMA Technologies from October 1996 to July 2000 in various capacities: asDirector of Engineering from October 1996 to May 1997, as Vice President of Engineering from May 1997 to June 1998 and finally as Senior Vice President of Engineering.He joined QUALCOMM in 1994 as a Senior Engineer working on Globalstar and then on MSM2200, the first commercial CDMA handset baseband chip. Prior to joiningQUALCOMM, Dr. Jha worked in various lead design engineering roles in the semiconductor industry. Dr. Jha holds a Ph.D. in EEE from Strathclyde University, Scotlandand a B.S. degree in Engineering from the University of Liverpool, England.
Jeffrey A. Jacobs, age 38, was appointed President of QUALCOMM Global Development, an organization responsible for proliferating CDMA throughout the world, inMay 2001. He served as Senior Vice President of Business Development from June 1999 to May 2001 and Vice President of Business Development from November 1997 toJune 1999. Mr. Jacobs founded the QUALCOMM Eudora division in 1993 and served as Vice President and General Manager of the division from August 1995 toNovember 1997. He joined the Company in May 1986 as a market analyst and held other management positions at the Company through August 1995. Mr. Jacobs holds aB.A. degree in International Economics from the University of California, Berkeley. Mr. Jeffrey Jacobs is the son of Dr. Irwin Mark Jacobs, Chairman of the Board ofDirectors and Chief Executive Officer of the Company.
Louis Lupin, age 49, has served as Senior Vice President and General Counsel of the Company since September 2000. He served as Senior Vice President, ProprietaryRights Counsel from May 1998 to September 2000, Vice President, Proprietary Rights Counsel from April 1996 to May 1998 and Senior Legal Counsel from February 1995to April 1996. Prior to joining the Company in 1995, he was a partner with Cooley, Godward, Castro, Huddleson and Tatum where he focused on intellectual propertylitigation in the telecommunications, software and biotechnology industry. Mr. Lupin received his B.A. degree from Swarthmore College and a J.D. from Stanford LawSchool. He is a member of the Executive Committee of the Board of Visitors of Stanford Law School.
Dr. Daniel Sullivan, age 53, was appointed Executive Vice President of Human Resources in August 2001. He served as Senior Vice President of Human Resources fromFebruary 1996 to August 2001, Vice President of Human Resources from February 1994 to February 1996 and Director of Human Resources from April 1992 toFebruary 1994. Prior to joining QUALCOMM, Dr. Sullivan served in senior human resources management roles at leading companies in the technology sector. Dr. Sullivancurrently serves as a member of the board of directors for the San Diego State University Foundation, a member of the board of directors for the San Diego CommunityFoundation, as an advisory board member of the University of California — San Diego School of Engineering’s Corporate Affiliate Board, and as an advisory board memberto San Diego State University’s Center for Entrepreneurial Studies (EMC).
19
Table of Contents
Dr. Sullivan holds a Ph.D. in Organization Communication from the University of Nebraska. He also holds B.S. and M.A. degrees in Communication from Illinois StateUniversity and West Virginia University, respectively.
RISK FACTORS
You should consider each of the following factors as well as the other information in this Annual Report in evaluating our business and our prospects. The risks anduncertainties described below are not the only ones we face. Additional risks and uncertainties not presently known to us or that we currently consider immaterial may alsoimpair our business operations. If any of the following risks actually occur, our business and financial results could be harmed. In that case the trading price of our commonstock could decline. You should also refer to the other information set forth in this Annual Report, including our financial statements and the related notes.
Risks Related to Our Businesses
If CDMA technology is not widely deployed, our revenues may not grow as anticipated.
We focus our business primarily on developing, patenting and commercializing CDMA technology for wireless telecommunications applications. Other digital wirelesscommunications technologies, particularly GSM technology, have been more widely deployed than CDMA technology. If CDMA technology does not become the preferredwireless communications industry standard in the countries where our products and those of our customers and licensees are sold, or if wireless operators do not select CDMAfor their networks or update their current networks to any CDMA-based third generation technology, our business and financial results could suffer.
To increase our revenues and market share in future periods, we are dependent upon the commercial deployment of third generation (3G) wireless communicationsequipment, products and services based on our CDMA technology. Although network operators have commercially deployed CDMA2000 1X and WCDMA, we cannotpredict the timing or success of further commercial deployments of CDMA2000 1X, WCDMA or other CDMA systems. If existing deployments are not commerciallysuccessful, or if new commercial deployments of CDMA2000 1X, WCDMA or other CDMA systems are delayed or unsuccessful, our business and financial results may beharmed. In addition, our business could be harmed if network operators deploy competing technologies or switch existing networks from CDMA to GSM or if networkoperators introduce new technologies. For example, a limited number of operators have started testing OFDMA (Orthogonal Frequency Division Multiplexing Access)technology, a multi-carrier transmission technique not based on CDMA technology, that divides the available spectrum into many carriers, with each carrier being modulatedat a low data rate relative to the combined rate for all carriers.
Our business and the deployment of CDMA technology are dependent on the success of our customers and licensees. Our customers and licensees may incur loweroperating margins on CDMA-based products than on products using alternative technologies due to greater competition in the CDMA-based market, lack of productimprovements or other factors. If CDMA handset and/or infrastructure manufacturers exit the CDMA market, the deployment of CDMA technology could be negativelyaffected, and our business could suffer.
Our three largest customers as of September 30, 2004 accounted for 40%, 44% and 36% of consolidated revenues in fiscal 2004, 2003 and 2002, respectively. The loss of anyone of our major customers or any reduction in the demand for devices utilizing our CDMA technology could reduce our revenues and harm our ability to achieve or sustaindesired levels of operating results.
QCT Segment. The loss of any one of our QCT segment’s significant customers or the delay, even if only temporary, or cancellation of significant orders from any of thesecustomers would reduce our revenues in the period of the cancellation or deferral and could harm our ability to achieve or sustain desired levels of profitability. Accordingly,unless and until our QCT segment diversifies and expands its customer base, our future success will significantly depend upon the timing and size of future purchase orders, ifany, from these customers. Factors that may impact the size and timing of orders from customers of our QCT segment include, among others, the following:
• the product requirements of these customers;
• the financial and operational success of these customers;
• the success of these customers’ products that incorporate our products;
20
Table of Contents
• value added features which drive replacement rates;
• shortages of key products and components;
• fluctuations in channel inventory levels;
• the success of products sold to our customers by licensed competitors;
• the rate of deployment of new technology by the network operators and the rate of adoption of new technology by the end consumers;
• the extent to which certain customers successfully develop and produce CDMA-based integrated circuits and system software to meet their own needs;
• general economic conditions;
• changes in governmental regulations in countries where we or our customers currently operate or plan to operate; and
• widespread illness.
QTL Segment. Our QTL segment derives royalty revenues from sales of CDMA products by our licensees. We derive a significant portion of our royalty revenue from alimited number of licensees. Our future success depends upon the ability of our licensees to develop, introduce and deliver high volume products that achieve and sustainmarket acceptance. We have little or no control over the sales efforts of our licensees, and we cannot assure you that our licensees will be successful or that the demand forwireless communications devices and services offered by our licensees will continue to increase. Any reduction in the demand for or any delay in the development,introduction or delivery of wireless communications devices utilizing our CDMA technology could have a material adverse effect on our business. Weakness in the value offoreign currencies in which our customers’ products are sold may reduce the amount of royalties payable to us in U.S. dollars.
We depend upon a limited number of third party manufacturers to provide component parts, subassemblies and finished goods for our products. Any disruptions in theoperations of, or the loss of, any of these third parties could harm our ability to meet our delivery obligations to our customers and increase our cost of sales.
Our ability to meet customer demands depends, in part, on our ability to obtain timely and adequate delivery of parts and components from our suppliers and ourmanufacturing capacity. A reduction or interruption in component supply, an inability of our partners to react to rapid shifts in demand or a significant increase in componentprices could have a material adverse effect on our business or profitability. Component shortages could adversely affect our ability and that of our customers to ship productson a timely basis and our customers’ demand for our products. Any such shipment delays or declines in demand could reduce our revenues and harm our ability to achieve orsustain desired levels of profitability. Additionally, failure to meet customer demand in a timely manner could damage our reputation and harm our customer relationshipspotentially resulting in reduced market share.
QCT Segment. We subcontract all of the manufacturing and assembly, and most of the testing, of our integrated circuits. We depend upon a limited number of third partiesto perform these functions, some of which are only available from single sources with which we do not have long-term contracts. IBM, Taiwan Semiconductor ManufacturingCo. and United Microelectronics are the primary foundry partners for our family of baseband integrated circuits. IBM, Freescale (formerly Motorola Semiconductor) andAtmel are the primary foundry partners for our family of radio frequency and analog integrated circuits. Our reliance on a sole-source vendor primarily occurs during the start-up phase of a new product. Once a new product reaches a significant volume level, we typically establish alternative suppliers for technologies that we consider critical. Ourreliance on sole or limited-
21
Table of Contents
source vendors involves risks. These risks include possible shortages of capacity, product performance shortfalls and reduced controls over delivery schedules, manufacturingcapability, quality assurance, quantity and costs. During fiscal 2004, we experienced supply constraints which resulted in our inability to meet certain customer demands. Toensure better delivery of parts and components from our suppliers, we have increased and extended our firm orders to our suppliers. Additionally, we continue to add capacityat existing suppliers, as well as evaluate potential new suppliers to augment our needs. We expect costs of certain integrated circuit products could increase as a result of ourefforts to increase the availability of components in short supply. We work closely with customers to expedite their processes for evaluating products from our new foundrysuppliers; however, in some instances, transition to new product supply may cause a temporary decline in shipments of specific products to individual customers. To theextent that our firm commitments from our manufacturers are insufficient to meet demand over a specific time period or in any specific quantity, our manufacturers mayallocate, and in the past have allocated, capacity to the production of other products while reducing deliveries to us on short notice.
Our operations may also be harmed by lengthy or recurring disruptions at any of the facilities of our manufacturers and may be harmed by disruptions in the distributionchannels from our suppliers and to our customers. These disruptions may include labor strikes, work stoppages, widespread illness, terrorism, war, fire, earthquake, floodingor other natural disasters. These disruptions could cause significant delays in shipments until we are able to shift the products from an affected manufacturer to anothermanufacturer. The loss of a significant third-party manufacturer or the inability of a third-party manufacturer to meet performance and quality specifications or deliveryschedules could harm our ability to meet our delivery obligations to our customers.
In addition, one or more of our manufacturers may obtain licenses from us to manufacture CDMA integrated circuits that compete with our products. In this event, themanufacturer could elect to allocate scarce components and manufacturing capacity to their own products and reduce deliveries to us. In the event of a loss of or a decision tochange a key third-party manufacturer, qualifying a new manufacturer and commencing volume production or testing could involve delay and expense, resulting in lostrevenues, reduced operating margins and possible loss of customers.
QWI Segment. Several of the critical subassemblies and parts used in our QWBS division’s existing and proposed products are currently available only from third-partysingle or limited sources. These include items such as electronic and radio frequency components, and other sophisticated parts and subassemblies which are used in theOmniTRACS, TruckMAIL, OmniExpress, T2 Untethered TrailerTRACS, GlobalTRACS and EutelTRACS products. These third parties include companies such as TycoInternational (M/A Com), Rakon, Mini-Circuits, Cambridge Tool & Mfg., Andrew Corporation, American Design, Deutsch ECD, PCI Limited, KeyTronic EMS, DanaherMotors, Fujitsu Corporation, Tectrol, uBlox, Navman NZ, Eagle-Picher Industries, Sony/Ericsson and Sharp Corporation. Our reliance on sole or limited source vendorsinvolves risks. These risks include possible shortages of certain key components, product performance shortfalls, and reduced control over delivery schedules, manufacturingcapability, quality and costs. In the event of a long-term supply interruption, alternate sources could be developed in a majority of the cases. The inability to obtain adequatequantities of significant compliant materials on a timely basis could have a material adverse effect on our business, operating results, liquidity and financial position.
We are subject to the risks of our and our licensees conducting business outside the United States.
A significant part of our strategy involves our continued pursuit of growth opportunities in a number of international markets. We market, sell and service our productsinternationally. We have established sales offices around the world. We expect to continue to expand our international sales operations and enter new international markets.This expansion will require significant management attention and financial resources to successfully develop direct and indirect international sales and support channels, andwe cannot assure you that we will be successful or that our expenditures in this effort will not exceed the amount of any resulting revenues. If we are not able to maintain orincrease international market demand for our products and technologies, we may not be able to maintain a desired rate of growth in our business.
Consolidated revenues from international customers as a percentage of total revenues were 79%, 77% and 69% in fiscal 2004, 2003 and 2002, respectively. Because mostof our foreign sales are denominated in U.S. dollars, our products and those of our customers and licensees that are sold in U.S. dollars become less price-competitive ininternational markets if the value of the U.S. dollar increases relative to foreign currencies.
22
Table of Contents
In many international markets, barriers to entry are created by long-standing relationships between our potential customers and their local service providers and protectiveregulations, including local content and service requirements. In addition, our pursuit of international growth opportunities may require significant investments for anextended period before we realize returns, if any, on our investments. Our business could be adversely affected by a variety of uncontrollable and changing factors, including:
• changes in legal or regulatory requirements, including regulations governing the materials used in our products;
• difficulty in protecting or enforcing our intellectual property rights in a particular foreign jurisdiction;
• our inability to succeed in significant foreign markets, such as China or India;
• cultural differences in the conduct of business;
• difficulty in attracting qualified personnel and managing foreign activities;
• recessions in economies outside the United States;
• longer payment cycles for and greater difficulties collecting accounts receivable;
• export controls, tariffs and other trade protection measures;
• fluctuations in currency exchange rates;
• inflation and deflation;
• nationalization, expropriation and limitations on repatriation of cash;
• social, economic and political instability;
• natural disasters, acts of terrorism, widespread illness and war;
• taxation; and
• changes in laws and policies affecting trade, foreign investment and loans.
In addition to general risks associated with our international sales, licensing activities and operations, we are also subject to risks specific to the individual countries inwhich we do business. Declines in currency values in selected regions may adversely affect our operating results because our products and those of our customers andlicensees may become more expensive to purchase in the countries of the affected currencies. During fiscal 2004, 43% and 18% of our revenues were from customers andlicensees based in South Korea and Japan, respectively, as compared to 45% and 15%, respectively, during fiscal 2003, and 39% and 18% during fiscal 2002, respectively. Asignificant downturn in the economies of Asian countries where many of our customers and licensees are located, particularly the economies of South Korea and Japan, or theeconomies of the major markets they serve would materially harm our business.
The wireless markets in China and India represent growth opportunities for us. In January 2002, China Unicom launched its nationwide CDMA network and had nearly26 million CDMA subscribers at the end of September 2004. In May 2003, Reliance Infocomm launched its nationwide CDMA network in India and had over nine millionsubscribers at the end of September 2004. If China Unicom or Reliance Infocomm or the governments of China or India make technology deployment or other decisions thatresult in actions that are adverse to the expansion of CDMA technologies in China or India, our business could be harmed.
We are subject to risks in certain global markets in which wireless operators provide subsidies on phone sales to their customers. Increases in phone prices that negativelyimpact phone sales can result from changes in regulatory policies related to phone subsidies. Limitations or changes in policy on phone subsidies in South Korea, Japan, Chinaand other countries may have additional negative impacts on our revenues.
We expect that royalty revenues from international licensees based upon sales of their products outside of the United States will continue to represent a significant portionof our total revenues in the future. Our royalty revenues from international licensees are denominated in U.S. dollars. To the extent that such licensees’ products are sold inforeign currencies, any royalties that we derive as a result of such sales are subject to fluctuations in currency exchange rates. In addition, if the effective price of products soldby our customers were to increase as a result of
23
Table of Contents
fluctuations in the exchange rate of the relevant currencies, demand for the products could fall, which in turn would reduce our royalty revenues.
Currency fluctuations could negatively affect future product sales or royalty revenue, harm our ability to collect receivables, or increase the U.S. dollar cost of the activitiesof our foreign subsidiaries and international strategic investments.
We are exposed to risk from fluctuations in currencies, which may change over time as our business practices evolve, that could impact our operating results, liquidity andfinancial condition. We operate and invest globally. Adverse movements in currency exchange rates may negatively affect our business due to a number of situations,including the following:
• Assets or liabilities of our consolidated subsidiaries and our foreign investees that are not denominated in the functional currency of those entities are subject to theeffects of currency fluctuations, which may affect our reported earnings. Our exposure to foreign currencies may increase as we expand into new markets.
• Investments in our consolidated foreign subsidiaries and in other foreign entities that use the local currency as the functional currency may decline in value as a
result of declines in local currency values.
• Our trade receivables are generally United States dollar denominated. Any significant increase in the value of the dollar against our customers’ or licensees’functional currencies could result in an increase in our customers’ or licensees’ cash flow requirements and could consequently affect our ability to collectreceivables.
• Foreign CDMA wireless operators to whom we have provided financing may be unable to pay their debts to us, which are denominated in U.S. dollars, from
revenues generated by their projects, which are denominated in local currencies.
• Strengthening of currency values in selected regions may adversely affect our operating results because the activities of our foreign subsidiaries may become moreexpensive in U.S. dollars.
• Strengthening of currency values in selected regions may adversely affect our cash flows and investment results because strategic investment obligations
denominated in foreign currencies may become more expensive, and the U.S. dollar cost of equity in losses of foreign investees may increase.
• Foreign exchange hedging transactions could affect our cash flows and earnings because they may require the payment of structuring fees and they may limit theU.S. dollar value of royalties from licensees’ sales that are denominated in foreign currencies.
We may engage in strategic transactions that could result in significant charges or management disruption and fail to enhance stockholder value.
From time to time, we engage in strategic transactions with the goal of maximizing stockholder value. In the past we have acquired businesses, entered into joint venturesand made strategic investments in or loans to CDMA wireless operators, early stage companies, or venture funds to support global adoption of CDMA and the use of thewireless Internet. Most of our strategic investments entail a high degree of risk and will not become liquid until more than one year from the date of investment, if at all. Wecannot assure you that our strategic investments (either those we currently hold or future investments) will generate financial returns or that they will result in increasedadoption or continued use of CDMA technologies.
We will continue to evaluate potential strategic transactions and alternatives that we believe may enhance stockholder value. These potential future transactions mayinclude a variety of different business arrangements, including acquisitions, spin-offs, strategic partnerships, joint ventures, restructurings, divestitures, business combinationsand equity or debt investments. Although our goal is to maximize stockholder value, such transactions may impair stockholder value or otherwise adversely affect ourbusiness and the trading price of our stock. Any such transaction may require us to incur non-recurring or other charges and/or to consolidate or record our equity in losses andmay pose significant integration challenges and/or management and business disruptions, any of which could harm our operating results and business.
24
Table of Contents
Defects or errors in our products and services or in products made by our suppliers could harm our relations with our customers and expose us to liability. Similar problemsrelated to the products of our customers or licensees could harm our business.
Our products are inherently complex and may contain defects and errors that are detected only when the products are in use. Further, because our products and services areresponsible for critical functions in our customers’ products and/or networks, such defects or errors could have a serious impact on our customers, which could damage ourreputation, harm our customer relationships and expose us to liability. Defects or impurities in our components, materials or software or those used by our customers orlicensees, equipment failures or other difficulties could adversely affect our ability and that of our customers and licensees to ship products on a timely basis as well ascustomer or licensee demand for our products. Any such shipment delays or declines in demand could reduce our revenues and harm our ability to achieve or sustain desiredlevels of profitability. We and our customers or licensees may also experience component or software failures or defects which could require significant product recalls,reworks and/or repairs which are not covered by warranty reserves and which could consume a substantial portion of the capacity of our third-party manufacturers or those ofour customers or licensees. Resolving any defect or failure related issues could consume financial and/or engineering resources that could affect future product releaseschedules. Additionally, a defect or failure in our products or the products of our customers or licensees could harm our reputation and/or adversely affect the growth of 3Gwireless markets.
Global economic conditions that impact the wireless communications industry could negatively affect our revenues and operating results.
Global economic weakness can have wide-ranging effects on markets that we serve, particularly wireless communications equipment manufacturers and networkoperators. The wireless communications industry recently appears to be recovering from an industry-wide recession. We cannot predict whether a recovery will continue, therate of any such recovery, or what effects negative events, such as war, may have on the economy or on phone inventories at CDMA equipment manufacturers and operators.The continued threat of terrorism and heightened security and military action in response to this threat, or any future acts of terrorism, may cause further disruptions to theglobal economy and to the wireless communications industry and create further uncertainties. Further, an economic recovery may not benefit us in the near term. If it doesnot, our ability to increase or maintain our revenues and operating results may be impaired. In addition, because we intend to continue to make significant investments inresearch and development and to maintain extensive ongoing customer service and support capability, any decline in the rate of growth of our revenues will have a significantadverse impact on our operating results.
Our industry is subject to competition that could result in decreased demand for our products and the products of our customers and licensees and/or declining averageselling prices for our licensees’ products and our products, negatively affecting our revenues and operating results.
We currently face significant competition in our markets and expect that competition will continue. Competition in the telecommunications market is affected by variousfactors, including:
• comprehensiveness of products and technologies;
• value added features which drive replacement rates;
• manufacturing capability;
• scalability and the ability of the system technology to meet customers’ immediate and future network requirements;
• product performance and quality;
• design and engineering capabilities;
• compliance with industry standards;
• time to market;
• system cost; and
• customer support.
25

Table of Contents
This competition may result in reduced average selling prices for our products and those of our customers and licensees. Reductions in the average selling price of ourlicensees’ products, unless offset by an increase in volumes, generally result in reduced royalties payable to us. While pricing pressures from competition may, to a largeextent, be mitigated by the introduction of new features and functionality in our licensees’ products, there is no guarantee that such mitigation will occur. We anticipate thatadditional competitors will enter our markets as a result of growth opportunities in wireless telecommunications, the trend toward global expansion by foreign and domesticcompetitors, technological and public policy changes and relatively low barriers to entry in selected segments of the industry.
Our competitors include companies that promote non-CDMA technologies and companies that design competing CDMA integrated circuits, such as Nokia, Motorola,Philips, Ericsson, Texas Instruments, Intel, NEC, Nortel, VIA Telecom, Samsung, Matsushita and Siemens. All of the foregoing are also our licensees, with the exception ofIntel. With respect to our OmniTRACS, TruckMAIL, OmniExpress, T2 Untethered TrailerTRACS, GlobalTRACS, QConnect, OmniOne, EutelTRACS and LINQ productsand services, our existing competitors are aggressively pricing their products and services and could continue to do so in the future. In addition, these competitors are offeringnew value-added products and services similar in many cases to those we have developed or are developing. Emergence of new competitors, particularly those offering lowcost terrestrial-based products and current as well as future satellite-based products, may impact margins and intensify competition in current and new markets. Similarly,some original equipment manufacturers of trucks and truck components are beginning to offer built-in, on-board communications and position location reporting products thatmay impact our margins and intensify competition in our current and new markets. Some potential competitors of our QWBS business, if they are successful, may harm ourability to compete in certain markets.
Many of these current and potential competitors have advantages over us, including:
• longer operating histories and presence in key markets;
• greater name recognition;
• motivation by our customers in certain circumstances to find alternate suppliers;
• access to larger customer bases; and
• greater sales and marketing, manufacturing, distribution, technical and other resources than we have.
As a result of these and other factors, our competitors may be more successful than us. In addition, we anticipate additional competitors will enter the market for productsbased on 3G standards. These competitors may have more established relationships and distribution channels in markets not currently deploying wireless communicationstechnology. These competitors also may have established or may establish financial or strategic relationships among themselves or with our existing or potential customers,resellers or other third parties. These relationships may affect our customers’ decisions to purchase products or license technology from us. Accordingly, new competitors oralliances among competitors could emerge and rapidly acquire significant market share to our detriment.
Our operating results are subject to substantial quarterly and annual fluctuations and to market downturns.
Our revenues, earnings and other operating results have fluctuated significantly in the past and may fluctuate significantly in the future. General economic or otherconditions causing a downturn in the market for our products or technology, affecting the timing of customer orders or causing cancellations or rescheduling of orders couldalso adversely affect our operating results. Moreover, our customers may change delivery schedules or cancel or reduce orders without incurring significant penalties andgenerally are not subject to minimum purchase requirements.
Our future operating results will be affected by many factors, including, but not limited to: our ability to retain existing or secure anticipated customers or licensees, bothdomestically and internationally; our ability to develop, introduce and market new technology, products and services on a timely basis; management of inventory by us andour customers and their customers in response to shifts in market demand; changes in the mix of technology and products developed, licensed, produced and sold; seasonalcustomer demand; and other factors described elsewhere in this report and in these risk factors. Our corporate cash investments represent a significant asset that may besubject to fluctuating or even negative returns depending upon interest rate movements and financial market conditions in fixed income and equity securities.
These factors affecting our future operating results are difficult to forecast and could harm our quarterly or annual operating results. If our operating results fail to meet thefinancial guidance we provide to investors or the
26
Table of Contents
expectations of investment analysts or investors in any period, securities class action litigation could be brought against us and/or the market price of our common stock coulddecline.
Our stock price may be volatile.
The stock market in general, and the stock prices of technology-based and wireless communications companies in particular, have experienced volatility that often hasbeen unrelated to the operating performance of any specific public company. The market price of our common stock has fluctuated in the past and is likely to fluctuate in thefuture as well. Factors that may have a significant impact on the market price of our stock include:
• announcements concerning us or our competitors, including the selection of wireless communications technology by wireless operators and the timing of the roll-outof those systems;
• receipt of substantial orders or order cancellations for integrated circuits and system software products;
• quality deficiencies in services or products;
• announcements regarding financial developments or technological innovations;
• international developments, such as technology mandates, political developments or changes in economic policies;
• lack of capital to invest in 3G networks;
• new commercial products;
• changes in recommendations of securities analysts;
• government regulations, including stock option accounting and tax regulations;
• energy blackouts;
• acts of terrorism and war;
• inflation and deflation;
• widespread illness;
• proprietary rights or product or patent litigation;
• strategic transactions, such as acquisitions and divestitures; or
• rumors or allegations regarding our financial disclosures or practices.
Our future earnings and stock price may be subject to volatility, particularly on a quarterly basis. Shortfalls in our revenues or earnings in any given period relative to thelevels expected by securities analysts could immediately, significantly and adversely affect the trading price of our common stock.
From time to time, we may repurchase our common stock at prices that may later be higher than the fair market value of the stock. This could result in a loss of value forstockholders if the shares were reissued at lower prices.
In the past, securities class action litigation has often been brought against a company following periods of volatility in the market price of its securities. Due to changes inthe volatility of our stock price, we may be the target of securities litigation in the future. Securities litigation could result in substantial costs and divert management’sattention and resources. In addition, stock volatility may be precipitated by failure to meet earnings expectations or other factors, such as the potential uncertainty in futurereported earnings created by the adoption of option expensing and the related valuation models used to determine such expense.
Our industry is subject to rapid technological change, and we must keep pace to successfully compete.
New technological innovations generally require a substantial investment before they are commercially viable. We intend to continue to make substantial investments indeveloping new products and technologies, and it is possible that our development efforts will not be successful and that our new technologies will not result in meaningfulrevenues. In particular, we intend to continue to invest significant resources in developing integrated circuit products to support high-speed wireless Internet access andmultimode, multiband, multinetwork operation including CDMA2000 1X/1xEV-DO/1xEV-DV, WCDMA, FLO, OFDM and multimedia applications which
27

Table of Contents
encompass development of graphical display, camera and video capabilities, as well as higher computational capability and lower power on-chip computers and signalprocessors. We will also continue our significant development efforts with respect to our BREW applications development platform, providing applications developers withan open standard platform for wireless devices on which to develop their products. An open standard platform means that BREW can be made to interface with many softwareapplications, including those developed by others. We also continue to invest in the development of our MediaFLO content distribution system and FLO technology fordelivery of low cost multimedia content to multiple subscribers. We cannot assure you that the revenues generated from these products will meet our expectations.
The market for our products and technology is characterized by many factors, including:
• rapid technological advances and evolving industry standards;
• changes in customer requirements;
• frequent introductions of new products and enhancements; and
• evolving methods of building and operating telecommunications systems.
Our future success will depend on our ability to continue to develop and introduce new products, technology and enhancements on a timely basis. Our future success willalso depend on our ability to keep pace with technological developments, protect our intellectual property, satisfy varying customer requirements, price our productscompetitively and achieve market acceptance. The introduction of products embodying new technologies and the emergence of new industry standards could render ourexisting products and technology, and products and technology currently under development, obsolete and unmarketable. If we fail to anticipate or respond adequately totechnological developments or customer requirements, or experience any significant delays in development, introduction or shipment of our products and technology incommercial quantities, demand for our products and our customers’ and licensees’ products that use our technology could decrease, and our competitive position could bedamaged.
The enforcement and protection of our intellectual property rights may be expensive and could divert our valuable resources.
We rely primarily on patent, copyright, trademark and trade secret laws, as well as nondisclosure and confidentiality agreements and other methods, to protect ourproprietary information, technologies and processes, including our patent portfolio. Policing unauthorized use of our products and technologies is difficult and timeconsuming. We cannot be certain that the steps we have taken will prevent the misappropriation or unauthorized use of our proprietary information and technologies,particularly in foreign countries where the laws may not protect our proprietary rights as fully or as readily as United States laws.
The vast majority of our patents and patent applications relate to our CDMA digital wireless communications technology and much of the remainder of our patents andpatent applications relate to our other technologies and products. Litigation may be required to enforce our intellectual property rights, protect our trade secrets or determinethe validity and scope of proprietary rights of others. As a result of any such litigation, we could lose our proprietary rights or incur substantial unexpected operating costs.Any action we take to enforce our intellectual property rights could be costly and could absorb significant management time and attention, which, in turn, could negativelyimpact our operating results. In addition, failure to protect our trademark rights could impair our brand identity.
Claims by other companies that we infringe their intellectual property or that patents on which we rely are invalid could adversely affect our business.
From time to time, companies may assert patent, copyright and other intellectual proprietary rights against our products or products using our technologies or technologiesused in our industry. These claims may result in our involvement in litigation. We may not prevail in such litigation given the complex technical issues and inherentuncertainties in intellectual property litigation. If any of our products were found to infringe on protected technology, we could be required to redesign or license suchtechnology and/or pay damages or other compensation to the infringed party. If we were unable to redesign or license protected technology used in our products, we could beprohibited from making and selling such products.
In addition, as the number of competitors in our market increases and the functionality of our products is enhanced and overlaps with the products of other companies, wemay become subject to claims of infringement or
28
Table of Contents
misappropriation of the intellectual property rights of others. Any claims, with or without merit, could be time consuming, result in costly litigation, divert the efforts of ourtechnical and management personnel or cause product release or shipment delays, any of which could have a material adverse effect upon our operating results. In anypotential dispute involving our patents or other intellectual property, our licensees could also become the targets of litigation. Any such litigation could severely disrupt thebusiness of our licensees, which in turn could hurt our relations with our licensees and cause our revenues to decrease.
A number of other companies have claimed to own patents essential to various 3G CDMA standards. If we or other product manufacturers are required to obtain additionallicenses and/or pay royalties to one or more patent holders, this could have a material adverse effect on the commercial implementation of our CDMA products andtechnologies and our profitability.
Other companies or entities also may commence actions seeking to establish the invalidity of our patents. In the event that one or more of our patents are challenged, acourt may invalidate the patent or determine that the patent is not enforceable, which could harm our competitive position. If any of our key patents are invalidated, or if thescope of the claims in any of these patents is limited by court decision, we could be prevented from licensing the invalidated or limited portion of our technology. Even if sucha patent challenge is not successful, it could be expensive and time consuming, divert management attention from our business and harm our reputation.
Potential tax liabilities could adversely affect our results.
We are subject to income taxes in both the United States and numerous foreign jurisdictions. Significant judgment is required in determining our worldwide provision forincome taxes. In the ordinary course of our business, there are many transactions and calculations where the ultimate tax determination is uncertain. We are regularly underaudit by tax authorities. Although we believe our tax estimates are reasonable, the final determination of tax audits and any related litigation could be materially different thanthat which is reflected in historical income tax provisions and accruals. In such case, a material effect on our income tax provision and net income in the period or periods inwhich that determination is made could result.
The high amount of capital required to obtain radio frequency licenses and deploy and expand wireless networks could slow the growth of the wireless communicationsindustry and adversely affect our business.
Our growth is dependent upon the increased use of wireless communications services that utilize our CDMA technology. In order to provide wireless communicationsservices, wireless operators must obtain rights to use specific radio frequencies. The allocation of frequencies is regulated in the United States and other countries throughoutthe world and limited spectrum space is allocated to wireless communications services. Industry growth may be affected by the amount of capital required to: obtain licensesto use new frequencies; deploy wireless networks to offer voice and data services; and expand wireless networks to grow voice and data services. Over the last several years,the amount paid for spectrum licenses has increased significantly, particularly for frequencies used in connection with 3G technology. In addition, litigation and disputesinvolving prior and future spectrum auctions has delayed the expansion of wireless networks in the United States and elsewhere, and it is possible that this delay couldcontinue for a significant amount of time. The significant cost of licenses and wireless networks, and delays associated with disputes over new licenses, may slow the growthof the industry if wireless operators are unable to obtain or service the additional capital necessary to implement 3G wireless networks. Our growth could be adverselyaffected if this occurs.
If we experience product liability claims or recalls, we may incur significant expenses and experience decreased demand for our products.
Testing, manufacturing, marketing and use of our products and those of our licensees and customers entails the risk of product liability. Although we believe our productliability insurance will be adequate to protect against product liability claims, we cannot assure you that we will be able to continue to maintain such insurance at a reasonablecost or in sufficient amounts to protect us against losses due to product liability. Our inability to maintain insurance at an acceptable cost or to otherwise protect againstpotential product liability claims could prevent or inhibit the commercialization of our products and those of our licensees and customers and harm our future operatingresults. Furthermore, not all losses associated with alleged product failure are insurable. In addition, a product liability claim or recall, whether against us, our licensees orcustomers, could harm our reputation and result in decreased demand for our products.
29
Table of Contents
If wireless phones pose safety risks, we may be subject to new regulations, and demand for our products and those of our licensees and customers may decrease.
Concerns over the effects of radio frequency emissions, even if unfounded, may have the effect of discouraging the use of wireless phones, which would decrease demandfor our products and those of our licensees and customers. In recent years, the FCC and foreign regulatory agencies have updated the guidelines and methods they use forevaluating radio frequency emissions from radio equipment, including wireless phones. In addition, interest groups have requested that the FCC investigate claims thatwireless communications technologies pose health concerns and cause interference with airbags, hearing aids and medical devices. Concerns have also been expressed over thepossibility of safety risks due to a lack of attention associated with the use of wireless phones while driving. Any legislation that may be adopted in response to theseexpressions of concern could reduce demand for our products and those of our licensees and customers in the United States as well as foreign countries.
Our business depends on the availability of satellite and other networks for our OmniTRACS, EutelTRACS, OmniExpress, LINQ, T2 Untethered TrailerTRACS,GlobalTRACS, QConnect and OmniOne systems and other communications products.
Our OmniTRACS system currently operates in the United States market on leased Ku-band satellite transponders. Our primary data satellite transponder and positionreporting satellite transponder lease runs through October 2006 and includes transponder and satellite protection (back-up capacity in the event of a transponder or satellitefailure). Based on system capacity analysis, we believe that the United States OmniTRACS operations will not require additional transponder capacity through fiscal 2006.We believe that in the event additional transponder capacity would be required in fiscal 2006 or in future years, additional capacity will be available on acceptable terms.However, we cannot assure you that we will be able to acquire additional transponder capacity on acceptable terms in a timely manner. A failure to maintain adequate satellitecapacity would harm our business, operating results, liquidity and financial position.
Our OmniExpress, LINQ, T2 Untethered TrailerTRACS, GlobalTRACS, QConnect and OmniOne systems are terrestrial-based products and thus rely on various wirelessterrestrial communications networks operated by third parties. We believe these terrestrial networks will be available for our products; however, we cannot assure you thatthese networks will continue to be available to us or that they will perform adequately for our needs. The unavailability or nonperformance of these network systems couldharm our business.
Our business and operations would suffer in the event of system failures.
Despite system redundancy, the implementation of security measures and the existence of a Disaster Recovery Plan for our internal information technology networkingsystems, our systems are vulnerable to damages from computer viruses, unauthorized access, energy blackouts, natural disasters, terrorism, war and telecommunicationfailures. Any system failure, accident or security breach that causes interruptions in our operations or to our customers’ or licensees’ operations could result in a materialdisruption to our business. To the extent that any disruption or security breach results in a loss or damage to our customers’ data or applications, or inappropriate disclosure ofconfidential information, we may incur liability as a result. In addition, we may incur additional costs to remedy the damages caused by these disruptions or security breaches.
Message transmissions for domestic OmniTRACS, T2 Untethered TrailerTRACS, OmniExpress, GlobalTRACS, QConnect and OmniOne operations are formatted andprocessed at the Network Management Center in San Diego, California, which we operate, with a fully redundant backup Network Management Center located in Las Vegas,Nevada. Our Network Management Center operations are subject to system failures, which could interrupt the services and have a material adverse effect on our operatingresults.
From time to time, we install new or upgraded business management systems. To the extent such systems fail or are not properly implemented, we may experiencematerial disruptions to our business that could have a material adverse effect on our results of operations.
We cannot provide assurance that we will continue to declare dividends at all or in any particular amounts.
We intend to continue to pay quarterly dividends subject to capital availability and periodic determinations that cash dividends are in the best interest of the stockholders.Our dividend policy may be affected by, among other items, our views on potential future capital requirements, including those related to research and development, creationand expansion of sales distribution channels and investments and acquisitions, legal risks, stock repurchase
30

Table of Contents
programs, changes in Federal income tax law and challenges to our business model. Our dividend policy may change from time to time, and we cannot provide assurance thatwe will continue to declare dividends at all or in any particular amounts. A change in our dividend policy could have a negative effect on our stock price.
Government regulation may adversely affect our business.
Our products and those of our customers and licensees are subject to various regulations, including FCC regulations in the United States and other international regulations,as well as the specifications of national, regional and international standards bodies. Changes in the regulation of our activities, including changes in the allocation of availablespectrum by the United States government and other governments or exclusion or limitation of our technology or products by a government or standards body, could have amaterial adverse effect on our business, operating results, liquidity and financial position.
Our business and operating results will be harmed if we are unable to manage growth in our business.
Certain of our businesses have experienced periods of rapid growth that have placed, and may continue to place, significant demands on our managerial, operational andfinancial resources. In order to manage this growth, we must continue to improve and expand our management, operational and financial systems and controls, includingquality control and delivery and service capabilities. We also need to continue to expand, train and manage our employee base. We must carefully manage research anddevelopment capabilities and production and inventory levels to meet product demand, new product introductions and product and technology transitions. We cannot assureyou that we will be able to timely and effectively meet that demand and maintain the quality standards required by our existing and potential customers and licensees.
In addition, inaccuracies in our demand forecasts, or failure of the systems used to develop the forecasts, could quickly result in either insufficient or excessive inventoriesand disproportionate overhead expenses. If we ineffectively manage our growth or are unsuccessful in recruiting and retaining personnel, our business and operating resultswill be harmed.
We may not be able to attract and retain qualified employees.
Our future success depends largely upon the continued service of our Board members, executive officers and other key management and technical personnel. Our successalso depends on our ability to continue to attract, retain and motivate qualified personnel. In addition, implementing our product and business strategy requires specializedengineering and other talent, and our revenues are highly dependent on technological and product innovations. Key employees represent a significant asset, and thecompetition for these employees is intense in the wireless communications industry. We continue to anticipate significant increases in human resources, particularly inengineering resources, through fiscal 2005. If we are unable to attract and retain the qualified employees that we need, our business may be harmed.
We may have particular difficulty attracting and retaining key personnel in periods of poor operating performance given the significant use of incentive compensation byour competitors. We do not have employment agreements with our key management personnel and do not maintain key person life insurance on any of our personnel. Theloss of one or more of our key employees or our inability to attract, retain and motivate qualified personnel could negatively impact our ability to design, develop andcommercialize our products and technology.
Since our inception, we have used stock options and other long-term equity incentives as a fundamental component of our employee compensation packages. We believethat stock options and other long-term equity incentives directly motivate our employees to maximize long-term stockholder value and, through the use of long-term vesting,encourage employees to remain with us. To the extent that new regulations make it less attractive to grant options to employees, we may incur increased compensation costs,change our equity compensation strategy or find it difficult to attract, retain and motivate employees, each of which could materially and adversely affect our business.
Future changes in financial accounting standards or practices or existing taxation rules or practices may cause adverse unexpected revenue fluctuations and affect ourreported results of operations.
A change in accounting standards or practices or a change in existing taxation rules or practices can have a significant effect on our reported results and may even affectour reporting of transactions completed before the change is effective. New accounting pronouncements and taxation rules and varying interpretations of accountingpronouncements and taxation practice have occurred and may occur in the future. Changes to existing rules or the
31
Table of Contents
questioning of current practices may adversely affect our reported financial results or the way we conduct our business.
For example, any changes requiring that we record compensation expense in the statement of operations for employee stock options using the fair value method or changesin existing taxation rules related to stock options could have a significant negative effect on our reported results and on our ability to provide accurate guidance on our futurereported financial results as a result of the variability of the factors used to establish the value of stock options. Several agencies and entities are considering, and the FinancialAccounting Standards Board (FASB) has announced, proposals to change generally accepted accounting principles in the United States that, if implemented, would require usto record charges to earnings for employee stock option grants. This pending requirement would negatively impact our reported earnings.
Compliance with changing regulation of corporate governance and public disclosure may result in additional expenses.
Changing laws, regulations and standards relating to corporate governance and public disclosure, including the Sarbanes-Oxley Act of 2002, new SEC regulations andNASDAQ National Market rules, are creating uncertainty for companies such as ours. These new or changed laws, regulations and standards are subject to varyinginterpretations in many cases due to their lack of specificity, and as a result, their application in practice may evolve over time as new guidance is provided by regulatory andgoverning bodies, which could result in continuing uncertainty regarding compliance matters and higher costs necessitated by ongoing revisions to disclosure and governancepractices. We are committed to maintaining high standards of corporate governance and public disclosure. As a result, our efforts to comply with evolving laws, regulationsand standards have resulted in, and are likely to continue to result in, increased general and administrative expenses and a diversion of management time and attention fromrevenue-generating activities to compliance activities. In particular, our efforts to comply with Section 404 of the Sarbanes-Oxley Act of 2002 and the related regulationsregarding our required assessment of our internal controls over financial reporting and our external auditors’ audit of that assessment has required the commitment ofsignificant financial and managerial resources. In addition, it has become more difficult and more expensive for us to obtain director and officer liability insurance, and wehave purchased reduced coverage at substantially higher cost than in the past. We expect these efforts to require the continued commitment of significant resources. Further,our board members, chief executive officer and chief financial officer could face an increased risk of personal liability in connection with the performance of their duties. As aresult, we may have difficulty attracting and retaining qualified board members and executive officers, which could harm our business. If our efforts to comply with new orchanged laws, regulations and standards differ from the activities intended by regulatory or governing bodies due to ambiguities related to practice, our reputation may beharmed.
Our stockholder rights plan, certificate of incorporation and Delaware law could adversely affect the performance of our stock.
Our certificate of incorporation provides for cumulative voting in the election of directors. In addition, our certificate of incorporation provides for a classified board ofdirectors and includes a provision that requires the approval of holders of at least 66 2/3% of our voting stock as a condition to a merger or certain other business transactionswith, or proposed by, a holder of 15% or more of our voting stock. This approval is not required in cases where certain of our directors approve the transaction or wherecertain minimum price criteria and other procedural requirements are met. Our certificate of incorporation also requires the approval of holders of at least 66 2/3% of ourvoting stock to amend or change the provisions mentioned relating to the classified board, cumulative voting or the transaction approval. Under our bylaws, stockholders arenot permitted to call special meetings of our stockholders. Finally, our certificate of incorporation provides that any action required or permitted to be taken by ourstockholders must be effected at a duly called annual or special meeting rather than by any consent in writing.
The classified board, transaction approval, special meeting and other charter provisions may discourage certain types of transactions involving an actual or potential changein our control. These provisions may also discourage certain types of transactions in which our stockholders might otherwise receive a premium for their shares over thencurrent market prices and may limit our stockholders’ ability to approve transactions that they may deem to be in their best interests.
Further, we have distributed a dividend of one right for each outstanding share of our common stock pursuant to the terms of our preferred share purchase rights plan.These rights will cause substantial dilution to the ownership of a person or group that attempts to acquire us on terms not approved by our Board of Directors and may havethe effect of deterring hostile takeover attempts. In addition, our Board of Directors has the authority to fix the rights and
32
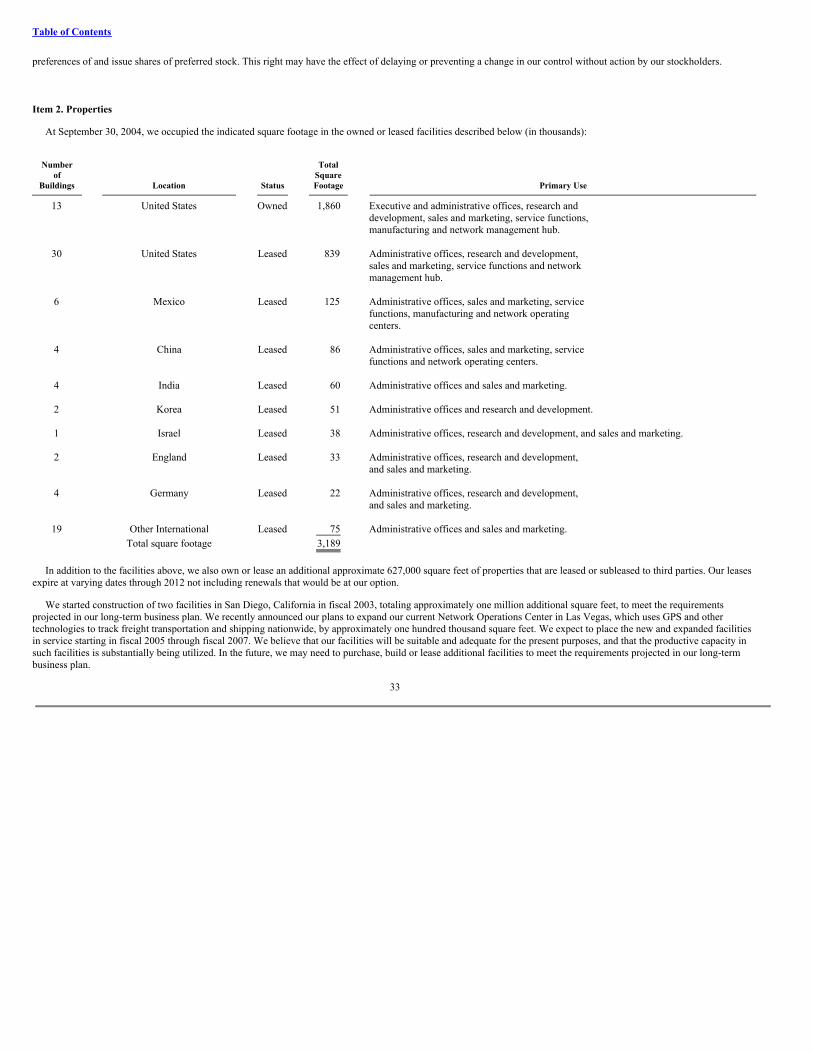
Table of Contents
preferences of and issue shares of preferred stock. This right may have the effect of delaying or preventing a change in our control without action by our stockholders.
Item 2. Properties
At September 30, 2004, we occupied the indicated square footage in the owned or leased facilities described below (in thousands):
Number Total
of Square Buildings
Location
Status
Footage
Primary Use
13 United States Owned 1,860 Executive and administrative offices, research and development, sales and marketing, service functions, manufacturing and network management hub.
30 United States Leased 839 Administrative offices, research and development,
sales and marketing, service functions and network management hub.
6 Mexico Leased 125 Administrative offices, sales and marketing, service
functions, manufacturing and network operating centers.
4 China Leased 86 Administrative offices, sales and marketing, service
functions and network operating centers. 4 India Leased 60 Administrative offices and sales and marketing. 2 Korea Leased 51 Administrative offices and research and development. 1 Israel Leased 38 Administrative offices, research and development, and sales and marketing. 2 England Leased 33 Administrative offices, research and development,
and sales and marketing. 4 Germany Leased 22 Administrative offices, research and development,
and sales and marketing.
19 Other International Leased 75 Administrative offices and sales and marketing.
Total square footage 3,189
In addition to the facilities above, we also own or lease an additional approximate 627,000 square feet of properties that are leased or subleased to third parties. Our leasesexpire at varying dates through 2012 not including renewals that would be at our option.
We started construction of two facilities in San Diego, California in fiscal 2003, totaling approximately one million additional square feet, to meet the requirementsprojected in our long-term business plan. We recently announced our plans to expand our current Network Operations Center in Las Vegas, which uses GPS and othertechnologies to track freight transportation and shipping nationwide, by approximately one hundred thousand square feet. We expect to place the new and expanded facilitiesin service starting in fiscal 2005 through fiscal 2007. We believe that our facilities will be suitable and adequate for the present purposes, and that the productive capacity insuch facilities is substantially being utilized. In the future, we may need to purchase, build or lease additional facilities to meet the requirements projected in our long-termbusiness plan.
33

Table of Contents
Item 3. Legal Proceedings
Schwartz, et al v. QUALCOMM: In fiscal 2001, 87 former QUALCOMM employees filed a lawsuit against us in the District Court for Boulder County, Colorado, allegingclaims for intentional misrepresentation, nondisclosure and concealment, violation of C.R.S. Section 8-2-104 (obtaining workers by misrepresentation), breach of contract,breach of the implied covenant of good faith and fair dealing, promissory estoppel, negligent misrepresentation, unjust enrichment, violation of California Labor CodeSection 970, violation of California Civil Code Sections 1709-1710, rescission, violation of California Business & Professions Code Section 17200 and violation of CaliforniaCivil Code Section 1575. The complaint seeks economic, emotional distress and punitive damages and unspecified amounts of interest. On November 29, 2001, the Courtgranted our motion to dismiss 17 of the plaintiffs from the lawsuit. Subsequently, the Court dismissed three other plaintiffs from the lawsuit. On November 18, 2002, theCourt granted our motion to dismiss 61 of the remaining 67 plaintiffs from the lawsuit. We subsequently resolved the matters with the remaining plaintiffs. Those plaintiffswhose claims were dismissed have appealed. Oral argument on the appeal occurred on October 26, 2004, and no decision has been received.
Hanig et al. v. QUALCOMM, Boesel, et al v. QUALCOMM, Stone v. QUALCOMM, Ortiz et al v. QUALCOMM, Shannon et al. v. QUALCOMM, Deshon et al v.QUALCOMM, Earnhart et al. v. QUALCOMM: These cases, the first of which was filed in fiscal 2001, were filed in San Diego County Superior Court by over 100 formeremployees, alleging claims for declaratory relief, breach of contract, intentional/negligent fraud, concealment, rescission, specific performance, work, labor and services,breach of the implied covenant of good faith and fair dealing, violation of California Business & Professions Code Section 17200 and unjust enrichment, claiming that theywere entitled to full vesting of unvested stock options as a result of the sale of our infrastructure business to Ericsson in 1999. We have answered the complaints, which havebeen consolidated, and discovery is ongoing. On July 16, 2004, the Court granted our summary adjudication motion, dismissing plaintiffs’ breach of contract claims.
Durante, et al v. QUALCOMM: On February 2, 2000, three former employees filed a putative class action against us, ostensibly on behalf of themselves and those formeremployees of ours whose employment was terminated in April 1999. Virtually all of the purported class of plaintiffs received severance packages at the time of thetermination of their employment, in exchange for a release of claims, other than federal age discrimination claims, against us. The complaint was filed in California SuperiorCourt in and for the County of Los Angeles and purports to state 10 causes of action including breach of contract, age discrimination, violation of Labor Code Section 200,violation of Labor Code Section 970, unfair business practices, intentional infliction of emotional distress, unjust enrichment, breach of the covenant of good faith and fairdealing, declaratory relief and undue influence. The complaint seeks an order accelerating all unvested stock options for the members of the class, plus economic andliquidated damages of an unspecified amount. On June 27, 2000, the case was ordered transferred from Los Angeles County Superior Court to San Diego County SuperiorCourt. On July 3, 2000, we removed the case to the United States District Court for the Southern District of California, and discovery commenced. On May 29, 2001, theCourt dismissed all plaintiffs’ claims except for claims arising under the federal Age Discrimination in Employment Act. On July 16, 2001, the Court granted conditional classcertification on the remaining claims, to be revisited by the Court at the end of the discovery period. On April 15, 2003, the Court granted our summary judgment motions asto all remaining class members’ disparate impact claims. On June 18, 2003, the Court ordered decertification of the class and dismissed the remaining claims of the opt-inplaintiffs without prejudice. Plaintiffs have filed an appeal. On June 20, 2003, 76 of the opt-in plaintiffs filed an action in Federal District Court for the Southern District ofCalifornia, alleging violations of the Age Discrimination in Employment Act as a result of their layoffs in 1999. To date, the complaint has not been served.
Zoltar Satellite Alarm Systems, Inc. v. QUALCOMM, Inc. and SnapTrack, Inc.: On March 30, 2001, Zoltar Satellite Alarm Systems, Inc. (Zoltar) filed suit against us andSnapTrack, Inc. (SnapTrack), a QUALCOMM wholly-owned subsidiary, in the United States District Court for the Northern District of California seeking damages andinjunctive relief and alleging infringement of three patents. On August 27, 2001, Zoltar filed an amended complaint adding Sprint Corp. as a named defendant and narrowingcertain infringement claims against us and SnapTrack. Since then, Zoltar has dismissed Sprint Corp. as a defendant. Trial of this matter commenced on February 24, 2004. OnMarch 25, 2004, the jury reached a unanimous verdict of no infringement in our favor and SnapTrack on six of the seven patent claims asserted by Zoltar. On July 26, 2004,the Court found no infringement on the remaining patent claim asserted by Zoltar and entered a judgment in favor of us and SnapTrack on Zoltar’s complaint and awarded usand SnapTrack our costs of suit. Zoltar has noticed an appeal and we and SnapTrack have filed a responsive notice.
34

Table of Contents
Texas Instruments Incorporated v. QUALCOMM Incorporated: On July 25, 2003, we filed an action in Delaware Superior Court against Texas Instruments Incorporatedfor breach of a patent portfolio license agreement between the parties, seeking damages and other relief. On September 23, 2003, Texas Instruments filed an action inDelaware Chancery Court against us alleging breach of the same agreement, seeking damages and other relief. We have since dismissed our case in Superior Court and refiledour claims as part of the action in the Chancery Court. In a written order dated July 14, 2004, the Court granted our summary judgment motion, dismissing all of TexasInstruments’ claims against us. In addition, the Court ruled that Texas Instruments had breached the patent portfolio license agreement, though the breach was non-material,and therefore Texas Instruments’ license under the agreement would not be forfeited. The Court held a one-day bench trial on August 16, 2004, on our claim that TexasInstruments breached the agreement between the parties by pursuing the claims previously dismissed by the Court. Although the Court had already found that the claimsbrought by Texas Instruments were barred by the agreement, the Court declined to find that bringing the claims constituted a breach of the agreement by Texas Instrumentsand, therefore, found against us on the sole remaining claim in the case. On October 22, 2004, we filed a notice of appeal.
QUALCOMM Incorporated v. Conexant Systems, Inc. and Skyworks Solutions Inc.: On October 8, 2002, we filed an action in the United States District Court for theSouthern District of California against Conexant and Skyworks alleging infringement of five patents and misappropriation of trade secrets and seeking damages and injunctiverelief. On December 4, 2003, Skyworks answered and counterclaimed against us, alleging infringement of four patents and misappropriation of trade secrets and seekingdamages and injunctive relief. On April 30, 2004, the Court granted our motion to dismiss defendants’ inequitable conduct affirmative defenses and counterclaims. We filedan amended complaint on June 16, 2004, bringing the total number of our patents at issue to eight and maintaining the trade secret misappropriation claim. On July 16 and 20,2004, Conexant and Skyworks answered our amended complaint, reasserted claims based on alleged trade secret misappropriation and patent infringement and Skyworks alsoasserted counterclaims alleging violations of antitrust laws and unfair business practices. Conexant and Skyworks seek damages and other forms of relief. On September 21,2004, we moved to stay the Skyworks antitrust and related counterclaims. That motion is pending. We believe the counterclaims are without merit. Claim constructionhearings relating to the patents in the case are under way. Discovery in the matter is continuing.
QUALCOMM Incorporated v. Maxim Integrated Products, Inc.: On December 2, 2002, we filed an action in the United States District Court for the Southern District ofCalifornia against Maxim Integrated Products, Inc. (Maxim) alleging infringement of three patents and seeking damages and injunctive relief. We have since amended thecomplaint, bringing the total number of patents at issue to four. On May 5, 2004, the Court granted Maxim’s motion that no indirect infringement arose in connection withdefendants’ sales of certain products to certain licensees of ours. On June 21, 2004, the Court granted our motion to stay all of Maxim’s antitrust counterclaims and its patentmisuse defense. On July 9, 2004, Maxim filed an Answer and Counterclaims to our Third Amended Complaint. Maxim’s amended counterclaims allege violation of antitrustlaws and unfair business practices and seek damages and other relief. We believe the amended counterclaims are without merit and, if and when the Court’s stay is lifted, wewill seek dismissal of those counterclaims as a matter of law. Claim construction hearings relating to the patents in the case are under way. Discovery in the matter iscontinuing.
Other: We have been named, along with many other manufacturers of wireless phones, wireless operators and industry-related organizations, as a defendant in purportedclass action lawsuits (In re Wireless Telephone Frequency Emissions Products Liability Litigation, United States District Court for the District of Maryland), and in severalindividually filed actions, seeking personal injury, economic and/or punitive damages arising out of our sale of cellular phones. On March 5, 2003, the Court granted thedefendants motions to dismiss five of the consolidated cases (Pinney, Gimpleson, Gillian, Farina and Naquin) on the grounds that the claims were preempted by federal law.On April 2, 2003, the plaintiffs filed a notice of appeal of this order and the Court’s order denying remand. All remaining cases filed against us allege personal injury as aresult of their use of a wireless telephone. Those cases have been remanded to the Washington, D.C. Superior Court. The courts that have reviewed similar claims againstother companies to date have held that there was insufficient scientific basis for the plaintiffs’ claims in those cases.
Although there can be no assurance that unfavorable outcomes in any of the foregoing matters would not have a material adverse effect on our operating results, liquidityor financial position, we believe the claims are without merit and will vigorously defend the actions. We have not recorded any accrual for contingent liability associated withthe legal proceedings described above based on our belief that a liability, while possible, is not probable. Further, any possible range of loss cannot be estimated at this time.We are engaged in numerous other legal actions
35

Table of Contents
arising in the ordinary course of our business and believe that the ultimate outcome of these actions will not have a material adverse effect on our operating results, liquidity orfinancial position.
Item 4. Submission of Matters to a Vote of Security Holders
No matters were submitted to a vote of security holders during the quarter ended September 30, 2004.
36
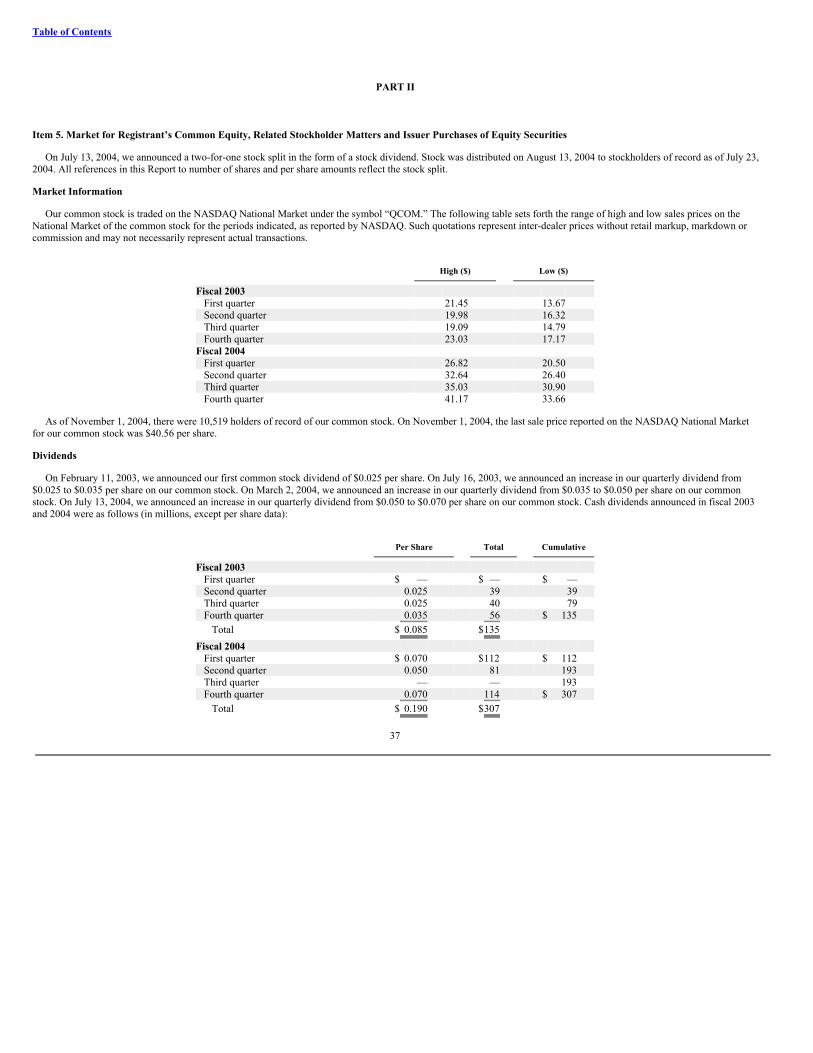
Table of Contents
PART II
Item 5. Market for Registrant’s Common Equity, Related Stockholder Matters and Issuer Purchases of Equity Securities
On July 13, 2004, we announced a two-for-one stock split in the form of a stock dividend. Stock was distributed on August 13, 2004 to stockholders of record as of July 23,2004. All references in this Report to number of shares and per share amounts reflect the stock split.
Market Information
Our common stock is traded on the NASDAQ National Market under the symbol “QCOM.” The following table sets forth the range of high and low sales prices on theNational Market of the common stock for the periods indicated, as reported by NASDAQ. Such quotations represent inter-dealer prices without retail markup, markdown orcommission and may not necessarily represent actual transactions.
High ($)
Low ($)
Fiscal 2003 First quarter 21.45 13.67 Second quarter 19.98 16.32 Third quarter 19.09 14.79 Fourth quarter 23.03 17.17
Fiscal 2004 First quarter 26.82 20.50 Second quarter 32.64 26.40 Third quarter 35.03 30.90 Fourth quarter 41.17 33.66
As of November 1, 2004, there were 10,519 holders of record of our common stock. On November 1, 2004, the last sale price reported on the NASDAQ National Marketfor our common stock was $40.56 per share.
Dividends
On February 11, 2003, we announced our first common stock dividend of $0.025 per share. On July 16, 2003, we announced an increase in our quarterly dividend from$0.025 to $0.035 per share on our common stock. On March 2, 2004, we announced an increase in our quarterly dividend from $0.035 to $0.050 per share on our commonstock. On July 13, 2004, we announced an increase in our quarterly dividend from $0.050 to $0.070 per share on our common stock. Cash dividends announced in fiscal 2003and 2004 were as follows (in millions, except per share data):
Per Share
Total
Cumulative
Fiscal 2003 First quarter $ — $ — $ — Second quarter 0.025 39 39 Third quarter 0.025 40 79 Fourth quarter 0.035 56 $ 135
Total $ 0.085 $135 Fiscal 2004
First quarter $ 0.070 $112 $ 112 Second quarter 0.050 81 193 Third quarter — — 193 Fourth quarter 0.070 114 $ 307
Total $ 0.190 $307
37
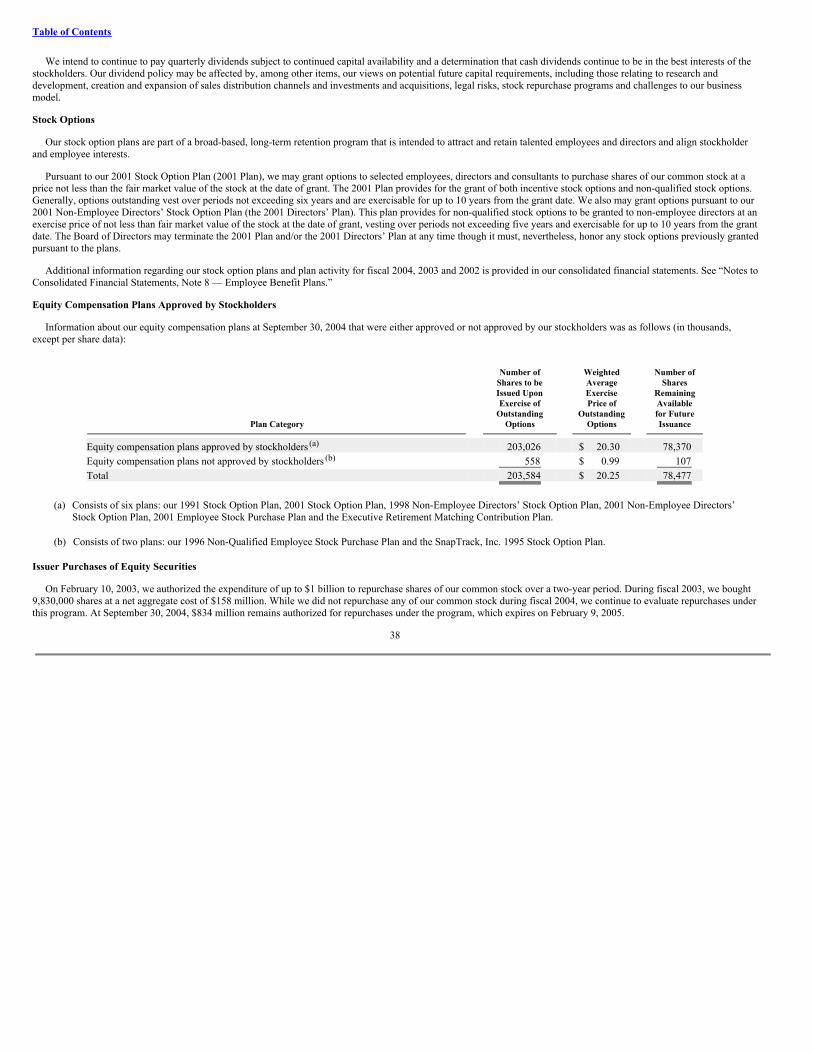
Table of Contents
We intend to continue to pay quarterly dividends subject to continued capital availability and a determination that cash dividends continue to be in the best interests of thestockholders. Our dividend policy may be affected by, among other items, our views on potential future capital requirements, including those relating to research anddevelopment, creation and expansion of sales distribution channels and investments and acquisitions, legal risks, stock repurchase programs and challenges to our businessmodel.
Stock Options
Our stock option plans are part of a broad-based, long-term retention program that is intended to attract and retain talented employees and directors and align stockholderand employee interests.
Pursuant to our 2001 Stock Option Plan (2001 Plan), we may grant options to selected employees, directors and consultants to purchase shares of our common stock at aprice not less than the fair market value of the stock at the date of grant. The 2001 Plan provides for the grant of both incentive stock options and non-qualified stock options.Generally, options outstanding vest over periods not exceeding six years and are exercisable for up to 10 years from the grant date. We also may grant options pursuant to our2001 Non-Employee Directors’ Stock Option Plan (the 2001 Directors’ Plan). This plan provides for non-qualified stock options to be granted to non-employee directors at anexercise price of not less than fair market value of the stock at the date of grant, vesting over periods not exceeding five years and exercisable for up to 10 years from the grantdate. The Board of Directors may terminate the 2001 Plan and/or the 2001 Directors’ Plan at any time though it must, nevertheless, honor any stock options previously grantedpursuant to the plans.
Additional information regarding our stock option plans and plan activity for fiscal 2004, 2003 and 2002 is provided in our consolidated financial statements. See “Notes toConsolidated Financial Statements, Note 8 — Employee Benefit Plans.”
Equity Compensation Plans Approved by Stockholders
Information about our equity compensation plans at September 30, 2004 that were either approved or not approved by our stockholders was as follows (in thousands,except per share data):
Number of Weighted Number of Shares to be Average Shares Issued Upon Exercise Remaining Exercise of Price of Available Outstanding Outstanding for Future
Plan Category
Options
Options
Issuance
Equity compensation plans approved by stockholders (a) 203,026 $ 20.30 78,370 Equity compensation plans not approved by stockholders (b) 558 $ 0.99 107 Total 203,584 $ 20.25 78,477
(a) Consists of six plans: our 1991 Stock Option Plan, 2001 Stock Option Plan, 1998 Non-Employee Directors’ Stock Option Plan, 2001 Non-Employee Directors’Stock Option Plan, 2001 Employee Stock Purchase Plan and the Executive Retirement Matching Contribution Plan.
(b) Consists of two plans: our 1996 Non-Qualified Employee Stock Purchase Plan and the SnapTrack, Inc. 1995 Stock Option Plan.
Issuer Purchases of Equity Securities
On February 10, 2003, we authorized the expenditure of up to $1 billion to repurchase shares of our common stock over a two-year period. During fiscal 2003, we bought9,830,000 shares at a net aggregate cost of $158 million. While we did not repurchase any of our common stock during fiscal 2004, we continue to evaluate repurchases underthis program. At September 30, 2004, $834 million remains authorized for repurchases under the program, which expires on February 9, 2005.
38
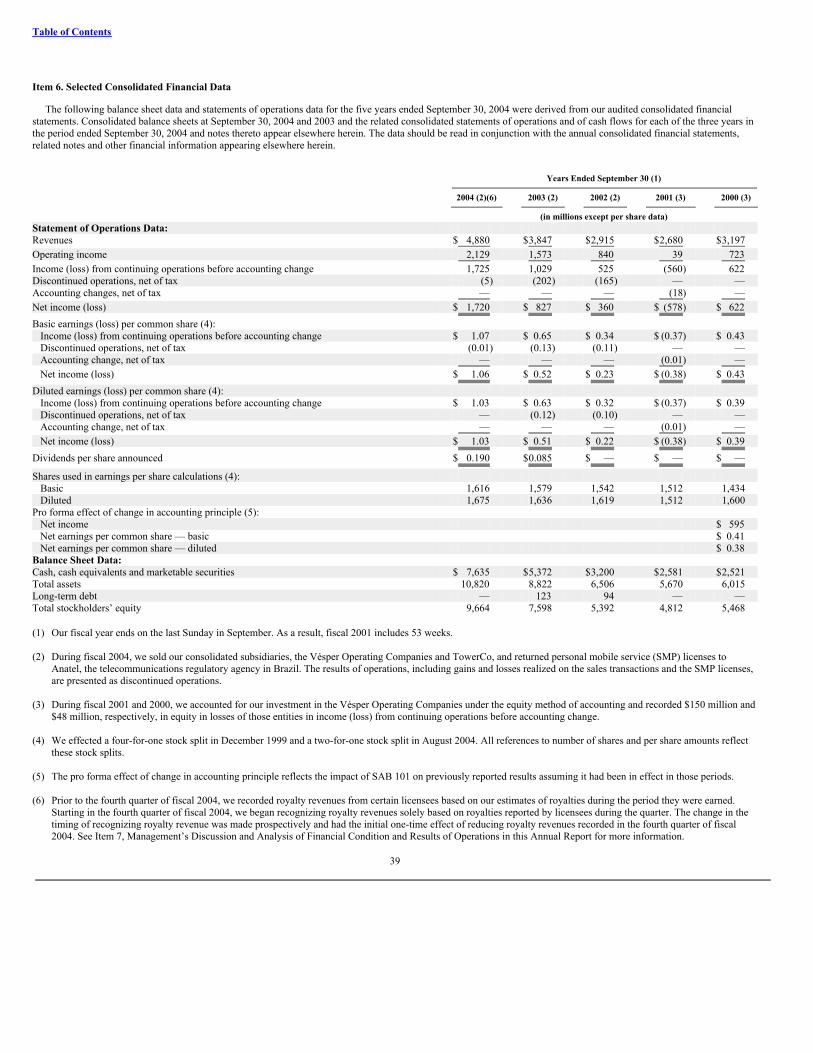
Table of Contents
Item 6. Selected Consolidated Financial Data
The following balance sheet data and statements of operations data for the five years ended September 30, 2004 were derived from our audited consolidated financialstatements. Consolidated balance sheets at September 30, 2004 and 2003 and the related consolidated statements of operations and of cash flows for each of the three years inthe period ended September 30, 2004 and notes thereto appear elsewhere herein. The data should be read in conjunction with the annual consolidated financial statements,related notes and other financial information appearing elsewhere herein.
Years Ended September 30 (1)
2004 (2)(6)
2003 (2)
2002 (2)
2001 (3)
2000 (3)
(in millions except per share data)Statement of Operations Data: Revenues $ 4,880 $3,847 $2,915 $2,680 $3,197 Operating income 2,129 1,573 840 39 723 Income (loss) from continuing operations before accounting change 1,725 1,029 525 (560) 622 Discontinued operations, net of tax (5) (202) (165) — — Accounting changes, net of tax — — — (18) — Net income (loss) $ 1,720 $ 827 $ 360 $ (578) $ 622 Basic earnings (loss) per common share (4):
Income (loss) from continuing operations before accounting change $ 1.07 $ 0.65 $ 0.34 $ (0.37) $ 0.43 Discontinued operations, net of tax (0.01) (0.13) (0.11) — — Accounting change, net of tax — — — (0.01) — Net income (loss) $ 1.06 $ 0.52 $ 0.23 $ (0.38) $ 0.43
Diluted earnings (loss) per common share (4): Income (loss) from continuing operations before accounting change $ 1.03 $ 0.63 $ 0.32 $ (0.37) $ 0.39 Discontinued operations, net of tax — (0.12) (0.10) — — Accounting change, net of tax — — — (0.01) — Net income (loss) $ 1.03 $ 0.51 $ 0.22 $ (0.38) $ 0.39
Dividends per share announced $ 0.190 $0.085 $ — $ — $ —
Shares used in earnings per share calculations (4): Basic 1,616 1,579 1,542 1,512 1,434 Diluted 1,675 1,636 1,619 1,512 1,600
Pro forma effect of change in accounting principle (5): Net income $ 595 Net earnings per common share — basic $ 0.41 Net earnings per common share — diluted $ 0.38
Balance Sheet Data: Cash, cash equivalents and marketable securities $ 7,635 $5,372 $3,200 $2,581 $2,521 Total assets 10,820 8,822 6,506 5,670 6,015 Long-term debt — 123 94 — — Total stockholders’ equity 9,664 7,598 5,392 4,812 5,468
(1) Our fiscal year ends on the last Sunday in September. As a result, fiscal 2001 includes 53 weeks. (2) During fiscal 2004, we sold our consolidated subsidiaries, the Vésper Operating Companies and TowerCo, and returned personal mobile service (SMP) licenses to
Anatel, the telecommunications regulatory agency in Brazil. The results of operations, including gains and losses realized on the sales transactions and the SMP licenses,are presented as discontinued operations.
(3) During fiscal 2001 and 2000, we accounted for our investment in the Vésper Operating Companies under the equity method of accounting and recorded $150 million and
$48 million, respectively, in equity in losses of those entities in income (loss) from continuing operations before accounting change. (4) We effected a four-for-one stock split in December 1999 and a two-for-one stock split in August 2004. All references to number of shares and per share amounts reflect
these stock splits. (5) The pro forma effect of change in accounting principle reflects the impact of SAB 101 on previously reported results assuming it had been in effect in those periods. (6) Prior to the fourth quarter of fiscal 2004, we recorded royalty revenues from certain licensees based on our estimates of royalties during the period they were earned.
Starting in the fourth quarter of fiscal 2004, we began recognizing royalty revenues solely based on royalties reported by licensees during the quarter. The change in thetiming of recognizing royalty revenue was made prospectively and had the initial one-time effect of reducing royalty revenues recorded in the fourth quarter of fiscal2004. See Item 7, Management’s Discussion and Analysis of Financial Condition and Results of Operations in this Annual Report for more information.
39
Table of Contents
Item 7. Management’s Discussion and Analysis of Financial Condition and Results of Operations
In addition to historical information, the following discussion contains forward-looking statements that are subject to risks and uncertainties. Actual results may differsubstantially from those referred to herein due to a number of factors, including but not limited to risks described in the section entitled Risk Factors and elsewhere in thisAnnual Report.
Overview
Recent Highlights
Revenues for fiscal 2004 were $4.9 billion, with net income of $1.7 billion. The following recent developments during fiscal 2004 were key for our business:
• Strong CDMA market growth throughout the world drove demand for our products and the products of our licensees. Enhanced multimedia functionality, increasedgrowth of 1xEV-DO, local number portability initiatives and improving competitive positioning of CDMA operators drove worldwide growth in CDMA phone sales.Introduction of new CDMA networks in developing regions, as well as continued growth of networks in China and India, also contributed to growth in CDMA sales.Worldwide, 1xEV-DO grew to over nine million subscribers in September 2004. During fiscal 2004, we shipped approximately 137 million Mobile Station Modem(MSM) integrated circuits for mobile CDMA phones and data modules, nearly all of which were third generation (3G), including CDMA2000 1X, 1xEV-DO andWCDMA.
• By calendar year end 2004, operators are expected to have launched 70 WCDMA networks as reported by GSMA (GSM Association). WCDMA subscriber growthin Japan and Europe, and new network launches in Europe and Asia drove growth in WCDMA phone sales during fiscal 2004. Thirteen subscriber licensees andeleven infrastructure licensees reported sales of WCDMA products in the fourth quarter of fiscal 2004. WCDMA royalties grew from 12% of royalties reported in thefirst fiscal quarter of 2004 for licensee sales during the fourth fiscal quarter of 2003 to 26% of royalties reported in the fourth fiscal quarter of fiscal 2004 for licenseesales during the third fiscal quarter of fiscal 2004. Currently, average WCDMA phone prices are significantly higher than worldwide average CDMA2000 phoneprices. During fiscal 2004, several leading manufacturers announced the selection of our WCDMA MSM integrated circuits for their WCDMA phone products,including Siemens, Samsung, LG Electronics, Sanyo and Option.
• As a result of record demand for CDMA products, our integrated circuits business continued to experience supply constraints which resulted in our inability to meetcertain customer demands. To enable better supply of integrated circuit products, we have increased and extended firm orders to our foundry suppliers and areworking with them to increase capacity. We are also evaluating potential new suppliers to augment our future needs.
• In the fourth quarter of fiscal 2004, we determined that, due to the global growth of WCDMA networks and the increasing variability of our licensees’ market sharesdue to greater global competition, we would begin to recognize royalty revenues solely based on royalties reported by licensees during the quarter, rather thancontinuing to estimate royalty revenues earned from certain licensees in advance of receiving their royalty reports. Accordingly, we did not estimate royalty revenuesearned in the fourth quarter of fiscal 2004, and royalties recorded as revenue for fiscal 2004 do not reflect an entire year’s worth of royalties (some royalties reportedin the first quarter of fiscal 2004 were recorded based on estimates as revenue in the fourth quarter of fiscal 2003).
Our Business and Operating Segments
We design, manufacture and market digital wireless telecommunications products and services based on our CDMA technology and other technologies. We derive revenueprincipally from sales of integrated circuit products, from license fees and royalties for use of our intellectual property, from services and related hardware sales and fromsoftware development and related services. Operating expenses primarily consist of cost of equipment and services, research and development, selling, general andadministrative, amortization of acquisition-related intangible assets, asset impairment charges and other expenses.
40
Table of Contents
We conduct business through four operating segments. These segments are: QUALCOMM CDMA Technologies, or QCT; QUALCOMM Technology Licensing, or QTL;QUALCOMM Wireless & Internet, or QWI; and QUALCOMM Strategic Initiatives, or QSI.
QCT is a leading developer and supplier of integrated circuits and system software for wireless voice and data communications, multimedia functions and globalpositioning. QCT’s integrated circuit products and software are used in wireless phones and infrastructure equipment. The wireless phone integrated circuits include theMobile Station Modem (MSM), Radio Frequency (RF) and Power Management (PM) devices. The wireless phone integrated circuits and software perform voice and datacommunication, multimedia and global positioning functions, radio conversion between radio and baseband signals and power management. The infrastructure equipmentintegrated circuits provide the core baseband CDMA modem functionality in the operator’s equipment. QCT software products are the operating systems that control thephone and the functionality imbedded in our integrated circuit products. QCT revenues comprised 63% of total consolidated revenues in both fiscal 2004 and 2003 and 54% oftotal consolidated revenues in fiscal 2002.
QTL grants licenses to use portions of our intellectual property portfolio, which includes certain patent rights essential to and/or useful in the manufacture and sale ofCDMA (including, without limitation, cdmaOne, CDMA2000 1X/1xEV-DO/1xEV-DV, TD-SCDMA and WCDMA) products. QTL receives license fees as well as ongoingroyalties based on worldwide sales by licensees of products incorporating our intellectual property. QTL revenues comprised 27%, 26% and 29% of total consolidatedrevenues in fiscal 2004, 2003 and 2002, respectively.
QWI, which includes QUALCOMM Wireless Business Solutions (QWBS), QUALCOMM Internet Services (QIS) and QUALCOMM Government Technologies(QGOV), generates revenue primarily through mobile communication products and services, software and software development aimed at support and delivery of wirelessapplications. QWBS provides satellite and terrestrial-based two-way data messaging and position reporting services to transportation companies, private fleets, constructionequipment fleets and other enterprise companies. QIS provides the BREW product and services for the development and over-the-air deployment of data services on wirelessdevices. QIS also provides QChat and QPoint products and services. QChat enables virtually instantaneous push-to-chat functionality on CDMA-based wireless devices whileQPoint enables operators to offer E-911 and location-based applications and services. The QGOV division provides development, hardware and analytical expertise to UnitedStates government agencies involving wireless communications technologies. The QGOV division included the former Digital Cinema business prior to June 2004. InJune 2004, we were notified that a competing digital cinema compression technology was selected by the motion picture studio consortium tasked with technology selectionfor digital cinema applications. As such, we are no longer pursuing the Digital Cinema business. Revenues from the Digital Cinema business were $1 million, $9 million and$14 million in fiscal 2004, 2003 and 2002, respectively. QWI revenues comprised 12%, 13% and 16% of total consolidated revenues in fiscal 2004, 2003 and 2002,respectively.
QSI makes strategic investments to promote the worldwide adoption of CDMA products and services for wireless voice and Internet data communications. Our strategy isto invest in CDMA operators, licensed device manufacturers and start-up companies that we believe open new markets for CDMA technology, support the design andintroduction of new CDMA-based products or possess unique capabilities or technology to promote Internet data communications. Effective as of the beginning of fiscal2005, we expect to present the operating results of our wireless multimedia U.S. operator in the QSI segment.
Looking Forward
In fiscal year 2005, we expect continued growth in the overall CDMA2000 and WCDMA market, with particularly strong growth in WCDMA and emerging CDMA2000markets. We expect continued growth in 1xEV-DO in South Korea, Japan and Latin America, as well as North America, with expected launches of nationwide service by bothVerizon Wireless and Sprint PCS. The global expansion of broadband data services is expected to continue to drive demand for both 1xEV-DO phones and data cards forlaptop services. Operator competition in Japan, North America and other regions is also accelerating data strategies and services as one operator responds to the plans ofanother. As reported by mobilemonday.net, a community of and for mobile professionals, operators are expected to have launched 70 WCDMA networks by the end ofcalendar 2004, which is expected to drive meaningful growth in WCDMA phone sales during fiscal year 2005. Cingular Wireless in North America is looking to launchWCDMA/HSDPA later in 2005. We anticipate 3G wireless licenses will be granted in China in calendar 2005. When the licenses are granted, we expect operators in Chinawill be authorized to upgrade and deploy third
41
Table of Contents
generation CDMA-based networks. We also expect additional CDMA450 network launches in fiscal 2005 to contribute to growth. We believe our QCT business willincreasingly benefit from strong growth in the WCDMA market as we leverage our high quality products and customer relationships to further a strong and growing list ofWCDMA phone manufacturer customers.
Growing demand for phones and devices with greater multimedia functionality will continue to drive demand for increasing functionality in our MSM chips. We willcontinue to invest heavily to position our QCT business for success in the WCDMA market, as well as to continue to maintain our strong position in the CDMA2000 market.In particular, we intend to continue to invest significant resources in developing integrated circuit products to support high-speed wireless Internet access and multimode,multiband, multinetwork operation including CDMA2000 1X and 1xEV-DO, WCDMA, FLO, OFDM and multimedia applications which encompass development ofgraphical display, camera and video capabilities, as well as higher computational capability and lower power on - chip computers and signal processors. We continue to workon different initiatives for low-cost phones in addition to reducing costs through further integration of multimedia capabilities of mid- to high-end phones. We will alsocontinue our significant development efforts with respect to our BREW applications development platform and our new MediaFLO content distribution system and FLOtechnology for delivery of low cost multimedia content to multiple subscribers.
We are working closely with many operators and manufacturers to support rapid and reliable WCDMA deployment and availability of WCDMA phones (with increasingmultimedia features and capabilities). We expect that in 2005 average WCDMA phone prices will decrease significantly, although we expect them to still be higher thanaverage CDMA2000 phone prices.
BREW is expected to play an increasingly important role in generating consumer demand for wireless phones. BREW offers operators new capabilities for their productsand an open platform for delivery of data services that can grow operator’s data revenues. We expect more operators to launch BREW services and greater volumes of BREWsoftware downloads to drive increasing revenues for our BREW business.
Although we have taken action to mitigate shortages of integrated circuits that we supply, the effects of such shortages have caused some customer frustration and couldnegatively affect our future business. We expect that the costs of certain integrated circuit products could increase as a result of our efforts to increase the availability ofproducts in short supply. While we work closely with customers to expedite their processes for evaluating products from our new foundry suppliers, in some instances,transition to new product supply may cause a temporary decline in shipments of specific products to individual customers. As a result of our efforts to increase capacity at ourcurrent suppliers combined with the potential to bring on additional suppliers, we expect our shortages of integrated circuits to be alleviated in the future.
We are dependent upon the adoption and commercial deployment of 3G wireless communications equipment, products and services based on our CDMA technology toincrease our revenues and market share. We continue to face significant competition from non-CDMA technologies, as well as competition from companies offering otherCDMA based products. You should also refer to the Risk Factors included in this Annual Report for further discussion of these and other risks related to our business.
Revenue Concentrations
Revenues from customers in South Korea, the United States and Japan comprised 43%, 21% and 18%, respectively, of total consolidated revenues in fiscal 2004 ascompared to 45%, 23% and 15%, respectively, in fiscal 2003, and 39%, 31% and 18%, respectively, in fiscal 2002. We distinguish revenue from external customers bygeographic areas based on customer location. The increase in revenues from customers in Japan, as a percentage of the total, is primarily attributed to higher royalties fromlicensees in Japan resulting from the growth of CDMA2000 and WCDMA in Japan as well as their success in exporting products worldwide. The decrease in revenues fromcustomers in the United States, as a percentage of the total, is primarily attributed to overall increases in revenues in geographic regions other than the United States.
Critical Accounting Policies and Estimates
Our discussion and analysis of our results of operations and liquidity and capital resources are based on our consolidated financial statements which have been prepared inaccordance with accounting principles generally accepted in the United States. The preparation of these financial statements requires us to make estimates and judgments thataffect the reported amounts of assets, liabilities, revenues and expenses, and disclosure of contingent
42
Table of Contents
assets and liabilities. On an ongoing basis, we evaluate our estimates and judgments, including those related to revenue recognition, valuation of intangible assets andinvestments, income taxes, and litigation. We base our estimates on historical and anticipated results and trends and on various other assumptions that we believe arereasonable under the circumstances, including assumptions as to future events. These estimates form the basis for making judgments about the carrying values of assets andliabilities that are not readily apparent from other sources. By their nature, estimates are subject to an inherent degree of uncertainty. Actual results that differ from ourestimates could have a significant adverse effect on our operating results and financial position. We believe that the following significant accounting policies and assumptionsmay involve a higher degree of judgment and complexity than others.
Revenue Recognition. We derive revenue principally from sales of integrated circuit products, from royalties for our intellectual property, from messaging and otherservices and related hardware sales, from software development and related services, and from license fees for intellectual property. The timing of revenue recognition and theamount of revenue actually recognized in each case depends upon a variety of factors, including the specific terms of each arrangement and the nature of our deliverables andobligations. Determination of the appropriate amount of revenue recognized involves judgments and estimates that we believe are reasonable, but it is possible that actualresults may differ from our estimates.
We license rights to use portions of our intellectual property portfolio, which includes certain patent rights essential to and/or useful in the manufacture and sale of CDMA(including, without limitation, cdmaOne, CDMA2000 1X/1x EV-DO/1xEV-DV, TD-SCDMA and WCDMA) products. We recognized royalty revenue as earned whenreasonable estimates of such amounts could be made for certain licensees through the third quarter of fiscal 2004. Starting in the fourth quarter of fiscal 2004, we recognizerevenues solely when royalties are reported to us by our licensees as we no longer have the ability to reliably estimate these amounts. The change in the timing of recognizingroyalty revenue was made prospectively and had the initial one-time effect of reducing royalty revenues recorded in the fourth quarter of fiscal 2004 due to the fact that noestimated royalty revenues were recorded in that quarter. As a result of this change, we believe that the estimates and assumptions used in applying our revenue recognitionpolicies with respect to the timing and amount of recording our royalty revenues will have a less material impact on our consolidated financial statements.
Valuation of Intangible Assets and Investments. Our business acquisitions typically result in goodwill and other intangible assets, and the recorded values of those assetsmay become impaired in the future. As of September 30, 2004, our goodwill and intangible assets, net of accumulated amortization, were $356 million and $128 million,respectively. The determination of the value of such intangible assets requires management to make estimates and assumptions that affect our consolidated financialstatements. We assess potential impairments to intangible assets when there is evidence that events or changes in circumstances indicate that the carrying amount of an assetmay not be recovered. Our judgments regarding the existence of impairment indicators and future cash flows related to intangible assets are based on operational performanceof our acquired businesses, market conditions and other factors. Although there are inherent uncertainties in this assessment process, the estimates and assumptions we use areconsistent with our internal planning. If these estimates or their related assumptions change in the future, we may be required to record an impairment charge on all or aportion of our goodwill and intangible assets. Furthermore, we cannot predict the occurrence of future impairment-triggering events nor the impact such events might have onour reported asset values. Future events could cause us to conclude that impairment indicators exist and that goodwill or other intangible assets associated with our acquiredbusinesses is impaired. Any resulting impairment loss could have an adverse impact on our results of operations.
We hold minority strategic investments in publicly-traded companies whose share prices may be highly volatile. These investments totaled $150 million at September 30,2004. We record impairment charges when we believe an investment has experienced a decline that is other than temporary. The determination that a decline is other thantemporary is subjective and influenced by many factors. Future adverse changes in market conditions or poor operating results of investees could result in losses or an inabilityto recover the carrying value of the investments, thereby possibly requiring impairment charges in the future. When assessing a publicly-traded investment for an other-than-temporary decline in value, we consider such factors as, among other things, how significant the decline in value is as a percentage of the original cost, how long the marketvalue of the investment has been less than its original cost, the performance of the investee’s stock price in relation to the stock price of its competitors within the industry andthe market in general and analyst recommendations. We also review the financial statements of the investee to determine if the investee is experiencing financial difficulties.In the event our judgments change as to
43

Table of Contents
other-than-temporary declines in value, we may record an impairment loss which could have an adverse impact on our results of operations.
We hold minority strategic investments in private companies whose values are difficult to determine. These investments totaled $163 million at September 30, 2004. Werecord impairment charges when we believe an investment has experienced a decline that is other than temporary. The determination that a decline is other than temporary issubjective and influenced by many factors. Future adverse changes in market conditions or poor operating results of investees could result in losses or an inability to recoverthe carrying value of the investments, thereby possibly requiring impairment charges in the future. When assessing investments in private companies for an other-than-temporary decline in value, we consider such factors as, among other things, the share price from the investee’s latest financing round, the performance of the investee inrelation to its own operating targets and its business plan, the investee’s revenue and cost trends, the liquidity and cash position, including its cash burn rate and marketacceptance of the investee’s products and services. From time to time, we may consider third party evaluations, valuation reports or advice from investment banks. We alsoconsider new products/services that the investee may have forthcoming, any significant news that has been released specific to the investee or the investee’s competitorsand/or industry and the outlook of the overall industry in which the investee operates. In the event our judgments change as to other-than temporary declines in value, we mayrecord an impairment loss which could have an adverse impact on our results of operations.
Income Taxes. Our income tax provision is based on calculations and assumptions that will be subject to examination by the Internal Revenue Service and other taxauthorities. We regularly assess the potential outcomes of these examinations and any future examinations for the current or prior years in determining the adequacy of ourprovision for income taxes. Should the actual results differ from our estimates, we would have to adjust the income tax provision in the period in which the facts that give riseto the revision become known. Such adjustment could have a material impact on our results of operations.
The Company regularly reviews its deferred tax assets for recoverability and establishes a valuation allowance based on historical taxable income, projected future taxableincome, the expected timing of the reversals of existing temporary differences and the implementation of tax-planning strategies. As of September 30, 2004, gross deferred taxassets were $1.1 billion. If the Company is unable to generate sufficient future taxable income in certain tax jurisdictions, or if there is a material change in the actual effectivetax rates or time period within which the underlying temporary differences become taxable or deductible, the Company could be required to increase its valuation allowanceagainst its deferred tax assets which could result in an increase in its effective tax rate and an adverse impact on operating results.
As of September 30, 2004, the Company has recorded gross deferred tax assets of $418 million related to capital loss carry forwards. We can only use capital losses tooffset capital gains. Based upon our assessments of projected future capital gains and losses and related tax planning strategies, we expect that our future capital gains will notbe sufficient to utilize all the capital losses that we have incurred through fiscal 2004. Therefore, we have provided a valuation allowance in the amount of $139 million for theportion of capital losses we do not expect to utilize. Adjustments to our valuation allowance based on changes to our forecast of capital losses and capital gains are reflected inthe period the change is made.
We consider the operating earnings of non-United States subsidiaries to be indefinitely invested outside the United States. No provision has been made for United Statesfederal and state, or foreign taxes that may result from future remittances of undistributed earnings of foreign subsidiaries, the cumulative amount of which is approximately$1.5 billion as of September 30, 2004. Should we repatriate foreign earnings, we would have to adjust the income tax provision in the period in which the decision to repatriateearnings of foreign subsidiaries is made. We are currently studying the impact of the one-time favorable foreign dividend provisions recently enacted as part of the AmericanJobs Creation Act of 2004, and may decide to repatriate future earnings of some of our foreign subsidiaries.
Litigation. We are currently involved in certain legal proceedings. Although there can be no assurance that unfavorable outcomes in any of these matters would not have amaterial adverse effect on the Company’s operating results, liquidity or financial position, the Company believes the claims are without merit and intends to vigorously defendthe actions. We estimate the range of liability related to pending litigation where the amount and range of loss can be estimated. We record our best estimate of a loss when theloss is considered probable. Where a liability is probable and there is a range of estimated loss with no best estimate in the range, we record the minimum estimated
44
Table of Contents
liability related to the claim. As additional information becomes available, we assess the potential liability related to our pending litigation and revise our estimates. TheCompany has not recorded any accrual for contingent liability associated with the Company’s legal proceedings based on the Company’s belief that a liability, while possible,is not probable. Further, any possible range of loss cannot be estimated at this time. Revisions in our estimates of the potential liability could materially impact our results ofoperations.
Licensing
We grant licenses to use portions of our intellectual property portfolio, which includes certain patent rights essential to and/or useful in the manufacture, use and sale ofCDMA (including, without limitation, cdmaOne, CDMA2000 1X/1xEV-DO/1xEV-DV, TD-SCDMA and WCDMA) products. Licensees typically pay a nonrefundablelicense fee in one or more installments and ongoing royalties based on their sales of products incorporating or using our licensed intellectual property. License fees arerecognized over the estimated period of future benefit to the average licensee, typically five to seven years. We earn royalties on such licensed CDMA products soldworldwide by our licensees at the time that the licensees’ sales occur. Our licensees, however, do not report and pay royalties owed for sales in any given quarter until after theconclusion of that quarter, and, in some instances, although royalties are reported quarterly, payment is on a semi-annual basis. During periods preceding the fourth quarter offiscal 2004, we estimated and recorded the royalty revenues earned for sales by certain licensees (the Estimated Licensees) in the quarter in which such sales occurred, butonly when reasonable estimates of such amounts could be made. Not all royalties earned were estimated. Royalties for licensees for which we had minimal reporting historyand certain licensees that did not incorporate our integrated circuit products into their own products were recorded one quarter in arrears, i.e. in the quarter in which theroyalties were reported to us by those licensees. Estimates of royalty revenues for the Estimated Licensees were based on analyses of our sales of integrated circuits toEstimated Licensees, historical royalty data for Estimated Licensees, an estimate of the time between our sales of integrated circuits to Estimated Licensees and EstimatedLicensees’ sales of CDMA products, average sales price forecasts, estimates of inventory levels and current market and economic trends. Once royalty reports were receivedfrom the Estimated Licensees, the variance between such reports and the estimate was recorded as royalty revenue in the quarter in which the reports were received, i.e. inmost cases, the quarter subsequent to the quarter in which the estimated royalties were recorded as revenue.
Starting in the fourth quarter of fiscal 2004, we determined that, due to recent escalating business trends, we no longer have the ability to reliably estimate royalty revenuesfrom certain licensees. These escalating trends include the commercial launches and global expansion of WCDMA networks, changes in market share among licensees due toincreased global competition and increased variability in the integrated circuit and finished product inventories of licensees. Accordingly, we did not estimate royalty revenuesearned in the fourth quarter of fiscal 2004. Starting in the fourth quarter of fiscal 2004, we began recognizing revenues solely based on royalties reported by licensees duringthe quarter. The change in the timing of recognizing royalty revenue was made prospectively and had the initial one-time effect of reducing royalty revenues recorded in thefourth quarter of fiscal 2004. Royalties reported by our licensees were $151 million higher than royalty revenues from external licensees recorded in fiscal 2004 because$151 million in royalties that were reported in the first quarter of fiscal 2004 had been estimated and recorded as revenue in the fourth quarter of fiscal 2003. To facilitate anunderstanding of the impact of the change, the following table compares royalty revenues recorded as revenue in fiscal 2004, 2003 and 2002 to royalties reported by ourlicensees during those same periods (in millions):
45
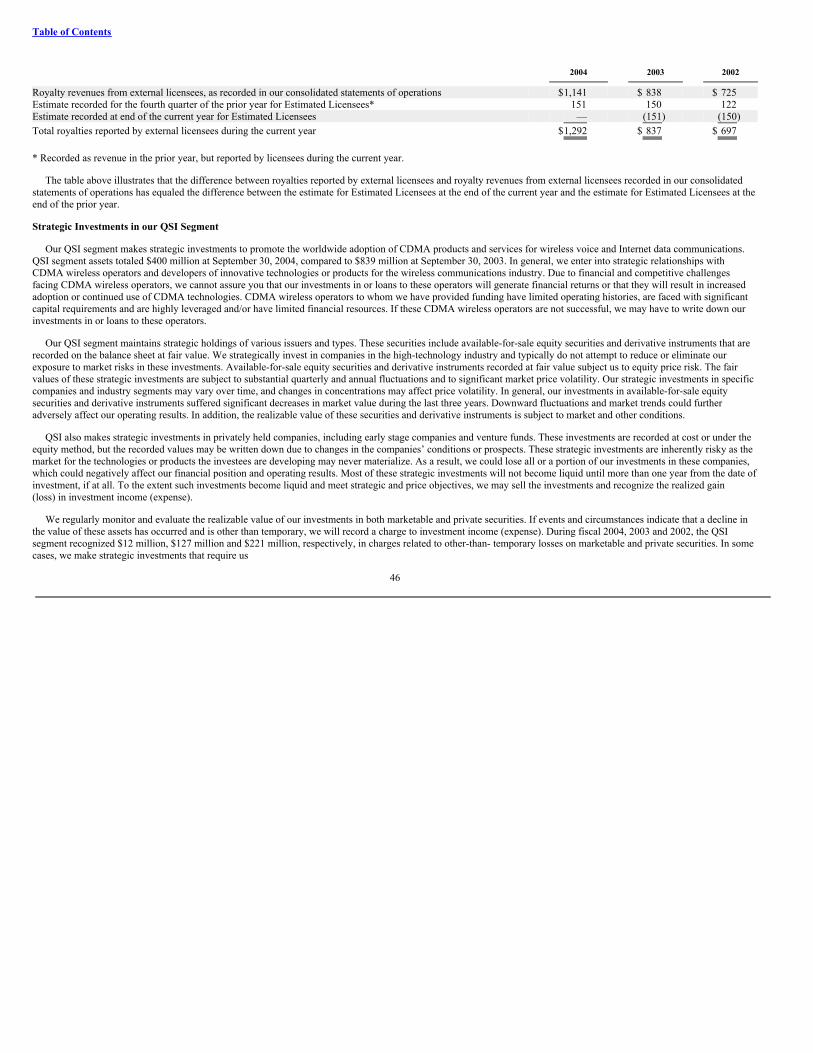
Table of Contents
2004
2003
2002
Royalty revenues from external licensees, as recorded in our consolidated statements of operations $1,141 $ 838 $ 725 Estimate recorded for the fourth quarter of the prior year for Estimated Licensees* 151 150 122 Estimate recorded at end of the current year for Estimated Licensees — (151) (150)Total royalties reported by external licensees during the current year $1,292 $ 837 $ 697
* Recorded as revenue in the prior year, but reported by licensees during the current year.
The table above illustrates that the difference between royalties reported by external licensees and royalty revenues from external licensees recorded in our consolidatedstatements of operations has equaled the difference between the estimate for Estimated Licensees at the end of the current year and the estimate for Estimated Licensees at theend of the prior year.
Strategic Investments in our QSI Segment
Our QSI segment makes strategic investments to promote the worldwide adoption of CDMA products and services for wireless voice and Internet data communications.QSI segment assets totaled $400 million at September 30, 2004, compared to $839 million at September 30, 2003. In general, we enter into strategic relationships withCDMA wireless operators and developers of innovative technologies or products for the wireless communications industry. Due to financial and competitive challengesfacing CDMA wireless operators, we cannot assure you that our investments in or loans to these operators will generate financial returns or that they will result in increasedadoption or continued use of CDMA technologies. CDMA wireless operators to whom we have provided funding have limited operating histories, are faced with significantcapital requirements and are highly leveraged and/or have limited financial resources. If these CDMA wireless operators are not successful, we may have to write down ourinvestments in or loans to these operators.
Our QSI segment maintains strategic holdings of various issuers and types. These securities include available-for-sale equity securities and derivative instruments that arerecorded on the balance sheet at fair value. We strategically invest in companies in the high-technology industry and typically do not attempt to reduce or eliminate ourexposure to market risks in these investments. Available-for-sale equity securities and derivative instruments recorded at fair value subject us to equity price risk. The fairvalues of these strategic investments are subject to substantial quarterly and annual fluctuations and to significant market price volatility. Our strategic investments in specificcompanies and industry segments may vary over time, and changes in concentrations may affect price volatility. In general, our investments in available-for-sale equitysecurities and derivative instruments suffered significant decreases in market value during the last three years. Downward fluctuations and market trends could furtheradversely affect our operating results. In addition, the realizable value of these securities and derivative instruments is subject to market and other conditions.
QSI also makes strategic investments in privately held companies, including early stage companies and venture funds. These investments are recorded at cost or under theequity method, but the recorded values may be written down due to changes in the companies’ conditions or prospects. These strategic investments are inherently risky as themarket for the technologies or products the investees are developing may never materialize. As a result, we could lose all or a portion of our investments in these companies,which could negatively affect our financial position and operating results. Most of these strategic investments will not become liquid until more than one year from the date ofinvestment, if at all. To the extent such investments become liquid and meet strategic and price objectives, we may sell the investments and recognize the realized gain(loss) in investment income (expense).
We regularly monitor and evaluate the realizable value of our investments in both marketable and private securities. If events and circumstances indicate that a decline inthe value of these assets has occurred and is other than temporary, we will record a charge to investment income (expense). During fiscal 2004, 2003 and 2002, the QSIsegment recognized $12 million, $127 million and $221 million, respectively, in charges related to other-than- temporary losses on marketable and private securities. In somecases, we make strategic investments that require us
46
Table of Contents
to consolidate or record our equity in the losses of early stage companies. The consolidation of these losses can adversely affect our financial results until we exit from orreduce our exposure to the investments.
From time to time, we may accept an equity interest in a licensee as consideration for a portion or all of the license fee payable under our CDMA license agreement. QTLrecords license fee revenue based on the fair value of the equity instruments received, if determinable. The measurement date for determination of fair value is the earlier of thedate at which a performance commitment is made or the date at which the performance is complete. The evaluation procedures used to determine fair value include, but arenot limited to, examining the current market price for the shares if the licensee is publicly traded, examining recent rounds of financing and the licensee’s business plan if notpublicly traded, and performing other due diligence procedures. This equity program does not affect the licensees’ obligations to pay royalties under their CDMA licenseagreements. The amount of cash consideration and the timing of revenue recognition vary depending on the terms of each agreement. As of September 30, 2004, ten licenseeshave participated in this program. We recognized $5 million of revenue in each of fiscal 2004 and 2003 and $6 million of revenue in fiscal 2002 related to equity received aslicense fees. The equity investments received from this program are assets of QSI.
Key developments in our strategic investments during fiscal 2004 included the sale of the Vésper Operating Companies and related assets which are presented asdiscontinued operations, our receipt from Pegaso of prepayment of our $193 million loan facility, and ongoing investment in Inquam.
Discontinued Operations in our QSI Segment. In fiscal 1999, we acquired ownership interests in two companies in Brazil, Vésper São Paulo S.A. and Vésper S.A. (theVésper Operating Companies). In November 2001, we consummated a series of transactions resulting in an overall financial restructuring of the Vésper Operating Companies,which resulted in our holding direct and indirect controlling ownership interests in the Vésper Operating Companies.
On December 2, 2003 (the Closing Date), Embratel Participações S.A. (Embratel) acquired our direct and indirect ownership interests in the Vésper Operating Companies(the Embratel sale transaction) for no consideration. The Vésper Operating Companies’ existing communication towers and related interests in tower site property leases(Vésper Towers) were not included in the Embratel sale transaction, and as such, we effectively retained, through a new wholly-owned subsidiary (TowerCo), ownership andcontrol of the Vésper Towers. The Vésper Towers had a net book value of approximately $5 million at December 28, 2003. Concurrent with the closing, the Vésper OperatingCompanies entered into a 10-year agreement (renewable at the Vésper Operating Companies’ option for up to two successive 5-year terms) whereby the Vésper OperatingCompanies would pay a monthly fee to us for use of aerial and ground space on the tower sites. We provided approximately $6 million to fund operations of the VésperOperating Companies during the first quarter of fiscal 2004 prior to their sale and additionally provided approximately $39 million in aggregate funding to or for the benefit ofthe Vésper Operating Companies on or before the Closing Date to facilitate the Embratel sale transaction. Such funding enabled the Vésper Operating Companies tocompletely extinguish their existing local bank debt (at an agreed discount) to allow us to retain ownership of the Vésper Towers free and clear of any local bank securityinterest. The major classes of assets and liabilities sold in the Embratel sale transaction included: $25 million in accounts receivable, $5 million in inventory, $24 million inother current assets, $95 million in property, plant and equipment, $6 million in other assets, $52 million in accounts payable, $5 million in payroll and other benefits relatedliabilities, $6 million in unearned revenue, $1 million in other current liabilities, $14 million in long-term debt and $3 million in other liabilities. We realized a net loss of$52 million on the Embratel sale transaction during the first quarter of fiscal 2004, including a $74 million loss on the net assets sold to Embratel and a $46 million loss relatedto the recognition of cumulative foreign currency translation losses previously included in stockholders’ equity, partially offset by $68 million in gains related to theextinguishment of local bank debt and the settlement of other liabilities.
On November 19, 2002, we won bids to acquire personal mobile service (SMP) licenses in certain regions of Brazil. Approximately $8 million of the approximate$82 million purchase price for the SMP licenses was paid in December 2002. The remaining Brazilian real-denominated obligation was financed by the Brazilian governmentat an interest rate of 12% per annum, plus an adjustment for inflation. These SMP licenses were not included in the Embratel sale transaction. In December 2003, we initiateda waiver and return of the SMP licenses to Anatel, the telecommunications regulatory agency in Brazil. In February 2004, the waiver and return of the SMP licenses wasapproved by Anatel, and the license debt was extinguished. We realized a net gain of $19 million as a result of the removal of the $104 million SMP licenses and the related$123 million debt and accrued interest during the second quarter of fiscal 2004.
47
Table of Contents
On March 2, 2004, we sold TowerCo to Embratel in a separately negotiated transaction (the TowerCo sale transaction) for $45 million in cash. TowerCo’s assets wereprimarily comprised of $5 million in property, plant and equipment. We realized a net gain of $40 million on the TowerCo sale transaction during the second quarter of fiscal2004. As a result of the disposition of the remaining operations and assets related to the Vésper Operating Companies, we determined that the results of operations and cashflows related to the Vésper Operating Companies, including the results related to TowerCo and the SMP licenses and the gains and losses realized on the Embratel andTowerCo sales transactions, should be presented as discontinued operations in our consolidated statements of operations and cash flows. Our statements of operations and cashflows for all prior periods have been adjusted to present the discontinued operations.
For fiscal 2004, 2003 and 2002, revenues of $36 million, $123 million and $125 million, respectively, were reported in the loss from discontinued operations. AtSeptember 30, 2004, we had no remaining assets or liabilities related to the Vésper Operating Companies, TowerCo or the SMP licenses recorded on our consolidated balancesheet.
Prepayment of the Pegaso Telecomunicaciones, S.A. de C.V. Loan Facility. We had various financing arrangements, including a bridge loan facility, an equipment loanfacility, interim and additional interim loan facilities, with Pegaso Comunicaciones y Sistemas S.A. de C.V., a wholly owned subsidiary of Pegaso Telecomunicaciones, S.A.de C.V., a CDMA wireless operator in Mexico (collectively referred to as Pegaso). On September 10, 2002, Telefónica Móviles (Telefónica) acquired a 65% controllinginterest in Pegaso. On October 10, 2002, Pegaso paid $82 million in full satisfaction of the interim and additional interim loans. On November 8, 2002, Pegaso paid$435 million in full satisfaction of the bridge loan facility. We used approximately $139 million of the bridge loan proceeds to purchase outstanding vendor debt owed byPegaso to other lenders. On June 13, 2003, Pegaso prepaid $281 million of the equipment loan facility, including accrued interest, in accordance with certain terms of theequipment loan facility. On December 15, 2003, Pegaso prepaid $193 million, including accrued interest, in full satisfaction of the equipment loan facility. We recognized$12 million, $41 million and $9 million in interest income related to the Pegaso financing arrangements during fiscal 2004, 2003 and 2002, respectively, including $10 millionand $23 million of deferred interest income recorded as a result of the prepayments in fiscal 2004 and 2003, respectively.
Investment in Inquam Limited. We have invested $200 million in the convertible preferred shares of Inquam Limited (Inquam) for an approximate 42% ownershipinterest in Inquam. Inquam owns, develops and manages wireless communications systems, either directly or indirectly, with the intent of deploying CDMA-basedtechnology, primarily in Europe. Starting in the third quarter of fiscal 2003, we and another investor (the Other Investor) also extended $117 million in bridge loan financingsto Inquam, including $31 million in bridge loan funding put in place during fiscal 2004. We funded our approximate $58 million share of these bridge loans and had noremaining funding commitment at September 30, 2004. Inquam is a variable interest entity. We do not consolidate Inquam because we are not the primary beneficiary. We usethe equity method to account for our investment in Inquam. We recorded $59 million, $99 million and $45 million in equity in losses of Inquam during fiscal 2004, 2003 and2002, respectively. At September 30, 2004, our equity and debt investments in Inquam totaled $42 million, net of equity in losses.
On September 22, 2003, we agreed, along with the Other Investor, to guarantee the payment of amounts due by Inquam under a bank credit agreement. During fiscal 2004,we and the Other Investor agreed to extend the guarantee and increase the maximum amount subject to the guarantee to $55 million. Our maximum liability under theguarantee is limited to an amount equal to 50% of the amounts outstanding under Inquam’s credit agreement, up to a maximum of approximately $28 million. Amountsoutstanding under the bank credit agreement totaled $53 million as of September 30, 2004. The guarantee expires on November 30, 2004 when the bank credit facilitymatures. Inquam is currently working with the bank and other potential lenders to secure long-term “take out” financing to repay the existing loan on the maturity date. It ispossible that we and the Other Investor may provide additional guarantees in connection with such take out financing.
During the first quarter of fiscal 2005, we and the Other Investor committed to fund an additional $2 million each. While we have no other obligations to provide fundingto Inquam, we continue to have active discussions with Inquam and the Other Investor concerning the necessary funding for all or a part of Inquam’s business plan, potentialrestructuring and investment by other parties. While we may provide some additional funding and/or credit support in furtherance of Inquam’s business plan, the amount andform of such support is unknown, and none will be provided without commensurate support or consideration being provided by the Other Investor. If Inquam or its
48

Table of Contents
operating companies cannot raise the funding needed for its business plan, Inquam’s growth potential and the value of our investment in Inquam may be negatively affected.
Fiscal 2004 Compared to Fiscal 2003
Revenues. Total revenues for fiscal 2004 were $4,880 million, compared to $3,847 million for fiscal 2003. Revenues from Samsung, LG Electronics and Motorola,customers of our QCT and QTL segments, comprised an aggregate of 15%, 15% and 10% of total consolidated revenues, respectively, in fiscal 2004, compared to 17%, 13%and 13% of total consolidated revenues, respectively, in fiscal 2003.
Revenues from sales of equipment and services for fiscal 2004 were $3,514 million, compared to $2,862 million for fiscal 2003. Revenues from sales of integrated circuitsincreased $652 million, resulting primarily from an increase of $994 million related to higher unit shipments of MSM and accompanying RF integrated circuits, partiallyoffset by a decrease of $331 million related to the effects of reductions in average sales prices and changes in product mix.
Revenues from licensing and royalty fees for fiscal 2004 were $1,366 million, compared to $985 million for fiscal 2003. The increase resulted primarily from higher QTLsegment royalties, resulting primarily from an increase in phone and infrastructure equipment sales by our licensees at higher average selling prices, partially offset by theeffect of the change in timing of recognizing royalties to an “as reported” method during the fourth quarter of fiscal 2004. Royalty revenues recorded in fiscal 2004 excluded$151 million of royalties that were reported by licensees in the first quarter of fiscal 2004, but estimated and recorded as revenue in the fourth quarter of fiscal 2003. Royaltiesreported to us by licensees in fiscal 2004 were $1,292 million as compared to $837 million in fiscal 2003.
Cost of Equipment and Services. Cost of equipment and services revenues for fiscal 2004 was $1,484 million, compared to $1,268 million for fiscal 2003. Cost ofequipment and services revenues as a percentage of equipment and services revenues was 42% for fiscal 2004, compared to 44% for fiscal 2003. The margin percentageimprovement in fiscal 2004 compared to fiscal 2003 was primarily due to the increase in QCT revenues as a percentage of total equipment and services revenues, resulting inincreased QCT margin relative to the total. Cost of equipment and services revenues as a percentage of equipment and services revenues may fluctuate in future quartersdepending on the mix of products sold and services provided, competitive pricing, new product introduction costs and other factors.
Research and Development Expenses. For fiscal 2004, research and development expenses were $720 million or 15% of revenues, compared to $523 million or 14% ofrevenues for fiscal 2003. The dollar and percentage increases in research and development expenses primarily resulted from a $187 million increase in costs related tointegrated circuit products and other initiatives to support multimedia applications, high-speed wireless Internet access and multimode, multiband, multinetwork products,including CDMA2000 1xEV-DO, WCDMA, MediaFLO and HSDPA.
Selling, General and Administrative Expenses. For fiscal 2004, selling, general and administrative expenses were $568 million or 12% of revenues, compared to$471 million or 12% of revenues for fiscal 2003. The dollar increase was primarily due to a $61 million increase in employee-related expenses, a $21 million increase inprofessional fees, primarily patent administration and other legal costs, and outside services, and a $12 million increase related to a charitable grant to an educationalinstitution for the primary purpose of furthering the study of engineering and math.
Asset Impairment and Related Charges. There were no asset impairment charges in fiscal 2004. During fiscal 2003, we recorded a $34 million impairment loss on ourwireless licenses in Australia due to developments that affected potential strategic alternatives for using the spectrum. The impairment loss recognized was the differencebetween the assets’ carrying values and their estimated fair values.
Other Operating Income. For fiscal 2004, other operating income was $26 million, compared to $30 million in fiscal 2003. Other operating income during fiscal 2004resulted primarily from the transfers of portions of the Federal Communications Commission (FCC) auction discount voucher’s value (ADV) to a wireless operator. Otheroperating income during fiscal 2003 resulted from $47 million of other income related to the transfer of portions of the FCC auction discount voucher’s value to two wirelessoperators, offset by a $16 million charge related to the write down of notes receivable from an early stage CDMA wireless operator and an early stage media company.
49
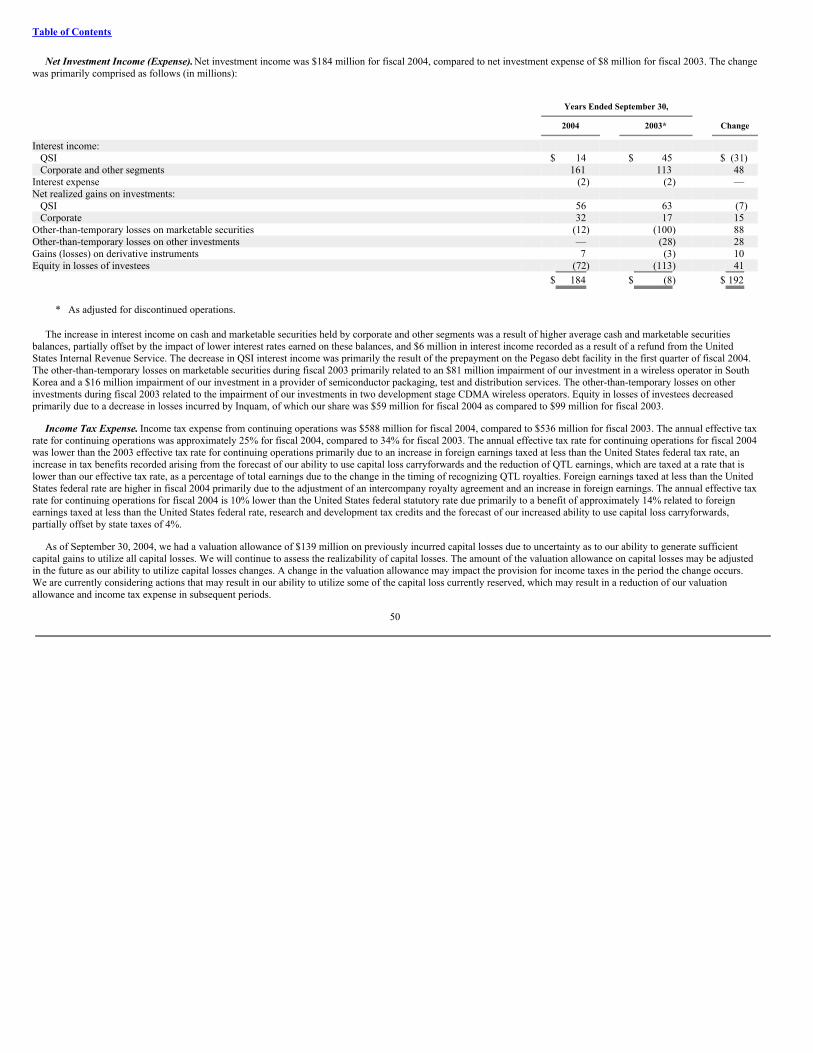
Table of Contents
Net Investment Income (Expense). Net investment income was $184 million for fiscal 2004, compared to net investment expense of $8 million for fiscal 2003. The changewas primarily comprised as follows (in millions):
Years Ended September 30,
2004
2003*
Change
Interest income: QSI $ 14 $ 45 $ (31)Corporate and other segments 161 113 48
Interest expense (2) (2) — Net realized gains on investments:
QSI 56 63 (7)Corporate 32 17 15
Other-than-temporary losses on marketable securities (12) (100) 88 Other-than-temporary losses on other investments — (28) 28 Gains (losses) on derivative instruments 7 (3) 10 Equity in losses of investees (72) (113) 41 $ 184 $ (8) $ 192
* As adjusted for discontinued operations.
The increase in interest income on cash and marketable securities held by corporate and other segments was a result of higher average cash and marketable securitiesbalances, partially offset by the impact of lower interest rates earned on these balances, and $6 million in interest income recorded as a result of a refund from the UnitedStates Internal Revenue Service. The decrease in QSI interest income was primarily the result of the prepayment on the Pegaso debt facility in the first quarter of fiscal 2004.The other-than-temporary losses on marketable securities during fiscal 2003 primarily related to an $81 million impairment of our investment in a wireless operator in SouthKorea and a $16 million impairment of our investment in a provider of semiconductor packaging, test and distribution services. The other-than-temporary losses on otherinvestments during fiscal 2003 related to the impairment of our investments in two development stage CDMA wireless operators. Equity in losses of investees decreasedprimarily due to a decrease in losses incurred by Inquam, of which our share was $59 million for fiscal 2004 as compared to $99 million for fiscal 2003.
Income Tax Expense. Income tax expense from continuing operations was $588 million for fiscal 2004, compared to $536 million for fiscal 2003. The annual effective taxrate for continuing operations was approximately 25% for fiscal 2004, compared to 34% for fiscal 2003. The annual effective tax rate for continuing operations for fiscal 2004was lower than the 2003 effective tax rate for continuing operations primarily due to an increase in foreign earnings taxed at less than the United States federal tax rate, anincrease in tax benefits recorded arising from the forecast of our ability to use capital loss carryforwards and the reduction of QTL earnings, which are taxed at a rate that islower than our effective tax rate, as a percentage of total earnings due to the change in the timing of recognizing QTL royalties. Foreign earnings taxed at less than the UnitedStates federal rate are higher in fiscal 2004 primarily due to the adjustment of an intercompany royalty agreement and an increase in foreign earnings. The annual effective taxrate for continuing operations for fiscal 2004 is 10% lower than the United States federal statutory rate due primarily to a benefit of approximately 14% related to foreignearnings taxed at less than the United States federal rate, research and development tax credits and the forecast of our increased ability to use capital loss carryforwards,partially offset by state taxes of 4%.
As of September 30, 2004, we had a valuation allowance of $139 million on previously incurred capital losses due to uncertainty as to our ability to generate sufficientcapital gains to utilize all capital losses. We will continue to assess the realizability of capital losses. The amount of the valuation allowance on capital losses may be adjustedin the future as our ability to utilize capital losses changes. A change in the valuation allowance may impact the provision for income taxes in the period the change occurs.We are currently considering actions that may result in our ability to utilize some of the capital loss currently reserved, which may result in a reduction of our valuationallowance and income tax expense in subsequent periods.
50
Table of Contents
Fiscal 2003 Compared to Fiscal 2002
Revenues. Total revenues for fiscal 2003 were $3,847 million, compared to $2,915 million for fiscal 2002. Revenues from Samsung, LG Electronics, Motorola andKyocera, customers of our QCT, QTL and other nonreportable segments, comprised an aggregate of 17%, 13%, 13% and 9% of total consolidated revenues, respectively, infiscal 2003, compared to 16%, 12%, 8% and 14% of total consolidated revenues, respectively, in fiscal 2002. The percentages for Kyocera included 1% and 4% in fiscal 2003and 2002, respectively, related to services provided to Kyocera by employees from our terrestrial-based CDMA wireless consumer phone business which was sold to Kyocerain February 2000.
Revenues from sales of equipment and services for fiscal 2003 were $2,862 million, compared to $2,080 million for fiscal 2002. Revenues from sales of integrated circuitsincreased by $828 million, primarily due to an increase in unit shipments of MSM and accompanying RF integrated circuits.
Revenues from licensing and royalty fees for fiscal 2003 were $985 million, compared to $835 million for fiscal 2002. The increase resulted from higher QTL segmentroyalties, resulting from an increase in phone sales by our licensees.
Cost of Equipment and Services. Cost of equipment and services revenues for fiscal 2003 was $1,268 million, compared to $954 million for fiscal 2002. Cost of equipmentand services revenues as a percentage of equipment and services revenues was 44% for fiscal 2003, compared to 46% for fiscal 2002. The margin percentage improvement infiscal 2003 compared to fiscal 2002 was primarily due to the increase in QCT revenues as a percentage of total equipment and services revenues, resulting in increased QCTmargin relative to the total.
Research and Development Expenses. For fiscal 2003, research and development expenses were $523 million or 14% of revenues, compared to $452 million or 16% ofrevenues for fiscal 2002. The dollar increase in research and development expenses was primarily due to an $84 million increase in costs primarily related to increasedengineering resources for integrated circuit products and other initiatives to support multimedia applications, high-speed wireless Internet access and multimode, multiband,multinetwork products, including CDMA2000 1X/1xEV-DO/1xEV-DV, GSM/GPRS/EDGE, WLAN, WCDMA and radioOne technologies, partially offset by an $11 millionreduction in research and development efforts supporting the QGOV division of the QWI segment and a $3 million reduction of support efforts related to the Globalstarbusiness.
Selling, General and Administrative Expenses. For fiscal 2003, selling, general and administrative expenses were $471 million or 12% of revenues, compared to$401 million or 14% of revenues for fiscal 2002. The dollar increase was primarily due to a $27 million increase in employee-related expenses, a $12 million increase indepreciation and amortization expense, a $6 million increase in professional fees, primarily patent administration and outside services, and a $6 million increase related tointernational marketing and support efforts.
Amortization of Goodwill and Other Acquisition Related Intangible Assets. For fiscal 2003, amortization of goodwill and other acquisition related intangible assets was$8 million, compared to $259 million for fiscal 2002. Starting in fiscal 2003, we no longer record goodwill amortization as a result of the adoption of Statement of FinancialAccounting Standards No. 142. Amortization charges were primarily related to the acquisition of SnapTrack in March 2000.
Asset Impairment and Related Charges. For fiscal 2003, asset impairment and related charges were $34 million, compared to less than $1 million of such charges in fiscal2002. During fiscal 2003, we recorded a $34 million impairment loss on our wireless licenses in Australia due to developments that affected potential strategic alternatives forusing the spectrum. The impairment loss recognized was the difference between the assets’ carrying values and their estimated fair values.
Other Operating Income. For fiscal 2003, other operating income was $30 million, compared to other operating expense of $9 million in fiscal 2002. Other operatingincome during fiscal 2003 resulted from $47 million of other income related to the transfer of portions of the FCC auction discount voucher’s value to two wireless operators,offset by a $16 million charge related to the write down of notes receivable from an early stage CDMA wireless operator and an early stage media company. Other operatingexpenses during fiscal 2002 resulted from the write down of a note receivable from an early stage CDMA wireless operator.
51
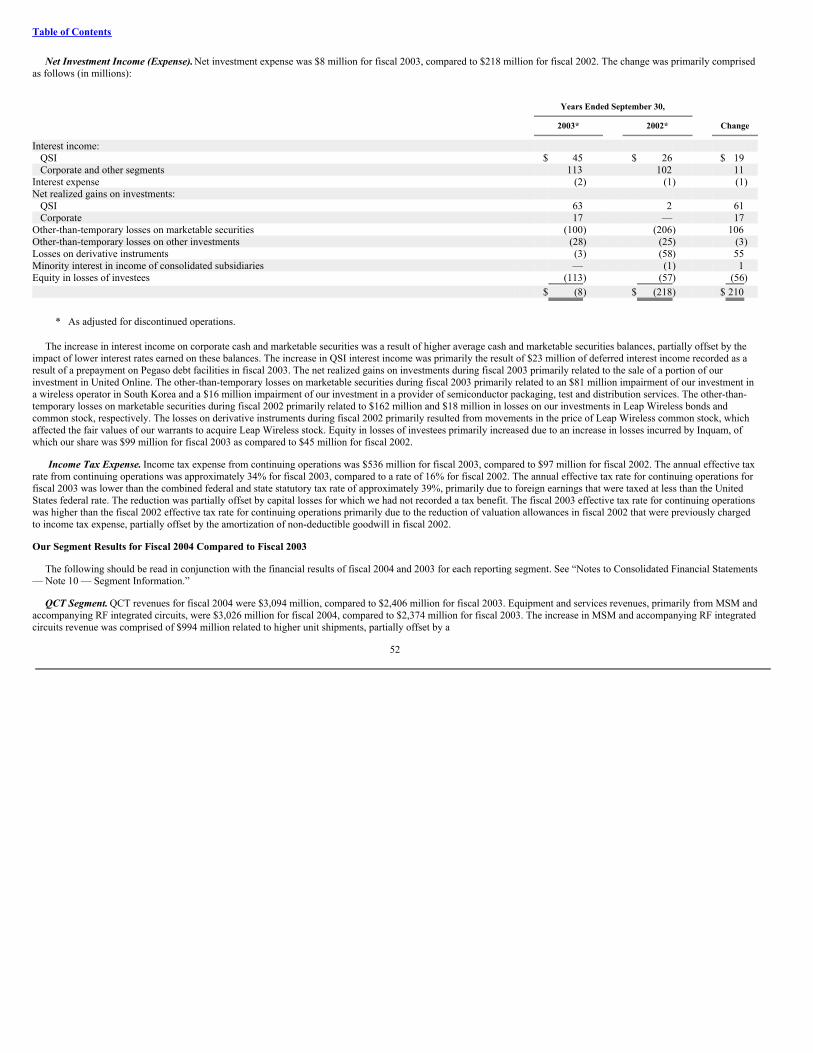
Table of Contents
Net Investment Income (Expense). Net investment expense was $8 million for fiscal 2003, compared to $218 million for fiscal 2002. The change was primarily comprisedas follows (in millions):
Years Ended September 30,
2003*
2002*
Change
Interest income: QSI $ 45 $ 26 $ 19 Corporate and other segments 113 102 11
Interest expense (2) (1) (1)Net realized gains on investments:
QSI 63 2 61 Corporate 17 — 17
Other-than-temporary losses on marketable securities (100) (206) 106 Other-than-temporary losses on other investments (28) (25) (3)Losses on derivative instruments (3) (58) 55 Minority interest in income of consolidated subsidiaries — (1) 1 Equity in losses of investees (113) (57) (56) $ (8) $ (218) $ 210
* As adjusted for discontinued operations.
The increase in interest income on corporate cash and marketable securities was a result of higher average cash and marketable securities balances, partially offset by theimpact of lower interest rates earned on these balances. The increase in QSI interest income was primarily the result of $23 million of deferred interest income recorded as aresult of a prepayment on Pegaso debt facilities in fiscal 2003. The net realized gains on investments during fiscal 2003 primarily related to the sale of a portion of ourinvestment in United Online. The other-than-temporary losses on marketable securities during fiscal 2003 primarily related to an $81 million impairment of our investment ina wireless operator in South Korea and a $16 million impairment of our investment in a provider of semiconductor packaging, test and distribution services. The other-than-temporary losses on marketable securities during fiscal 2002 primarily related to $162 million and $18 million in losses on our investments in Leap Wireless bonds andcommon stock, respectively. The losses on derivative instruments during fiscal 2002 primarily resulted from movements in the price of Leap Wireless common stock, whichaffected the fair values of our warrants to acquire Leap Wireless stock. Equity in losses of investees primarily increased due to an increase in losses incurred by Inquam, ofwhich our share was $99 million for fiscal 2003 as compared to $45 million for fiscal 2002.
Income Tax Expense. Income tax expense from continuing operations was $536 million for fiscal 2003, compared to $97 million for fiscal 2002. The annual effective taxrate from continuing operations was approximately 34% for fiscal 2003, compared to a rate of 16% for fiscal 2002. The annual effective tax rate for continuing operations forfiscal 2003 was lower than the combined federal and state statutory tax rate of approximately 39%, primarily due to foreign earnings that were taxed at less than the UnitedStates federal rate. The reduction was partially offset by capital losses for which we had not recorded a tax benefit. The fiscal 2003 effective tax rate for continuing operationswas higher than the fiscal 2002 effective tax rate for continuing operations primarily due to the reduction of valuation allowances in fiscal 2002 that were previously chargedto income tax expense, partially offset by the amortization of non-deductible goodwill in fiscal 2002.
Our Segment Results for Fiscal 2004 Compared to Fiscal 2003
The following should be read in conjunction with the financial results of fiscal 2004 and 2003 for each reporting segment. See “Notes to Consolidated Financial Statements— Note 10 — Segment Information.”
QCT Segment. QCT revenues for fiscal 2004 were $3,094 million, compared to $2,406 million for fiscal 2003. Equipment and services revenues, primarily from MSM andaccompanying RF integrated circuits, were $3,026 million for fiscal 2004, compared to $2,374 million for fiscal 2003. The increase in MSM and accompanying RF integratedcircuits revenue was comprised of $994 million related to higher unit shipments, partially offset by a
52
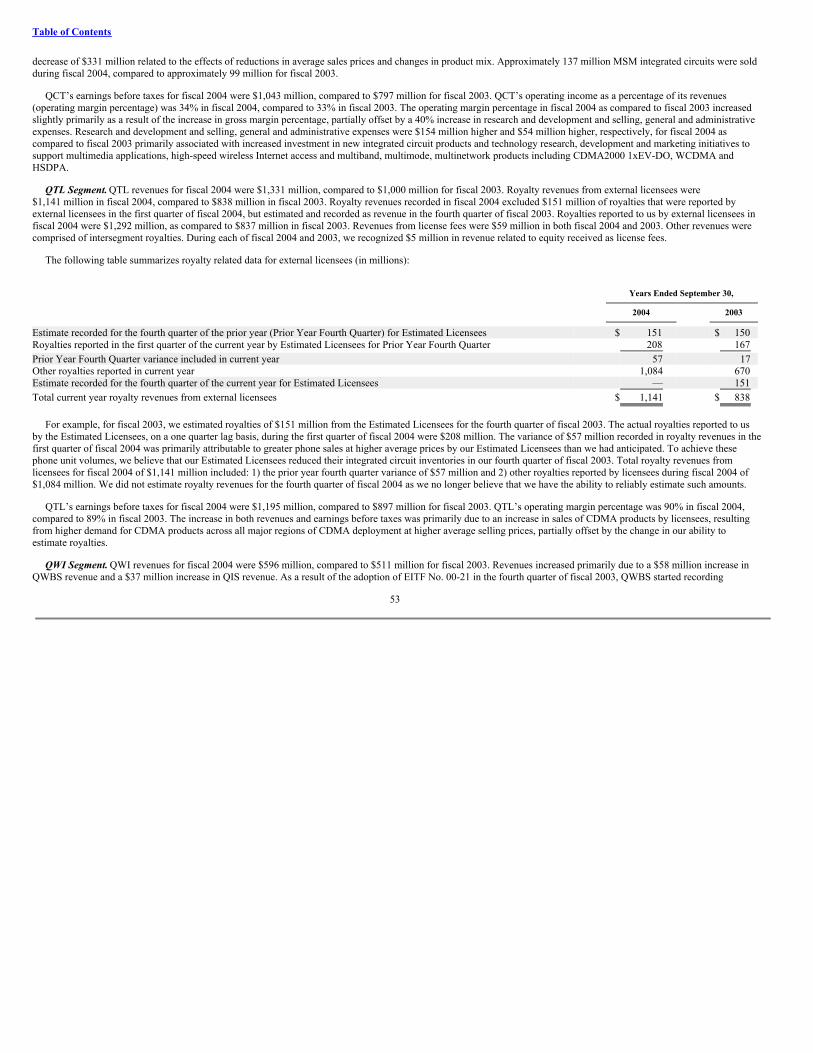
Table of Contents
decrease of $331 million related to the effects of reductions in average sales prices and changes in product mix. Approximately 137 million MSM integrated circuits were soldduring fiscal 2004, compared to approximately 99 million for fiscal 2003.
QCT’s earnings before taxes for fiscal 2004 were $1,043 million, compared to $797 million for fiscal 2003. QCT’s operating income as a percentage of its revenues(operating margin percentage) was 34% in fiscal 2004, compared to 33% in fiscal 2003. The operating margin percentage in fiscal 2004 as compared to fiscal 2003 increasedslightly primarily as a result of the increase in gross margin percentage, partially offset by a 40% increase in research and development and selling, general and administrativeexpenses. Research and development and selling, general and administrative expenses were $154 million higher and $54 million higher, respectively, for fiscal 2004 ascompared to fiscal 2003 primarily associated with increased investment in new integrated circuit products and technology research, development and marketing initiatives tosupport multimedia applications, high-speed wireless Internet access and multiband, multimode, multinetwork products including CDMA2000 1xEV-DO, WCDMA andHSDPA.
QTL Segment. QTL revenues for fiscal 2004 were $1,331 million, compared to $1,000 million for fiscal 2003. Royalty revenues from external licensees were$1,141 million in fiscal 2004, compared to $838 million in fiscal 2003. Royalty revenues recorded in fiscal 2004 excluded $151 million of royalties that were reported byexternal licensees in the first quarter of fiscal 2004, but estimated and recorded as revenue in the fourth quarter of fiscal 2003. Royalties reported to us by external licensees infiscal 2004 were $1,292 million, as compared to $837 million in fiscal 2003. Revenues from license fees were $59 million in both fiscal 2004 and 2003. Other revenues werecomprised of intersegment royalties. During each of fiscal 2004 and 2003, we recognized $5 million in revenue related to equity received as license fees.
The following table summarizes royalty related data for external licensees (in millions):
Years Ended September 30,
2004
2003
Estimate recorded for the fourth quarter of the prior year (Prior Year Fourth Quarter) for Estimated Licensees $ 151 $ 150 Royalties reported in the first quarter of the current year by Estimated Licensees for Prior Year Fourth Quarter 208 167 Prior Year Fourth Quarter variance included in current year 57 17 Other royalties reported in current year 1,084 670 Estimate recorded for the fourth quarter of the current year for Estimated Licensees — 151 Total current year royalty revenues from external licensees $ 1,141 $ 838
For example, for fiscal 2003, we estimated royalties of $151 million from the Estimated Licensees for the fourth quarter of fiscal 2003. The actual royalties reported to usby the Estimated Licensees, on a one quarter lag basis, during the first quarter of fiscal 2004 were $208 million. The variance of $57 million recorded in royalty revenues in thefirst quarter of fiscal 2004 was primarily attributable to greater phone sales at higher average prices by our Estimated Licensees than we had anticipated. To achieve thesephone unit volumes, we believe that our Estimated Licensees reduced their integrated circuit inventories in our fourth quarter of fiscal 2003. Total royalty revenues fromlicensees for fiscal 2004 of $1,141 million included: 1) the prior year fourth quarter variance of $57 million and 2) other royalties reported by licensees during fiscal 2004 of$1,084 million. We did not estimate royalty revenues for the fourth quarter of fiscal 2004 as we no longer believe that we have the ability to reliably estimate such amounts.
QTL’s earnings before taxes for fiscal 2004 were $1,195 million, compared to $897 million for fiscal 2003. QTL’s operating margin percentage was 90% in fiscal 2004,compared to 89% in fiscal 2003. The increase in both revenues and earnings before taxes was primarily due to an increase in sales of CDMA products by licensees, resultingfrom higher demand for CDMA products across all major regions of CDMA deployment at higher average selling prices, partially offset by the change in our ability toestimate royalties.
QWI Segment. QWI revenues for fiscal 2004 were $596 million, compared to $511 million for fiscal 2003. Revenues increased primarily due to a $58 million increase inQWBS revenue and a $37 million increase in QIS revenue. As a result of the adoption of EITF No. 00-21 in the fourth quarter of fiscal 2003, QWBS started recording
53

Table of Contents
revenue for certain equipment sales upon shipment instead of amortizing the related revenue over a future period. The amortization of QWBS equipment revenue that wasdeferred in the periods prior to the adoption of EITF No. 00-21 will continue with a declining impact through 2008. QWBS amortized $76 million in revenue related to suchprior period equipment sales in fiscal 2004, compared to $95 million in fiscal 2003, including $23 million during the fourth quarter of fiscal 2003 after the adoption of EITFNo. 00-21. The net increase in QWBS revenue is primarily attributable to the accounting change for certain equipment sales, with a smaller contribution from a $14 millionincrease in messaging revenue as a result of a larger installed base. QWBS shipped approximately 53,000 OmniTRACS and other related communications systems duringfiscal 2004, compared to approximately 38,000 in fiscal 2003. The increase in QIS revenue is primarily attributable to a $53 million increase in fees related to our expandedBREW customer base and products, partially offset by a $19 million decrease in QChat revenue resulting from the wind down of development efforts under the licensingagreement with Nextel.
QWI’s earnings before taxes for fiscal 2004 were $30 million, compared to $27 million for fiscal 2003. QWI’s operating margin percentage was 5% in both fiscal 2004 and2003. The increase in QWI’s earnings before taxes was primarily due to a $31 million increase in QIS gross margin largely resulting from the increase in fees related to ourexpanded BREW customer base and products, offset by a $30 million increase in QWI research and development and selling, general and administrative expenses. QWI’soperating margin percentage remained flat in fiscal 2004 as compared to fiscal 2003 primarily due to a decline in QWBS gross margin percentage, offset by an improvementin QIS gross margin percentage. The decline in QWBS gross margin percentage in fiscal 2004 as compared to fiscal 2003 is primarily attributable to an increase in equipmentsales, with margins that were lower than the margins on messaging services, as a percentage of total QWBS revenue. The improvement in QIS gross margin percentage isprimarily attributable to the increase in fees related to our expanded BREW customer base and products.
During the second quarter of fiscal 2004, QWBS began the process of moving high volume, standard product manufacturing to Mexico to reduce manufacturing costs. Thelow volume, prototype and new product manufacturing activities will remain in San Diego. The move is anticipated to be completed by the third quarter of fiscal 2005. QWBSmay incur additional costs in the near term as a result of this move. In connection with this activity, we continue to evaluate other low cost manufacturing opportunities.
QSI Segment. QSI’s losses before taxes from continuing operations for fiscal 2004 were $3 million, compared to $168 million for fiscal 2003. Equity in losses of investeesdecreased by $42 million primarily due to a decrease in losses incurred by Inquam during fiscal 2004 as compared to fiscal 2003, of which our share was $59 million for fiscal2004 as compared to $99 million for fiscal 2003. During fiscal 2004, we recorded $12 million in other-than-temporary losses on marketable securities and other investments ascompared to $127 million for fiscal 2003. During fiscal 2003, we also recorded a $34 million impairment loss on our wireless licenses in Australia due to developments thataffected strategic alternatives for using the spectrum. These improvements in QSI’s losses before taxes were partially offset by a $31 million decrease in interest incomeresulting from the prepayment of the Pegaso debt facility in the first quarter of fiscal 2004.
Our Segment Results for Fiscal 2003 Compared to Fiscal 2002
QCT Segment. QCT revenues for fiscal 2003 were $2,406 million, compared to $1,575 million for fiscal 2002. Equipment and services revenues, primarily from MSM andaccompanying RF integrated circuits, were $2,374 million for fiscal 2003, compared to $1,546 million for fiscal 2002. The increase in MSM and accompanying RF integratedcircuits revenue was primarily related to higher unit shipments. Approximately 99 million MSM integrated circuits were sold during fiscal 2003, compared to approximately65 million for fiscal 2002.
QCT’s earnings before taxes for fiscal 2003 were $797 million, compared to $438 million for fiscal 2002. QCT’s operating income as a percentage of its revenues was 33%in fiscal 2003, compared to 28% in fiscal 2002. The operating margin percentage in fiscal 2003 as compared to fiscal 2002 increased primarily as a result of the 53% increasein revenues as compared to the 17% increase in research and development and selling, general and administrative expenses. Research and development and selling, generaland administrative expenses were $58 million higher and $17 million higher, respectively, for fiscal 2003 as compared to fiscal 2002, primarily associated with increasedinvestment in new integrated circuit products and technology research, development and marketing initiatives to support multimedia applications, high-speed wireless Internetaccess and multiband, multimode, multinetwork products including CDMA2000, 1xEV-DO/1xEV-DV and WCDMA.
QTL Segment. QTL revenues for fiscal 2003 were $1,000 million, compared to $847 million for fiscal 2002. Royalty revenues from external licensees were $838 million infiscal 2003, compared to $725 million in fiscal 2002.
54
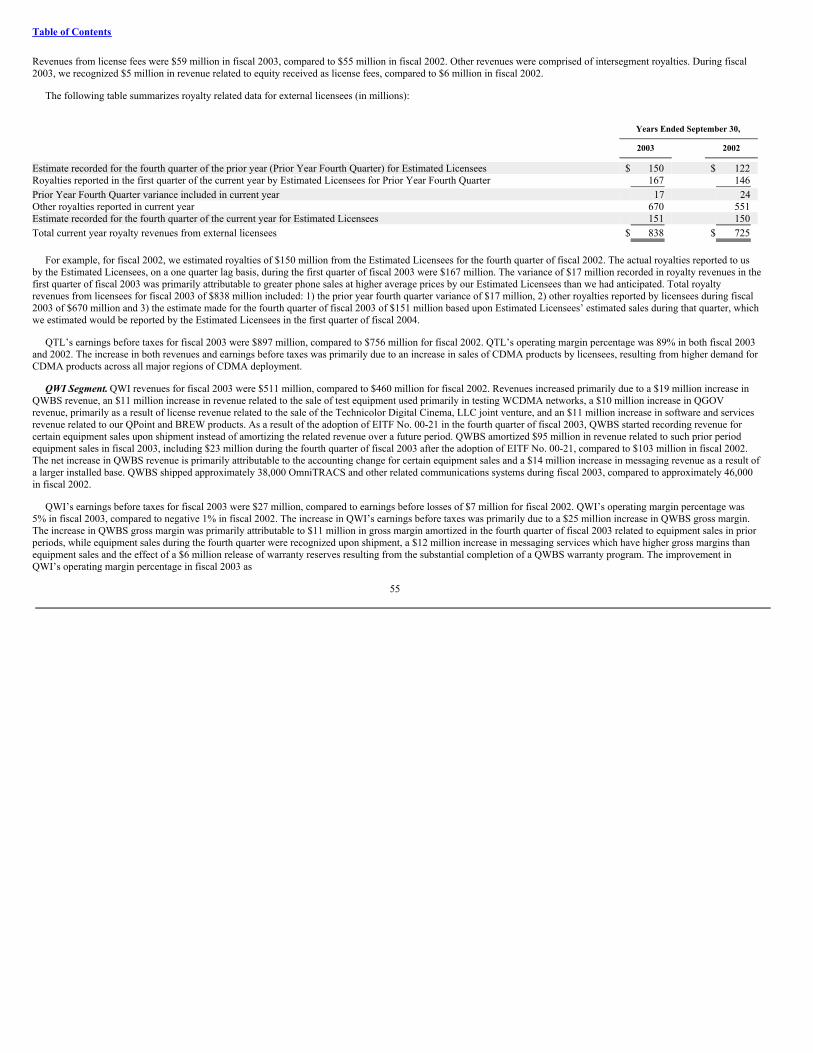
Table of Contents
Revenues from license fees were $59 million in fiscal 2003, compared to $55 million in fiscal 2002. Other revenues were comprised of intersegment royalties. During fiscal2003, we recognized $5 million in revenue related to equity received as license fees, compared to $6 million in fiscal 2002.
The following table summarizes royalty related data for external licensees (in millions):
Years Ended September 30,
2003
2002
Estimate recorded for the fourth quarter of the prior year (Prior Year Fourth Quarter) for Estimated Licensees $ 150 $ 122 Royalties reported in the first quarter of the current year by Estimated Licensees for Prior Year Fourth Quarter 167 146 Prior Year Fourth Quarter variance included in current year 17 24 Other royalties reported in current year 670 551 Estimate recorded for the fourth quarter of the current year for Estimated Licensees 151 150 Total current year royalty revenues from external licensees $ 838 $ 725
For example, for fiscal 2002, we estimated royalties of $150 million from the Estimated Licensees for the fourth quarter of fiscal 2002. The actual royalties reported to usby the Estimated Licensees, on a one quarter lag basis, during the first quarter of fiscal 2003 were $167 million. The variance of $17 million recorded in royalty revenues in thefirst quarter of fiscal 2003 was primarily attributable to greater phone sales at higher average prices by our Estimated Licensees than we had anticipated. Total royaltyrevenues from licensees for fiscal 2003 of $838 million included: 1) the prior year fourth quarter variance of $17 million, 2) other royalties reported by licensees during fiscal2003 of $670 million and 3) the estimate made for the fourth quarter of fiscal 2003 of $151 million based upon Estimated Licensees’ estimated sales during that quarter, whichwe estimated would be reported by the Estimated Licensees in the first quarter of fiscal 2004.
QTL’s earnings before taxes for fiscal 2003 were $897 million, compared to $756 million for fiscal 2002. QTL’s operating margin percentage was 89% in both fiscal 2003and 2002. The increase in both revenues and earnings before taxes was primarily due to an increase in sales of CDMA products by licensees, resulting from higher demand forCDMA products across all major regions of CDMA deployment.
QWI Segment. QWI revenues for fiscal 2003 were $511 million, compared to $460 million for fiscal 2002. Revenues increased primarily due to a $19 million increase inQWBS revenue, an $11 million increase in revenue related to the sale of test equipment used primarily in testing WCDMA networks, a $10 million increase in QGOVrevenue, primarily as a result of license revenue related to the sale of the Technicolor Digital Cinema, LLC joint venture, and an $11 million increase in software and servicesrevenue related to our QPoint and BREW products. As a result of the adoption of EITF No. 00-21 in the fourth quarter of fiscal 2003, QWBS started recording revenue forcertain equipment sales upon shipment instead of amortizing the related revenue over a future period. QWBS amortized $95 million in revenue related to such prior periodequipment sales in fiscal 2003, including $23 million during the fourth quarter of fiscal 2003 after the adoption of EITF No. 00-21, compared to $103 million in fiscal 2002.The net increase in QWBS revenue is primarily attributable to the accounting change for certain equipment sales and a $14 million increase in messaging revenue as a result ofa larger installed base. QWBS shipped approximately 38,000 OmniTRACS and other related communications systems during fiscal 2003, compared to approximately 46,000in fiscal 2002.
QWI’s earnings before taxes for fiscal 2003 were $27 million, compared to earnings before losses of $7 million for fiscal 2002. QWI’s operating margin percentage was5% in fiscal 2003, compared to negative 1% in fiscal 2002. The increase in QWI’s earnings before taxes was primarily due to a $25 million increase in QWBS gross margin.The increase in QWBS gross margin was primarily attributable to $11 million in gross margin amortized in the fourth quarter of fiscal 2003 related to equipment sales in priorperiods, while equipment sales during the fourth quarter were recognized upon shipment, a $12 million increase in messaging services which have higher gross margins thanequipment sales and the effect of a $6 million release of warranty reserves resulting from the substantial completion of a QWBS warranty program. The improvement inQWI’s operating margin percentage in fiscal 2003 as
55
Table of Contents
compared to fiscal 2002 was primarily related to the decrease in research and development and selling, general and administrative expenses as a percentage of QWI’srevenues.
QSI Segment. QSI’s losses before taxes from continuing operations for fiscal 2003 were $168 million, compared to $346 million for fiscal 2002. During fiscal 2003, werecorded a $97 million decrease in other-than-temporary losses on marketable securities and a $55 million decrease in losses on derivative instruments. Equity in losses ofinvestees increased by $56 million primarily due to an increase in losses incurred by Inquam, of which our share was $99 million for fiscal 2003 as compared to $45 millionfor fiscal 2002. During fiscal 2003, we also recorded other income of $47 million related to the transfer of portions of the FCC auction discount voucher value to two wirelessoperators, partially offset by a $34 million impairment loss on our wireless licenses in Australia due to developments that affected strategic alternatives for using the spectrum.
Liquidity and Capital Resources
Cash and cash equivalents and marketable securities were $7.6 billion at September 30, 2004, an increase of $2.3 billion from September 30, 2003. The increase duringfiscal 2004 was primarily the result of $2.5 billion in cash provided by operating activities, $330 million in net proceeds from the issuance of common stock under our stockoption and employee stock purchase plans and $196 million in net collections on finance receivables, mainly comprised of the prepayment from Pegaso, partially offset by$332 million in capital expenditures, $308 million in dividend payments and $70 million invested in other entities and acquisitions.
Accounts receivable increased by 20% during fiscal 2004. The increase in accounts receivable was primarily due to the increase in sales of integrated circuits, partiallyoffset by the effect of the change in the timing of recognizing royalties. Days sales outstanding, on a consolidated basis, were 43 days at September 30, 2004, compared to48 days at September 30, 2003. The change in days sales outstanding is primarily attributable to the effect of the change in the timing of recognizing royalties.
In February 2003, we authorized the expenditure of up to $1 billion to repurchase shares of our common stock over a two-year period. In fiscal 2003, we bought 9,830,000shares at a net aggregate cost of $158 million. While we did not repurchase any of our common stock during fiscal 2004, we continue to evaluate repurchases under thisprogram. In connection with our stock repurchase program, we sold put options in March 2004 that could have required us to purchase 3,000,000 shares of our common stockupon exercise. We repurchased all of the put options in July 2004. We recorded $5 million in premiums received for the put options as investment income. At September 30,2004, $834 million remains authorized for repurchases under the program. We announced dividends totaling approximately $307 million and $135 million, or $0.190 and$0.085 per share, during fiscal 2004 and 2003, respectively.
We believe our current cash and cash equivalents, marketable securities and cash generated from operations will satisfy our expected working and other capitalrequirements for the foreseeable future based on current business plans, including investments in other companies and other assets to support the growth of our business,financing for customers of CDMA infrastructure products in accordance with the agreements with Ericsson, financing under agreements with CDMA telecommunicationsoperators, other commitments, the payment of dividends and possible additional stock buy backs. We started construction of two facilities in San Diego, California in fiscal2003, totaling approximately one million additional square feet, to meet the requirements projected in our long-term business plan. The remaining cost of these new facilitiesis expected to be approximately $250 million through fiscal 2007. We recently announced our plans to expand our current Network Operations Center in Las Vegas, Nevada,which uses GPS and other technologies to track freight transportation and shipping nationwide. We expect the cost of this expansion will be approximately $52 millionthrough fiscal 2007. We expect to place the new and expanded facilities in service starting in fiscal 2005 through fiscal 2007.
We intend to continue our strategic investment activities to promote the worldwide adoption of CDMA products and the growth of CDMA-based wireless data andwireless Internet products, although to a lesser extent than in prior years. As part of these investment activities, we may provide financing to facilitate the marketing and saleof CDMA equipment by authorized suppliers. In the event additional needs for cash arise, we may raise additional funds from a combination of sources including potentialdebt and equity issuance.
During the first quarter of fiscal 2005, we and the Other Investor in Inquam committed to fund an additional $2 million each. While we have no other obligations to providefunding to Inquam, we continue to have active discussions with Inquam and the Other Investor concerning the necessary funding for all or part of Inquam’s business
56
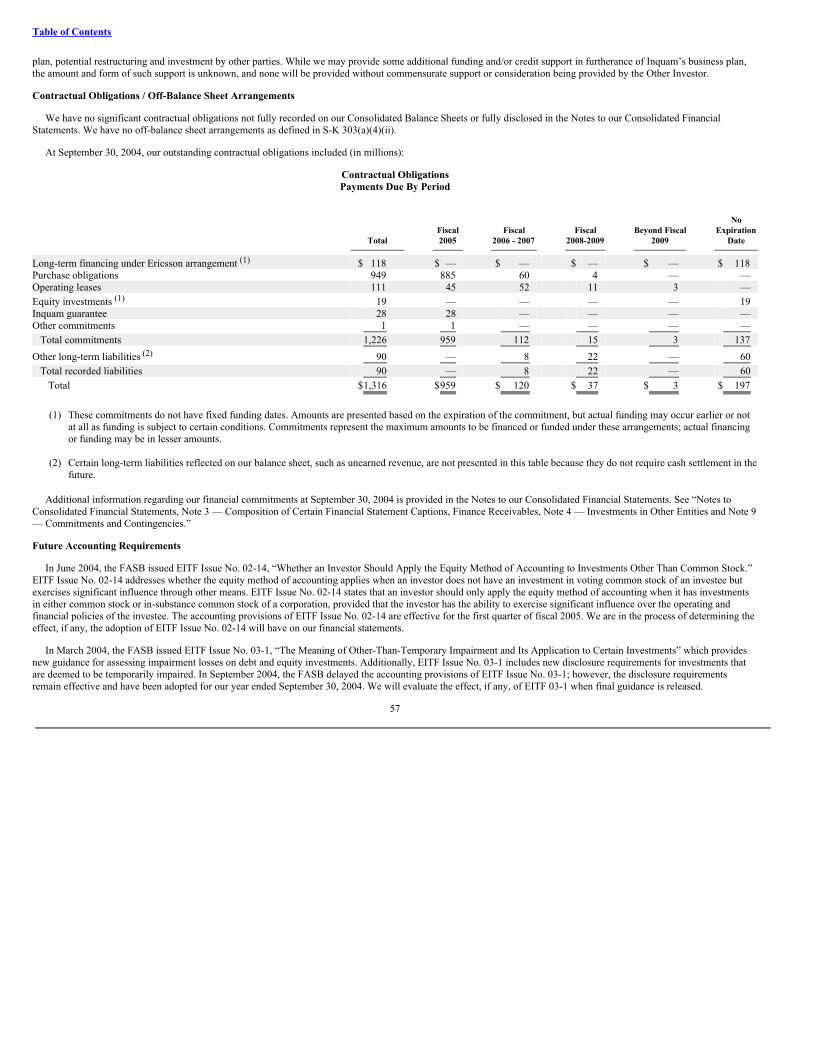
Table of Contents
plan, potential restructuring and investment by other parties. While we may provide some additional funding and/or credit support in furtherance of Inquam’s business plan,the amount and form of such support is unknown, and none will be provided without commensurate support or consideration being provided by the Other Investor.
Contractual Obligations / Off-Balance Sheet Arrangements
We have no significant contractual obligations not fully recorded on our Consolidated Balance Sheets or fully disclosed in the Notes to our Consolidated FinancialStatements. We have no off-balance sheet arrangements as defined in S-K 303(a)(4)(ii).
At September 30, 2004, our outstanding contractual obligations included (in millions):
Contractual ObligationsPayments Due By Period
No Fiscal Fiscal Fiscal Beyond Fiscal Expiration
Total
2005
2006 - 2007
2008-2009
2009
Date
Long-term financing under Ericsson arrangement (1) $ 118 $ — $ — $ — $ — $ 118 Purchase obligations 949 885 60 4 — — Operating leases 111 45 52 11 3 — Equity investments (1) 19 — — — — 19 Inquam guarantee 28 28 — — — — Other commitments 1 1 — — — —
Total commitments 1,226 959 112 15 3 137 Other long-term liabilities (2) 90 — 8 22 — 60
Total recorded liabilities 90 — 8 22 — 60 Total $1,316 $959 $ 120 $ 37 $ 3 $ 197
(1) These commitments do not have fixed funding dates. Amounts are presented based on the expiration of the commitment, but actual funding may occur earlier or notat all as funding is subject to certain conditions. Commitments represent the maximum amounts to be financed or funded under these arrangements; actual financingor funding may be in lesser amounts.
(2) Certain long-term liabilities reflected on our balance sheet, such as unearned revenue, are not presented in this table because they do not require cash settlement in the
future.
Additional information regarding our financial commitments at September 30, 2004 is provided in the Notes to our Consolidated Financial Statements. See “Notes toConsolidated Financial Statements, Note 3 — Composition of Certain Financial Statement Captions, Finance Receivables, Note 4 — Investments in Other Entities and Note 9— Commitments and Contingencies.”
Future Accounting Requirements
In June 2004, the FASB issued EITF Issue No. 02-14, “Whether an Investor Should Apply the Equity Method of Accounting to Investments Other Than Common Stock.”EITF Issue No. 02-14 addresses whether the equity method of accounting applies when an investor does not have an investment in voting common stock of an investee butexercises significant influence through other means. EITF Issue No. 02-14 states that an investor should only apply the equity method of accounting when it has investmentsin either common stock or in-substance common stock of a corporation, provided that the investor has the ability to exercise significant influence over the operating andfinancial policies of the investee. The accounting provisions of EITF Issue No. 02-14 are effective for the first quarter of fiscal 2005. We are in the process of determining theeffect, if any, the adoption of EITF Issue No. 02-14 will have on our financial statements.
In March 2004, the FASB issued EITF Issue No. 03-1, “The Meaning of Other-Than-Temporary Impairment and Its Application to Certain Investments” which providesnew guidance for assessing impairment losses on debt and equity investments. Additionally, EITF Issue No. 03-1 includes new disclosure requirements for investments thatare deemed to be temporarily impaired. In September 2004, the FASB delayed the accounting provisions of EITF Issue No. 03-1; however, the disclosure requirementsremain effective and have been adopted for our year ended September 30, 2004. We will evaluate the effect, if any, of EITF 03-1 when final guidance is released.
57
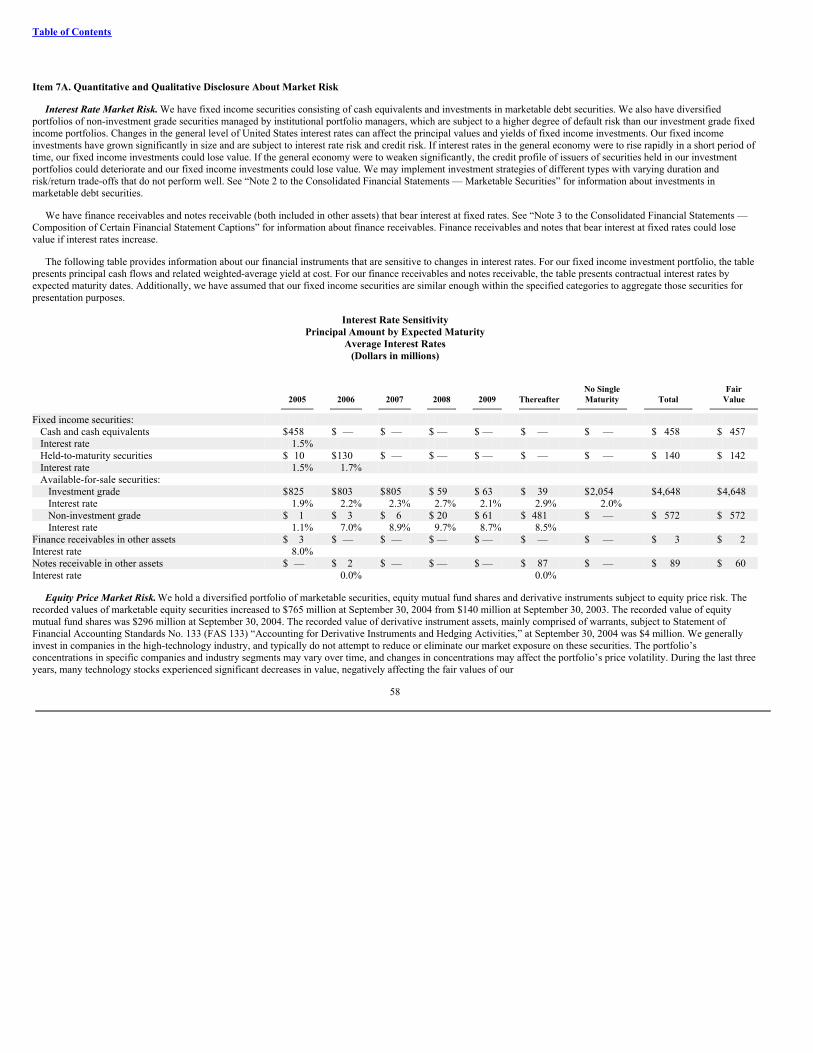
Table of Contents
Item 7A. Quantitative and Qualitative Disclosure About Market Risk
Interest Rate Market Risk. We have fixed income securities consisting of cash equivalents and investments in marketable debt securities. We also have diversifiedportfolios of non-investment grade securities managed by institutional portfolio managers, which are subject to a higher degree of default risk than our investment grade fixedincome portfolios. Changes in the general level of United States interest rates can affect the principal values and yields of fixed income investments. Our fixed incomeinvestments have grown significantly in size and are subject to interest rate risk and credit risk. If interest rates in the general economy were to rise rapidly in a short period oftime, our fixed income investments could lose value. If the general economy were to weaken significantly, the credit profile of issuers of securities held in our investmentportfolios could deteriorate and our fixed income investments could lose value. We may implement investment strategies of different types with varying duration andrisk/return trade-offs that do not perform well. See “Note 2 to the Consolidated Financial Statements — Marketable Securities” for information about investments inmarketable debt securities.
We have finance receivables and notes receivable (both included in other assets) that bear interest at fixed rates. See “Note 3 to the Consolidated Financial Statements —Composition of Certain Financial Statement Captions” for information about finance receivables. Finance receivables and notes that bear interest at fixed rates could losevalue if interest rates increase.
The following table provides information about our financial instruments that are sensitive to changes in interest rates. For our fixed income investment portfolio, the tablepresents principal cash flows and related weighted-average yield at cost. For our finance receivables and notes receivable, the table presents contractual interest rates byexpected maturity dates. Additionally, we have assumed that our fixed income securities are similar enough within the specified categories to aggregate those securities forpresentation purposes.
Interest Rate SensitivityPrincipal Amount by Expected Maturity
Average Interest Rates(Dollars in millions)
No Single Fair
2005
2006
2007
2008
2009
Thereafter
Maturity
Total
Value
Fixed income securities: Cash and cash equivalents $458 $ — $ — $ — $ — $ — $ — $ 458 $ 457 Interest rate 1.5% Held-to-maturity securities $ 10 $130 $ — $ — $ — $ — $ — $ 140 $ 142 Interest rate 1.5% 1.7% Available-for-sale securities:
Investment grade $825 $803 $805 $ 59 $ 63 $ 39 $2,054 $4,648 $4,648 Interest rate 1.9% 2.2% 2.3% 2.7% 2.1% 2.9% 2.0% Non-investment grade $ 1 $ 3 $ 6 $ 20 $ 61 $ 481 $ — $ 572 $ 572 Interest rate 1.1% 7.0% 8.9% 9.7% 8.7% 8.5%
Finance receivables in other assets $ 3 $ — $ — $ — $ — $ — $ — $ 3 $ 2 Interest rate 8.0% Notes receivable in other assets $ — $ 2 $ — $ — $ — $ 87 $ — $ 89 $ 60 Interest rate 0.0% 0.0%
Equity Price Market Risk. We hold a diversified portfolio of marketable securities, equity mutual fund shares and derivative instruments subject to equity price risk. Therecorded values of marketable equity securities increased to $765 million at September 30, 2004 from $140 million at September 30, 2003. The recorded value of equitymutual fund shares was $296 million at September 30, 2004. The recorded value of derivative instrument assets, mainly comprised of warrants, subject to Statement ofFinancial Accounting Standards No. 133 (FAS 133) “Accounting for Derivative Instruments and Hedging Activities,” at September 30, 2004 was $4 million. We generallyinvest in companies in the high-technology industry, and typically do not attempt to reduce or eliminate our market exposure on these securities. The portfolio’sconcentrations in specific companies and industry segments may vary over time, and changes in concentrations may affect the portfolio’s price volatility. During the last threeyears, many technology stocks experienced significant decreases in value, negatively affecting the fair values of our
58
Table of Contents
available-for-sale equity securities and derivative instruments. A 10% decrease in the market price of our marketable equity securities and equity mutual fund shares atSeptember 30, 2004 would cause a corresponding 10% decrease in the carrying amounts of these securities, or $106 million.
Our strategic investments in other entities consist substantially of investments in private early stage companies accounted for under the equity and cost methods.Accordingly, we believe that our exposure to market risk from these investments is not material. Additionally, we do not anticipate any near-term changes in the nature of ourmarket risk exposures or in management’s objectives and strategies with respect to managing such exposures. The recorded values of these strategic investments totaled$162 million at September 30, 2004.
Additional information regarding our strategic investments is provided in Management’s Discussion and Analysis of Financial Condition and Operating Results in thisAnnual Report.
Foreign Exchange Market Risk. We manage our exposure to foreign exchange market risks, when deemed appropriate, through the use of derivative financialinstruments, consisting primarily of foreign currency forward and option contracts. Derivative financial instruments are viewed as risk management tools and are not used forspeculative or trading purposes. At September 30, 2004, the value of our foreign currency forward contracts was insignificant, and there were no foreign currency optioncontracts outstanding. See “Note 1 to the Consolidated Financial Statements — The Company and its Significant Accounting Policies” for a description of our foreigncurrency accounting policies.
Financial instruments held by consolidated subsidiaries and equity method investees which are not denominated in the functional currency of those entities are subject tothe effects of currency fluctuations and may affect reported earnings. As a global concern, we face exposure to adverse movements in foreign currency exchange rates. Wemay hedge currency exposures associated with certain assets and liabilities denominated in nonfunctional currencies and certain anticipated nonfunctional currencytransactions. As a result, we could experience unanticipated gains or losses on anticipated foreign currency cash flows, as well as economic loss with respect to therecoverability of investments. While we may hedge certain transactions with non-United States customers, declines in currency values in certain regions may, if not reversed,adversely affect future product sales because our products may become more expensive to purchase in the countries of the affected currencies.
Finance receivables and notes receivable from international operators and customers that do not use the United States dollar as their functional currencies subject us tocredit risk. Because our financing is U.S. dollar denominated, any significant change in the value of the U.S. dollar against the debtors’ functional currencies could result in anincrease in the debtor’s cash flow requirements and could thereby affect our ability to collect our receivables. At September 30, 2004, finance and note receivables frominternational operators and customers totaled $2 million, net of allowances.
Our analysis methods used to assess and mitigate risk discussed above should not be considered projections of future risks.
Item 8. Financial Statements and Supplementary Data
Our consolidated financial statements at September 30, 2004 and 2003 and the Report of PricewaterhouseCoopers LLP, Independent Registered Public Accounting Firm,are included in this Annual Report on Form 10-K on pages F-1 through F-37.
Item 9. Changes in and Disagreements with Independent Registered Public Accounting Firm on Accounting and Financial Disclosure
None.
Item 9A. Controls and Procedures
Conclusion Regarding the Effectiveness of Disclosure Controls and Procedures
Under the supervision and with the participation of our management, including our principal executive officer and principal financial officer, we conducted an evaluationof our disclosure controls and procedures, as such term is defined under Rule 13a-15(e) promulgated under the Securities Exchange Act of 1934, as amended (the ExchangeAct). Based on this evaluation, our principal executive officer and our principal financial officer concluded that our disclosure controls and procedures were effective as of theend of the period covered by this annual report.
59

Table of Contents
Management’s Report on Internal Control Over Financial Reporting
Our management is responsible for establishing and maintaining adequate internal control over financial reporting, as such term is defined in Exchange Act Rules 13a-15(f). Under the supervision and with the participation of our management, including our principal executive officer and principal financial officer, we conducted anevaluation of the effectiveness of our internal control over financial reporting based on the framework in Internal Control - Integrated Framework issued by the Committee ofSponsoring Organizations of the Treadway Commission. Based on our evaluation under the framework in Internal Control — Integrated Framework, our managementconcluded that our internal control over financial reporting was effective as of September 30, 2004.
Our management’s assessment of the effectiveness of our internal control over financial reporting as of September 30, 2004 has been audited by PricewaterhouseCoopersLLP, an independent registered public accounting firm, as stated in their report which is included herein.
Item 9B. Other Information
None.
60
Table of Contents
PART III
Item 10. Directors and Executive Officers of the Registrant
The information required by this item regarding directors is incorporated by reference to our Definitive Proxy Statement to be filed with the Securities and ExchangeCommission in connection with the Annual Meeting of Stockholders to be held in 2005 (the “2005 Proxy Statement”) under the headings “Election of Directors.” Informationregarding executive officers is set forth in Item 1 of Part I of this Report under the caption “Executive Officers.” The information regarding our code of ethics is incorporatedby reference to our Definitive Proxy Statement filed with the Securities and Exchange Commission on January 9, 2004 under the heading “Code of Ethics.”
Item 11. Executive Compensation
The information required by this item is incorporated by reference to the 2005 Proxy Statement under the heading “Executive Compensation.”
Item 12. Security Ownership of Certain Beneficial Owners and Management
The information required by this item is incorporated by reference to the 2005 Proxy Statement under the heading “Security Ownership of Certain Beneficial Owners andManagement.”
Item 13. Certain Relationships and Related Transactions
The information required by this item is incorporated by reference to the 2005 Proxy Statement under the heading “Certain Transactions.”
Item 14. Principal Accounting Fees and Services
The information required by this item is incorporated by reference to the 2005 Proxy Statement under the heading “Fees Paid to PricewaterhouseCoopers LLP.”
61
Table of Contents
PART IV
Item 15. Exhibits and Financial Statement Schedules
The following documents are filed as part of this report:
Page Number(a) Financial Statements:
(1) Report of Independent Registered Public Accounting Firm F-1 Consolidated Balance Sheets at September 30, 2004 and 2003 F-2 Consolidated Statements of Operations for Fiscal 2004, 2003 and 2002 F-3 Consolidated Statements of Cash Flows for Fiscal 2004, 2003 and 2002 F-4 Consolidated Statements of Stockholders’ Equity for Fiscal 2004, 2003 and 2002 F-5 Notes to Consolidated Financial Statements F-6
(2) Schedule II-Valuation and Qualifying Accounts S-1
Financial statement schedules other than those listed above have been omitted because they are either not required, not applicable or the information is otherwise includedin the notes to the Financial Statements.
(b) Exhibits:
Exhibit Number Description
2.1
Restructuring Agreement, dated as of November 9, 2001, by and among the Company, Vésper São Paulo S.A., Vésper S.A., Vésper Holding São Paulo S.A.,Vésper Holding S.A., VeloCom Cayman Brasil Holdings, QUALCOMM do Brasil Ltda., Bell Canada International (Brazil Telecom I) Limited, Bell CanadaInternational (Megatel) Limited, VeloCom Inc., Nortel Networks Limited, Lucent Technologies Inc., Telefonaktiebolaget LM Ericsson (Publ.), HarrisCorporation, VeloCom do Brasil Ltda., Vésper São Paulo Cayman and Vésper Holding, Ltd.(1)
2.2
The Subscription and Shareholders Agreement, dated as of November 9, 2001, by and among the Company, VeloCom Inc., Bell Canada International (BrazilTelecom I) Limited, Bell Canada International (Megatel) Limited, Bell Canada International (Espelho Sul) Limited, Nortel Networks Limited, LucentTechnologies Inc., Telefonaktiebolaget LM Ericsson (Publ.), Harris Corporation and Vésper Holding, Ltd.(1)
2.5
Share Purchase Agreement dated as of September 25, 2003, by and among Vésper Holding, Ltd., QUALCOMM do Brasil Ltda. and Embratel Particpações S.A.(14)
3.1 Restated Certificate of Incorporation.(13) 3.2 Certificate of Amendment of Restated Certificate of Incorporation.(13) 3.3 Certificate of Designation of Preferences.(13) 3.4 Bylaws.(13) 3.5 Amendment of the Bylaws.(13) 10.1 Form of Indemnity Agreement between the Company, each director and certain officers.(2)(7) 10.2 1991 Stock Option Plan, as amended.(7)(16) 10.4 Form of Stock Option Grant under the 1991 Stock Option Plan.(7)(16) 10.12 DS-CDMA Technology Agreement and related Patent License Agreement, each dated September 26, 1990 between the Company and MOTOROLA, Inc.(2)(3) 10.16 Amendment dated January 21, 1992 to that certain Technology Agreement dated September 26, 1990 with MOTOROLA, Inc.(4)(5) 10.21 Executive Retirement Matching Contribution Plan, as amended.(7)(16)
10.22 1996 Non-qualified Employee Stock Purchase Plan, as amended.(7)(16) 10.23 Stockholder Rights Plan.(6)
62

Table of Contents
Exhibit Number Description
10.29 1998 Non-Employee Director’s Stock Option Plan, as amended.(7)(11) 10.32 Multi-Product License Agreement between QUALCOMM Incorporated and Telefonaktiebolaget LM Ericsson dated March 24, 1999.(8) 10.33 Subscriber Unit License Agreement between QUALCOMM Incorporated and Telefonaktiebolaget LM Ericsson dated March 24, 1999.(8) 10.34 Settlement Agreement and Mutual Release between QUALCOMM Incorporated and Telefonaktiebolaget LM Ericsson dated March 24, 1999.(8)
10.36
Amendment No. 1 dated as of May 24, 1999 to the Asset purchase Agreement dated as of March 24, 1999 between QUALCOMM Incorporated andTelefonaktiebolaget LM Ericsson (publ).(9)
10.37 Amendment to Stockholder Rights Plan dated November 15, 1999.(10) 10.40 Form of Stock Option Grant Notice and Agreement under the 2001 Stock Option Plan.(7)(16) 10.41 2001 Employee Stock Purchase Plan, as amended.(16) 10.42 2001 Non-Employee Directors’ Stock Option Plan.(7)(12) 10.43 Form of Stock Option Grant Notice and Agreement under the 2001 Non-Employee Directors’ Stock Option Plan.(7)(12)
10.55
2001 Stock Option Plan, as amended.(7)(15)
10.56 Offer of Employment to Richard Sulpizio.(7)(15)
10.57
Voluntary Executive Retirement Contribution Plan, as amended.(7)(16) Form of Annual Grant under the 1998 Non-Employee Directors’ Stock Option Plan.(7)(16)
10.58 Form of Annual Grant under the 1998 Non-Employee Directors’ Stock Option Plan.(7)(16) 10.59 Iridigm Display Corporation 2000 Stock Option Plan.(7)(17) 10.60 Forms of Stock Option Agreements under the Iridigm Display Corporation 2000 Stock Option Plan.(7)(17) 21 Subsidiaries of the Registrant. 23.1 Consent of Independent Registered Public Accounting Firm. 24.1 Power of Attorney. Reference is made to page 65. 31.1 Certification pursuant to Section 302 of the Sarbanes-Oxley Act of 2002 for Irwin Mark Jacobs. 31.2 Certification pursuant to Section 302 of the Sarbanes-Oxley Act of 2002 for William E. Keitel. 32.1 Certification pursuant to 18 U.S.C. Section 1350, as adopted pursuant to Section 906 of the Sarbanes-Oxley Act of 2002 for Irwin Mark Jacobs. 32.2 Certification pursuant to 18 U.S.C. Section 1350, as adopted pursuant to Section 906 of the Sarbanes-Oxley Act of 2002 for William E. Keitel.
(1) Filed as an exhibit to the Registrant’s Current Report on Form 8-K filed on November 28, 2001. (2) Filed as an exhibit to the Registrant’s Registration Statement on Form S-1 (No. 33-42782). (3) Certain confidential portions deleted pursuant to Order Granting Application or Confidential Treatment pursuant to Rule 24b-2 under the Securities Exchange Act of
1934 dated December 12, 1991. (4) Filed as an exhibit to Registrant’s Annual Report on Form 10-K for the fiscal year ended September 27, 1992. (5) Certain confidential portions deleted pursuant to Order Granting Application for Confidential Treatment pursuant to Rule 24b-2 under the Securities Exchange Act of
1934 dated March 19, 1993. (6) Filed as an exhibit to the Registrant’s Current Report on Form 8-K filed on September 26, 1995. (7) Indicates management or compensatory plan or arrangement required to be identified pursuant to Item 14(c). (8) Filed as an exhibit to the Registrant’s Quarterly Report on Form 10-Q for the quarter ended March 28, 1999. (9) Filed as an exhibit to the Registrant’s Current Report on Form 8-K filed on May 24, 1999. (10) Filed as an exhibit to the Registrant’s Annual Report on Form 10-K for the fiscal year ended September 26, 1999. (11) Filed as an exhibit to the Registrant’s Quarterly Report on Form 10-Q for the quarter ended March 26, 2000.
63
Table of Contents
(12) Filed as an exhibit to the Registrant’s Quarterly Report on Form 10-Q for the quarter ended April 1, 2001. (13) Filed as an exhibit to the Registrant’s Quarterly Report on Form 10-Q for the quarter ended March 30, 2003. (14) Filed as an exhibit to the Registrant’s Annual Report on Form 10-K for the year ended September 28, 2003. (15) Filed as an exhibit to the Registrant’s Quarterly Report on Form 10-Q for the quarter ended March 28, 2004. (16) Filed as an exhibit to the Registrant’s Quarterly Report on Form 10-Q for the quarter ended June 27, 2004. (17) Filed as an exhibit to the Registrant’s Registration Statement on Form S-8 (No. 333 119904).
SIGNATURES
Pursuant to the requirements of Section 13 or 15(d) of the Securities Exchange Act of 1934, the registrant has duly caused this report to be signed on its behalf by theundersigned, thereunto duly authorized.
November 3, 2004 QUALCOMM Incorporated
By /s/ Irwin Mark Jacobs Irwin Mark Jacobs, Chief Executive Officer and Chairman
64
Table of Contents
POWER OF ATTORNEY
Know all persons by these presents, that each person whose signature appears below constitutes and appoints Irwin Mark Jacobs and William E. Keitel, and each of them,as his true and lawful attorneys-in-fact and agents, with full power of substitution and resubstitution, for him and in his name, place, and stead, in any and all capacities, to signany and all amendments to this Report, and to file the same, with all exhibits thereto, and other documents in connection therewith, with the Securities and ExchangeCommission, granting unto said attorneys-in-fact and agents, and each of them, full power and authority to do and perform each and every act and thing requisite andnecessary to be done in connection therewith, as fully to all intents and purposes as he might or could do in person, hereby ratifying and confirming that all said attorneys-in-fact and agents, or any of them or their or his substitute or substituted, may lawfully do or cause to be done by virtue thereof.
Pursuant to the requirements of the Securities Exchange Act of 1934, this Report has been signed below by the following persons on behalf of the registrant and in thecapacities and on the dates indicated:
Signature
Title
Date
/s/ IRWIN MARK JACOBS
Irwin Mark Jacobs
Chief Executive Officer and Chairman (PrincipalExecutive Officer)
November 3, 2004
/s/ WILLIAM E. KEITEL
William E. Keitel
Chief Financial Officer (Principal Financial and Accounting Officer)
November 3, 2004
/s/ RICHARD C. ATKINSON
Richard C. Atkinson
Director
November 3, 2004
/s/ ADELIA A. COFFMAN
Adelia A. Coffman
Director
November 3, 2004
/s/ RAYMOND DITTAMORE
Raymond Dittamore
Director
November 3, 2004
/s/ DIANA LADY DOUGAN
Diana Lady Dougan
Director
November 3, 2004
/s/ ROBERT E. KAHN
Robert E. Kahn
Director
November 3, 2004
/s/ DUANE A. NELLES
Duane A. Nelles
Director
November 3, 2004
/s/ PETER M. SACERDOTE
Peter M. Sacerdote
Director
November 3, 2004
/s/ BRENT SCOWCROFT
Brent Scowcroft
Director
November 3, 2004
/s/ MARC I. STERN
Marc I. Stern
Director
November 3, 2004
/s/ RICHARD SULPIZIO
Richard Sulpizio
Director
November 3, 2004
65
Table of Contents
REPORT OF INDEPENDENT REGISTERED PUBLIC ACCOUNTING FIRM
To the Board of Directors and Stockholders of QUALCOMM Incorporated
In our opinion, the consolidated financial statements listed in the index appearing under Item 15(a) (1) present fairly, in all material respects, the financial position ofQUALCOMM Incorporated and its subsidiaries (the “Company”) at September 30, 2004 and 2003, and the results of their operations and their cash flows for each of the threeyears in the period ended September 30, 2004 in conformity with accounting principles generally accepted in the United States of America. In addition, in our opinion, thefinancial statement schedule listed in the index appearing under Item 15(a) (2) presents fairly, in all material respects, the information set forth therein when read inconjunction with the related consolidated financial statements. Also, in our opinion, management’s assessment, included in the accompanying Management’s Report onInternal Control Over Financial Reporting appearing under Item 9A, that the Company maintained effective internal control over financial reporting as of September 30, 2004based on criteria established in Internal Control - Integrated Framework issued by the Committee of Sponsoring Organizations of the Treadway Commission (COSO), is fairlystated, in all material respects, based on those criteria. Furthermore, in our opinion, the Company maintained, in all material respects, effective internal control over financialreporting as of September 30, 2004, based on criteria established in Internal Control - Integrated Framework issued by the COSO. The Company’s management is responsiblefor these financial statements and financial statement schedule, for maintaining effective internal control over financial reporting, and for its assessment of the effectiveness ofinternal control over financial reporting. Our responsibility is to express opinions on (i) these financial statements and financial statement schedule; (ii) management’sassessment; and (iii) the effectiveness of the Company’s internal control over financial reporting based on our audits.
We conducted our audits in accordance with the standards of the Public Company Accounting Oversight Board (United States). Those standards require that we plan andperform the audits to obtain reasonable assurance about whether the financial statements are free of material misstatement and whether effective internal control over financialreporting was maintained in all material respects. Our audit of financial statements included examining, on a test basis, evidence supporting the amounts and disclosures in thefinancial statements, assessing the accounting principles used and significant estimates made by management, and evaluating the overall financial statement presentation. Ouraudit of internal control over financial reporting included obtaining an understanding of internal control over financial reporting, evaluating management’s assessment, testingand evaluating the design and operating effectiveness of internal control, and performing such other procedures as we considered necessary in the circumstances. We believethat our audits provide a reasonable basis for our opinions.
A company’s internal control over financial reporting is a process designed to provide reasonable assurance regarding the reliability of financial reporting and the preparationof financial statements for external purposes in accordance with generally accepted accounting principles. A company’s internal control over financial reporting includesthose policies and procedures that (i) pertain to the maintenance of records that, in reasonable detail, accurately and fairly reflect the transactions and dispositions of the assetsof the company; (ii) provide reasonable assurance that transactions are recorded as necessary to permit preparation of financial statements in accordance with generallyaccepted accounting principles, and that receipts and expenditures of the company are being made only in accordance with authorizations of management and directors of thecompany; and (iii) provide reasonable assurance regarding prevention or timely detection of unauthorized acquisition, use, or disposition of the company’s assets that couldhave a material effect on the financial statements.
Because of its inherent limitations, internal control over financial reporting may not prevent or detect misstatements. Also, projections of any evaluation of effectiveness tofuture periods are subject to the risk that controls may become inadequate because of changes in conditions, or that the degree of compliance with the policies or proceduresmay deteriorate.
As discussed in Note 1 to the consolidated financial statements, the Company adopted Statement of Financial Accounting Standards No. 142, “Goodwill and Other IntangibleAssets,” during the year ended September 30, 2003.
PRICEWATERHOUSECOOPERS LLP
San Diego, CaliforniaNovember 2, 2004
F- 1
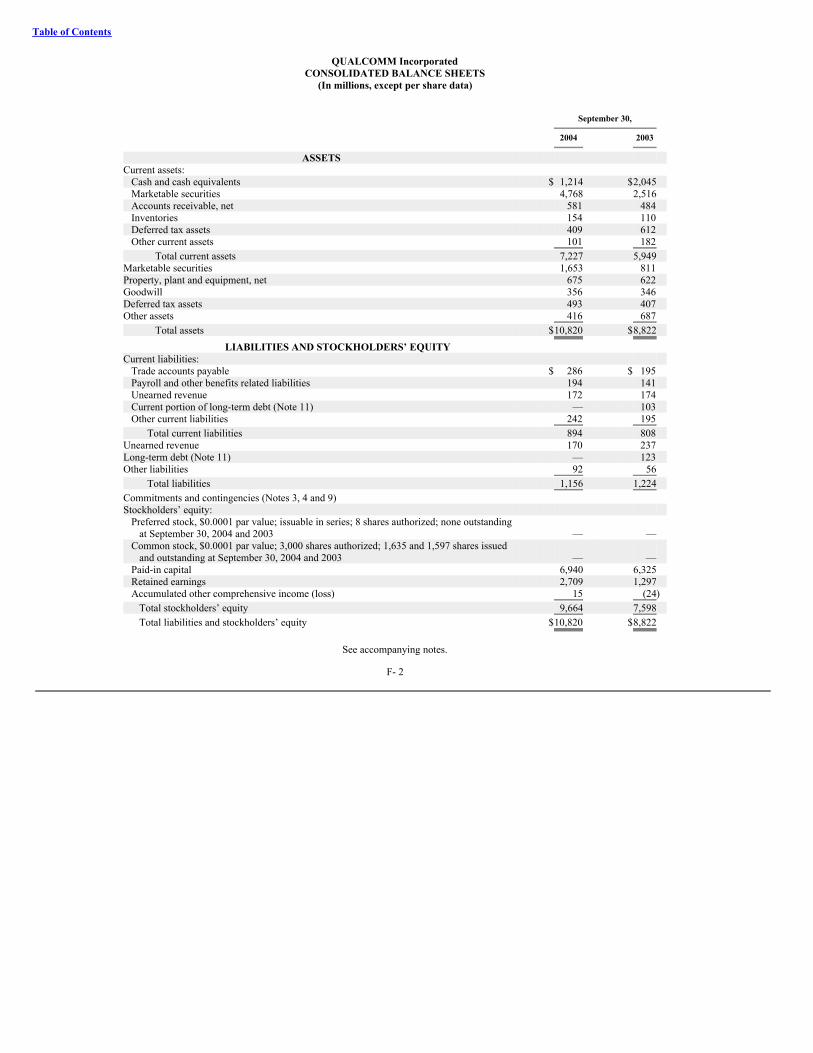
Table of Contents
QUALCOMM IncorporatedCONSOLIDATED BALANCE SHEETS
(In millions, except per share data)
September 30,
2004
2003
ASSETS
Current assets: Cash and cash equivalents $ 1,214 $2,045 Marketable securities 4,768 2,516 Accounts receivable, net 581 484 Inventories 154 110 Deferred tax assets 409 612 Other current assets 101 182
Total current assets 7,227 5,949 Marketable securities 1,653 811 Property, plant and equipment, net 675 622 Goodwill 356 346 Deferred tax assets 493 407 Other assets 416 687
Total assets $10,820 $8,822 LIABILITIES AND STOCKHOLDERS’ EQUITY
Current liabilities: Trade accounts payable $ 286 $ 195 Payroll and other benefits related liabilities 194 141 Unearned revenue 172 174 Current portion of long-term debt (Note 11) — 103 Other current liabilities 242 195
Total current liabilities 894 808 Unearned revenue 170 237 Long-term debt (Note 11) — 123 Other liabilities 92 56
Total liabilities 1,156 1,224 Commitments and contingencies (Notes 3, 4 and 9) Stockholders’ equity:
Preferred stock, $0.0001 par value; issuable in series; 8 shares authorized; none outstandingat September 30, 2004 and 2003 — —
Common stock, $0.0001 par value; 3,000 shares authorized; 1,635 and 1,597 shares issuedand outstanding at September 30, 2004 and 2003 — —
Paid-in capital 6,940 6,325 Retained earnings 2,709 1,297 Accumulated other comprehensive income (loss) 15 (24)
Total stockholders’ equity 9,664 7,598 Total liabilities and stockholders’ equity $10,820 $8,822
See accompanying notes.
F- 2
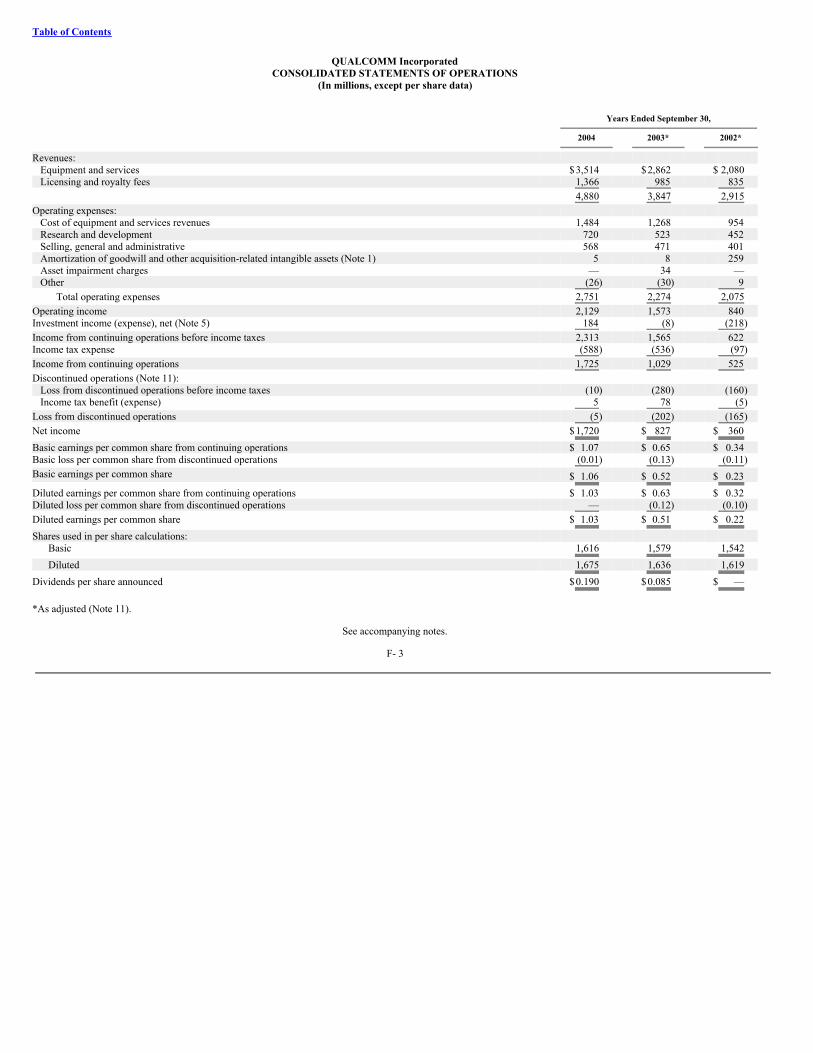
Table of Contents
QUALCOMM IncorporatedCONSOLIDATED STATEMENTS OF OPERATIONS
(In millions, except per share data)
Years Ended September 30,
2004
2003*
2002*
Revenues: Equipment and services $3,514 $2,862 $ 2,080 Licensing and royalty fees 1,366 985 835
4,880 3,847 2,915 Operating expenses:
Cost of equipment and services revenues 1,484 1,268 954 Research and development 720 523 452 Selling, general and administrative 568 471 401 Amortization of goodwill and other acquisition-related intangible assets (Note 1) 5 8 259 Asset impairment charges — 34 — Other (26) (30) 9
Total operating expenses 2,751 2,274 2,075 Operating income 2,129 1,573 840 Investment income (expense), net (Note 5) 184 (8) (218)Income from continuing operations before income taxes 2,313 1,565 622 Income tax expense (588) (536) (97)Income from continuing operations 1,725 1,029 525 Discontinued operations (Note 11):
Loss from discontinued operations before income taxes (10) (280) (160)Income tax benefit (expense) 5 78 (5)
Loss from discontinued operations (5) (202) (165)Net income $1,720 $ 827 $ 360 Basic earnings per common share from continuing operations $ 1.07 $ 0.65 $ 0.34 Basic loss per common share from discontinued operations (0.01) (0.13) (0.11)Basic earnings per common share $ 1.06 $ 0.52 $ 0.23 Diluted earnings per common share from continuing operations $ 1.03 $ 0.63 $ 0.32 Diluted loss per common share from discontinued operations — (0.12) (0.10)Diluted earnings per common share $ 1.03 $ 0.51 $ 0.22 Shares used in per share calculations:
Basic 1,616 1,579 1,542 Diluted 1,675 1,636 1,619
Dividends per share announced $0.190 $0.085 $ —
*As adjusted (Note 11).
See accompanying notes.
F- 3
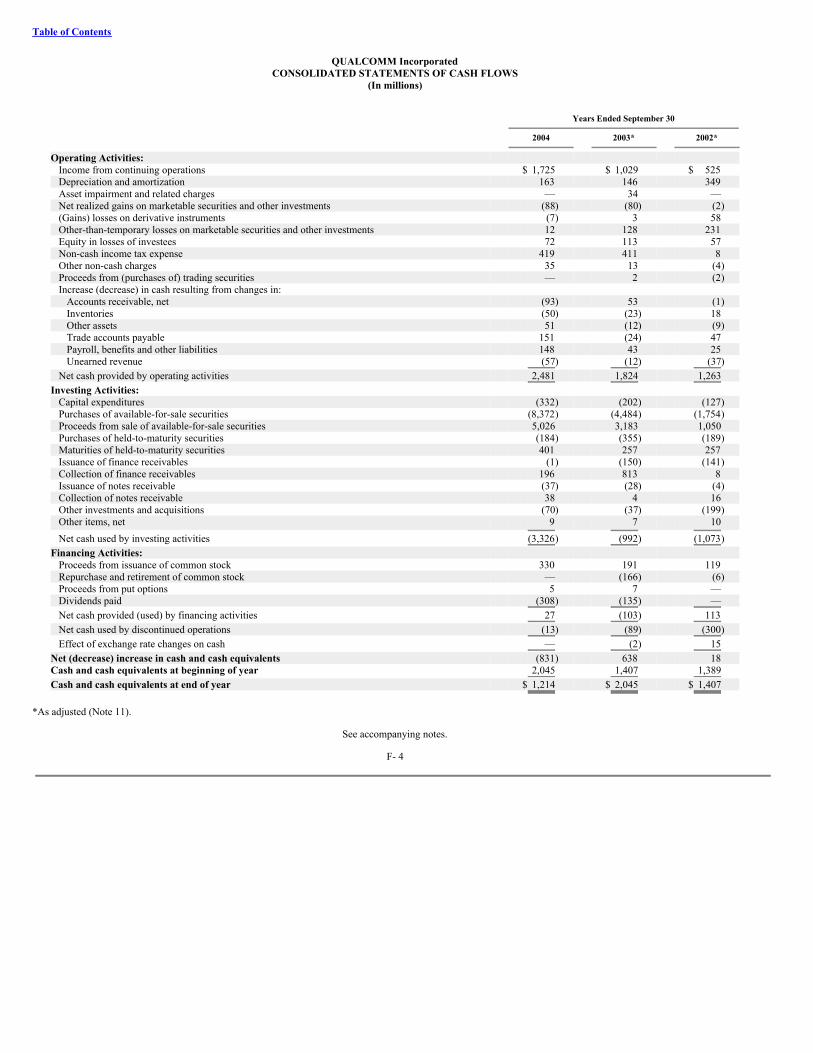
Table of Contents
QUALCOMM IncorporatedCONSOLIDATED STATEMENTS OF CASH FLOWS
(In millions)
Years Ended September 30
2004
2003*
2002*
Operating Activities: Income from continuing operations $ 1,725 $ 1,029 $ 525 Depreciation and amortization 163 146 349 Asset impairment and related charges — 34 — Net realized gains on marketable securities and other investments (88) (80) (2)(Gains) losses on derivative instruments (7) 3 58 Other-than-temporary losses on marketable securities and other investments 12 128 231 Equity in losses of investees 72 113 57 Non-cash income tax expense 419 411 8 Other non-cash charges 35 13 (4)Proceeds from (purchases of) trading securities — 2 (2)Increase (decrease) in cash resulting from changes in:
Accounts receivable, net (93) 53 (1)Inventories (50) (23) 18 Other assets 51 (12) (9)Trade accounts payable 151 (24) 47 Payroll, benefits and other liabilities 148 43 25 Unearned revenue (57) (12) (37)
Net cash provided by operating activities 2,481 1,824 1,263 Investing Activities:
Capital expenditures (332) (202) (127)Purchases of available-for-sale securities (8,372) (4,484) (1,754)Proceeds from sale of available-for-sale securities 5,026 3,183 1,050 Purchases of held-to-maturity securities (184) (355) (189)Maturities of held-to-maturity securities 401 257 257 Issuance of finance receivables (1) (150) (141)Collection of finance receivables 196 813 8 Issuance of notes receivable (37) (28) (4)Collection of notes receivable 38 4 16 Other investments and acquisitions (70) (37) (199)Other items, net 9 7 10 Net cash used by investing activities (3,326) (992) (1,073)
Financing Activities: Proceeds from issuance of common stock 330 191 119 Repurchase and retirement of common stock — (166) (6)Proceeds from put options 5 7 — Dividends paid (308) (135) — Net cash provided (used) by financing activities 27 (103) 113 Net cash used by discontinued operations (13) (89) (300)Effect of exchange rate changes on cash — (2) 15
Net (decrease) increase in cash and cash equivalents (831) 638 18 Cash and cash equivalents at beginning of year 2,045 1,407 1,389 Cash and cash equivalents at end of year $ 1,214 $ 2,045 $ 1,407
*As adjusted (Note 11).
See accompanying notes.
F- 4
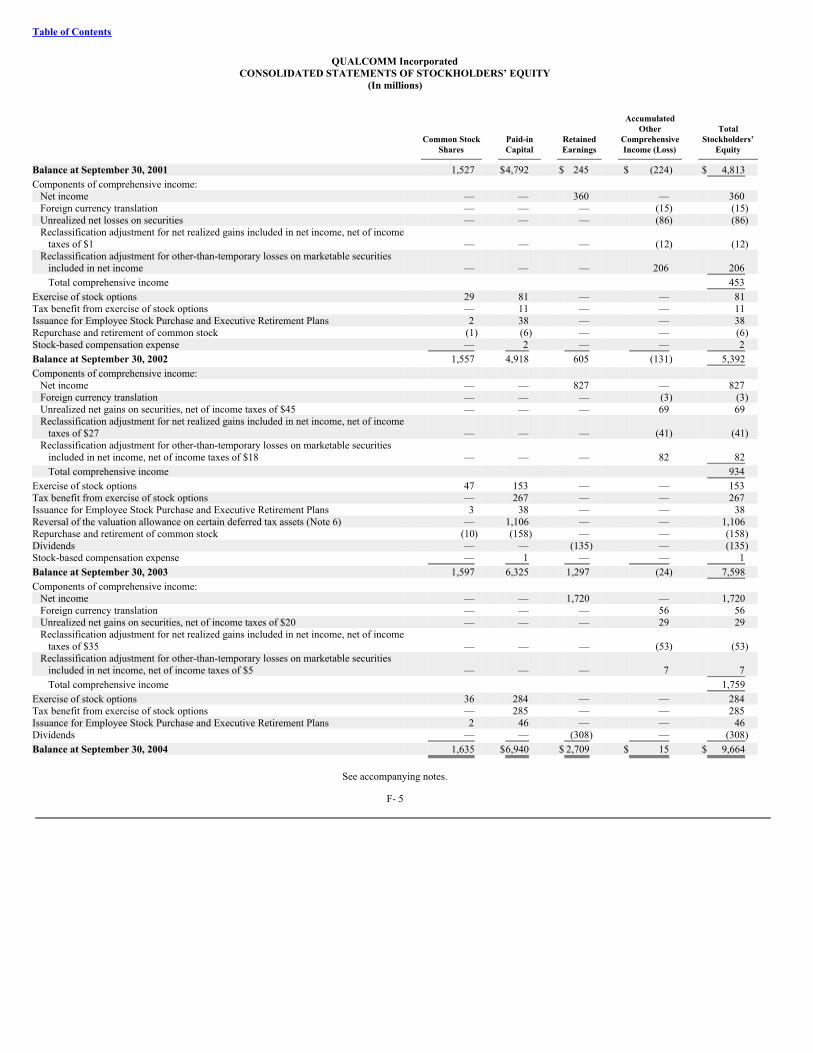
Table of Contents
QUALCOMM IncorporatedCONSOLIDATED STATEMENTS OF STOCKHOLDERS’ EQUITY
(In millions)
Accumulated Other Total Common Stock Paid-in Retained Comprehensive Stockholders’
Shares
Capital
Earnings
Income (Loss)
Equity
Balance at September 30, 2001 1,527 $4,792 $ 245 $ (224) $ 4,813 Components of comprehensive income:
Net income — — 360 — 360 Foreign currency translation — — — (15) (15)Unrealized net losses on securities — — — (86) (86)Reclassification adjustment for net realized gains included in net income, net of income
taxes of $1 — — — (12) (12)Reclassification adjustment for other-than-temporary losses on marketable securities
included in net income — — — 206 206 Total comprehensive income 453
Exercise of stock options 29 81 — — 81 Tax benefit from exercise of stock options — 11 — — 11 Issuance for Employee Stock Purchase and Executive Retirement Plans 2 38 — — 38 Repurchase and retirement of common stock (1) (6) — — (6)Stock-based compensation expense — 2 — — 2 Balance at September 30, 2002 1,557 4,918 605 (131) 5,392 Components of comprehensive income:
Net income — — 827 — 827 Foreign currency translation — — — (3) (3)Unrealized net gains on securities, net of income taxes of $45 — — — 69 69 Reclassification adjustment for net realized gains included in net income, net of income
taxes of $27 — — — (41) (41)Reclassification adjustment for other-than-temporary losses on marketable securities
included in net income, net of income taxes of $18 — — — 82 82 Total comprehensive income 934
Exercise of stock options 47 153 — — 153 Tax benefit from exercise of stock options — 267 — — 267 Issuance for Employee Stock Purchase and Executive Retirement Plans 3 38 — — 38 Reversal of the valuation allowance on certain deferred tax assets (Note 6) — 1,106 — — 1,106 Repurchase and retirement of common stock (10) (158) — — (158)Dividends — — (135) — (135)Stock-based compensation expense — 1 — — 1 Balance at September 30, 2003 1,597 6,325 1,297 (24) 7,598 Components of comprehensive income:
Net income — — 1,720 — 1,720 Foreign currency translation — — — 56 56 Unrealized net gains on securities, net of income taxes of $20 — — — 29 29 Reclassification adjustment for net realized gains included in net income, net of income
taxes of $35 — — — (53) (53)Reclassification adjustment for other-than-temporary losses on marketable securities
included in net income, net of income taxes of $5 — — — 7 7 Total comprehensive income 1,759
Exercise of stock options 36 284 — — 284 Tax benefit from exercise of stock options — 285 — — 285 Issuance for Employee Stock Purchase and Executive Retirement Plans 2 46 — — 46 Dividends — — (308) — (308)Balance at September 30, 2004 1,635 $6,940 $ 2,709 $ 15 $ 9,664
See accompanying notes.
F- 5
Table of Contents
Note 1. The Company and its Significant Accounting Policies
The Company
QUALCOMM Incorporated (the Company or QUALCOMM), a Delaware corporation, develops, designs, manufactures and markets digital wireless telecommunicationsproducts and services based on its Code Division Multiple Access (CDMA) technology. The Company is a leading developer and supplier of CDMA-based integrated circuitsand system software for wireless voice and data communications, multimedia functions and global positioning system products to wireless device and infrastructuremanufacturers. The Company grants licenses to use portions of its intellectual property portfolio, which includes certain patent rights essential to and/or useful in themanufacture and sale of CDMA products, and receives license fees as well as ongoing royalties based on sales by licensees of wireless telecommunications equipmentproducts incorporating its CDMA technologies. The Company provides satellite and terrestrial-based two-way data messaging and position reporting services fortransportation companies, private fleets, construction equipment fleets and other enterprise companies. The Company provides the BREW (Binary Runtime Environment forWireless) product and services to network operators, handset manufacturers and application developers and support for developing and delivering over-the-air wirelessapplications and services. The Company also makes strategic investments to promote the worldwide adoptions of CDMA products and services for wireless voice and Internetdata communications.
Principles of Consolidation
The Company’s consolidated financial statements include the assets, liabilities and operating results of majority-owned subsidiaries and other subsidiaries controlled bythe Company. The ownership of the other interest holders of consolidated subsidiaries is reflected as minority interest and is not significant. All significant intercompanyaccounts and transactions have been eliminated. The Company’s foreign subsidiaries are included in the consolidated financial statements one month in arrears to facilitate thetimely inclusion of such entities in the Company’s consolidated financial statements.
The Company deconsolidated the Vésper Operating Companies during the first quarter of fiscal 2004 as a result of their sale in December 2003 and TowerCo during thesecond quarter of fiscal 2004 as a result of its sale in March 2004 (Note 11). Results of operations and cash flows related to the Vésper Operating Companies and TowerCo arepresented as discontinued operations. The Company’s statements of operations and cash flows for all prior periods have been adjusted to present the discontinued operations.The balance sheet as of September 28, 2003 was not adjusted to present assets and liabilities related to discontinued operations separately.
Effective as of the beginning of the second quarter of fiscal 2004, the Company adopted the revised interpretation of Financial Accounting Standards Board(FASB) Interpretation No. 46 (FIN 46), “Consolidation of Variable Interest Entities,” (FIN 46-R). FIN 46-R requires that certain variable interest entities be consolidated bythe primary beneficiary of the entity if the equity investors in the entity do not have the characteristics of a controlling financial interest or do not have sufficient equity at riskfor the entity to finance its activities without additional subordinated financial support from other parties. The Company does not have any investments in entities it believesare variable interest entities for which the Company is the primary beneficiary.
Financial Statement Preparation
The preparation of financial statements in conformity with accounting principles generally accepted in the United States requires management to make estimates andassumptions that affect the reported amounts and the disclosure of contingent amounts in the Company’s financial statements and the accompanying notes. Actual resultscould differ from those estimates. Certain prior year amounts have been reclassified to conform to the current year presentation.
Fiscal Year
The Company operates and reports using a 52-week fiscal year ending on the last Sunday in September. The fiscal years ended September 30, 2004, 2003 and 2002 eachinclude 52 weeks. For presentation purposes, the Company presents its fiscal years as ending on September 30.
Revenue Recognition
The Company derives revenue principally from sales of integrated circuit products, from royalties for its intellectual property, from messaging and other services andrelated hardware sales, from software development and
F- 6

Table of Contents
QUALCOMM IncorporatedNOTES TO CONSOLIDATED FINANCIAL STATEMENTS
related services, and from license fees for intellectual property. The timing of revenue recognition and the amount of revenue actually recognized in each case depends upon avariety of factors, including the specific terms of each arrangement and the nature of the Company’s deliverables and obligations. The development stage of the Company’scustomers’ products do not affect the timing or amount of revenue recognized.
In December 1999, the Securities and Exchange Commission (SEC) issued Staff Accounting Bulletin No. 101 (SAB 101), “Revenue Recognition in Financial Statements”(later revised as Staff Accounting Bulletin No. 104) which the Company adopted in the fourth quarter of fiscal 2001 and applied retroactively to the first quarter of fiscal 2001.The Company recorded a $147 million loss, net of taxes of $98 million, as the cumulative effect of the accounting change as of the beginning of fiscal 2001 to reflect thedeferral of revenues and expenses related to future periods. The amortization of revenue that was deferred as of the beginning of fiscal 2001 is expected to continue to beamortized with a declining impact through fiscal 2007. The Company recognized $30 million, $44 million and $66 million during fiscal 2004, 2003 and 2002, respectively, inoperating income related to revenues and expenses that were recognized in prior years.
In November 2002, the Emerging Issues Task Force (EITF) issued Issue No. 00-21, “Accounting for Revenue Arrangements with Multiple Deliverables” which theCompany adopted in the fourth quarter of fiscal 2003. This issue addresses determination of whether an arrangement involving more than one deliverable contains more thanone unit of accounting and how arrangement consideration should be measured and allocated to the separate units of accounting. Beginning with the adoption of SAB 101until the fourth quarter of fiscal 2003, the Company recognized revenues and expenses from sales of certain satellite and terrestrial-based two-way data messaging andposition reporting hardware and related software products by its QWBS division (Note 10) ratably over the shorter of the estimated useful life of the hardware product or theexpected messaging service period, which is typically five years. SAB 101 required the ratable recognition of these sales because the messaging service was consideredintegral to the functionality of the hardware and software. EITF Issue No. 00-21 does not require the deferral of revenue when an undelivered element is considered integral tothe functionality of a delivered element and otherwise requires separate unit accounting in multiple element arrangements. Given that the Company meets the criteriastipulated in EITF Issue No. 00-21, the sale of the hardware is accounted for as a unit of accounting separate from the future service to be provided by the Company.Accordingly, the Company began recognizing revenues allocated to the hardware using the residual method, and related expenses from such sales, starting in the fourthquarter of fiscal 2003 at the time of shipment, or when title and risk of loss pass to the customer and other criteria for revenue recognition are met, if later, instead ofamortizing the related revenue over a future period. The Company elected to adopt EITF Issue No. 00-21 prospectively for revenue arrangements entered into after the thirdquarter of fiscal 2003, rather than reporting the change in accounting as a cumulative-effect adjustment. The amortization of QWBS equipment revenue that was deferred inthe periods prior to the adoption of EITF Issue No. 00-21 will continue with a declining impact through fiscal 2008. QWBS amortized $76 million and $23 million in revenuerelated to such prior period equipment sales in fiscal 2004 and during the fourth quarter of fiscal 2003, respectively. Deferred revenues and expenses related to the historicalQWBS sales that will continue to be amortized in future periods were $106 million and $62 million, respectively, at September 30, 2004. Gross margin related to these priorsales is expected to be recognized as follows: $24 million in fiscal 2005, $13 million in fiscal 2006, $6 million in fiscal 2007 and $1 million in fiscal 2008.
The Company licenses rights to use portions of its intellectual property portfolio, which includes certain patent rights essential to and/or useful in the manufacture and saleof CDMA (including, without limitation, cdmaOne, CDMA2000, 1X/1xEV-DO/1xEV-DV, TD-SCDMA and WCDMA) products. Licensees typically pay a nonrefundablelicense fee in one or more installments and ongoing royalties based on their sales of products incorporating or using the Company’s licensed intellectual property. License feesare recognized over the estimated period of future benefit to the average licensee, typically five to seven years. The Company earns royalties on such licensed CDMA productssold worldwide by its licensees at the time that the licensees’ sales occur. The Company’s licensees, however, do not report and pay royalties owed for sales in any givenquarter until after the conclusion of that quarter, and, in some instances, although royalties are reported quarterly, payment is on a semi-annual basis. During the periodspreceding the fourth quarter of fiscal 2004, the Company estimated and recorded the royalty revenues earned for sales by certain licensees (the Estimated Licensees) in thequarter in which such sales occurred, but only when reasonable estimates of such amounts could be made. Not all royalties earned were estimated.
F- 7
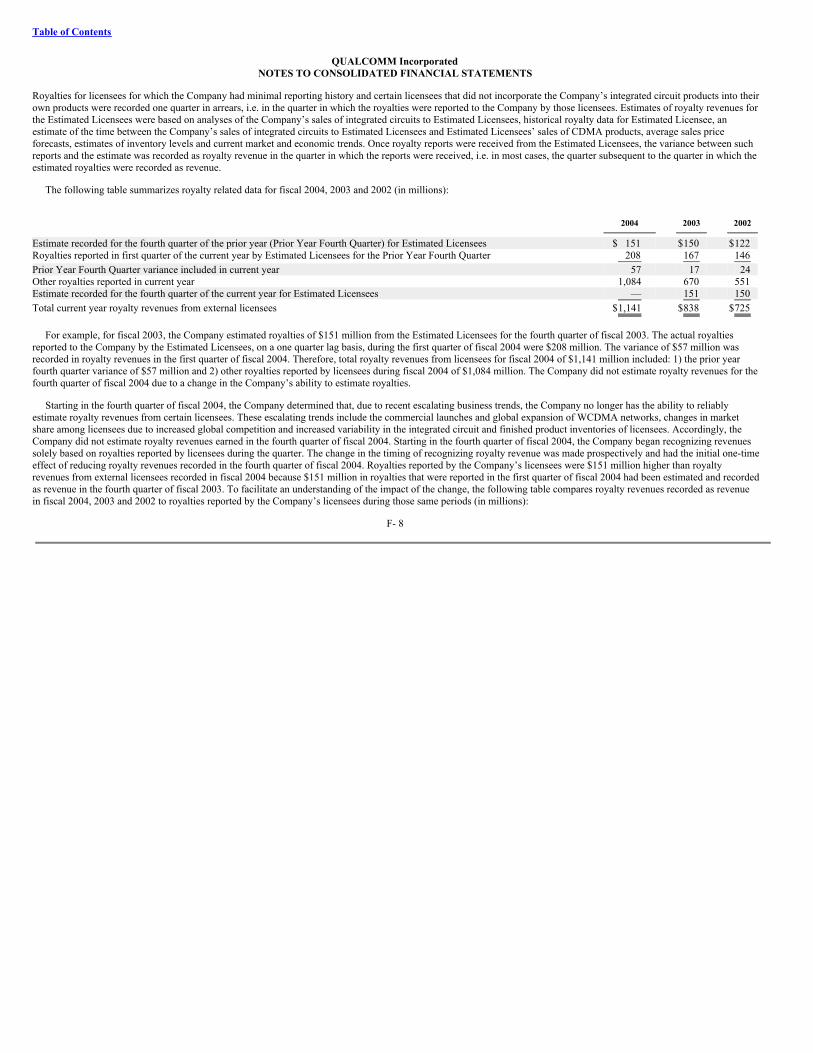
Table of Contents
QUALCOMM IncorporatedNOTES TO CONSOLIDATED FINANCIAL STATEMENTS
Royalties for licensees for which the Company had minimal reporting history and certain licensees that did not incorporate the Company’s integrated circuit products into theirown products were recorded one quarter in arrears, i.e. in the quarter in which the royalties were reported to the Company by those licensees. Estimates of royalty revenues forthe Estimated Licensees were based on analyses of the Company’s sales of integrated circuits to Estimated Licensees, historical royalty data for Estimated Licensee, anestimate of the time between the Company’s sales of integrated circuits to Estimated Licensees and Estimated Licensees’ sales of CDMA products, average sales priceforecasts, estimates of inventory levels and current market and economic trends. Once royalty reports were received from the Estimated Licensees, the variance between suchreports and the estimate was recorded as royalty revenue in the quarter in which the reports were received, i.e. in most cases, the quarter subsequent to the quarter in which theestimated royalties were recorded as revenue.
The following table summarizes royalty related data for fiscal 2004, 2003 and 2002 (in millions):
2004
2003
2002
Estimate recorded for the fourth quarter of the prior year (Prior Year Fourth Quarter) for Estimated Licensees $ 151 $150 $122 Royalties reported in first quarter of the current year by Estimated Licensees for the Prior Year Fourth Quarter 208 167 146 Prior Year Fourth Quarter variance included in current year 57 17 24 Other royalties reported in current year 1,084 670 551 Estimate recorded for the fourth quarter of the current year for Estimated Licensees — 151 150 Total current year royalty revenues from external licensees $1,141 $838 $725
For example, for fiscal 2003, the Company estimated royalties of $151 million from the Estimated Licensees for the fourth quarter of fiscal 2003. The actual royaltiesreported to the Company by the Estimated Licensees, on a one quarter lag basis, during the first quarter of fiscal 2004 were $208 million. The variance of $57 million wasrecorded in royalty revenues in the first quarter of fiscal 2004. Therefore, total royalty revenues from licensees for fiscal 2004 of $1,141 million included: 1) the prior yearfourth quarter variance of $57 million and 2) other royalties reported by licensees during fiscal 2004 of $1,084 million. The Company did not estimate royalty revenues for thefourth quarter of fiscal 2004 due to a change in the Company’s ability to estimate royalties.
Starting in the fourth quarter of fiscal 2004, the Company determined that, due to recent escalating business trends, the Company no longer has the ability to reliablyestimate royalty revenues from certain licensees. These escalating trends include the commercial launches and global expansion of WCDMA networks, changes in marketshare among licensees due to increased global competition and increased variability in the integrated circuit and finished product inventories of licensees. Accordingly, theCompany did not estimate royalty revenues earned in the fourth quarter of fiscal 2004. Starting in the fourth quarter of fiscal 2004, the Company began recognizing revenuessolely based on royalties reported by licensees during the quarter. The change in the timing of recognizing royalty revenue was made prospectively and had the initial one-timeeffect of reducing royalty revenues recorded in the fourth quarter of fiscal 2004. Royalties reported by the Company’s licensees were $151 million higher than royaltyrevenues from external licensees recorded in fiscal 2004 because $151 million in royalties that were reported in the first quarter of fiscal 2004 had been estimated and recordedas revenue in the fourth quarter of fiscal 2003. To facilitate an understanding of the impact of the change, the following table compares royalty revenues recorded as revenuein fiscal 2004, 2003 and 2002 to royalties reported by the Company’s licensees during those same periods (in millions):
F- 8
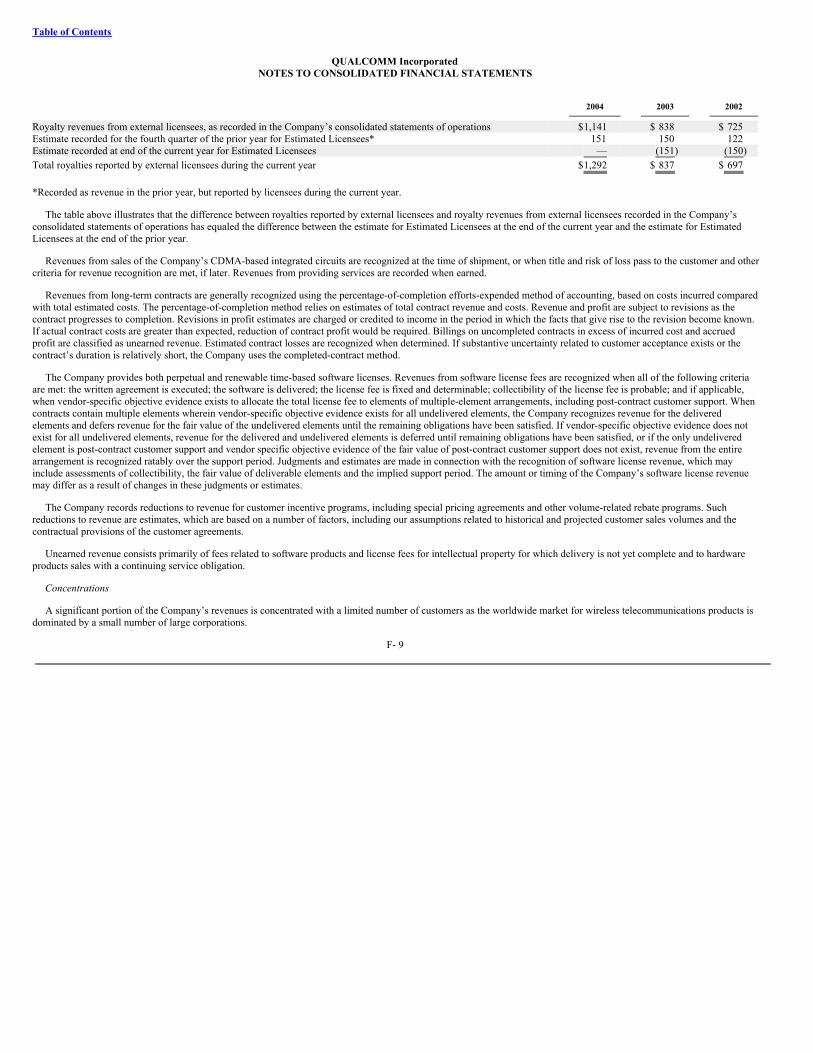
Table of Contents
QUALCOMM IncorporatedNOTES TO CONSOLIDATED FINANCIAL STATEMENTS
2004
2003
2002
Royalty revenues from external licensees, as recorded in the Company’s consolidated statements of operations $1,141 $ 838 $ 725 Estimate recorded for the fourth quarter of the prior year for Estimated Licensees* 151 150 122 Estimate recorded at end of the current year for Estimated Licensees — (151) (150)Total royalties reported by external licensees during the current year $1,292 $ 837 $ 697
*Recorded as revenue in the prior year, but reported by licensees during the current year.
The table above illustrates that the difference between royalties reported by external licensees and royalty revenues from external licensees recorded in the Company’sconsolidated statements of operations has equaled the difference between the estimate for Estimated Licensees at the end of the current year and the estimate for EstimatedLicensees at the end of the prior year.
Revenues from sales of the Company’s CDMA-based integrated circuits are recognized at the time of shipment, or when title and risk of loss pass to the customer and othercriteria for revenue recognition are met, if later. Revenues from providing services are recorded when earned.
Revenues from long-term contracts are generally recognized using the percentage-of-completion efforts-expended method of accounting, based on costs incurred comparedwith total estimated costs. The percentage-of-completion method relies on estimates of total contract revenue and costs. Revenue and profit are subject to revisions as thecontract progresses to completion. Revisions in profit estimates are charged or credited to income in the period in which the facts that give rise to the revision become known.If actual contract costs are greater than expected, reduction of contract profit would be required. Billings on uncompleted contracts in excess of incurred cost and accruedprofit are classified as unearned revenue. Estimated contract losses are recognized when determined. If substantive uncertainty related to customer acceptance exists or thecontract’s duration is relatively short, the Company uses the completed-contract method.
The Company provides both perpetual and renewable time-based software licenses. Revenues from software license fees are recognized when all of the following criteriaare met: the written agreement is executed; the software is delivered; the license fee is fixed and determinable; collectibility of the license fee is probable; and if applicable,when vendor-specific objective evidence exists to allocate the total license fee to elements of multiple-element arrangements, including post-contract customer support. Whencontracts contain multiple elements wherein vendor-specific objective evidence exists for all undelivered elements, the Company recognizes revenue for the deliveredelements and defers revenue for the fair value of the undelivered elements until the remaining obligations have been satisfied. If vendor-specific objective evidence does notexist for all undelivered elements, revenue for the delivered and undelivered elements is deferred until remaining obligations have been satisfied, or if the only undeliveredelement is post-contract customer support and vendor specific objective evidence of the fair value of post-contract customer support does not exist, revenue from the entirearrangement is recognized ratably over the support period. Judgments and estimates are made in connection with the recognition of software license revenue, which mayinclude assessments of collectibility, the fair value of deliverable elements and the implied support period. The amount or timing of the Company’s software license revenuemay differ as a result of changes in these judgments or estimates.
The Company records reductions to revenue for customer incentive programs, including special pricing agreements and other volume-related rebate programs. Suchreductions to revenue are estimates, which are based on a number of factors, including our assumptions related to historical and projected customer sales volumes and thecontractual provisions of the customer agreements.
Unearned revenue consists primarily of fees related to software products and license fees for intellectual property for which delivery is not yet complete and to hardwareproducts sales with a continuing service obligation.
Concentrations
A significant portion of the Company’s revenues is concentrated with a limited number of customers as the worldwide market for wireless telecommunications products isdominated by a small number of large corporations.
F- 9
Table of Contents
QUALCOMM IncorporatedNOTES TO CONSOLIDATED FINANCIAL STATEMENTS
Revenues from Samsung, LG Electronics and Motorola, customers of the Company’s QCT, QTL, QWI and other nonreportable segments, comprised 15%, 15% and 10% oftotal consolidated revenues, respectively, in fiscal 2004, as compared to 17%, 13% and 13% of total consolidated revenues, respectively, in fiscal 2003. Revenues fromSamsung, Kyocera and LG Electronics, customers of the Company’s QCT, QTL, QWI and other nonreportable segments, comprised 16%, 14% and 12% of total consolidatedrevenues, respectively, in fiscal 2002. Aggregated accounts receivable from Samsung, LG Electronics and Motorola comprised 51% and 48% of gross accounts receivable atSeptember 30, 2004 and 2003, respectively.
Revenues from international customers were approximately 79%, 77% and 69% of total consolidated revenues in fiscal 2004, 2003 and 2002, respectively.
Cost of equipment and services revenues
Cost of equipment and services revenues is primarily comprised of the cost of equipment revenues, the cost of messaging services revenues and the cost of developmentand other services revenues. Cost of equipment revenues consists of the cost of equipment sold and sustaining engineering costs, including personnel and related costs. Cost ofmessaging services revenues consists principally of satellite transponder costs, network operations expenses, including personnel and related costs, depreciation, and airtimecharges by telecommunications operators. Cost of development and other services revenues primarily includes personnel costs and related expenses.
Research and Development
Costs incurred in research and development activities are expensed as incurred, except certain software development costs capitalized after technological feasibility of thesoftware is established.
Shipping and Handling Costs
Costs incurred for shipping and handling are included in cost of revenues at the time the related revenue is recognized. Amounts billed to a customer for shipping andhandling are reported as revenue.
Income Taxes
The asset and liability approach is used to recognize deferred tax assets and liabilities for the expected future tax consequences of temporary differences between thecarrying amounts and the tax bases of assets and liabilities. Tax law and rate changes are reflected in income in the period such changes are enacted. The Company records avaluation allowance to reduce the deferred tax assets to the amount that is more likely than not to be realized.
Cash Equivalents
The Company considers all highly liquid investments with original maturities of three months or less to be cash equivalents. Cash equivalents are comprised of moneymarket funds, certificates of deposit, commercial paper and government agencies’ securities. The carrying amounts approximate fair value due to the short maturities of theseinstruments.
Marketable Securities
Management determines the appropriate classification of marketable securities at the time of purchase and reevaluates such designation as of each balance sheet date. Held-to-maturity securities are carried at amortized cost, which approximates fair value. Available-for-sale securities are stated at fair value as determined by the most recentlytraded price of each security at the balance sheet date. The net unrealized gains or losses on available-for-sale securities are reported as a component of comprehensive income(loss), net of tax. The specific identification method is used to compute the realized gains and losses on debt and equity securities.
The Company regularly monitors and evaluates the realizable value of its marketable securities. When assessing marketable securities for other-than-temporary declines invalue, the Company considers such factors as, among other things, how significant the decline in value is as a percentage of the original cost, how long the market value of
F- 10

Table of Contents
QUALCOMM IncorporatedNOTES TO CONSOLIDATED FINANCIAL STATEMENTS
the investment has been less than its original cost, the performance of the investee’s stock price in relation to the stock price of its competitors within the industry and themarket in general, analyst recommendations, any news that has been released specific to the investee and the outlook for the overall industry in which the investee operates.The Company also reviews the financial statements of the investee to determine if the investee is experiencing financial difficulties and considers new products/services thatthe investee may have forthcoming that will improve its operating results. If events and circumstances indicate that a decline in the value of these assets has occurred and isother than temporary, the Company records a charge to investment income (expense).
Allowances for Doubtful Accounts
The Company maintains allowances for doubtful accounts for estimated losses resulting from the inability of the Company’s customers to make required payments. TheCompany considers the following factors when determining if collection of a fee is reasonably assured: customer credit-worthiness, past transaction history with the customer,current economic industry trends and changes in customer payment terms. If the Company has no previous experience with the customer, the Company typically obtainsreports from various credit organizations to ensure that the customer has a history of paying its creditors. The Company may also request financial information, includingfinancial statements or other documents (e.g., bank statements) to ensure that the customer has the means of making payment. If these factors do not indicate collection isreasonably assured, revenue is deferred until collection becomes reasonably assured, which is generally upon receipt of cash. If the financial condition of the Company’scustomers were to deteriorate, adversely affecting their ability to make payments, additional allowances would be required.
The Company also maintains allowances for doubtful accounts for estimated losses resulting from the inability of entities it has financed to make required payments. TheCompany evaluates the adequacy of allowances for doubtful finance and note receivables based on analyses of the financed entities’ credit-worthiness, current economictrends or market conditions, review of the entities’ current and projected financial and operational information, and consideration of the fair value of collateral to be received,if applicable. From time to time, the Company may consider third party evaluations, valuation reports or advice from investment banks. If the financial condition of thefinanced entities were to deteriorate, adversely affecting their ability to make payments, additional allowances would be required.
Inventories
Inventories are valued at the lower of cost or market (replacement cost, not to exceed net realizable value) using the first-in, first-out method. Recoverability of inventory isassessed based on review of committed purchase orders from customers, as well as purchase commitment projections provided by customers, among other things.
Property, Plant and Equipment
Property, plant and equipment are recorded at cost and depreciated or amortized using the straight-line method over their estimated useful lives. Buildings and buildingimprovements are depreciated over 30 years and 15 years, respectively. Leasehold improvements are amortized over the shorter of their estimated useful lives or the remainingterm of the related lease. Other property, plant and equipment have useful lives ranging from two to 15 years. Direct external and internal costs of developing software forinternal use are capitalized subsequent to the preliminary stage of development. Maintenance, repairs, and minor renewals and betterments are charged to expense as incurred.
Upon the retirement or disposition of property, plant and equipment, the related cost and accumulated depreciation or amortization are removed and the gain or loss isrecorded.
Other Investments
Investments in Other Entities
The Company makes strategic investments in companies that have developed or are developing innovative wireless data applications and wireless operators that promotethe worldwide deployment of CDMA systems. Investments in corporate entities with less than a 20% voting interest are generally accounted for under the cost method. TheCompany uses the equity method to account for investments in corporate entities, including limited liability corporations that do not maintain specific ownership accounts, inwhich it has a voting interest of 20% to
F- 11
Table of Contents
QUALCOMM IncorporatedNOTES TO CONSOLIDATED FINANCIAL STATEMENTS
50% and other than minor to 50% ownership interests in partnerships and limited liability corporations that do maintain specific ownership accounts, or in which it otherwisehas the ability to exercise significant influence. Under the equity method, the investment is originally recorded at cost and adjusted to recognize the Company’s share of netearnings or losses of the investee, limited to the extent of the Company’s investment in and advances to the investee and financial guarantees on behalf of the investee thatcreate additional basis.
The Company regularly monitors and evaluates the realizable value of its investments. When assessing an investment for an other-than-temporary decline in value, theCompany considers such factors as, among other things, the share price from the investee’s latest financing round, the performance of the investee in relation to its ownoperating targets and its business plan, the investee’s revenue and cost trends, as well as liquidity and cash position, including its cash burn rate, market acceptance of theinvestee’s products/services as well as any new products or services that may be forthcoming, any significant news that has been released specific to the investee or theinvestee’s competitors and/or industry, and the outlook for the overall industry in which the investee operates. From time to time, the Company may consider third partyevaluations, valuation reports or advice from investment banks. If events and circumstances indicate that a decline in the value of these assets has occurred and is other thantemporary, the Company records a charge to investment income (expense).
Derivatives
The Company holds warrants to purchase equity interests in certain other companies related to its strategic investment activities. The Company’s warrants are not held fortrading purposes. Certain of the Company’s warrants are recorded at fair value. Changes in fair value are recorded in investment income (expense) as gains (losses) onderivative instruments because the warrants do not meet the requirements for hedge accounting. Warrants that do not have contractual net settlement provisions are recordedat cost.
The Company enters into foreign currency forward and option contracts to hedge certain foreign currency transactions and probable anticipated foreign currencytransactions. Gains and losses arising from foreign currency forward and option contracts that are not designated as hedging instruments are recorded in investment income(expense) as gains (losses) on derivative instruments. Gains and losses arising from the effective portion of foreign currency forward and option contracts that are designatedas cash-flow hedging instruments are recorded in accumulated other comprehensive income (loss) as gains (losses) on derivative instruments until the underlying transactionaffects the Company’s earnings. The value of the Company’s foreign currency forward contracts was insignificant at September 30, 2004. The Company had no foreigncurrency option contracts outstanding at September 30, 2004. The Company had no foreign currency forward or option contracts outstanding at September 30, 2003.
At September 30, 2004 and 2003, the recorded value of the Company’s derivative instruments totaled $4 million and $2 million, respectively, and none of the Company’sderivatives were designated as hedges. The Company’s derivative instruments are included in other assets.
Goodwill and Other Intangible Assets
Goodwill represents the excess of purchase price and related costs over the value assigned to the net tangible and identifiable intangible assets of businesses acquired.Effective as of the beginning of fiscal 2003, the Company fully adopted Statement of Financial Accounting Standards No. 141 (FAS 141), “Business Combinations,” andStatement of Financial Accounting Standards No. 142 (FAS 142), “Goodwill and Other Intangible Assets.” The provisions of FAS 141 (1) require that the purchase method ofaccounting be used for all business combinations initiated after June 30, 2001, (2) provide specific criteria for the initial recognition and measurement of intangible assetsapart from goodwill, and (3) require that unamortized negative goodwill be written off immediately as an extraordinary gain instead of being deferred and amortized. FAS 141also requires that, upon adoption of FAS 142, the Company reclassify the carrying amounts of certain intangible assets into or out of goodwill, based on certain criteria. Uponthe adoption of FAS 142, the Company reclassified approximately $2 million of certain intangible assets into goodwill.
FAS 142 primarily addresses the accounting for goodwill and intangible assets subsequent to their initial recognition. The provisions of FAS 142 (1) prohibit theamortization of goodwill and indefinite-lived intangible assets, (2) require that goodwill and indefinite-lived intangible
F- 12
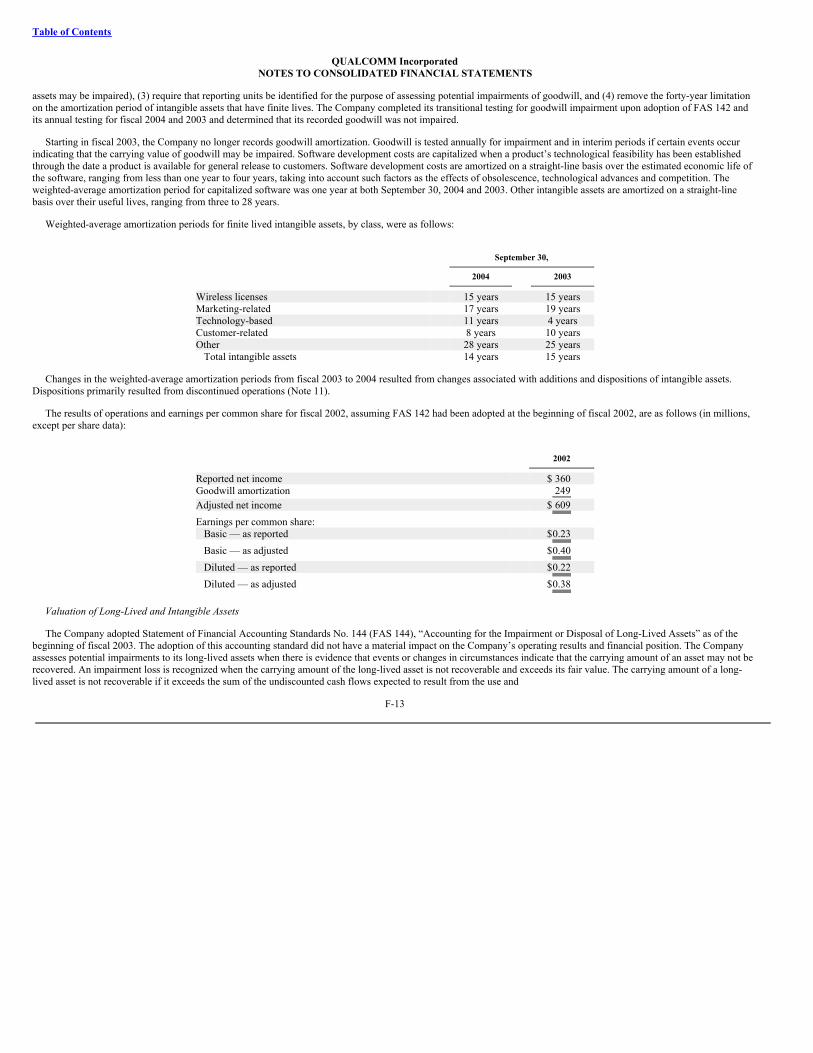
Table of Contents
QUALCOMM IncorporatedNOTES TO CONSOLIDATED FINANCIAL STATEMENTS
assets may be impaired), (3) require that reporting units be identified for the purpose of assessing potential impairments of goodwill, and (4) remove the forty-year limitationon the amortization period of intangible assets that have finite lives. The Company completed its transitional testing for goodwill impairment upon adoption of FAS 142 andits annual testing for fiscal 2004 and 2003 and determined that its recorded goodwill was not impaired.
Starting in fiscal 2003, the Company no longer records goodwill amortization. Goodwill is tested annually for impairment and in interim periods if certain events occurindicating that the carrying value of goodwill may be impaired. Software development costs are capitalized when a product’s technological feasibility has been establishedthrough the date a product is available for general release to customers. Software development costs are amortized on a straight-line basis over the estimated economic life ofthe software, ranging from less than one year to four years, taking into account such factors as the effects of obsolescence, technological advances and competition. Theweighted-average amortization period for capitalized software was one year at both September 30, 2004 and 2003. Other intangible assets are amortized on a straight-linebasis over their useful lives, ranging from three to 28 years.
Weighted-average amortization periods for finite lived intangible assets, by class, were as follows:
September 30,
2004
2003
Wireless licenses 15 years 15 yearsMarketing-related 17 years 19 yearsTechnology-based 11 years 4 yearsCustomer-related 8 years 10 yearsOther 28 years 25 years
Total intangible assets 14 years 15 years
Changes in the weighted-average amortization periods from fiscal 2003 to 2004 resulted from changes associated with additions and dispositions of intangible assets.Dispositions primarily resulted from discontinued operations (Note 11).
The results of operations and earnings per common share for fiscal 2002, assuming FAS 142 had been adopted at the beginning of fiscal 2002, are as follows (in millions,except per share data):
2002
Reported net income $ 360 Goodwill amortization 249 Adjusted net income $ 609 Earnings per common share:
Basic — as reported $0.23 Basic — as adjusted $0.40 Diluted — as reported $0.22 Diluted — as adjusted $0.38
Valuation of Long-Lived and Intangible Assets
The Company adopted Statement of Financial Accounting Standards No. 144 (FAS 144), “Accounting for the Impairment or Disposal of Long-Lived Assets” as of thebeginning of fiscal 2003. The adoption of this accounting standard did not have a material impact on the Company’s operating results and financial position. The Companyassesses potential impairments to its long-lived assets when there is evidence that events or changes in circumstances indicate that the carrying amount of an asset may not berecovered. An impairment loss is recognized when the carrying amount of the long-lived asset is not recoverable and exceeds its fair value. The carrying amount of a long-lived asset is not recoverable if it exceeds the sum of the undiscounted cash flows expected to result from the use and
F-13
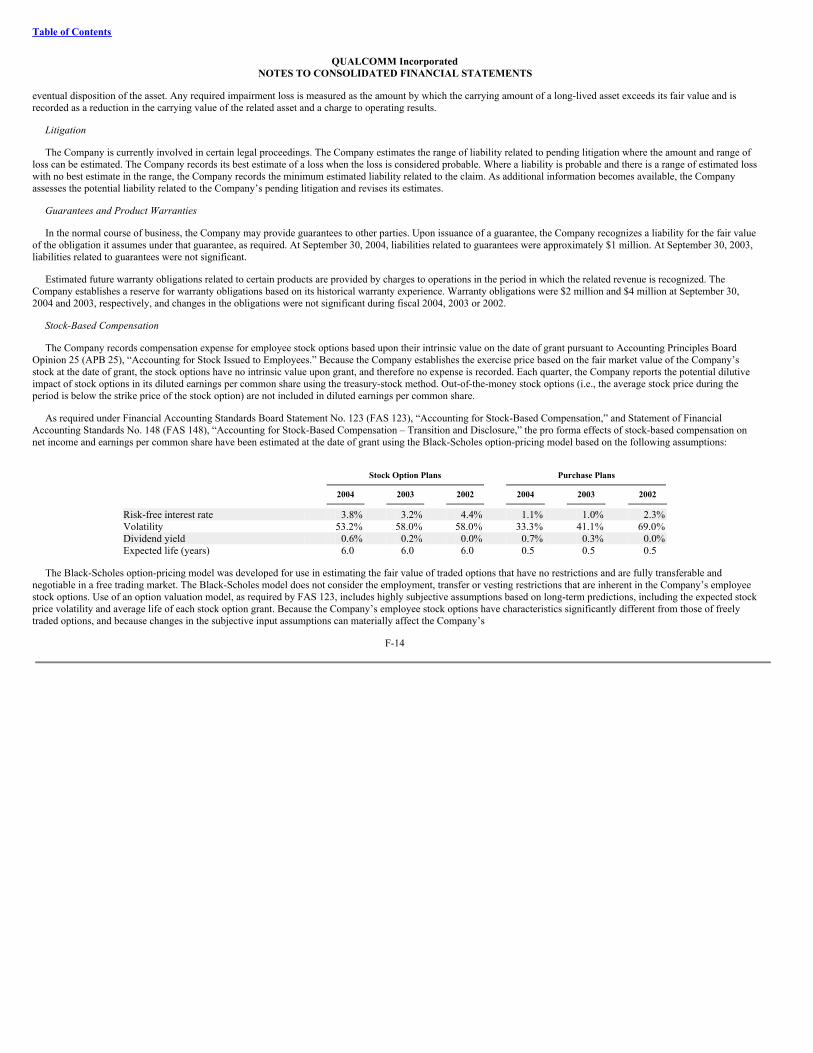
Table of Contents
QUALCOMM IncorporatedNOTES TO CONSOLIDATED FINANCIAL STATEMENTS
eventual disposition of the asset. Any required impairment loss is measured as the amount by which the carrying amount of a long-lived asset exceeds its fair value and isrecorded as a reduction in the carrying value of the related asset and a charge to operating results.
Litigation
The Company is currently involved in certain legal proceedings. The Company estimates the range of liability related to pending litigation where the amount and range ofloss can be estimated. The Company records its best estimate of a loss when the loss is considered probable. Where a liability is probable and there is a range of estimated losswith no best estimate in the range, the Company records the minimum estimated liability related to the claim. As additional information becomes available, the Companyassesses the potential liability related to the Company’s pending litigation and revises its estimates.
Guarantees and Product Warranties
In the normal course of business, the Company may provide guarantees to other parties. Upon issuance of a guarantee, the Company recognizes a liability for the fair valueof the obligation it assumes under that guarantee, as required. At September 30, 2004, liabilities related to guarantees were approximately $1 million. At September 30, 2003,liabilities related to guarantees were not significant.
Estimated future warranty obligations related to certain products are provided by charges to operations in the period in which the related revenue is recognized. TheCompany establishes a reserve for warranty obligations based on its historical warranty experience. Warranty obligations were $2 million and $4 million at September 30,2004 and 2003, respectively, and changes in the obligations were not significant during fiscal 2004, 2003 or 2002.
Stock-Based Compensation
The Company records compensation expense for employee stock options based upon their intrinsic value on the date of grant pursuant to Accounting Principles BoardOpinion 25 (APB 25), “Accounting for Stock Issued to Employees.” Because the Company establishes the exercise price based on the fair market value of the Company’sstock at the date of grant, the stock options have no intrinsic value upon grant, and therefore no expense is recorded. Each quarter, the Company reports the potential dilutiveimpact of stock options in its diluted earnings per common share using the treasury-stock method. Out-of-the-money stock options (i.e., the average stock price during theperiod is below the strike price of the stock option) are not included in diluted earnings per common share.
As required under Financial Accounting Standards Board Statement No. 123 (FAS 123), “Accounting for Stock-Based Compensation,” and Statement of FinancialAccounting Standards No. 148 (FAS 148), “Accounting for Stock-Based Compensation – Transition and Disclosure,” the pro forma effects of stock-based compensation onnet income and earnings per common share have been estimated at the date of grant using the Black-Scholes option-pricing model based on the following assumptions:
Stock Option Plans
Purchase Plans
2004
2003
2002
2004
2003
2002
Risk-free interest rate 3.8% 3.2% 4.4% 1.1% 1.0% 2.3%Volatility 53.2% 58.0% 58.0% 33.3% 41.1% 69.0%Dividend yield 0.6% 0.2% 0.0% 0.7% 0.3% 0.0%Expected life (years) 6.0 6.0 6.0 0.5 0.5 0.5
The Black-Scholes option-pricing model was developed for use in estimating the fair value of traded options that have no restrictions and are fully transferable andnegotiable in a free trading market. The Black-Scholes model does not consider the employment, transfer or vesting restrictions that are inherent in the Company’s employeestock options. Use of an option valuation model, as required by FAS 123, includes highly subjective assumptions based on long-term predictions, including the expected stockprice volatility and average life of each stock option grant. Because the Company’s employee stock options have characteristics significantly different from those of freelytraded options, and because changes in the subjective input assumptions can materially affect the Company’s
F-14
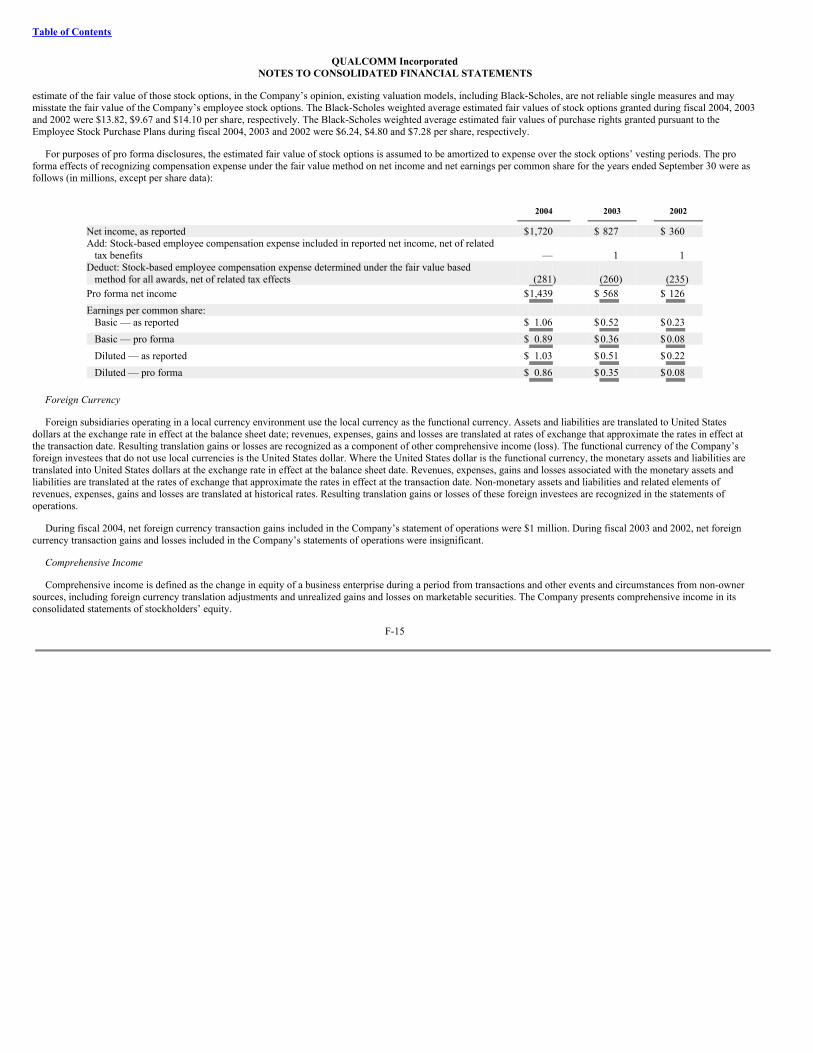
Table of Contents
QUALCOMM IncorporatedNOTES TO CONSOLIDATED FINANCIAL STATEMENTS
estimate of the fair value of those stock options, in the Company’s opinion, existing valuation models, including Black-Scholes, are not reliable single measures and maymisstate the fair value of the Company’s employee stock options. The Black-Scholes weighted average estimated fair values of stock options granted during fiscal 2004, 2003and 2002 were $13.82, $9.67 and $14.10 per share, respectively. The Black-Scholes weighted average estimated fair values of purchase rights granted pursuant to theEmployee Stock Purchase Plans during fiscal 2004, 2003 and 2002 were $6.24, $4.80 and $7.28 per share, respectively.
For purposes of pro forma disclosures, the estimated fair value of stock options is assumed to be amortized to expense over the stock options’ vesting periods. The proforma effects of recognizing compensation expense under the fair value method on net income and net earnings per common share for the years ended September 30 were asfollows (in millions, except per share data):
2004
2003
2002
Net income, as reported $1,720 $ 827 $ 360 Add: Stock-based employee compensation expense included in reported net income, net of related
tax benefits — 1 1 Deduct: Stock-based employee compensation expense determined under the fair value based
method for all awards, net of related tax effects (281) (260) (235)Pro forma net income $1,439 $ 568 $ 126 Earnings per common share:
Basic — as reported $ 1.06 $0.52 $0.23 Basic — pro forma $ 0.89 $0.36 $0.08 Diluted — as reported $ 1.03 $0.51 $0.22 Diluted — pro forma $ 0.86 $0.35 $0.08
Foreign Currency
Foreign subsidiaries operating in a local currency environment use the local currency as the functional currency. Assets and liabilities are translated to United Statesdollars at the exchange rate in effect at the balance sheet date; revenues, expenses, gains and losses are translated at rates of exchange that approximate the rates in effect atthe transaction date. Resulting translation gains or losses are recognized as a component of other comprehensive income (loss). The functional currency of the Company’sforeign investees that do not use local currencies is the United States dollar. Where the United States dollar is the functional currency, the monetary assets and liabilities aretranslated into United States dollars at the exchange rate in effect at the balance sheet date. Revenues, expenses, gains and losses associated with the monetary assets andliabilities are translated at the rates of exchange that approximate the rates in effect at the transaction date. Non-monetary assets and liabilities and related elements ofrevenues, expenses, gains and losses are translated at historical rates. Resulting translation gains or losses of these foreign investees are recognized in the statements ofoperations.
During fiscal 2004, net foreign currency transaction gains included in the Company’s statement of operations were $1 million. During fiscal 2003 and 2002, net foreigncurrency transaction gains and losses included in the Company’s statements of operations were insignificant.
Comprehensive Income
Comprehensive income is defined as the change in equity of a business enterprise during a period from transactions and other events and circumstances from non-ownersources, including foreign currency translation adjustments and unrealized gains and losses on marketable securities. The Company presents comprehensive income in itsconsolidated statements of stockholders’ equity.
F-15
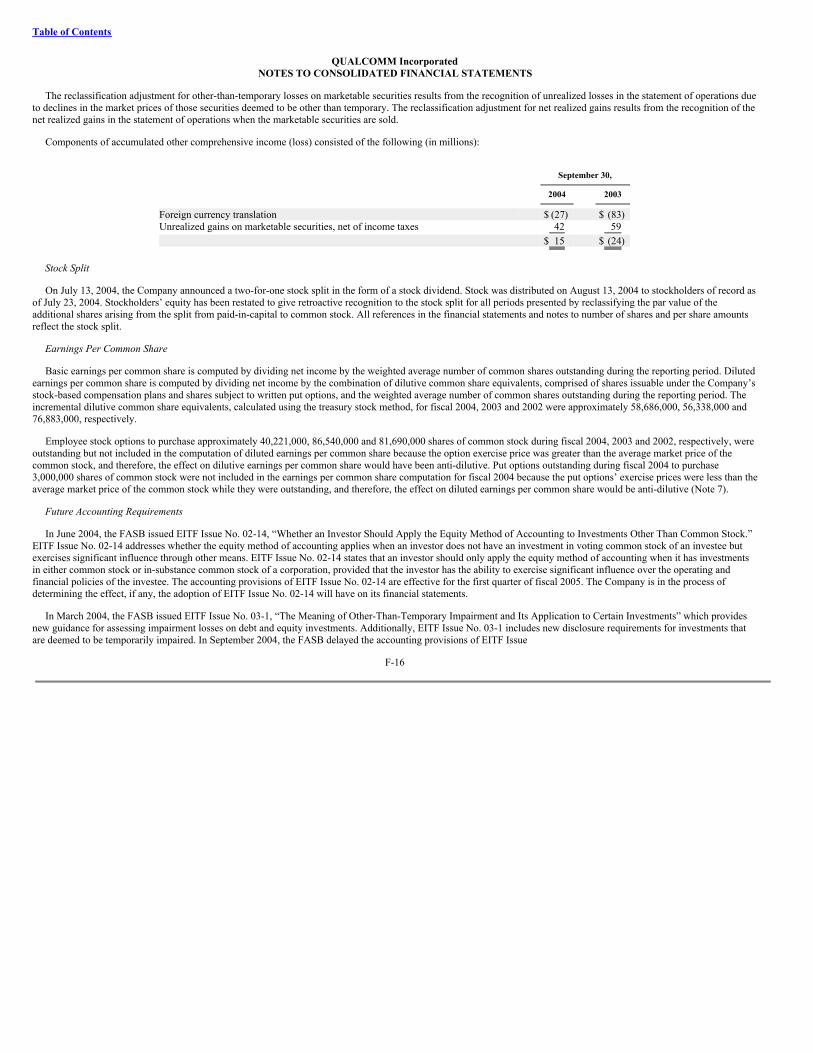
Table of Contents
QUALCOMM IncorporatedNOTES TO CONSOLIDATED FINANCIAL STATEMENTS
The reclassification adjustment for other-than-temporary losses on marketable securities results from the recognition of unrealized losses in the statement of operations dueto declines in the market prices of those securities deemed to be other than temporary. The reclassification adjustment for net realized gains results from the recognition of thenet realized gains in the statement of operations when the marketable securities are sold.
Components of accumulated other comprehensive income (loss) consisted of the following (in millions):
September 30,
2004
2003
Foreign currency translation $ (27) $ (83)Unrealized gains on marketable securities, net of income taxes 42 59 $ 15 $ (24)
Stock Split
On July 13, 2004, the Company announced a two-for-one stock split in the form of a stock dividend. Stock was distributed on August 13, 2004 to stockholders of record asof July 23, 2004. Stockholders’ equity has been restated to give retroactive recognition to the stock split for all periods presented by reclassifying the par value of theadditional shares arising from the split from paid-in-capital to common stock. All references in the financial statements and notes to number of shares and per share amountsreflect the stock split.
Earnings Per Common Share
Basic earnings per common share is computed by dividing net income by the weighted average number of common shares outstanding during the reporting period. Dilutedearnings per common share is computed by dividing net income by the combination of dilutive common share equivalents, comprised of shares issuable under the Company’sstock-based compensation plans and shares subject to written put options, and the weighted average number of common shares outstanding during the reporting period. Theincremental dilutive common share equivalents, calculated using the treasury stock method, for fiscal 2004, 2003 and 2002 were approximately 58,686,000, 56,338,000 and76,883,000, respectively.
Employee stock options to purchase approximately 40,221,000, 86,540,000 and 81,690,000 shares of common stock during fiscal 2004, 2003 and 2002, respectively, wereoutstanding but not included in the computation of diluted earnings per common share because the option exercise price was greater than the average market price of thecommon stock, and therefore, the effect on dilutive earnings per common share would have been anti-dilutive. Put options outstanding during fiscal 2004 to purchase3,000,000 shares of common stock were not included in the earnings per common share computation for fiscal 2004 because the put options’ exercise prices were less than theaverage market price of the common stock while they were outstanding, and therefore, the effect on diluted earnings per common share would be anti-dilutive (Note 7).
Future Accounting Requirements
In June 2004, the FASB issued EITF Issue No. 02-14, “Whether an Investor Should Apply the Equity Method of Accounting to Investments Other Than Common Stock.”EITF Issue No. 02-14 addresses whether the equity method of accounting applies when an investor does not have an investment in voting common stock of an investee butexercises significant influence through other means. EITF Issue No. 02-14 states that an investor should only apply the equity method of accounting when it has investmentsin either common stock or in-substance common stock of a corporation, provided that the investor has the ability to exercise significant influence over the operating andfinancial policies of the investee. The accounting provisions of EITF Issue No. 02-14 are effective for the first quarter of fiscal 2005. The Company is in the process ofdetermining the effect, if any, the adoption of EITF Issue No. 02-14 will have on its financial statements.
In March 2004, the FASB issued EITF Issue No. 03-1, “The Meaning of Other-Than-Temporary Impairment and Its Application to Certain Investments” which providesnew guidance for assessing impairment losses on debt and equity investments. Additionally, EITF Issue No. 03-1 includes new disclosure requirements for investments thatare deemed to be temporarily impaired. In September 2004, the FASB delayed the accounting provisions of EITF Issue
F-16
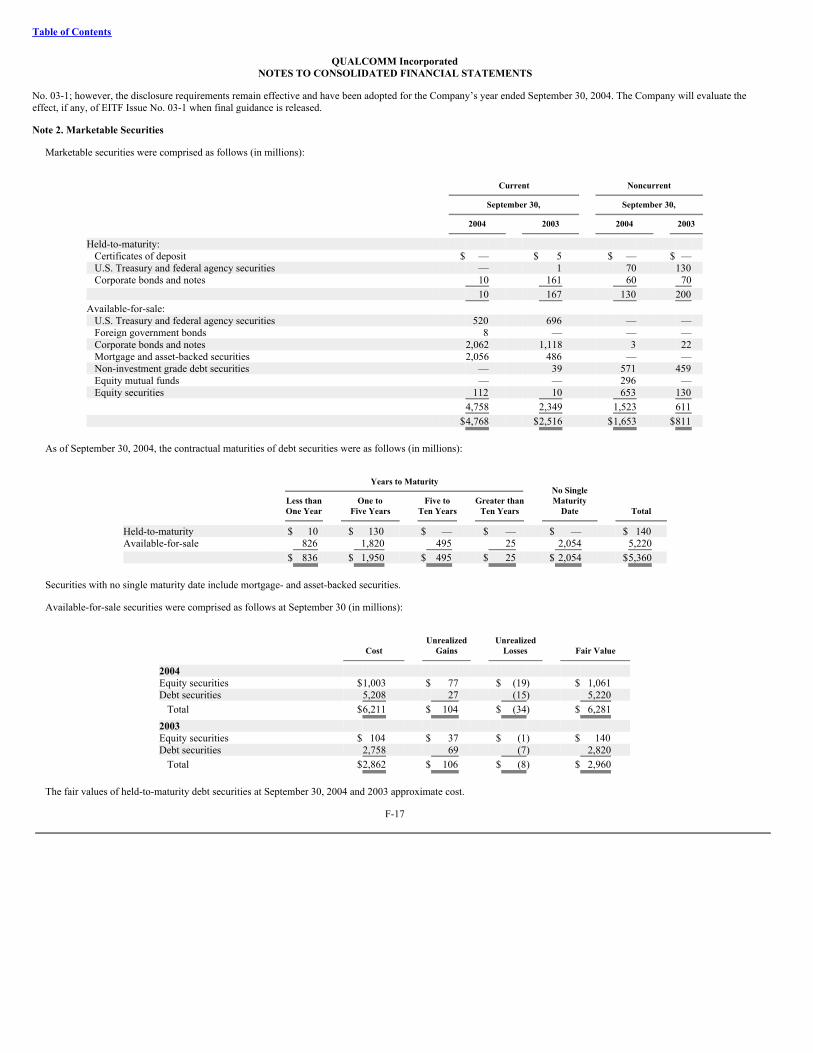
Table of Contents
QUALCOMM IncorporatedNOTES TO CONSOLIDATED FINANCIAL STATEMENTS
No. 03-1; however, the disclosure requirements remain effective and have been adopted for the Company’s year ended September 30, 2004. The Company will evaluate theeffect, if any, of EITF Issue No. 03-1 when final guidance is released.
Note 2. Marketable Securities
Marketable securities were comprised as follows (in millions):
Current
Noncurrent
September 30,
September 30,
2004
2003
2004
2003
Held-to-maturity: Certificates of deposit $ — $ 5 $ — $ — U.S. Treasury and federal agency securities — 1 70 130 Corporate bonds and notes 10 161 60 70
10 167 130 200 Available-for-sale:
U.S. Treasury and federal agency securities 520 696 — — Foreign government bonds 8 — — — Corporate bonds and notes 2,062 1,118 3 22 Mortgage and asset-backed securities 2,056 486 — — Non-investment grade debt securities — 39 571 459 Equity mutual funds — — 296 — Equity securities 112 10 653 130
4,758 2,349 1,523 611 $4,768 $2,516 $1,653 $811
As of September 30, 2004, the contractual maturities of debt securities were as follows (in millions):
Years to Maturity
No Single Less than One to Five to Greater than Maturity
One Year
Five Years
Ten Years
Ten Years
Date
Total
Held-to-maturity $ 10 $ 130 $ — $ — $ — $ 140 Available-for-sale 826 1,820 495 25 2,054 5,220 $ 836 $ 1,950 $ 495 $ 25 $ 2,054 $5,360
Securities with no single maturity date include mortgage- and asset-backed securities.
Available-for-sale securities were comprised as follows at September 30 (in millions):
Unrealized Unrealized
Cost
Gains
Losses
Fair Value
2004 Equity securities $1,003 $ 77 $ (19) $ 1,061 Debt securities 5,208 27 (15) 5,220
Total $6,211 $ 104 $ (34) $ 6,281 2003 Equity securities $ 104 $ 37 $ (1) $ 140 Debt securities 2,758 69 (7) 2,820
Total $2,862 $ 106 $ (8) $ 2,960
The fair values of held-to-maturity debt securities at September 30, 2004 and 2003 approximate cost.
F-17

Table of Contents
QUALCOMM IncorporatedNOTES TO CONSOLIDATED FINANCIAL STATEMENTS
For the years ended September 30, 2004, 2003 and 2002, the Company recorded realized gains and losses on sales of available-for-sale marketable securities as follows (inmillions):
Gross Gross Realized Realized Net Realized
Gains
Losses
Gains
2004 $ 105 $ (17) $ 88 2003 82 (13) 69 2002 23 (11) 12
The following table shows the gross unrealized losses and fair values of the Company’s investments in individual securities that have been in a continuous unrealized lossposition deemed to be temporary for less than 12 months, aggregated by investment category, at September 30, 2004 (in millions):
Fair Unrealized
Value
Losses
U.S. Treasury and federal agency securities $ 309 $ (1)Corporate bonds and notes 1,261 (4)Mortgage and asset-backed securities 559 (2)Non-investment grade debt securities 108 (7)Equity mutual funds 296 (7)Equity securities 196 (13) $2,729 $ (34)
At September 30, 2004, the Company did not have any investments in individual securities that have been in a continuous unrealized loss position deemed to be temporaryfor more than 12 months.
Investment Grade Debt Securities. The Company’s investments in investment grade debt securities consist primarily of investments in certificates of deposit, U.S. Treasuryand federal agency securities, foreign government bonds, mortgage and asset-backed securities and corporate bonds and notes. The unrealized losses on the Company’sinvestments in investment grade debt securities were caused by interest rate increases. Due to the fact that the decline in market value is attributable to changes in interest ratesand not credit quality, and because the severity and duration of the unrealized losses were not significant, the Company considered these unrealized losses to be temporary atSeptember 30, 2004.
Non-Investment Grade Debt Securities. The Company’s investments in non-investment grade debt securities consist primarily of investments in corporate bonds. Theunrealized losses on the Company’s investment in non-investment grade debt securities were caused by credit quality and industry or company specific events. Because theseverity and duration of the unrealized losses were not significant, the Company considered these unrealized losses to be temporary at September 30, 2004.
Marketable Equity Securities. The Company’s investments in marketable equity securities consist primarily of investments in common stock of large companies and equitymutual funds. The unrealized losses on the Company’s investment in marketable equity securities were caused by overall equity market volatility and industry specific events.The duration and severity of the unrealized losses in relation to the carrying amounts of the individual investments were consistent with typical equity market volatility.Current market forecasts support a recovery of fair value up to (or beyond) the cost of the investment within a reasonable period of time. Accordingly, the Companyconsidered these unrealized losses to be temporary at September 30, 2004.
F-18
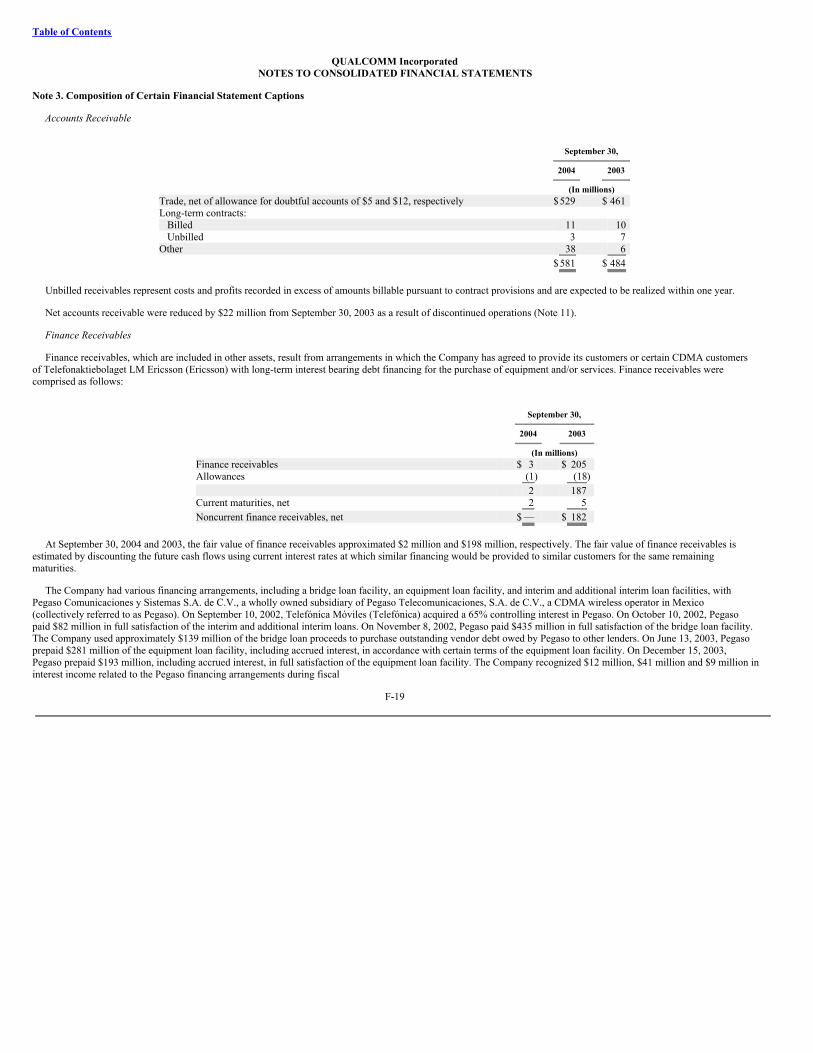
Table of Contents
QUALCOMM IncorporatedNOTES TO CONSOLIDATED FINANCIAL STATEMENTS
Note 3. Composition of Certain Financial Statement Captions
Accounts Receivable
September 30,
2004
2003
(In millions)Trade, net of allowance for doubtful accounts of $5 and $12, respectively $529 $ 461 Long-term contracts:
Billed 11 10 Unbilled 3 7
Other 38 6 $581 $ 484
Unbilled receivables represent costs and profits recorded in excess of amounts billable pursuant to contract provisions and are expected to be realized within one year.
Net accounts receivable were reduced by $22 million from September 30, 2003 as a result of discontinued operations (Note 11).
Finance Receivables
Finance receivables, which are included in other assets, result from arrangements in which the Company has agreed to provide its customers or certain CDMA customersof Telefonaktiebolaget LM Ericsson (Ericsson) with long-term interest bearing debt financing for the purchase of equipment and/or services. Finance receivables werecomprised as follows:
September 30,
2004
2003
(In millions)Finance receivables $ 3 $ 205 Allowances (1) (18) 2 187 Current maturities, net 2 5 Noncurrent finance receivables, net $ — $ 182
At September 30, 2004 and 2003, the fair value of finance receivables approximated $2 million and $198 million, respectively. The fair value of finance receivables isestimated by discounting the future cash flows using current interest rates at which similar financing would be provided to similar customers for the same remainingmaturities.
The Company had various financing arrangements, including a bridge loan facility, an equipment loan facility, and interim and additional interim loan facilities, withPegaso Comunicaciones y Sistemas S.A. de C.V., a wholly owned subsidiary of Pegaso Telecomunicaciones, S.A. de C.V., a CDMA wireless operator in Mexico(collectively referred to as Pegaso). On September 10, 2002, Telefónica Móviles (Telefónica) acquired a 65% controlling interest in Pegaso. On October 10, 2002, Pegasopaid $82 million in full satisfaction of the interim and additional interim loans. On November 8, 2002, Pegaso paid $435 million in full satisfaction of the bridge loan facility.The Company used approximately $139 million of the bridge loan proceeds to purchase outstanding vendor debt owed by Pegaso to other lenders. On June 13, 2003, Pegasoprepaid $281 million of the equipment loan facility, including accrued interest, in accordance with certain terms of the equipment loan facility. On December 15, 2003,Pegaso prepaid $193 million, including accrued interest, in full satisfaction of the equipment loan facility. The Company recognized $12 million, $41 million and $9 million ininterest income related to the Pegaso financing arrangements during fiscal
F-19
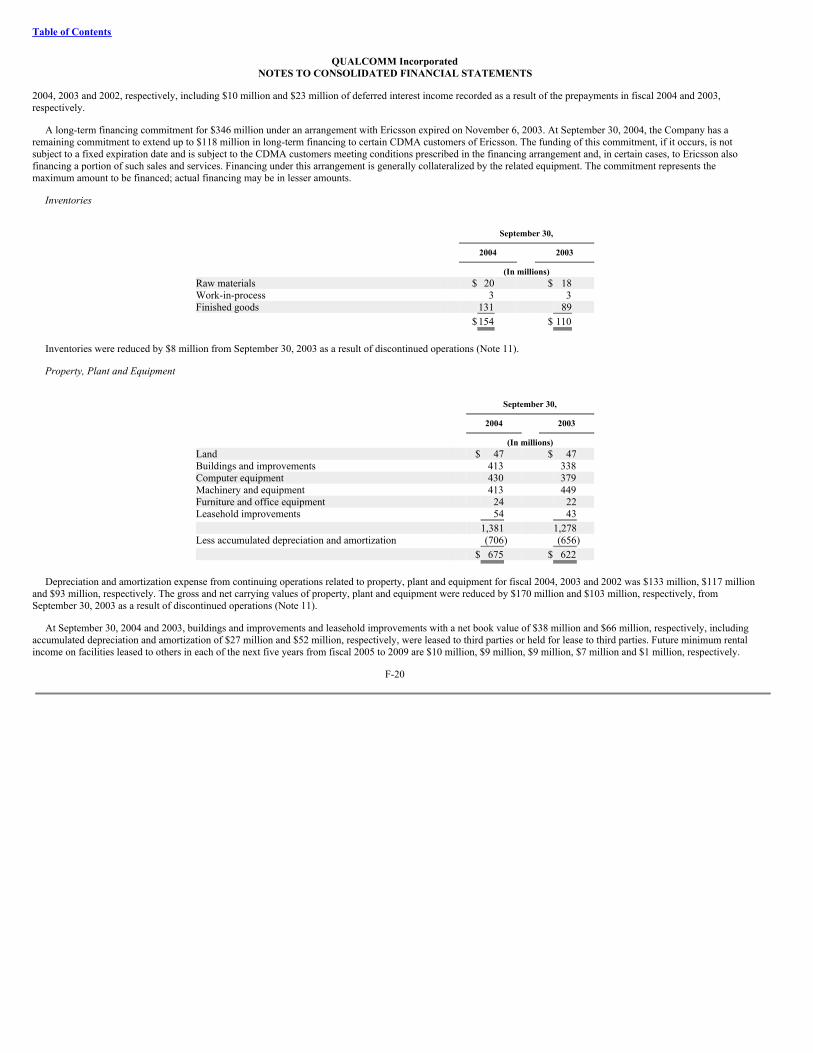
Table of Contents
QUALCOMM IncorporatedNOTES TO CONSOLIDATED FINANCIAL STATEMENTS
2004, 2003 and 2002, respectively, including $10 million and $23 million of deferred interest income recorded as a result of the prepayments in fiscal 2004 and 2003,respectively.
A long-term financing commitment for $346 million under an arrangement with Ericsson expired on November 6, 2003. At September 30, 2004, the Company has aremaining commitment to extend up to $118 million in long-term financing to certain CDMA customers of Ericsson. The funding of this commitment, if it occurs, is notsubject to a fixed expiration date and is subject to the CDMA customers meeting conditions prescribed in the financing arrangement and, in certain cases, to Ericsson alsofinancing a portion of such sales and services. Financing under this arrangement is generally collateralized by the related equipment. The commitment represents themaximum amount to be financed; actual financing may be in lesser amounts.
Inventories
September 30,
2004
2003
(In millions)Raw materials $ 20 $ 18 Work-in-process 3 3 Finished goods 131 89 $154 $ 110
Inventories were reduced by $8 million from September 30, 2003 as a result of discontinued operations (Note 11).
Property, Plant and Equipment
September 30,
2004
2003
(In millions)Land $ 47 $ 47 Buildings and improvements 413 338 Computer equipment 430 379 Machinery and equipment 413 449 Furniture and office equipment 24 22 Leasehold improvements 54 43 1,381 1,278 Less accumulated depreciation and amortization (706) (656) $ 675 $ 622
Depreciation and amortization expense from continuing operations related to property, plant and equipment for fiscal 2004, 2003 and 2002 was $133 million, $117 millionand $93 million, respectively. The gross and net carrying values of property, plant and equipment were reduced by $170 million and $103 million, respectively, fromSeptember 30, 2003 as a result of discontinued operations (Note 11).
At September 30, 2004 and 2003, buildings and improvements and leasehold improvements with a net book value of $38 million and $66 million, respectively, includingaccumulated depreciation and amortization of $27 million and $52 million, respectively, were leased to third parties or held for lease to third parties. Future minimum rentalincome on facilities leased to others in each of the next five years from fiscal 2005 to 2009 are $10 million, $9 million, $9 million, $7 million and $1 million, respectively.
F-20
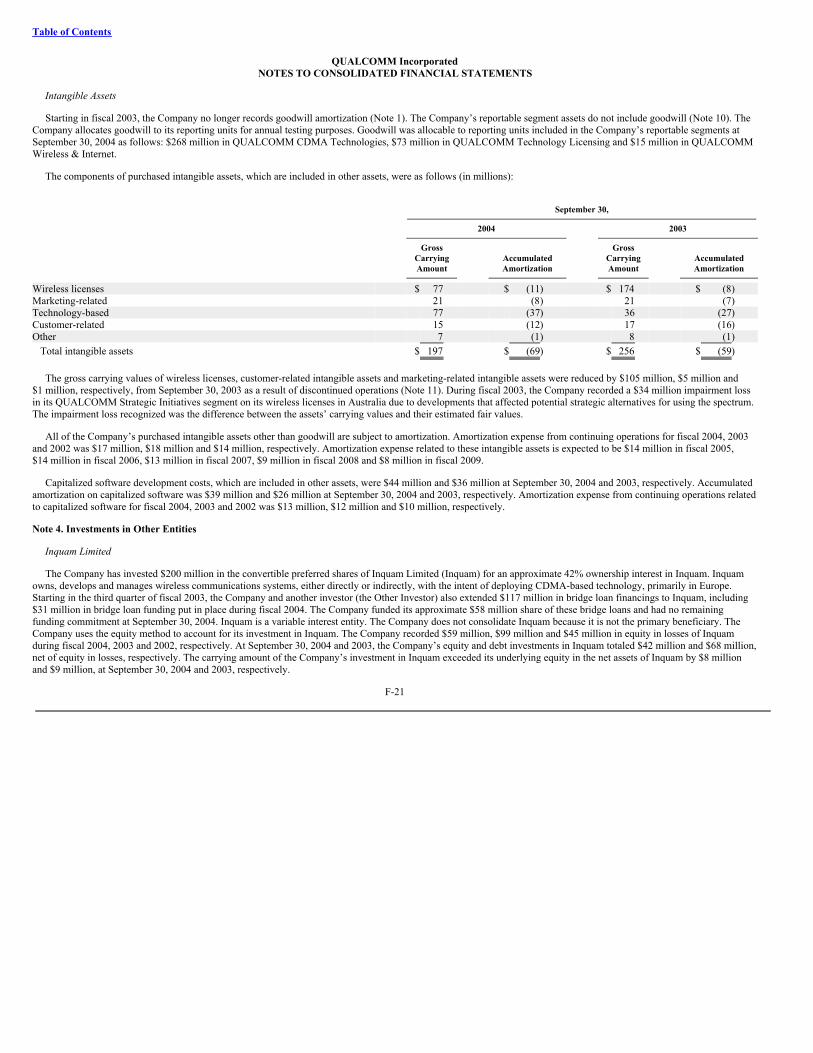
Table of Contents
QUALCOMM IncorporatedNOTES TO CONSOLIDATED FINANCIAL STATEMENTS
Intangible Assets
Starting in fiscal 2003, the Company no longer records goodwill amortization (Note 1). The Company’s reportable segment assets do not include goodwill (Note 10). TheCompany allocates goodwill to its reporting units for annual testing purposes. Goodwill was allocable to reporting units included in the Company’s reportable segments atSeptember 30, 2004 as follows: $268 million in QUALCOMM CDMA Technologies, $73 million in QUALCOMM Technology Licensing and $15 million in QUALCOMMWireless & Internet.
The components of purchased intangible assets, which are included in other assets, were as follows (in millions):
September 30,
2004
2003
Gross Gross Carrying Accumulated Carrying Accumulated
Amount
Amortization
Amount
Amortization
Wireless licenses $ 77 $ (11) $ 174 $ (8)Marketing-related 21 (8) 21 (7)Technology-based 77 (37) 36 (27)Customer-related 15 (12) 17 (16)Other 7 (1) 8 (1)
Total intangible assets $ 197 $ (69) $ 256 $ (59)
The gross carrying values of wireless licenses, customer-related intangible assets and marketing-related intangible assets were reduced by $105 million, $5 million and$1 million, respectively, from September 30, 2003 as a result of discontinued operations (Note 11). During fiscal 2003, the Company recorded a $34 million impairment lossin its QUALCOMM Strategic Initiatives segment on its wireless licenses in Australia due to developments that affected potential strategic alternatives for using the spectrum.The impairment loss recognized was the difference between the assets’ carrying values and their estimated fair values.
All of the Company’s purchased intangible assets other than goodwill are subject to amortization. Amortization expense from continuing operations for fiscal 2004, 2003and 2002 was $17 million, $18 million and $14 million, respectively. Amortization expense related to these intangible assets is expected to be $14 million in fiscal 2005,$14 million in fiscal 2006, $13 million in fiscal 2007, $9 million in fiscal 2008 and $8 million in fiscal 2009.
Capitalized software development costs, which are included in other assets, were $44 million and $36 million at September 30, 2004 and 2003, respectively. Accumulatedamortization on capitalized software was $39 million and $26 million at September 30, 2004 and 2003, respectively. Amortization expense from continuing operations relatedto capitalized software for fiscal 2004, 2003 and 2002 was $13 million, $12 million and $10 million, respectively.
Note 4. Investments in Other Entities
Inquam Limited
The Company has invested $200 million in the convertible preferred shares of Inquam Limited (Inquam) for an approximate 42% ownership interest in Inquam. Inquamowns, develops and manages wireless communications systems, either directly or indirectly, with the intent of deploying CDMA-based technology, primarily in Europe.Starting in the third quarter of fiscal 2003, the Company and another investor (the Other Investor) also extended $117 million in bridge loan financings to Inquam, including$31 million in bridge loan funding put in place during fiscal 2004. The Company funded its approximate $58 million share of these bridge loans and had no remainingfunding commitment at September 30, 2004. Inquam is a variable interest entity. The Company does not consolidate Inquam because it is not the primary beneficiary. TheCompany uses the equity method to account for its investment in Inquam. The Company recorded $59 million, $99 million and $45 million in equity in losses of Inquamduring fiscal 2004, 2003 and 2002, respectively. At September 30, 2004 and 2003, the Company’s equity and debt investments in Inquam totaled $42 million and $68 million,net of equity in losses, respectively. The carrying amount of the Company’s investment in Inquam exceeded its underlying equity in the net assets of Inquam by $8 millionand $9 million, at September 30, 2004 and 2003, respectively.
F-21
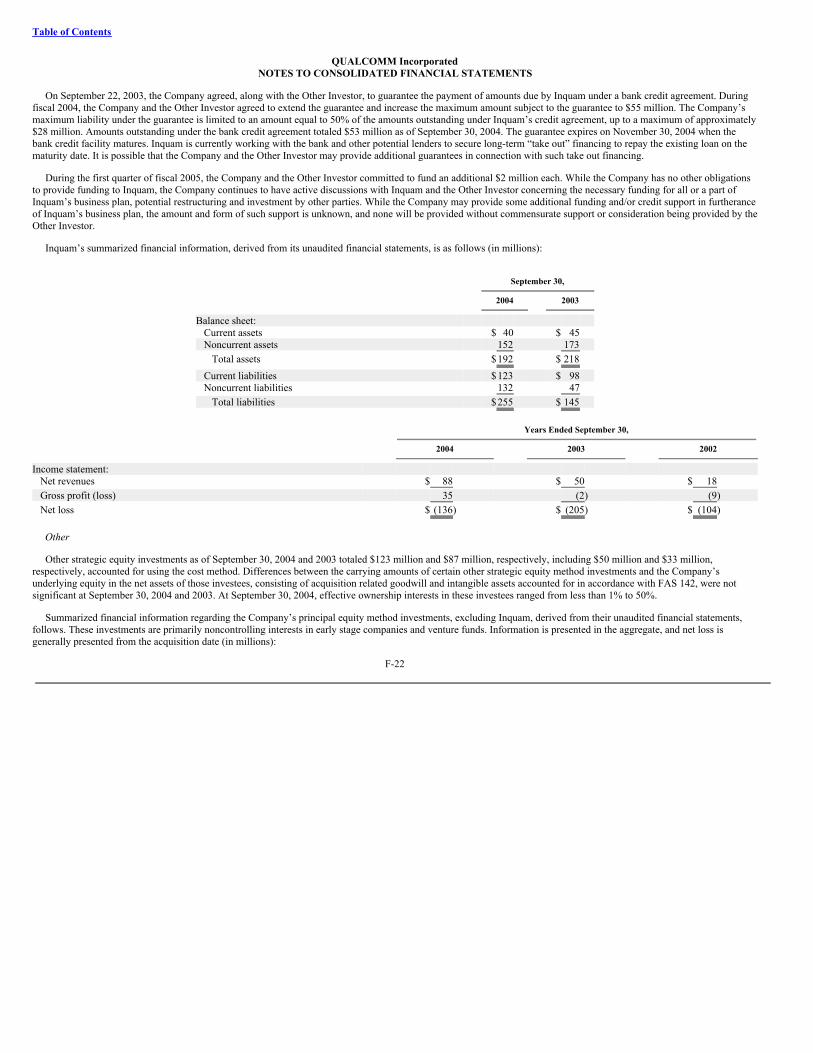
Table of Contents
QUALCOMM IncorporatedNOTES TO CONSOLIDATED FINANCIAL STATEMENTS
On September 22, 2003, the Company agreed, along with the Other Investor, to guarantee the payment of amounts due by Inquam under a bank credit agreement. Duringfiscal 2004, the Company and the Other Investor agreed to extend the guarantee and increase the maximum amount subject to the guarantee to $55 million. The Company’smaximum liability under the guarantee is limited to an amount equal to 50% of the amounts outstanding under Inquam’s credit agreement, up to a maximum of approximately$28 million. Amounts outstanding under the bank credit agreement totaled $53 million as of September 30, 2004. The guarantee expires on November 30, 2004 when thebank credit facility matures. Inquam is currently working with the bank and other potential lenders to secure long-term “take out” financing to repay the existing loan on thematurity date. It is possible that the Company and the Other Investor may provide additional guarantees in connection with such take out financing.
During the first quarter of fiscal 2005, the Company and the Other Investor committed to fund an additional $2 million each. While the Company has no other obligationsto provide funding to Inquam, the Company continues to have active discussions with Inquam and the Other Investor concerning the necessary funding for all or a part ofInquam’s business plan, potential restructuring and investment by other parties. While the Company may provide some additional funding and/or credit support in furtheranceof Inquam’s business plan, the amount and form of such support is unknown, and none will be provided without commensurate support or consideration being provided by theOther Investor.
Inquam’s summarized financial information, derived from its unaudited financial statements, is as follows (in millions):
September 30,
2004
2003
Balance sheet: Current assets $ 40 $ 45 Noncurrent assets 152 173
Total assets $192 $ 218 Current liabilities $123 $ 98 Noncurrent liabilities 132 47
Total liabilities $255 $ 145
Years Ended September 30,
2004
2003
2002
Income statement: Net revenues $ 88 $ 50 $ 18 Gross profit (loss) 35 (2) (9)Net loss $ (136) $ (205) $ (104)
Other
Other strategic equity investments as of September 30, 2004 and 2003 totaled $123 million and $87 million, respectively, including $50 million and $33 million,respectively, accounted for using the cost method. Differences between the carrying amounts of certain other strategic equity method investments and the Company’sunderlying equity in the net assets of those investees, consisting of acquisition related goodwill and intangible assets accounted for in accordance with FAS 142, were notsignificant at September 30, 2004 and 2003. At September 30, 2004, effective ownership interests in these investees ranged from less than 1% to 50%.
Summarized financial information regarding the Company’s principal equity method investments, excluding Inquam, derived from their unaudited financial statements,follows. These investments are primarily noncontrolling interests in early stage companies and venture funds. Information is presented in the aggregate, and net loss isgenerally presented from the acquisition date (in millions):
F-22
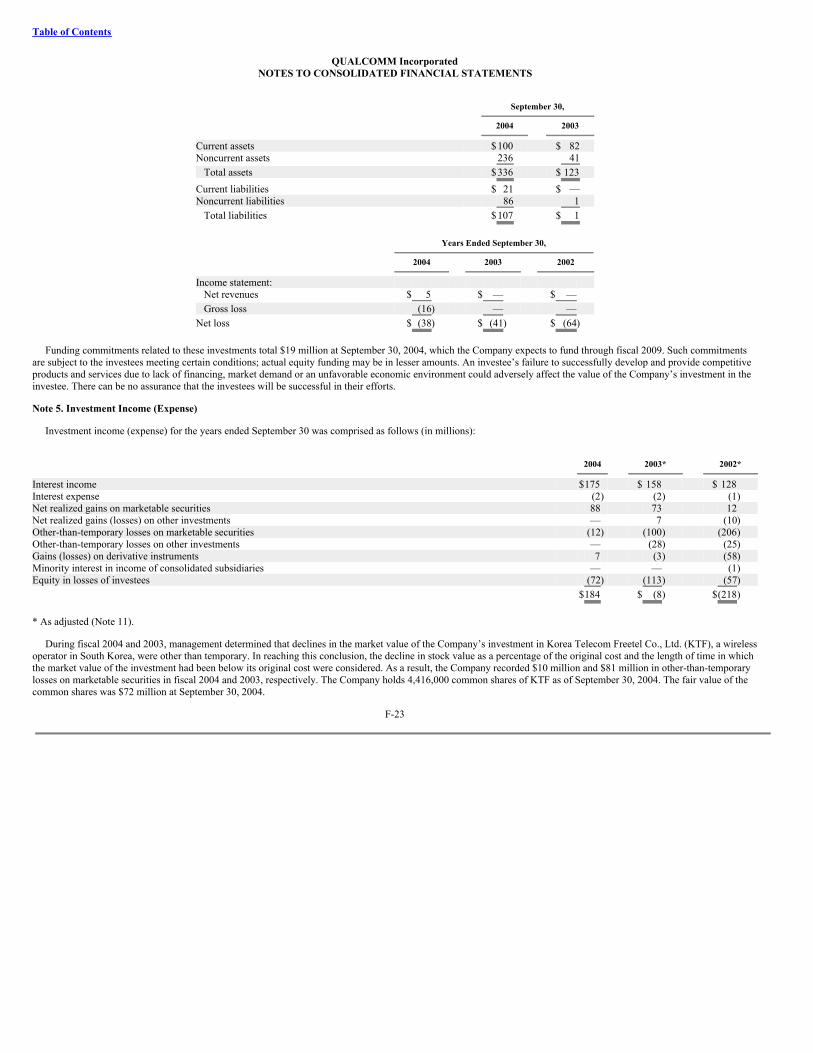
Table of Contents
QUALCOMM IncorporatedNOTES TO CONSOLIDATED FINANCIAL STATEMENTS
September 30,
2004
2003
Current assets $100 $ 82 Noncurrent assets 236 41
Total assets $336 $ 123 Current liabilities $ 21 $ — Noncurrent liabilities 86 1
Total liabilities $107 $ 1
Years Ended September 30,
2004
2003
2002
Income statement: Net revenues $ 5 $ — $ — Gross loss (16) — —
Net loss $ (38) $ (41) $ (64)
Funding commitments related to these investments total $19 million at September 30, 2004, which the Company expects to fund through fiscal 2009. Such commitmentsare subject to the investees meeting certain conditions; actual equity funding may be in lesser amounts. An investee’s failure to successfully develop and provide competitiveproducts and services due to lack of financing, market demand or an unfavorable economic environment could adversely affect the value of the Company’s investment in theinvestee. There can be no assurance that the investees will be successful in their efforts.
Note 5. Investment Income (Expense)
Investment income (expense) for the years ended September 30 was comprised as follows (in millions):
2004
2003*
2002*
Interest income $175 $ 158 $ 128 Interest expense (2) (2) (1)Net realized gains on marketable securities 88 73 12 Net realized gains (losses) on other investments — 7 (10)Other-than-temporary losses on marketable securities (12) (100) (206)Other-than-temporary losses on other investments — (28) (25)Gains (losses) on derivative instruments 7 (3) (58)Minority interest in income of consolidated subsidiaries — — (1)Equity in losses of investees (72) (113) (57) $184 $ (8) $(218)
* As adjusted (Note 11).
During fiscal 2004 and 2003, management determined that declines in the market value of the Company’s investment in Korea Telecom Freetel Co., Ltd. (KTF), a wirelessoperator in South Korea, were other than temporary. In reaching this conclusion, the decline in stock value as a percentage of the original cost and the length of time in whichthe market value of the investment had been below its original cost were considered. As a result, the Company recorded $10 million and $81 million in other-than-temporarylosses on marketable securities in fiscal 2004 and 2003, respectively. The Company holds 4,416,000 common shares of KTF as of September 30, 2004. The fair value of thecommon shares was $72 million at September 30, 2004.
F-23
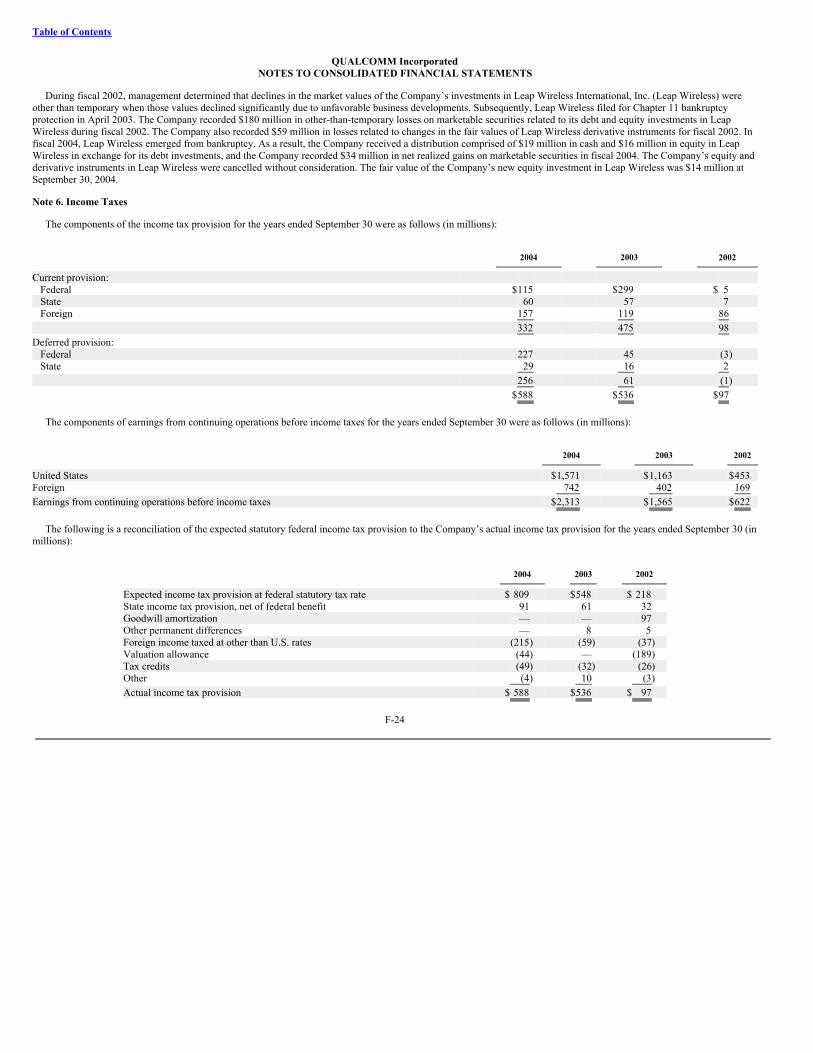
Table of Contents
QUALCOMM IncorporatedNOTES TO CONSOLIDATED FINANCIAL STATEMENTS
During fiscal 2002, management determined that declines in the market values of the Company’s investments in Leap Wireless International, Inc. (Leap Wireless) wereother than temporary when those values declined significantly due to unfavorable business developments. Subsequently, Leap Wireless filed for Chapter 11 bankruptcyprotection in April 2003. The Company recorded $180 million in other-than-temporary losses on marketable securities related to its debt and equity investments in LeapWireless during fiscal 2002. The Company also recorded $59 million in losses related to changes in the fair values of Leap Wireless derivative instruments for fiscal 2002. Infiscal 2004, Leap Wireless emerged from bankruptcy. As a result, the Company received a distribution comprised of $19 million in cash and $16 million in equity in LeapWireless in exchange for its debt investments, and the Company recorded $34 million in net realized gains on marketable securities in fiscal 2004. The Company’s equity andderivative instruments in Leap Wireless were cancelled without consideration. The fair value of the Company’s new equity investment in Leap Wireless was $14 million atSeptember 30, 2004.
Note 6. Income Taxes
The components of the income tax provision for the years ended September 30 were as follows (in millions):
2004
2003
2002
Current provision: Federal $115 $299 $ 5 State 60 57 7 Foreign 157 119 86
332 475 98 Deferred provision:
Federal 227 45 (3)State 29 16 2
256 61 (1) $588 $536 $97
The components of earnings from continuing operations before income taxes for the years ended September 30 were as follows (in millions):
2004
2003
2002
United States $1,571 $1,163 $453 Foreign 742 402 169 Earnings from continuing operations before income taxes $2,313 $1,565 $622
The following is a reconciliation of the expected statutory federal income tax provision to the Company’s actual income tax provision for the years ended September 30 (inmillions):
2004
2003
2002
Expected income tax provision at federal statutory tax rate $ 809 $548 $ 218 State income tax provision, net of federal benefit 91 61 32 Goodwill amortization — — 97 Other permanent differences — 8 5 Foreign income taxed at other than U.S. rates (215) (59) (37)Valuation allowance (44) — (189)Tax credits (49) (32) (26)Other (4) 10 (3)Actual income tax provision $ 588 $536 $ 97
F-24
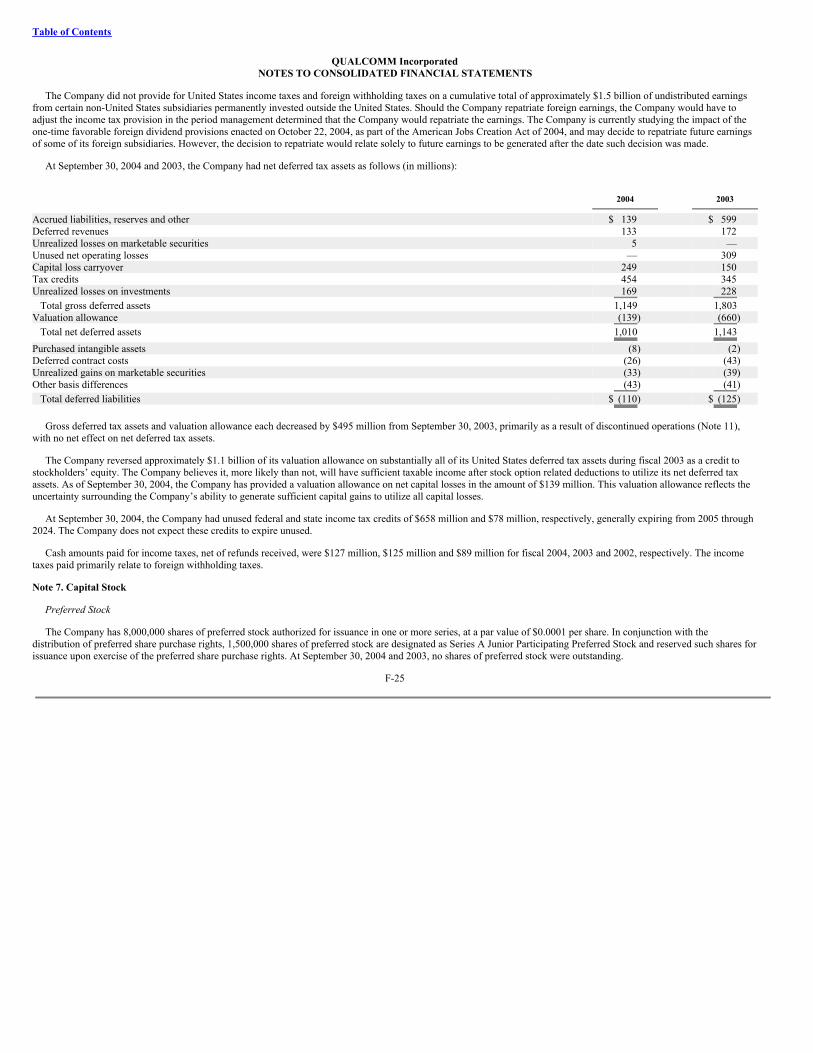
Table of Contents
QUALCOMM IncorporatedNOTES TO CONSOLIDATED FINANCIAL STATEMENTS
The Company did not provide for United States income taxes and foreign withholding taxes on a cumulative total of approximately $1.5 billion of undistributed earningsfrom certain non-United States subsidiaries permanently invested outside the United States. Should the Company repatriate foreign earnings, the Company would have toadjust the income tax provision in the period management determined that the Company would repatriate the earnings. The Company is currently studying the impact of theone-time favorable foreign dividend provisions enacted on October 22, 2004, as part of the American Jobs Creation Act of 2004, and may decide to repatriate future earningsof some of its foreign subsidiaries. However, the decision to repatriate would relate solely to future earnings to be generated after the date such decision was made.
At September 30, 2004 and 2003, the Company had net deferred tax assets as follows (in millions):
2004
2003
Accrued liabilities, reserves and other $ 139 $ 599 Deferred revenues 133 172 Unrealized losses on marketable securities 5 — Unused net operating losses — 309 Capital loss carryover 249 150 Tax credits 454 345 Unrealized losses on investments 169 228
Total gross deferred assets 1,149 1,803 Valuation allowance (139) (660)
Total net deferred assets 1,010 1,143 Purchased intangible assets (8) (2)Deferred contract costs (26) (43)Unrealized gains on marketable securities (33) (39)Other basis differences (43) (41)
Total deferred liabilities $ (110) $ (125)
Gross deferred tax assets and valuation allowance each decreased by $495 million from September 30, 2003, primarily as a result of discontinued operations (Note 11),with no net effect on net deferred tax assets.
The Company reversed approximately $1.1 billion of its valuation allowance on substantially all of its United States deferred tax assets during fiscal 2003 as a credit tostockholders’ equity. The Company believes it, more likely than not, will have sufficient taxable income after stock option related deductions to utilize its net deferred taxassets. As of September 30, 2004, the Company has provided a valuation allowance on net capital losses in the amount of $139 million. This valuation allowance reflects theuncertainty surrounding the Company’s ability to generate sufficient capital gains to utilize all capital losses.
At September 30, 2004, the Company had unused federal and state income tax credits of $658 million and $78 million, respectively, generally expiring from 2005 through2024. The Company does not expect these credits to expire unused.
Cash amounts paid for income taxes, net of refunds received, were $127 million, $125 million and $89 million for fiscal 2004, 2003 and 2002, respectively. The incometaxes paid primarily relate to foreign withholding taxes.
Note 7. Capital Stock
Preferred Stock
The Company has 8,000,000 shares of preferred stock authorized for issuance in one or more series, at a par value of $0.0001 per share. In conjunction with thedistribution of preferred share purchase rights, 1,500,000 shares of preferred stock are designated as Series A Junior Participating Preferred Stock and reserved such shares forissuance upon exercise of the preferred share purchase rights. At September 30, 2004 and 2003, no shares of preferred stock were outstanding.
F-25
Table of Contents
QUALCOMM IncorporatedNOTES TO CONSOLIDATED FINANCIAL STATEMENTS
Preferred Share Purchase Rights Plan
The Company has a Preferred Share Purchase Rights Plan (Rights Plan) to protect stockholders’ rights in the event of a proposed takeover of the Company. Under theRights Plan, the Company declared a dividend of one preferred share purchase right (a Right) for each share of the Company’s common stock outstanding. Pursuant to theRights Plan, each Right entitles the registered holder to purchase from the Company a one one-hundredth share of Series A Junior Participating Preferred Stock, $0.0001 parvalue per share, subject to adjustment for subsequent stock splits, at a purchase price of $250. In November 1999, the Rights Plan was amended to provide that the purchaseprice be set at $400. The Rights are exercisable only if a person or group (an Acquiring Person) acquires beneficial ownership of 15% or more of the Company’s outstandingshares of common stock. Upon exercise, holders, other than an Acquiring Person, will have the right, subject to termination, to receive the Company’s common stock or othersecurities, cash or other assets having a market value, as defined, equal to twice such purchase price. The Rights, which expire on September 25, 2005, are redeemable inwhole, but not in part, at the Company’s option at any time for a price of $0.005 per Right.
Stock Repurchase Program
On February 10, 2003, the Company authorized the expenditure of up to $1 billion to repurchase shares of the Company’s common stock over a two-year period. Duringfiscal 2003, the Company bought 9,830,000 shares at a net aggregate cost of $158 million. While the Company did not repurchase any of the Company’s common stock underthis program during fiscal 2004, the Company continues to evaluate repurchases under this program. At September 30, 2004, $834 million remains authorized for repurchasesunder the program. Repurchased shares are retired upon repurchase.
In connection with the Company’s stock repurchase program, the Company sold put options under three separate contracts with independent third parties during fiscal2004 that may have required the Company to purchase 3,000,000 shares of its common stock upon exercise. The Company accounted for the written put options inaccordance with Statement of Financial Standards No. 150 (FAS 150), “Accounting for Certain Financial Instruments with Characteristics of both Liabilities and Equity.” Inthe event the put options were exercised, the contracts required that the options be physically settled in cash. The Company determined that the put options should beclassified as liabilities in accordance with FAS 150. As such, the Company recorded the $5 million in premiums received as additions to other current liabilities, and changesin the fair values of the put options were recognized in the Company’s statement of operations. The Company repurchased all of the put options during fiscal 2004. The netgain recorded in investment income related to the put options, including premiums received, during fiscal 2004 was $5 million.
During fiscal 2003, the Company sold put options under three separate contracts with independent third parties that required the Company to purchase 3,000,000 shares ofits common stock upon exercise. All of these put options expired unexercised. The Company classified the put options as permanent equity in accordance with EmergingIssues Task Force Issue No. 00-19, “Accounting for Derivative Financial Instruments Indexed to, and Potentially Settled in, a Company’s Own Stock,” which wassubsequently amended by FAS 150. As such, the Company recorded the $7 million in premiums received as paid-in capital.
Dividends
On February 11, 2003, the Company announced its first common stock dividend of $0.025 per share. On July 16, 2003, the Company announced an increase in itsquarterly dividend from $0.025 to $0.035 per share on common stock. On March 2, 2004, the Company announced an increase in its quarterly dividend from $0.035 to$0.050 per share on common stock. On July 13, 2004, the Company announced an increase in its quarterly dividend from $0.050 to $0.070 per share on common stock. Cashdividends announced in fiscal 2004 and 2003 were as follows (in millions, except per share data):
F-26
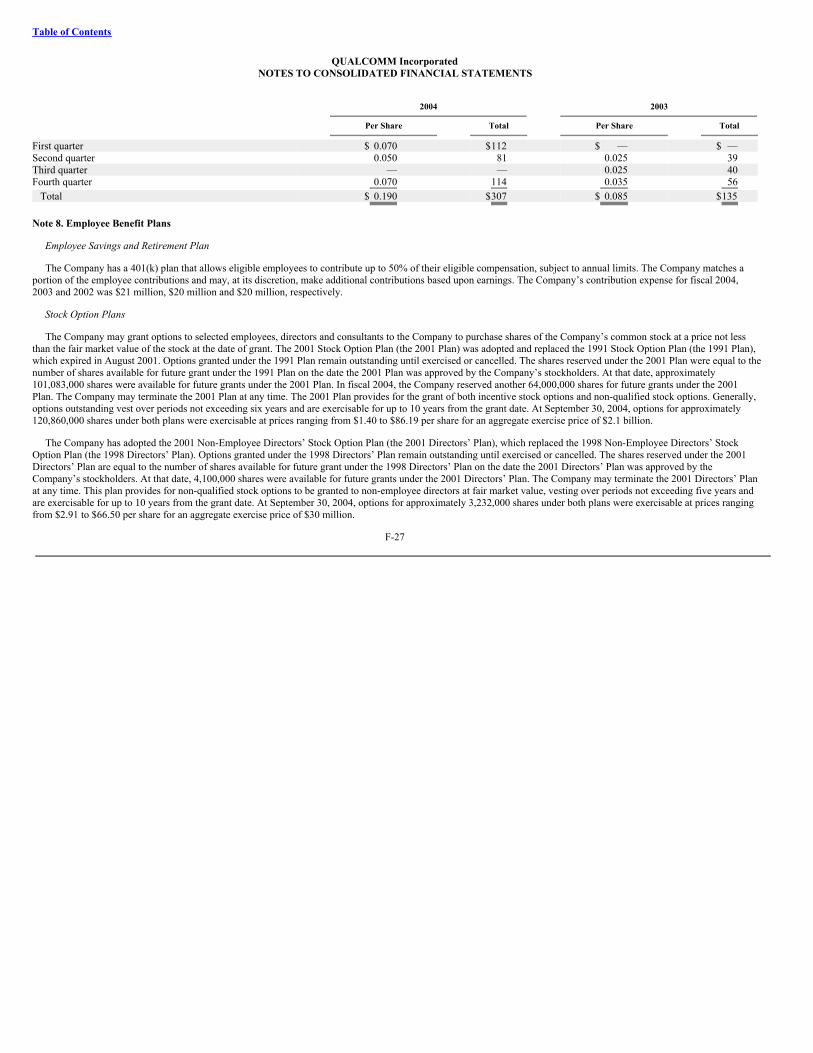
Table of Contents
QUALCOMM IncorporatedNOTES TO CONSOLIDATED FINANCIAL STATEMENTS
2004
2003
Per Share
Total
Per Share
Total
First quarter $ 0.070 $112 $ — $ — Second quarter 0.050 81 0.025 39 Third quarter — — 0.025 40 Fourth quarter 0.070 114 0.035 56
Total $ 0.190 $307 $ 0.085 $135
Note 8. Employee Benefit Plans
Employee Savings and Retirement Plan
The Company has a 401(k) plan that allows eligible employees to contribute up to 50% of their eligible compensation, subject to annual limits. The Company matches aportion of the employee contributions and may, at its discretion, make additional contributions based upon earnings. The Company’s contribution expense for fiscal 2004,2003 and 2002 was $21 million, $20 million and $20 million, respectively.
Stock Option Plans
The Company may grant options to selected employees, directors and consultants to the Company to purchase shares of the Company’s common stock at a price not lessthan the fair market value of the stock at the date of grant. The 2001 Stock Option Plan (the 2001 Plan) was adopted and replaced the 1991 Stock Option Plan (the 1991 Plan),which expired in August 2001. Options granted under the 1991 Plan remain outstanding until exercised or cancelled. The shares reserved under the 2001 Plan were equal to thenumber of shares available for future grant under the 1991 Plan on the date the 2001 Plan was approved by the Company’s stockholders. At that date, approximately101,083,000 shares were available for future grants under the 2001 Plan. In fiscal 2004, the Company reserved another 64,000,000 shares for future grants under the 2001Plan. The Company may terminate the 2001 Plan at any time. The 2001 Plan provides for the grant of both incentive stock options and non-qualified stock options. Generally,options outstanding vest over periods not exceeding six years and are exercisable for up to 10 years from the grant date. At September 30, 2004, options for approximately120,860,000 shares under both plans were exercisable at prices ranging from $1.40 to $86.19 per share for an aggregate exercise price of $2.1 billion.
The Company has adopted the 2001 Non-Employee Directors’ Stock Option Plan (the 2001 Directors’ Plan), which replaced the 1998 Non-Employee Directors’ StockOption Plan (the 1998 Directors’ Plan). Options granted under the 1998 Directors’ Plan remain outstanding until exercised or cancelled. The shares reserved under the 2001Directors’ Plan are equal to the number of shares available for future grant under the 1998 Directors’ Plan on the date the 2001 Directors’ Plan was approved by theCompany’s stockholders. At that date, 4,100,000 shares were available for future grants under the 2001 Directors’ Plan. The Company may terminate the 2001 Directors’ Planat any time. This plan provides for non-qualified stock options to be granted to non-employee directors at fair market value, vesting over periods not exceeding five years andare exercisable for up to 10 years from the grant date. At September 30, 2004, options for approximately 3,232,000 shares under both plans were exercisable at prices rangingfrom $2.91 to $66.50 per share for an aggregate exercise price of $30 million.
F-27
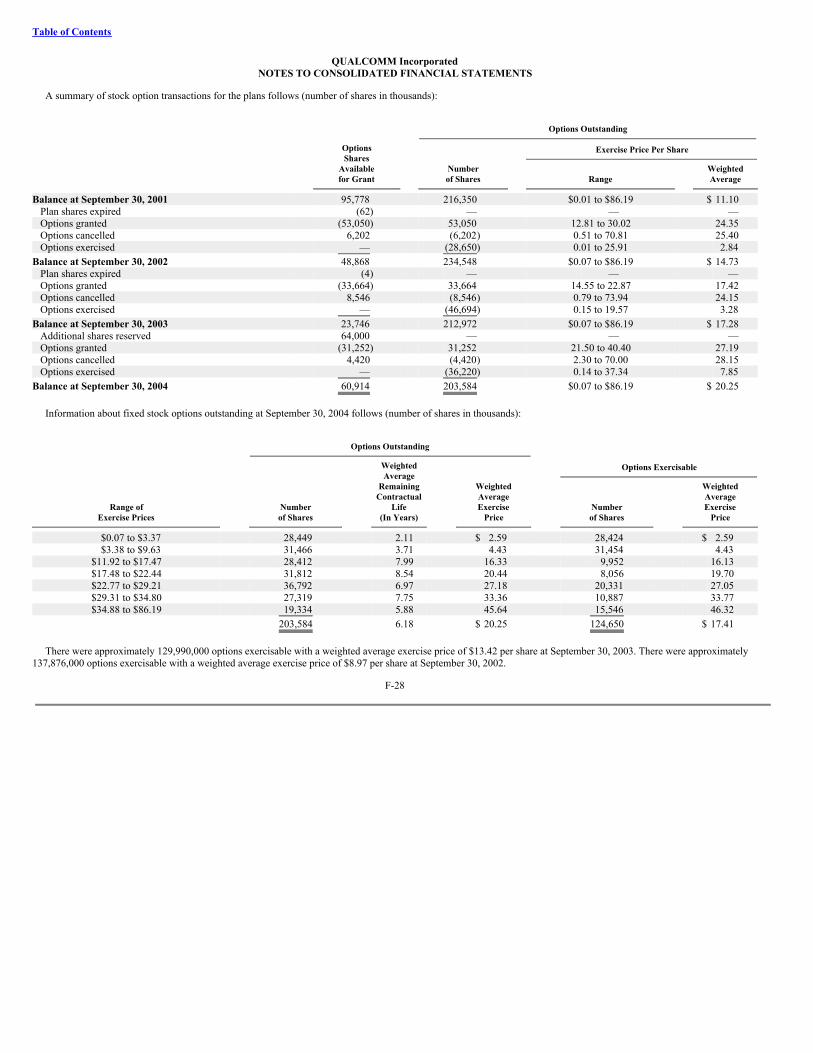
Table of Contents
QUALCOMM IncorporatedNOTES TO CONSOLIDATED FINANCIAL STATEMENTS
A summary of stock option transactions for the plans follows (number of shares in thousands):
Options Outstanding
OptionsShares
Exercise Price Per Share
Available Number Weighted
for Grant
of Shares
Range
Average
Balance at September 30, 2001 95,778 216,350 $0.01 to $86.19 $ 11.10 Plan shares expired (62) — — — Options granted (53,050) 53,050 12.81 to 30.02 24.35 Options cancelled 6,202 (6,202) 0.51 to 70.81 25.40 Options exercised — (28,650) 0.01 to 25.91 2.84
Balance at September 30, 2002 48,868 234,548 $0.07 to $86.19 $ 14.73 Plan shares expired (4) — — — Options granted (33,664) 33,664 14.55 to 22.87 17.42 Options cancelled 8,546 (8,546) 0.79 to 73.94 24.15 Options exercised — (46,694) 0.15 to 19.57 3.28
Balance at September 30, 2003 23,746 212,972 $0.07 to $86.19 $ 17.28 Additional shares reserved 64,000 — — — Options granted (31,252) 31,252 21.50 to 40.40 27.19 Options cancelled 4,420 (4,420) 2.30 to 70.00 28.15 Options exercised — (36,220) 0.14 to 37.34 7.85
Balance at September 30, 2004 60,914 203,584 $0.07 to $86.19 $ 20.25
Information about fixed stock options outstanding at September 30, 2004 follows (number of shares in thousands):
Options Outstanding
WeightedAverage
Options Exercisable
Remaining Weighted Weighted Contractual Average Average
Range of Number Life Exercise Number ExerciseExercise Prices
of Shares
(In Years)
Price
of Shares
Price
$0.07 to $3.37 28,449 2.11 $ 2.59 28,424 $ 2.59 $3.38 to $9.63 31,466 3.71 4.43 31,454 4.43
$11.92 to $17.47 28,412 7.99 16.33 9,952 16.13 $17.48 to $22.44 31,812 8.54 20.44 8,056 19.70 $22.77 to $29.21 36,792 6.97 27.18 20,331 27.05 $29.31 to $34.80 27,319 7.75 33.36 10,887 33.77 $34.88 to $86.19 19,334 5.88 45.64 15,546 46.32
203,584 6.18 $ 20.25 124,650 $ 17.41
There were approximately 129,990,000 options exercisable with a weighted average exercise price of $13.42 per share at September 30, 2003. There were approximately137,876,000 options exercisable with a weighted average exercise price of $8.97 per share at September 30, 2002.
F-28
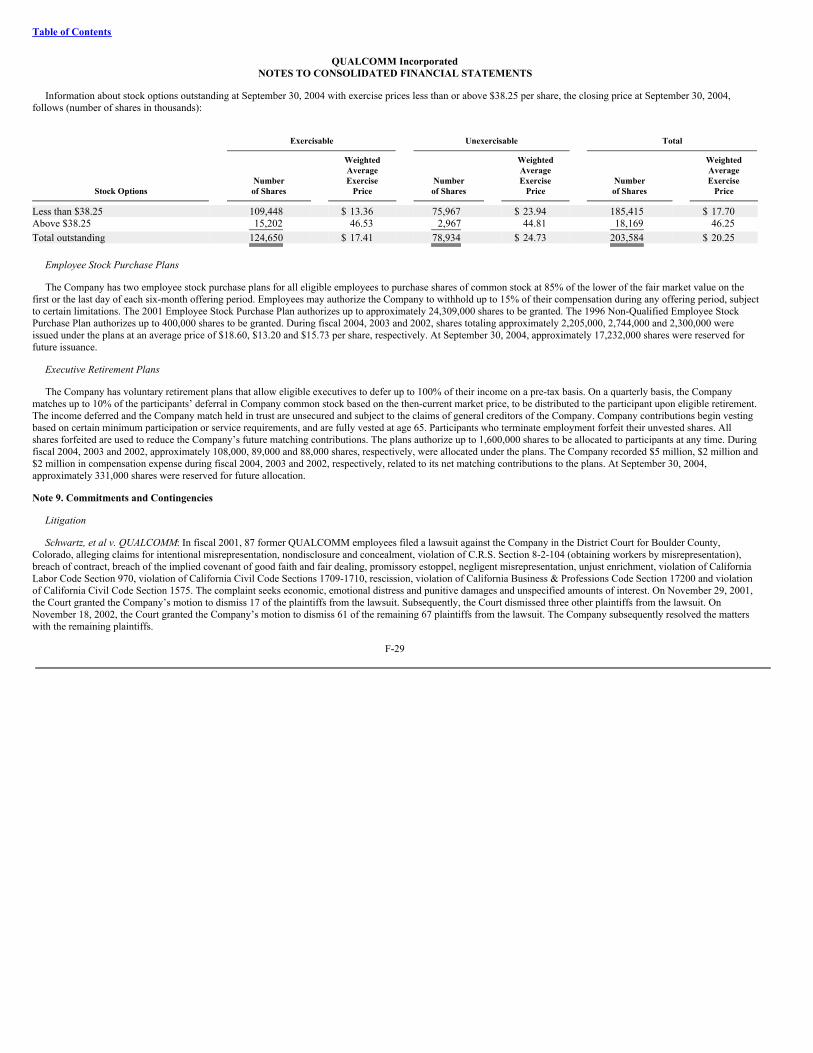
Table of Contents
QUALCOMM IncorporatedNOTES TO CONSOLIDATED FINANCIAL STATEMENTS
Information about stock options outstanding at September 30, 2004 with exercise prices less than or above $38.25 per share, the closing price at September 30, 2004,follows (number of shares in thousands):
Exercisable
Unexercisable
Total
Weighted Weighted Weighted Average Average Average Number Exercise Number Exercise Number Exercise
Stock Options
of Shares
Price
of Shares
Price
of Shares
Price
Less than $38.25 109,448 $ 13.36 75,967 $ 23.94 185,415 $ 17.70 Above $38.25 15,202 46.53 2,967 44.81 18,169 46.25 Total outstanding 124,650 $ 17.41 78,934 $ 24.73 203,584 $ 20.25
Employee Stock Purchase Plans
The Company has two employee stock purchase plans for all eligible employees to purchase shares of common stock at 85% of the lower of the fair market value on thefirst or the last day of each six-month offering period. Employees may authorize the Company to withhold up to 15% of their compensation during any offering period, subjectto certain limitations. The 2001 Employee Stock Purchase Plan authorizes up to approximately 24,309,000 shares to be granted. The 1996 Non-Qualified Employee StockPurchase Plan authorizes up to 400,000 shares to be granted. During fiscal 2004, 2003 and 2002, shares totaling approximately 2,205,000, 2,744,000 and 2,300,000 wereissued under the plans at an average price of $18.60, $13.20 and $15.73 per share, respectively. At September 30, 2004, approximately 17,232,000 shares were reserved forfuture issuance.
Executive Retirement Plans
The Company has voluntary retirement plans that allow eligible executives to defer up to 100% of their income on a pre-tax basis. On a quarterly basis, the Companymatches up to 10% of the participants’ deferral in Company common stock based on the then-current market price, to be distributed to the participant upon eligible retirement.The income deferred and the Company match held in trust are unsecured and subject to the claims of general creditors of the Company. Company contributions begin vestingbased on certain minimum participation or service requirements, and are fully vested at age 65. Participants who terminate employment forfeit their unvested shares. Allshares forfeited are used to reduce the Company’s future matching contributions. The plans authorize up to 1,600,000 shares to be allocated to participants at any time. Duringfiscal 2004, 2003 and 2002, approximately 108,000, 89,000 and 88,000 shares, respectively, were allocated under the plans. The Company recorded $5 million, $2 million and$2 million in compensation expense during fiscal 2004, 2003 and 2002, respectively, related to its net matching contributions to the plans. At September 30, 2004,approximately 331,000 shares were reserved for future allocation.
Note 9. Commitments and Contingencies
Litigation
Schwartz, et al v. QUALCOMM: In fiscal 2001, 87 former QUALCOMM employees filed a lawsuit against the Company in the District Court for Boulder County,Colorado, alleging claims for intentional misrepresentation, nondisclosure and concealment, violation of C.R.S. Section 8-2-104 (obtaining workers by misrepresentation),breach of contract, breach of the implied covenant of good faith and fair dealing, promissory estoppel, negligent misrepresentation, unjust enrichment, violation of CaliforniaLabor Code Section 970, violation of California Civil Code Sections 1709-1710, rescission, violation of California Business & Professions Code Section 17200 and violationof California Civil Code Section 1575. The complaint seeks economic, emotional distress and punitive damages and unspecified amounts of interest. On November 29, 2001,the Court granted the Company’s motion to dismiss 17 of the plaintiffs from the lawsuit. Subsequently, the Court dismissed three other plaintiffs from the lawsuit. OnNovember 18, 2002, the Court granted the Company’s motion to dismiss 61 of the remaining 67 plaintiffs from the lawsuit. The Company subsequently resolved the matterswith the remaining plaintiffs.
F-29

Table of Contents
QUALCOMM IncorporatedNOTES TO CONSOLIDATED FINANCIAL STATEMENTS
Those plaintiffs whose claims were dismissed have appealed. Oral argument on the appeal occurred on October 26, 2004, and no decision has been received.
Hanig et al. v. QUALCOMM, Boesel, et al v. QUALCOMM, Stone v. QUALCOMM, Ortiz et al v. QUALCOMM, Shannon et al. v. QUALCOMM, Deshon et al v.QUALCOMM, Earnhart et al. v. QUALCOMM: These cases, the first of which was filed in fiscal 2001, were filed in San Diego County Superior Court by over 100 formeremployees, alleging claims for declaratory relief, breach of contract, intentional/negligent fraud, concealment, rescission, specific performance, work, labor and services,breach of the implied covenant of good faith and fair dealing, violation of California Business & Professions Code Section 17200 and unjust enrichment, claiming that theywere entitled to full vesting of unvested stock options as a result of the sale of the Company’s infrastructure business to Ericsson in 1999. The Company has answered thecomplaints, which have been consolidated, and discovery is ongoing. On July 16, 2004, the Court granted the Company’s summary adjudication motion, dismissing plaintiffs’breach of contract claims.
Durante, et al v. QUALCOMM: On February 2, 2000, three former QUALCOMM employees filed a putative class action against the Company, ostensibly on behalf ofthemselves and those former employees of the Company whose employment was terminated in April 1999. Virtually all of the purported class of plaintiffs received severancepackages at the time of the termination of their employment, in exchange for a release of claims, other than federal age discrimination claims, against the Company. Thecomplaint was filed in California Superior Court in and for the County of Los Angeles and purports to state 10 causes of action including breach of contract, agediscrimination, violation of Labor Code Section 200, violation of Labor Code Section 970, unfair business practices, intentional infliction of emotional distress, unjustenrichment, breach of the covenant of good faith and fair dealing, declaratory relief and undue influence. The complaint seeks an order accelerating all unvested stock optionsfor the members of the class, plus economic and liquidated damages of an unspecified amount. On June 27, 2000, the case was ordered transferred from Los Angeles CountySuperior Court to San Diego County Superior Court. On July 3, 2000, the Company removed the case to the United States District Court for the Southern District ofCalifornia, and discovery commenced. On May 29, 2001, the Court dismissed all plaintiffs’ claims except for claims arising under the federal Age Discrimination inEmployment Act. On July 16, 2001, the Court granted conditional class certification on the remaining claims, to be revisited by the Court at the end of the discovery period.On April 15, 2003, the Court granted the Company’s summary judgment motions as to all remaining class members’ disparate impact claims. On June 18, 2003, the Courtordered decertification of the class and dismissed the remaining claims of the opt-in plaintiffs without prejudice. Plaintiffs have filed an appeal. On June 20, 2003, 76 of theopt-in plaintiffs filed an action in Federal District Court for the Southern District of California, alleging violations of the Age Discrimination in Employment Act as a result oftheir layoffs in 1999. To date, the complaint has not been served.
Zoltar Satellite Alarm Systems, Inc. v. QUALCOMM, Inc. and SnapTrack, Inc.: On March 30, 2001, Zoltar Satellite Alarm Systems, Inc. (Zoltar) filed suit againstQUALCOMM and SnapTrack, Inc. (SnapTrack), a QUALCOMM wholly-owned subsidiary, in the United States District Court for the Northern District of California seekingdamages and injunctive relief and alleging infringement of three patents. On August 27, 2001, Zoltar filed an amended complaint adding Sprint Corp. as a named defendantand narrowing certain infringement claims against QUALCOMM and SnapTrack. Since then, Zoltar has dismissed Sprint Corp. as a defendant. Trial of this mattercommenced on February 24, 2004. On March 25, 2004, the jury reached a unanimous verdict of no infringement in favor of the Company and SnapTrack on six of the sevenpatent claims asserted by Zoltar. On July 26, 2004, the Court found no infringement on the remaining patent claim asserted by Zoltar and entered a judgment in favor of theCompany and SnapTrack on Zoltar’s complaint and awarded the Company and SnapTrack their costs of suit. Zoltar has noticed an appeal and the Company and SnapTrackhave filed a responsive notice.
Texas Instruments Incorporated v. QUALCOMM Incorporated: On July 25, 2003, the Company filed an action in Delaware Superior Court against Texas InstrumentsIncorporated for breach of a patent portfolio license agreement between the parties, seeking damages and other relief. On September 23, 2003, Texas Instruments filed anaction in Delaware Chancery Court against the Company alleging breach of the same agreement, seeking damages and other relief. The Company has since dismissed its casein Superior Court and refiled its claims as part of the action in the Chancery Court. In a written order dated July 14, 2004, the Court granted QUALCOMM’s summaryjudgment motion, dismissing all of Texas Instruments’ claims against QUALCOMM. In addition, the Court ruled that Texas Instruments had breached the patent portfoliolicense agreement, though the breach was non-material, and
F-30

Table of Contents
QUALCOMM IncorporatedNOTES TO CONSOLIDATED FINANCIAL STATEMENTS
therefore Texas Instruments’ license under the agreement would not be forfeited. The Court held a one-day bench trial on August 16, 2004, on the Company’s claim thatTexas Instruments breached the agreement between the parties by pursuing the claims previously dismissed by the Court. Although the Court had already found that theclaims brought by Texas Instruments were barred by the agreement, the Court declined to find that bringing the claims constituted a breach of the agreement by TexasInstruments and, therefore, found against the Company on the sole remaining claim in the case. On October 22, 2004, the Company filed a notice of appeal.
QUALCOMM Incorporated v. Conexant Systems, Inc. and Skyworks Solutions Inc.: On October 8, 2002, the Company filed an action in the United States District Courtfor the Southern District of California against Conexant and Skyworks alleging infringement of five patents and misappropriation of trade secrets and seeking damages andinjunctive relief. On December 4, 2003, Skyworks answered and counterclaimed against QUALCOMM, alleging infringement of four patents and misappropriation of tradesecrets and seeking damages and injunctive relief. On April 30, 2004, the Court granted the Company’s motion to dismiss defendants’ inequitable conduct affirmativedefenses and counterclaims. The Company filed an amended complaint on June 16, 2004, bringing the total number of the Company’s patents at issue to eight and maintainingthe trade secret misappropriation claim. On July 16 and 20, 2004, Conexant and Skyworks answered the Company’s amended complaint, reasserted claims based on allegedtrade secret misappropriation and patent infringement and Skyworks also asserted counterclaims alleging violations of antitrust laws and unfair business practices. Conexantand Skyworks seek damages and other forms of relief. On September 21, 2004, the Company moved to stay the Skyworks antitrust and related counterclaims. That motion ispending. The Company believes the counterclaims are without merit. Claim construction hearings relating to the patents in the case are under way. Discovery in the matter iscontinuing.
QUALCOMM Incorporated v. Maxim Integrated Products, Inc.: On December 2, 2002, the Company filed an action in the United States District Court for the SouthernDistrict of California against Maxim Integrated Products, Inc. (Maxim) alleging infringement of three patents and seeking damages and injunctive relief. The Company hassince amended the complaint, bringing the total number of patents at issue to four. On May 5, 2004, the Court granted Maxim’s motion that no indirect infringement arose inconnection with defendants’ sales of certain products to certain licensees of the Company. On June 21, 2004, the Court granted the Company’s motion to stay all of Maxim’santitrust counterclaims and its patent misuse defense. On July 9, 2004, Maxim filed an Answer and Counterclaims to the Company’s Third Amended Complaint. Maxim’samended counterclaims allege violation of antitrust laws and unfair business practices and seek damages and other relief. The Company believes the amended counterclaimsare without merit and, if and when the Court’s stay is lifted, the Company will seek dismissal of those counterclaims as a matter of law. Claim construction hearings relating tothe patents in the case are under way. Discovery in the matter is continuing.
Other: The Company has been named, along with many other manufacturers of wireless phones, wireless operators and industry-related organizations, as a defendant inpurported class action lawsuits (In re Wireless Telephone Frequency Emissions Products Liability Litigation, United States District Court for the District of Maryland), and inseveral individually filed actions, seeking personal injury, economic and/or punitive damages arising out of its sale of cellular phones. On March 5, 2003, the Court grantedthe defendants motions to dismiss five of the consolidated cases (Pinney, Gimpleson, Gillian, Farina and Naquin) on the grounds that the claims were preempted by federallaw. On April 2, 2003, the plaintiffs filed a notice of appeal of this order and the Court’s order denying remand. All remaining cases filed against the Company allege personalinjury as a result of their use of a wireless telephone. Those cases have been remanded to the Washington, D.C. Superior Court. The courts that have reviewed similar claimsagainst other companies to date have held that there was insufficient scientific basis for the plaintiffs’ claims in those cases.
Although there can be no assurance that unfavorable outcomes in any of the foregoing matters would not have a material adverse effect on the Company’s operatingresults, liquidity or financial position, the Company believes the claims are without merit and will vigorously defend the actions. The Company has not recorded any accrualfor contingent liability associated with the legal proceedings described above based on the Company’s belief that a liability, while possible, is not probable. Further, anypossible range of loss cannot be estimated at this time. The Company is engaged in numerous other legal actions arising in the ordinary course of its business and believesthat the ultimate outcome of these actions will not have a material adverse effect on its operating results, liquidity or financial position.
F-31
Table of Contents
QUALCOMM IncorporatedNOTES TO CONSOLIDATED FINANCIAL STATEMENTS
Operating Leases
The Company leases certain of its facilities and equipment under noncancelable operating leases, with terms ranging from 2 to 10 years and with provisions for cost-of-living increases. Rental expense for fiscal 2004, 2003 and 2002 was $31 million, $34 million and $42 million, respectively. Future minimum lease payments in each of thenext five years from fiscal 2005 through 2009 are $45 million, $32 million, $20 million, $7 million and $4 million, respectively, and $3 million thereafter.
Purchase Obligations
The Company has agreements with suppliers and other parties to purchase inventory, other goods and services and long-lived assets and estimates its noncancelableobligations under these agreements to be approximately $885 million in fiscal 2005, $58 million in fiscal 2006, $2 million in fiscal 2007, $2 million in fiscal 2008 and$2 million in fiscal 2009. Of these amounts, commitments to purchase integrated circuit product inventories comprised $717 million in fiscal 2005 and $39 million in fiscal2006.
Letters of Credit and Other Financial Commitments
In addition to the financing commitments to Ericsson (Note 3) and the Inquam guarantee commitment (Note 4), the Company had $1 million of letters of credit outstandingas of September 30, 2004, none of which were collateralized.
Note 10. Segment Information
The Company is organized on the basis of products and services. The Company aggregates three of its divisions into the QUALCOMM Wireless & Internet segment.Reportable segments are as follows:
• QUALCOMM CDMA Technologies (QCT) – develops and supplies CDMA-based integrated circuits and system software for wireless voice and data communications,multimedia functions and global positioning systems products;
• QUALCOMM Technology Licensing (QTL) – grants licenses to use portions of the Company’s intellectual property portfolio, which includes certain patent rights
essential to or useful in the manufacture and sale of CDMA products, and collects license fees and royalties in partial consideration for such licenses;
• QUALCOMM Wireless & Internet (QWI) – comprised of:
o QUALCOMM Internet Services (QIS) — provides technology to support and accelerate the convergence of the wireless data market, including its BREW productand services, QChat and QPoint;
o QUALCOMM Government Technologies (QGOV) – formerly QUALCOMM Digital Media, provides development, hardware and analytical expertise to United
States government agencies involving wireless communications technologies. Through June 2004, the QGOV division also provided services for the DigitalCinema business, which the Company is no longer pursuing; and
o QUALCOMM Wireless Business Solutions (QWBS) - provides satellite and terrestrial-based two-way data messaging and position reporting services to
transportation companies, private fleets, construction equipment fleets and other enterprise companies.
• QUALCOMM Strategic Initiatives (QSI) — manages the Company’s strategic investment activities. QSI makes strategic investments to promote the worldwideadoption of CDMA products and services for wireless voice and Internet data communications.
As a result of the disposition of the remaining operations and assets related to the Vésper Operating Companies and TowerCo (Note 11), consolidated investees of QSI, theCompany determined that the results of operations related to the Vésper Operating Companies and TowerCo should be presented as discontinued operations. QSI
F-32
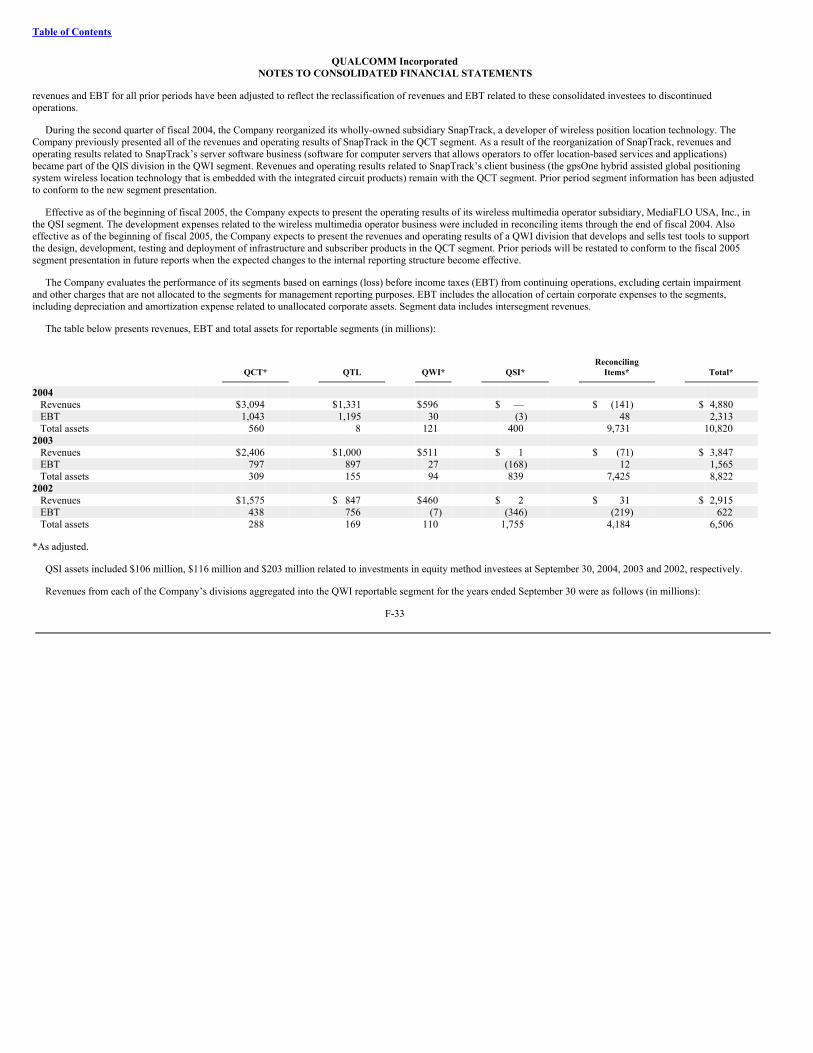
Table of Contents
QUALCOMM IncorporatedNOTES TO CONSOLIDATED FINANCIAL STATEMENTS
revenues and EBT for all prior periods have been adjusted to reflect the reclassification of revenues and EBT related to these consolidated investees to discontinuedoperations.
During the second quarter of fiscal 2004, the Company reorganized its wholly-owned subsidiary SnapTrack, a developer of wireless position location technology. TheCompany previously presented all of the revenues and operating results of SnapTrack in the QCT segment. As a result of the reorganization of SnapTrack, revenues andoperating results related to SnapTrack’s server software business (software for computer servers that allows operators to offer location-based services and applications)became part of the QIS division in the QWI segment. Revenues and operating results related to SnapTrack’s client business (the gpsOne hybrid assisted global positioningsystem wireless location technology that is embedded with the integrated circuit products) remain with the QCT segment. Prior period segment information has been adjustedto conform to the new segment presentation.
Effective as of the beginning of fiscal 2005, the Company expects to present the operating results of its wireless multimedia operator subsidiary, MediaFLO USA, Inc., inthe QSI segment. The development expenses related to the wireless multimedia operator business were included in reconciling items through the end of fiscal 2004. Alsoeffective as of the beginning of fiscal 2005, the Company expects to present the revenues and operating results of a QWI division that develops and sells test tools to supportthe design, development, testing and deployment of infrastructure and subscriber products in the QCT segment. Prior periods will be restated to conform to the fiscal 2005segment presentation in future reports when the expected changes to the internal reporting structure become effective.
The Company evaluates the performance of its segments based on earnings (loss) before income taxes (EBT) from continuing operations, excluding certain impairmentand other charges that are not allocated to the segments for management reporting purposes. EBT includes the allocation of certain corporate expenses to the segments,including depreciation and amortization expense related to unallocated corporate assets. Segment data includes intersegment revenues.
The table below presents revenues, EBT and total assets for reportable segments (in millions):
Reconciling
QCT*
QTL
QWI*
QSI*
Items*
Total*
2004 Revenues $3,094 $1,331 $596 $ — $ (141) $ 4,880 EBT 1,043 1,195 30 (3) 48 2,313 Total assets 560 8 121 400 9,731 10,820
2003 Revenues $2,406 $1,000 $511 $ 1 $ (71) $ 3,847 EBT 797 897 27 (168) 12 1,565 Total assets 309 155 94 839 7,425 8,822
2002 Revenues $1,575 $ 847 $460 $ 2 $ 31 $ 2,915 EBT 438 756 (7) (346) (219) 622 Total assets 288 169 110 1,755 4,184 6,506
*As adjusted.
QSI assets included $106 million, $116 million and $203 million related to investments in equity method investees at September 30, 2004, 2003 and 2002, respectively.
Revenues from each of the Company’s divisions aggregated into the QWI reportable segment for the years ended September 30 were as follows (in millions):
F-33
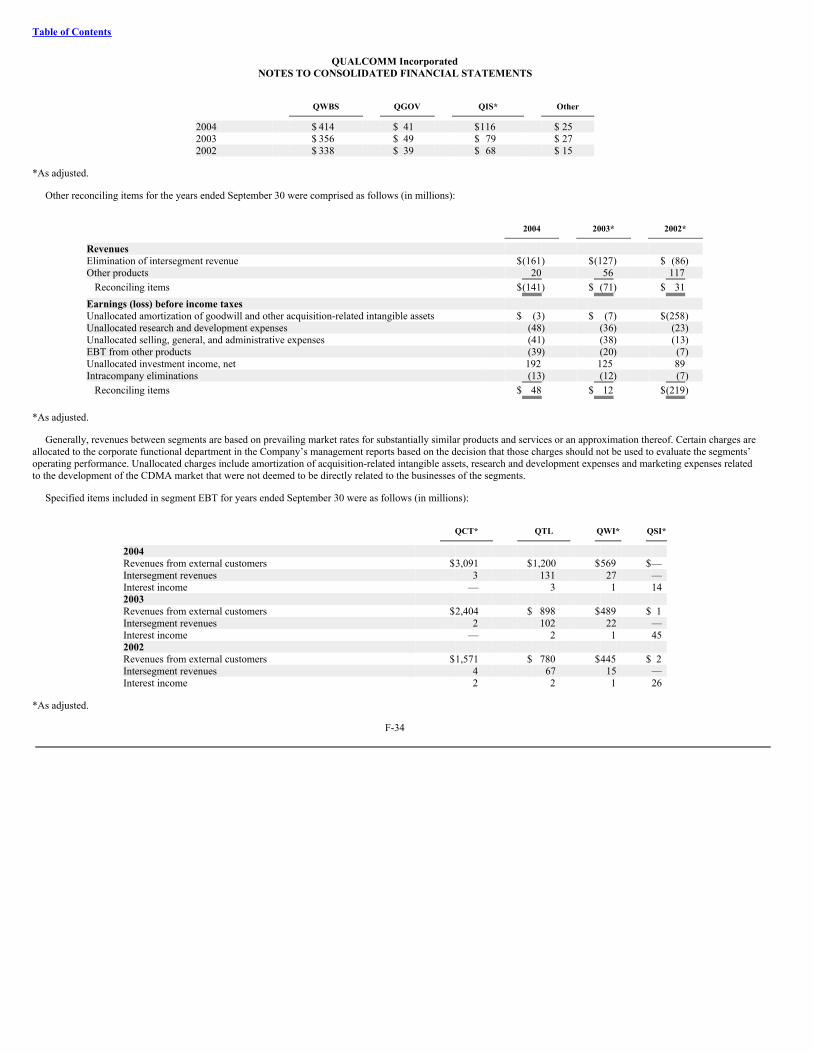
Table of Contents
QUALCOMM IncorporatedNOTES TO CONSOLIDATED FINANCIAL STATEMENTS
QWBS
QGOV
QIS*
Other
2004 $ 414 $ 41 $116 $ 25 2003 $ 356 $ 49 $ 79 $ 27 2002 $ 338 $ 39 $ 68 $ 15
*As adjusted.
Other reconciling items for the years ended September 30 were comprised as follows (in millions):
2004
2003*
2002*
Revenues Elimination of intersegment revenue $(161) $(127) $ (86)Other products 20 56 117
Reconciling items $(141) $ (71) $ 31 Earnings (loss) before income taxes Unallocated amortization of goodwill and other acquisition-related intangible assets $ (3) $ (7) $(258)Unallocated research and development expenses (48) (36) (23)Unallocated selling, general, and administrative expenses (41) (38) (13)EBT from other products (39) (20) (7)Unallocated investment income, net 192 125 89 Intracompany eliminations (13) (12) (7)
Reconciling items $ 48 $ 12 $(219)
*As adjusted.
Generally, revenues between segments are based on prevailing market rates for substantially similar products and services or an approximation thereof. Certain charges areallocated to the corporate functional department in the Company’s management reports based on the decision that those charges should not be used to evaluate the segments’operating performance. Unallocated charges include amortization of acquisition-related intangible assets, research and development expenses and marketing expenses relatedto the development of the CDMA market that were not deemed to be directly related to the businesses of the segments.
Specified items included in segment EBT for years ended September 30 were as follows (in millions):
QCT*
QTL
QWI*
QSI*
2004 Revenues from external customers $3,091 $1,200 $569 $— Intersegment revenues 3 131 27 — Interest income — 3 1 14 2003 Revenues from external customers $2,404 $ 898 $489 $ 1 Intersegment revenues 2 102 22 — Interest income — 2 1 45 2002 Revenues from external customers $1,571 $ 780 $445 $ 2 Intersegment revenues 4 67 15 — Interest income 2 2 1 26
*As adjusted.
F-34
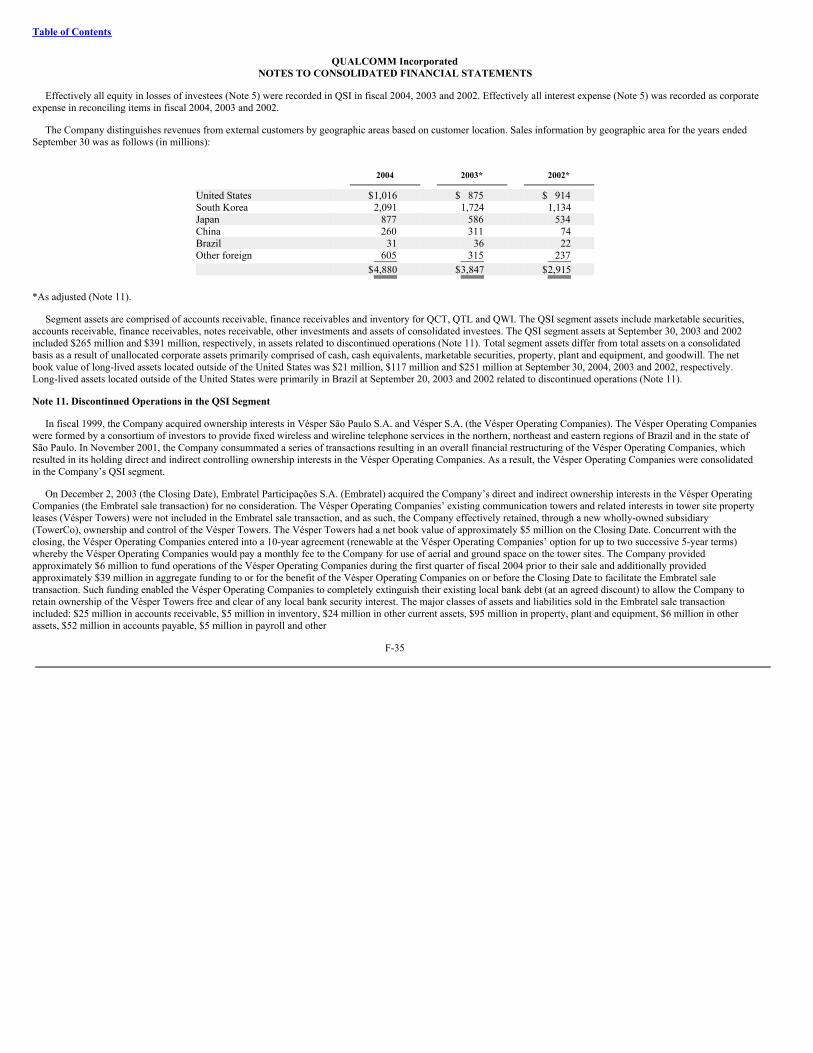
Table of Contents
QUALCOMM IncorporatedNOTES TO CONSOLIDATED FINANCIAL STATEMENTS
Effectively all equity in losses of investees (Note 5) were recorded in QSI in fiscal 2004, 2003 and 2002. Effectively all interest expense (Note 5) was recorded as corporateexpense in reconciling items in fiscal 2004, 2003 and 2002.
The Company distinguishes revenues from external customers by geographic areas based on customer location. Sales information by geographic area for the years endedSeptember 30 was as follows (in millions):
2004
2003*
2002*
United States $1,016 $ 875 $ 914 South Korea 2,091 1,724 1,134 Japan 877 586 534 China 260 311 74 Brazil 31 36 22 Other foreign 605 315 237 $4,880 $3,847 $2,915
*As adjusted (Note 11).
Segment assets are comprised of accounts receivable, finance receivables and inventory for QCT, QTL and QWI. The QSI segment assets include marketable securities,accounts receivable, finance receivables, notes receivable, other investments and assets of consolidated investees. The QSI segment assets at September 30, 2003 and 2002included $265 million and $391 million, respectively, in assets related to discontinued operations (Note 11). Total segment assets differ from total assets on a consolidatedbasis as a result of unallocated corporate assets primarily comprised of cash, cash equivalents, marketable securities, property, plant and equipment, and goodwill. The netbook value of long-lived assets located outside of the United States was $21 million, $117 million and $251 million at September 30, 2004, 2003 and 2002, respectively.Long-lived assets located outside of the United States were primarily in Brazil at September 20, 2003 and 2002 related to discontinued operations (Note 11).
Note 11. Discontinued Operations in the QSI Segment
In fiscal 1999, the Company acquired ownership interests in Vésper São Paulo S.A. and Vésper S.A. (the Vésper Operating Companies). The Vésper Operating Companieswere formed by a consortium of investors to provide fixed wireless and wireline telephone services in the northern, northeast and eastern regions of Brazil and in the state ofSão Paulo. In November 2001, the Company consummated a series of transactions resulting in an overall financial restructuring of the Vésper Operating Companies, whichresulted in its holding direct and indirect controlling ownership interests in the Vésper Operating Companies. As a result, the Vésper Operating Companies were consolidatedin the Company’s QSI segment.
On December 2, 2003 (the Closing Date), Embratel Participações S.A. (Embratel) acquired the Company’s direct and indirect ownership interests in the Vésper OperatingCompanies (the Embratel sale transaction) for no consideration. The Vésper Operating Companies’ existing communication towers and related interests in tower site propertyleases (Vésper Towers) were not included in the Embratel sale transaction, and as such, the Company effectively retained, through a new wholly-owned subsidiary(TowerCo), ownership and control of the Vésper Towers. The Vésper Towers had a net book value of approximately $5 million on the Closing Date. Concurrent with theclosing, the Vésper Operating Companies entered into a 10-year agreement (renewable at the Vésper Operating Companies’ option for up to two successive 5-year terms)whereby the Vésper Operating Companies would pay a monthly fee to the Company for use of aerial and ground space on the tower sites. The Company providedapproximately $6 million to fund operations of the Vésper Operating Companies during the first quarter of fiscal 2004 prior to their sale and additionally providedapproximately $39 million in aggregate funding to or for the benefit of the Vésper Operating Companies on or before the Closing Date to facilitate the Embratel saletransaction. Such funding enabled the Vésper Operating Companies to completely extinguish their existing local bank debt (at an agreed discount) to allow the Company toretain ownership of the Vésper Towers free and clear of any local bank security interest. The major classes of assets and liabilities sold in the Embratel sale transactionincluded: $25 million in accounts receivable, $5 million in inventory, $24 million in other current assets, $95 million in property, plant and equipment, $6 million in otherassets, $52 million in accounts payable, $5 million in payroll and other
F-35

Table of Contents
QUALCOMM IncorporatedNOTES TO CONSOLIDATED FINANCIAL STATEMENTS
benefits related liabilities, $6 million in unearned revenue, $1 million in other current liabilities, $14 million in long-term debt and $3 million in other liabilities. TheCompany realized a net loss of $52 million on the Embratel sale transaction during the first quarter of fiscal 2004, including a $74 million loss on the net assets sold toEmbratel and a $46 million loss related to the recognition of cumulative foreign currency translation losses previously included in stockholders’ equity, partially offset by$68 million in gains related to the extinguishment of local bank debt and the settlement of other liabilities.
On November 19, 2002, the Company won bids to acquire personal mobile service (SMP) licenses in certain regions of Brazil. Approximately $8 million of theapproximate $82 million purchase price for the SMP licenses was paid in December 2002. The remaining Brazilian real-denominated obligation was financed by the Braziliangovernment at an interest rate of 12% per annum, plus an adjustment for inflation. These SMP licenses were not included in the Embratel sale transaction. In December 2003,the Company initiated a waiver and return of the SMP licenses to Anatel, the telecommunications regulatory agency in Brazil. In February 2004, the waiver and return of theSMP licenses was approved by Anatel, and the license debt was extinguished. The Company realized a net gain of $19 million as a result of the removal of the $104 millionSMP licenses and the related $123 million debt and accrued interest during the second quarter of fiscal 2004.
On March 2, 2004, the Company sold TowerCo to Embratel in a separately negotiated transaction (the TowerCo sale transaction) for $45 million in cash. TowerCo’s assetswere primarily comprised of $5 million in property, plant and equipment. The Company realized a net gain of $40 million on the TowerCo sale transaction during the secondquarter of fiscal 2004. As a result of the disposition of the remaining operations and assets related to the Vésper Operating Companies, the Company determined that theresults of operations and cash flows related to the Vésper Operating Companies, including the results related to TowerCo and the SMP licenses and the gains and lossesrealized on the Embratel and TowerCo sales transactions, should be presented as discontinued operations in its consolidated statements of operations and cash flows. TheCompany’s statements of operations and cash flows for all prior periods have been adjusted to present the discontinued operations. At September 30, 2004, the Company hadno remaining assets or liabilities related to the Vésper Operating Companies, TowerCo or the SMP licenses recorded on its consolidated balance sheet.
Revenues of $36 million, $123 million and $125 million were reported in the loss from discontinued operations during fiscal 2004, 2003 and 2002, respectively. Pro formaresults for fiscal 2002, assuming the acquisition of the Vésper Operating Companies had been made at the beginning of fiscal 2002, are not presented because they would notdiffer materially from reported results.
Note 12. Auction Discount Voucher
The Company was awarded a $125 million Auction Discount Voucher (ADV) by the Federal Communications Commission (FCC) in June 2000 as the result of a legalruling. The ADV is fully transferable and may, subject to certain conditions, be used in whole or in part by any entity in any FCC spectrum auction over a period of threeyears, including those in which the Company is not a participant. During November 2002, the FCC amended the terms of the ADV to allow the Company to use the ADV tosatisfy existing FCC debt of other companies. The FCC agreed to extend the ADV twice, most recently in June 2004. The ADV was scheduled to expire in September 2004,but the Company used the remaining ADV prior to its expiration.
The Company used approximately $77 million of the ADV’s value prior to fiscal 2004. During fiscal 2004, the Company recorded $4 million in other operating incomeand $4 million in selling, general and administrative expenses in the QSI segment for cooperative marketing expenses incurred, with no effect on net income, related to anarrangement under which a portion of the ADV was transferred to a wireless operator prior to fiscal 2004.
During fiscal 2004, the Company transferred approximately $18 million of the ADV’s value to a wireless operator for approximately $17 million in cash. As a result ofthis transfer, the Company recorded an additional $17 million in other operating income in the QSI segment during fiscal 2004. The Company recorded $47 million in otherincome in the QSI segment during fiscal 2003 related to transfers of the ADV’s value to wireless operators.
The Company also used approximately $30 million of the ADV during fiscal 2004 as final payment for wireless licenses granted in fiscal 2004 in which the Company wasthe highest bidder in a FCC auction held during fiscal 2003. On a cumulative basis, the Company used $38 million of the ADV as payment for these wireless licenses, for
F-36

Table of Contents
QUALCOMM IncorporatedNOTES TO CONSOLIDATED FINANCIAL STATEMENTS
which the Company had no cost basis at September 30, 2004. The ADV had no remaining value at September 30, 2004.
Note 13. Subsequent Events
In October 2004, the Company completed the acquisition of the approximate 86% of the outstanding capital stock of Iridigm Display Corporation, a privately held displaytechnology company, that it did not already own for approximately $160 million in cash and the exchange of stock options with an aggregate estimated fair value ofapproximately $17 million. Also in October 2004, the Company completed the acquisition of Trigenix Limited, a privately held mobile user interface company, forapproximately $33 million in cash.
F-37
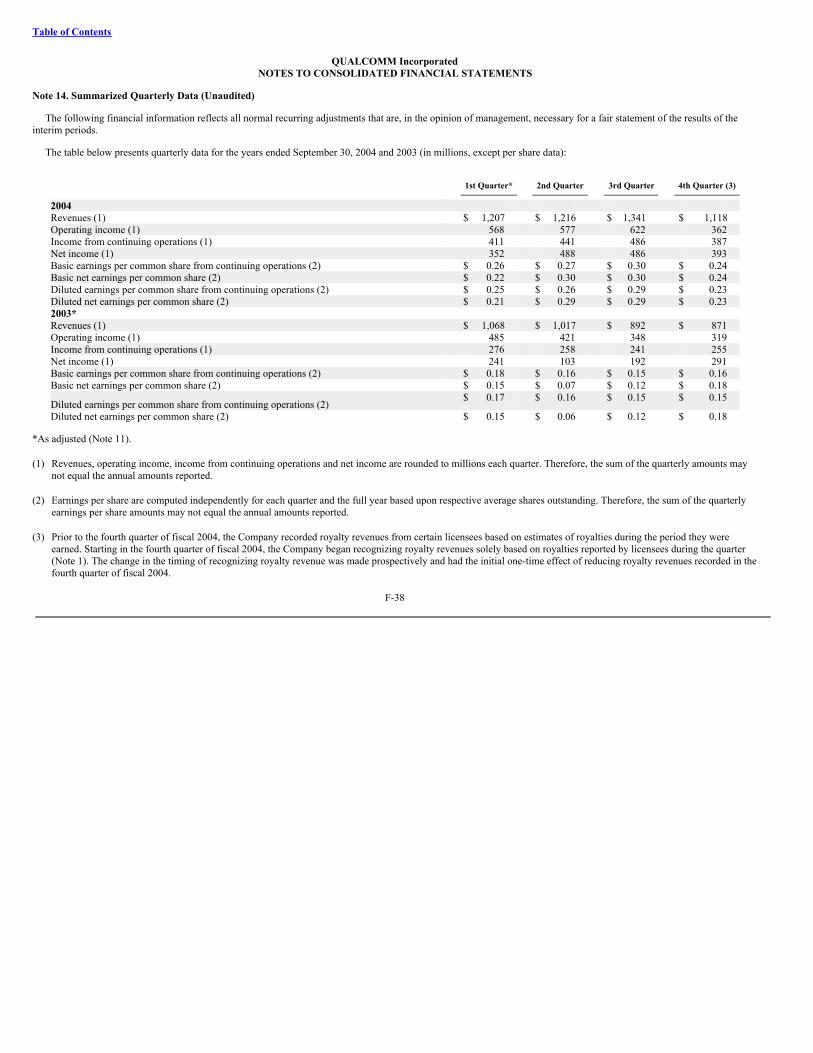
Table of Contents
QUALCOMM IncorporatedNOTES TO CONSOLIDATED FINANCIAL STATEMENTS
Note 14. Summarized Quarterly Data (Unaudited)
The following financial information reflects all normal recurring adjustments that are, in the opinion of management, necessary for a fair statement of the results of theinterim periods.
The table below presents quarterly data for the years ended September 30, 2004 and 2003 (in millions, except per share data):
1st Quarter*
2nd Quarter
3rd Quarter
4th Quarter (3)
2004 Revenues (1) $ 1,207 $ 1,216 $ 1,341 $ 1,118 Operating income (1) 568 577 622 362 Income from continuing operations (1) 411 441 486 387 Net income (1) 352 488 486 393 Basic earnings per common share from continuing operations (2) $ 0.26 $ 0.27 $ 0.30 $ 0.24 Basic net earnings per common share (2) $ 0.22 $ 0.30 $ 0.30 $ 0.24 Diluted earnings per common share from continuing operations (2) $ 0.25 $ 0.26 $ 0.29 $ 0.23 Diluted net earnings per common share (2) $ 0.21 $ 0.29 $ 0.29 $ 0.23 2003* Revenues (1) $ 1,068 $ 1,017 $ 892 $ 871 Operating income (1) 485 421 348 319 Income from continuing operations (1) 276 258 241 255 Net income (1) 241 103 192 291 Basic earnings per common share from continuing operations (2) $ 0.18 $ 0.16 $ 0.15 $ 0.16 Basic net earnings per common share (2) $ 0.15 $ 0.07 $ 0.12 $ 0.18
Diluted earnings per common share from continuing operations (2) $ 0.17 $ 0.16 $ 0.15 $ 0.15
Diluted net earnings per common share (2) $ 0.15 $ 0.06 $ 0.12 $ 0.18
*As adjusted (Note 11).
(1) Revenues, operating income, income from continuing operations and net income are rounded to millions each quarter. Therefore, the sum of the quarterly amounts maynot equal the annual amounts reported.
(2) Earnings per share are computed independently for each quarter and the full year based upon respective average shares outstanding. Therefore, the sum of the quarterlyearnings per share amounts may not equal the annual amounts reported.
(3) Prior to the fourth quarter of fiscal 2004, the Company recorded royalty revenues from certain licensees based on estimates of royalties during the period they wereearned. Starting in the fourth quarter of fiscal 2004, the Company began recognizing royalty revenues solely based on royalties reported by licensees during the quarter(Note 1). The change in the timing of recognizing royalty revenue was made prospectively and had the initial one-time effect of reducing royalty revenues recorded in thefourth quarter of fiscal 2004.
F-38
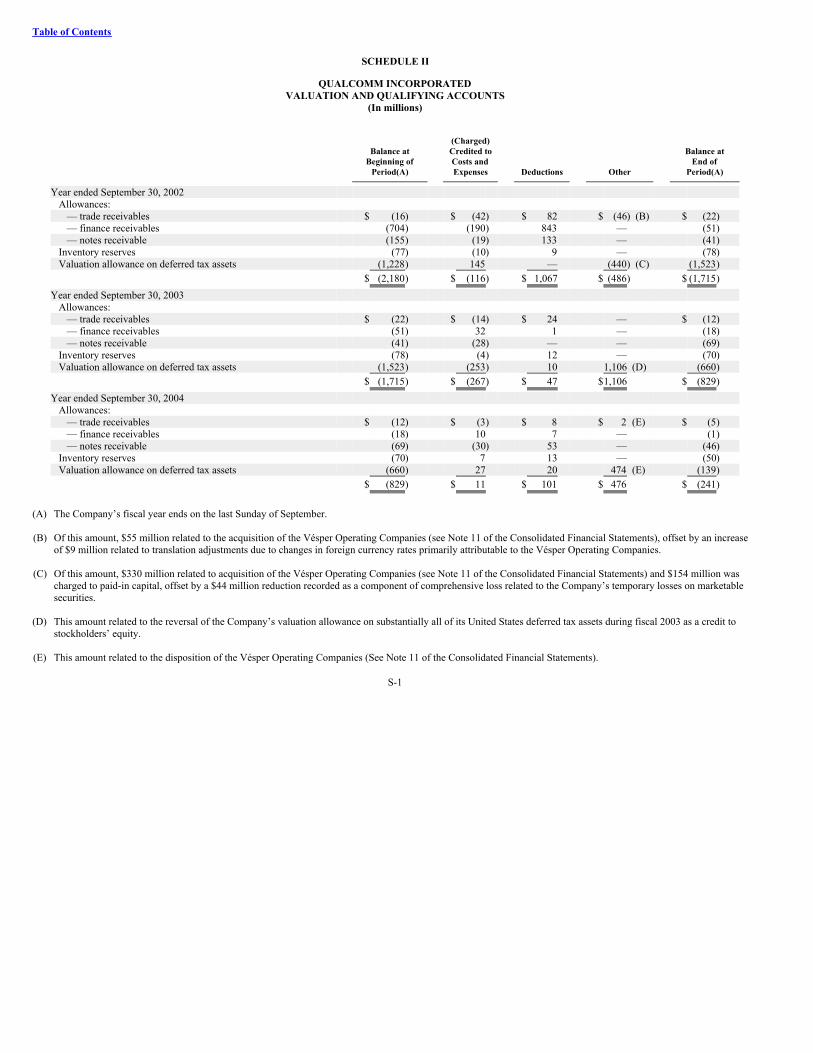
Table of Contents
SCHEDULE II
QUALCOMM INCORPORATEDVALUATION AND QUALIFYING ACCOUNTS
(In millions)
(Charged) Balance at Credited to Balance at Beginning of Costs and End of
Period(A)
Expenses
Deductions
Other
Period(A)
Year ended September 30, 2002 Allowances:
— trade receivables $ (16) $ (42) $ 82 $ (46) (B) $ (22)— finance receivables (704) (190) 843 — (51)— notes receivable (155) (19) 133 — (41)
Inventory reserves (77) (10) 9 — (78)Valuation allowance on deferred tax assets (1,228) 145 — (440) (C) (1,523)
$ (2,180) $ (116) $ 1,067 $ (486) $ (1,715)Year ended September 30, 2003
Allowances: — trade receivables $ (22) $ (14) $ 24 — $ (12)— finance receivables (51) 32 1 — (18)— notes receivable (41) (28) — — (69)
Inventory reserves (78) (4) 12 — (70)Valuation allowance on deferred tax assets (1,523) (253) 10 1,106 (D) (660)
$ (1,715) $ (267) $ 47 $1,106 $ (829)Year ended September 30, 2004
Allowances: — trade receivables $ (12) $ (3) $ 8 $ 2 (E) $ (5)— finance receivables (18) 10 7 — (1)— notes receivable (69) (30) 53 — (46)
Inventory reserves (70) 7 13 — (50)Valuation allowance on deferred tax assets (660) 27 20 474 (E) (139)
$ (829) $ 11 $ 101 $ 476 $ (241)
(A) The Company’s fiscal year ends on the last Sunday of September. (B) Of this amount, $55 million related to the acquisition of the Vésper Operating Companies (see Note 11 of the Consolidated Financial Statements), offset by an increase
of $9 million related to translation adjustments due to changes in foreign currency rates primarily attributable to the Vésper Operating Companies. (C) Of this amount, $330 million related to acquisition of the Vésper Operating Companies (see Note 11 of the Consolidated Financial Statements) and $154 million was
charged to paid-in capital, offset by a $44 million reduction recorded as a component of comprehensive loss related to the Company’s temporary losses on marketablesecurities.
(D) This amount related to the reversal of the Company’s valuation allowance on substantially all of its United States deferred tax assets during fiscal 2003 as a credit to
stockholders’ equity. (E) This amount related to the disposition of the Vésper Operating Companies (See Note 11 of the Consolidated Financial Statements).
S-1

EXHIBIT 21
SUBSIDIARIES OF REGISTRANT
SnapTrack, Inc. (SnapTrack), a California corporation, is a wholly-owned subsidiary of the Company. SnapTrack and its subsidiary, SnapTrack Japan, Inc., incorporatedin Japan, do business under their own names. The Company consolidates SnapTrack in its financial statements.
QUALCOMM Global Trading, Inc. (QGT), a British Virgin Islands corporation, is a wholly-owned subsidiary of the Company. QGT and its subsidiaries, QUALCOMMCDMA Technologies Asia-Pacific Pte. Ltd., incorporated in Singapore, QUALCOMM CDMA Technologies, Y.K., incorporated in Japan, QUALCOMM CDMATechnologies (Korea) Y.H., incorporated in South Korea, and QUALCOMM Wireless Semi Conductor Technologies Ltd., incorporated in China, do business under their ownnames. The Company consolidates QGT in its financial statements.
The names of other subsidiaries are omitted. Such subsidiaries would not, if considered in the aggregate as a single subsidiary, constitute a significant subsidiary within themeaning of Item 601(b)(21)(ii) of Regulation S-K.

EXHIBIT 23.1
CONSENT OF INDEPENDENT REGISTERED PUBLIC ACCOUNTING FIRM
We hereby consent to the incorporation by reference in the Registration Statements on Form S-3 (No. 333-26069 and No. 333-32926) and in the Registration Statements onForm S-8 (No. 33-46343, No. 333-60484, No. 33-45083, No. 33-78158, No. 33-78150, No. 33-32013, No. 333-69457, No. 333-95291, No. 333-32924, No. 333-42286,No. 333-103497, No. 333-117626 and No. 333-119904) of QUALCOMM Incorporated of our report dated November 2, 2004 relating to the consolidated financial statements,the financial statement schedule, management’s assessment of the effectiveness of internal control over financial reporting and the effectiveness of internal control overfinancial reporting, which appears in this Form 10-K.
PRICEWATERHOUSECOOPERS LLP
San Diego, CaliforniaNovember 2, 2004
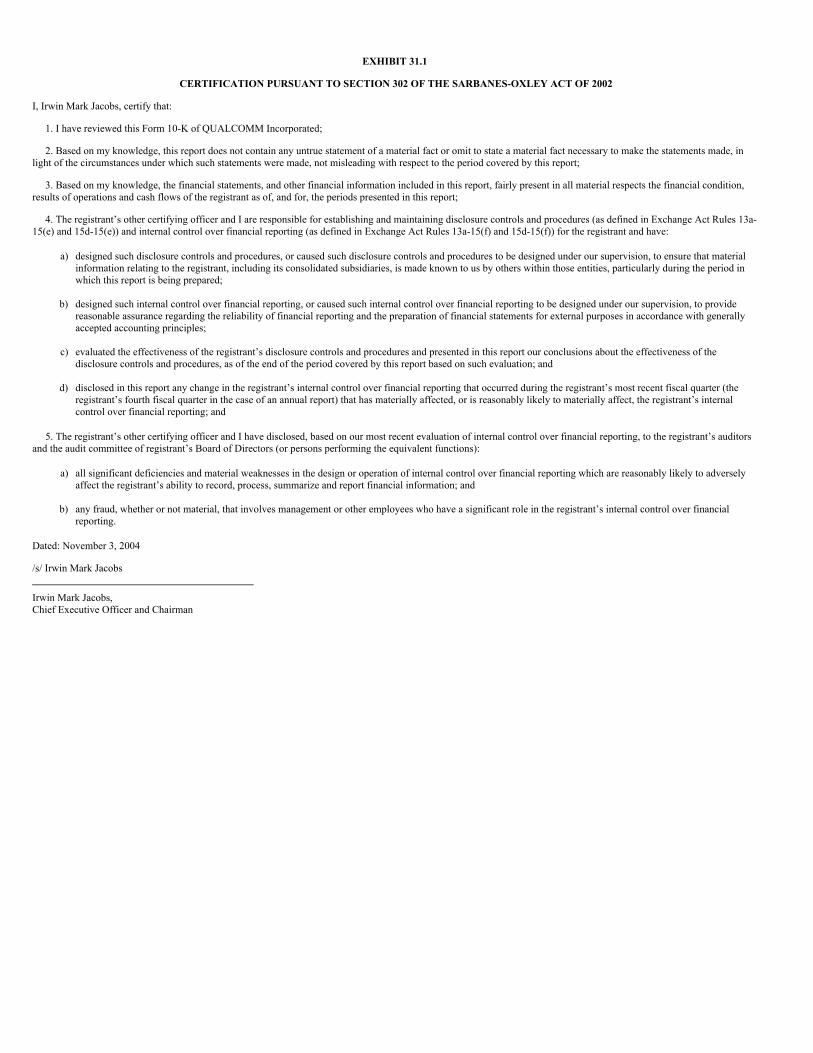
EXHIBIT 31.1
CERTIFICATION PURSUANT TO SECTION 302 OF THE SARBANES-OXLEY ACT OF 2002
I, Irwin Mark Jacobs, certify that:
1. I have reviewed this Form 10-K of QUALCOMM Incorporated;
2. Based on my knowledge, this report does not contain any untrue statement of a material fact or omit to state a material fact necessary to make the statements made, inlight of the circumstances under which such statements were made, not misleading with respect to the period covered by this report;
3. Based on my knowledge, the financial statements, and other financial information included in this report, fairly present in all material respects the financial condition,results of operations and cash flows of the registrant as of, and for, the periods presented in this report;
4. The registrant’s other certifying officer and I are responsible for establishing and maintaining disclosure controls and procedures (as defined in Exchange Act Rules 13a-15(e) and 15d-15(e)) and internal control over financial reporting (as defined in Exchange Act Rules 13a-15(f) and 15d-15(f)) for the registrant and have:
a) designed such disclosure controls and procedures, or caused such disclosure controls and procedures to be designed under our supervision, to ensure that materialinformation relating to the registrant, including its consolidated subsidiaries, is made known to us by others within those entities, particularly during the period inwhich this report is being prepared;
b) designed such internal control over financial reporting, or caused such internal control over financial reporting to be designed under our supervision, to provide
reasonable assurance regarding the reliability of financial reporting and the preparation of financial statements for external purposes in accordance with generallyaccepted accounting principles;
c) evaluated the effectiveness of the registrant’s disclosure controls and procedures and presented in this report our conclusions about the effectiveness of the
disclosure controls and procedures, as of the end of the period covered by this report based on such evaluation; and
d) disclosed in this report any change in the registrant’s internal control over financial reporting that occurred during the registrant’s most recent fiscal quarter (theregistrant’s fourth fiscal quarter in the case of an annual report) that has materially affected, or is reasonably likely to materially affect, the registrant’s internalcontrol over financial reporting; and
5. The registrant’s other certifying officer and I have disclosed, based on our most recent evaluation of internal control over financial reporting, to the registrant’s auditorsand the audit committee of registrant’s Board of Directors (or persons performing the equivalent functions):
a) all significant deficiencies and material weaknesses in the design or operation of internal control over financial reporting which are reasonably likely to adverselyaffect the registrant’s ability to record, process, summarize and report financial information; and
b) any fraud, whether or not material, that involves management or other employees who have a significant role in the registrant’s internal control over financial
reporting.
Dated: November 3, 2004
/s/ Irwin Mark Jacobs
Irwin Mark Jacobs,Chief Executive Officer and Chairman
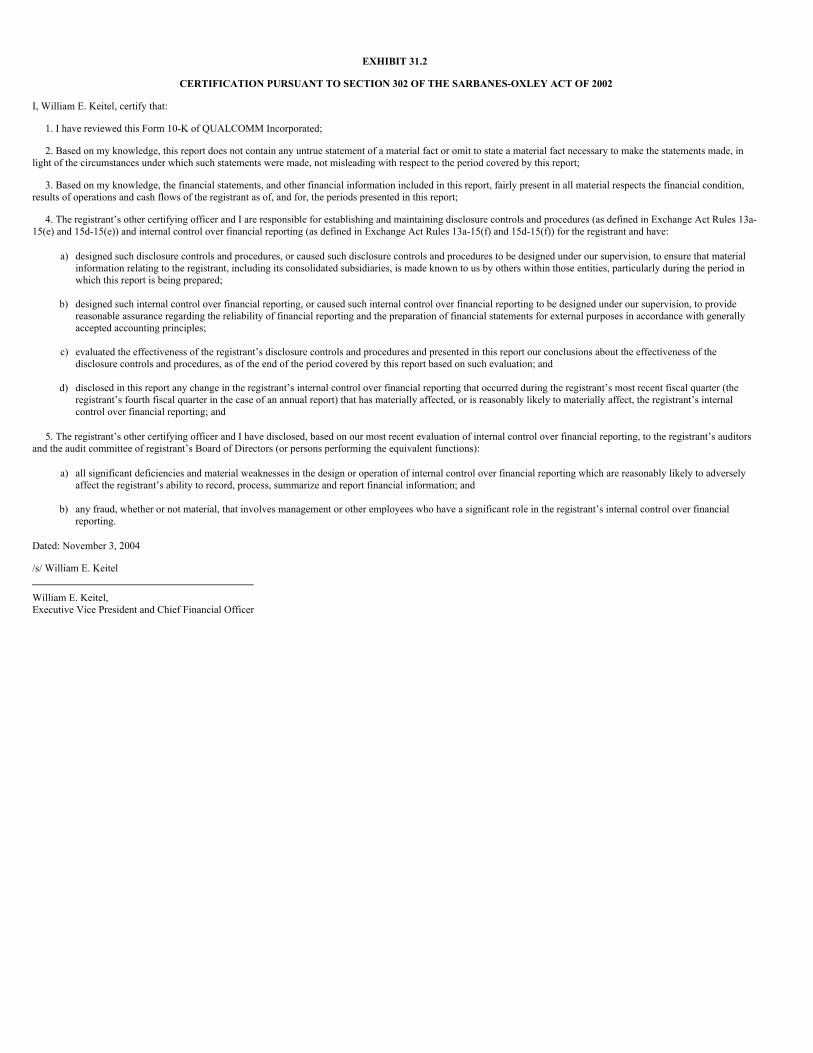
EXHIBIT 31.2
CERTIFICATION PURSUANT TO SECTION 302 OF THE SARBANES-OXLEY ACT OF 2002
I, William E. Keitel, certify that:
1. I have reviewed this Form 10-K of QUALCOMM Incorporated;
2. Based on my knowledge, this report does not contain any untrue statement of a material fact or omit to state a material fact necessary to make the statements made, inlight of the circumstances under which such statements were made, not misleading with respect to the period covered by this report;
3. Based on my knowledge, the financial statements, and other financial information included in this report, fairly present in all material respects the financial condition,results of operations and cash flows of the registrant as of, and for, the periods presented in this report;
4. The registrant’s other certifying officer and I are responsible for establishing and maintaining disclosure controls and procedures (as defined in Exchange Act Rules 13a-15(e) and 15d-15(e)) and internal control over financial reporting (as defined in Exchange Act Rules 13a-15(f) and 15d-15(f)) for the registrant and have:
a) designed such disclosure controls and procedures, or caused such disclosure controls and procedures to be designed under our supervision, to ensure that materialinformation relating to the registrant, including its consolidated subsidiaries, is made known to us by others within those entities, particularly during the period inwhich this report is being prepared;
b) designed such internal control over financial reporting, or caused such internal control over financial reporting to be designed under our supervision, to provide
reasonable assurance regarding the reliability of financial reporting and the preparation of financial statements for external purposes in accordance with generallyaccepted accounting principles;
c) evaluated the effectiveness of the registrant’s disclosure controls and procedures and presented in this report our conclusions about the effectiveness of the
disclosure controls and procedures, as of the end of the period covered by this report based on such evaluation; and
d) disclosed in this report any change in the registrant’s internal control over financial reporting that occurred during the registrant’s most recent fiscal quarter (theregistrant’s fourth fiscal quarter in the case of an annual report) that has materially affected, or is reasonably likely to materially affect, the registrant’s internalcontrol over financial reporting; and
5. The registrant’s other certifying officer and I have disclosed, based on our most recent evaluation of internal control over financial reporting, to the registrant’s auditorsand the audit committee of registrant’s Board of Directors (or persons performing the equivalent functions):
a) all significant deficiencies and material weaknesses in the design or operation of internal control over financial reporting which are reasonably likely to adverselyaffect the registrant’s ability to record, process, summarize and report financial information; and
b) any fraud, whether or not material, that involves management or other employees who have a significant role in the registrant’s internal control over financial
reporting.
Dated: November 3, 2004
/s/ William E. Keitel
William E. Keitel,Executive Vice President and Chief Financial Officer
EXHIBIT 32.1
CERTIFICATION PURSUANT TO SECTION 906 OF THE SARBANES-OXLEY ACT OF 2002(18 U.S.C. SECTION 1350)
In connection with the accompanying Annual Report of QUALCOMM Incorporated (the “Company”) on Form 10-K for the fiscal year ended September 26, 2004 (the“Report”), I, Irwin Mark Jacobs, Chief Executive Officer of the Company, certify, pursuant to 18 U.S.C. §1350, as adopted pursuant to §906 of the Sarbanes-Oxley Act of2002, that:
(1) The Report fully complies with the requirements of Section 13(a) of the Securities Exchange Act of 1934; and
(2) The information contained in the Report fairly presents, in all material respects, the financial condition and results of operations of the Company.
Dated: November 3, 2004
/s/ Irwin Mark Jacobs
Irwin Mark Jacobs,Chief Executive Officer and Chairman
EXHIBIT 32.2
CERTIFICATION PURSUANT TO SECTION 906 OF THE SARBANES-OXLEY ACT OF 2002(18 U.S.C. SECTION 1350)
In connection with the accompanying Annual Report of QUALCOMM Incorporated (the “Company”) on Form 10-K for the fiscal year ended September 26, 2004 (the“Report”), I, William E. Keitel, Chief Financial Officer of the Company, certify, pursuant to 18 U.S.C. §1350, as adopted pursuant to §906 of the Sarbanes-Oxley Act of 2002,that:
(1) The Report fully complies with the requirements of Section 13(a) of the Securities Exchange Act of 1934; and
(2) The information contained in the Report fairly presents, in all material respects, the financial condition and results of operations of the Company.
Dated: November 3, 2004
/s/ William E. Keitel
William E. Keitel,Executive Vice President and Chief Financial Officer