qtm - quality tools' manual. of experiments philips.pdfqtm - quality tools' manual. ......
TRANSCRIPT

QTM - QUALITY TOOLS' MANUAL.
PHILIPS ELECTRONICS SINGAPORE Date : 1st July 2001DAP DIVISION Rev. : 0
1
1
2.4.1 Design Of Experiments (DOE)
1. Definition
Experimentation is a systematic approach to answer questions and morespecifically; how do changes to a system actually affect the quality functionor response of the system?
Whenever we adjust a process or a product without knowing what theoutcome will be, we are making experiments.
Experiments come in many forms and can be categorize as followed:
1.1 Trial and Error Experiment
Most experiments are TRIAL AND ERROR experiment involvingone or two variables. When an operator makes adjustment to aprocess, checks the result and repeats this until the desired result isobtained, he is conducting a trial and error experiment.
1.2 One by One Experiment
When a team can collect more variables around the members areconvinced to start changing only one variable at a time. In this way,team is able to isolate each variable effect. This method is called theONE-by-ONE experiment. No interacting effect could be capturedvia this conventional ways of conducting experimentation.
1.3 Design-of-experiments (DOE)
When we have more variables at different levels, we will need amore structural method of doing the experiments, intelligently,efficiently at a low cost, thus team must design their experiments. Astructured DOE also means that interacting effects amongindividual factors can be captured. Since the study/understanding ofinteraction is a vital to initial stages of any experimentation, its isalways advisable to perform proper DOE than to do one by oneexperimentation.

QTM - QUALITY TOOLS' MANUAL.
PHILIPS ELECTRONICS SINGAPORE Date : 1st July 2001DAP DIVISION Rev. : 0
2
2
2. Objectives
The Design of experiment can assist the team to
2.1 identify the important causes or variables whether they are productor process parameters, materials, and environmental or measuringequipment factors.
2.2 Determine the main effects and interaction effects of theseimportant variables.
2.3 Reduce the variation on the important variables through closetolerancing, re-design improve component.
2.4 Open the tolerance on the unimportant variables to reduce costssubstantially.

QTM - QUALITY TOOLS' MANUAL.
PHILIPS ELECTRONICS SINGAPORE Date : 1st July 2001DAP DIVISION Rev. : 0
3
3
3. Application.
� Steps at a glance for Shainin’s DOE.
Design
Of
Experiments
Componentssearch
20 - 1000 variables
Multi-variCharts
Variablessearch
FullFactorials
B Vs C
Scatter Plots
Pairedcomparisons
5 - 20Variables
4 or lessVariables
Validation
Optimization
Postural OperatorCertification
ProcessCertification
Pre-control
Maintenance
SPC
Variation ReductionA Roadmap
QTM - QUALITY TOOLS' MANUAL.
PHILIPS ELECTRONICS SINGAPORE Date : 1st July 2001DAP DIVISION Rev. : 0
4
4
3.1 The team will have to communicate the experimental objective toeveryone involved before the application of the Design ofExperiments.
3.2 The three types of Design of Experiments can be classified asfollowed :3.2.1 Classical3.2.2 Taguchi3.2.3 Shainin
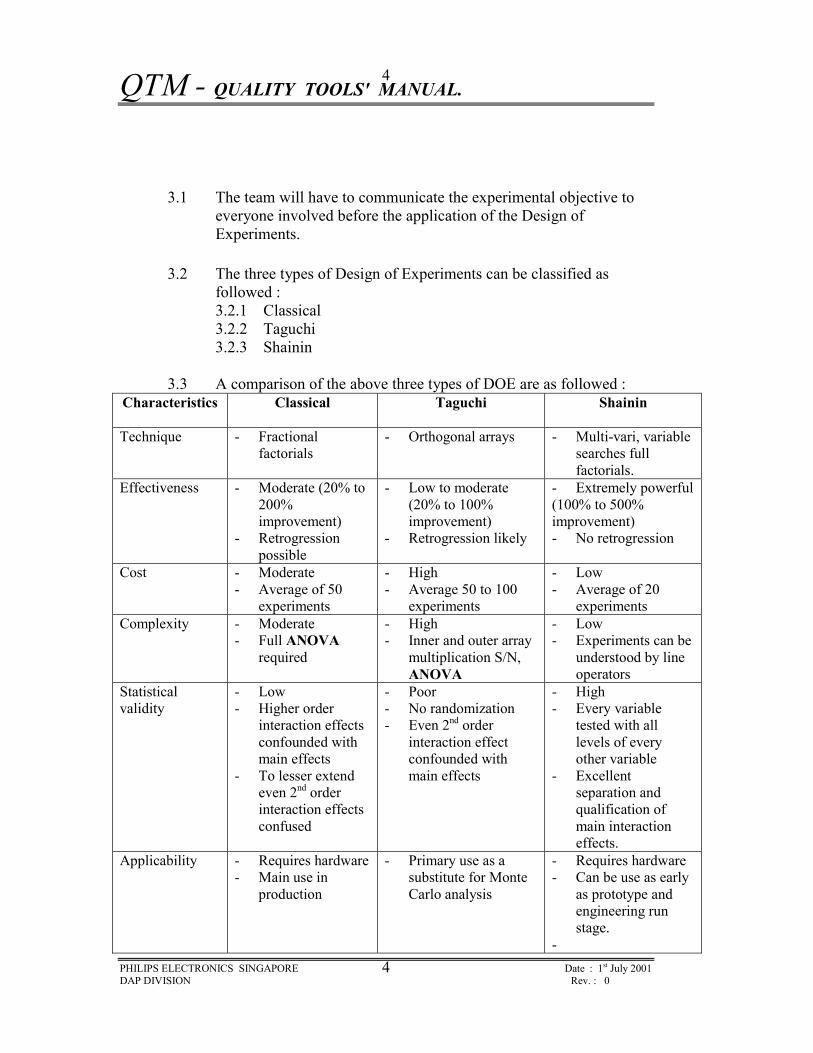
3.3 A comparison of the above three types of DOE are as followed :Characteristics Classical Taguchi Shainin
Technique - Fractionalfactorials
- Orthogonal arrays - Multi-vari, variablesearches fullfactorials.
Effectiveness - Moderate (20% to200%improvement)
- Retrogressionpossible
- Low to moderate(20% to 100%improvement)
- Retrogression likely
- Extremely powerful(100% to 500%improvement)- No retrogression
Cost - Moderate- Average of 50
experiments
- High- Average 50 to 100
experiments
- Low- Average of 20
experimentsComplexity - Moderate
- Full ANOVArequired
- High- Inner and outer array
multiplication S/N,ANOVA
- Low- Experiments can be
understood by lineoperators
Statisticalvalidity
- Low- Higher order
interaction effectsconfounded withmain effects
- To lesser extendeven 2nd orderinteraction effectsconfused
- Poor- No randomization - Even 2nd order
interaction effectconfounded withmain effects
- High- Every variable
tested with alllevels of everyother variable
- Excellentseparation andqualification ofmain interactioneffects.
Applicability - Requires hardware- Main use in
production
- Primary use as asubstitute for MonteCarlo analysis
- Requires hardware- Can be use as early
as prototype andengineering runstage.
-

QTM - QUALITY TOOLS' MANUAL.
PHILIPS ELECTRONICS SINGAPORE Date : 1st July 2001DAP DIVISION Rev. : 0
5
5
Ease ofimplementation
- moderate- engineering and
statisticalknowledgerequired.
- Difficult- Engineers not likely
to use this method.
- Easy
3.4 The application of Shainin (DOE) using the 7 DOE Quality Toolsare as followed :
3.4.1 Multi-Vari-Chart
3.4.1 a) The multi-vari chart is to graphically depict familyof
variation patterns that will enable you to reduce alarge number of unmanageable possible causes(variation) to a much smaller family of variablescontaining the Red X.
� Detect large non-random variables� Detect variables containing the Red X
3.4.1 b) The three families of variation depicted in the multi-vari
charts are:
� Positional variation� Cyclical variation� Temporal (time) variation
3.4.1 c) When using the multi-vari data, team is able tolocate the
family that shows the largest variation. This is thefamily that will contain the previously unidentifiedmajor variable, the Xs.
3.4.1 d) Although all families may contribute in some way tothe
overall variability in the process, they generally donot contribute equally.

QTM - QUALITY TOOLS' MANUAL.
PHILIPS ELECTRONICS SINGAPORE Date : 1st July 2001DAP DIVISION Rev. : 0
6
6
� Positional Variation
The positional family of variation depictsvariations in a product position. This positionalvariation can occur with a single unit containingone single characteristic or more than onevariation within a single unit.
- variation within or across a single unit- variation by location- machine to machine variations
� Cyclical Variation
- variation between consecutive units- variation among groups of units- variation between batch to batch
� Temporal (Time) variation
- hour to hour variation- shift to shift variation- day to day variation- week to week variation
3.4.1 e) Examples of Multi- Vari Chart (reference to attached Appendix)
3.4.2 Component Search
3.4.2 a) Component search is another simple but powerful technique whereby a large number of possible causesof variation can be reduced to the family of the RedX or the Red X itself. Reduction to the lowestnumber of possible causes is the objective.
3.4.2 b) The technique is applicable, primarily in assembly operations (but also in process-oriented operationswhere, there are several similar processes ormachines), where the longer the difference in outputbetween the two units, the better.

QTM - QUALITY TOOLS' MANUAL.
PHILIPS ELECTRONICS SINGAPORE Date : 1st July 2001DAP DIVISION Rev. : 0
7
7
3.4.2 c) The response (output/quality characteristics) must be
measurable and repeatable.
3.4.2 d) The units must be capable of disassemble and re-assembled
without a significant change in the original output.
3.4.2 e) There must be at least the assemblies or units withclearly
different levels of output; for brevity, the twoassemblies are described as a pair, a good unit and abad unit.
3.4.2 f) The procedure for the component search are asfollowed:
i) determine the response (output) parameterby which units are to be measured.
ii) select the best and worst-performing unitfrom your production, if possible have a fewpairs
iii) label all the units, the Best units being B1,B2, B3 ….. and the corresponding Worstunits W1, W2 and W3 ….
iv) Based upon engineering knowledge orconsultation with designer rank thecomponents in descending order of perceivedimportance.
v) measured pair #1 and note the reading
E.g. component readingB1 ……… X1W1………. Y1
QTM - QUALITY TOOLS' MANUAL.
PHILIPS ELECTRONICS SINGAPORE Date : 1st July 2001DAP DIVISION Rev. : 0
8
8
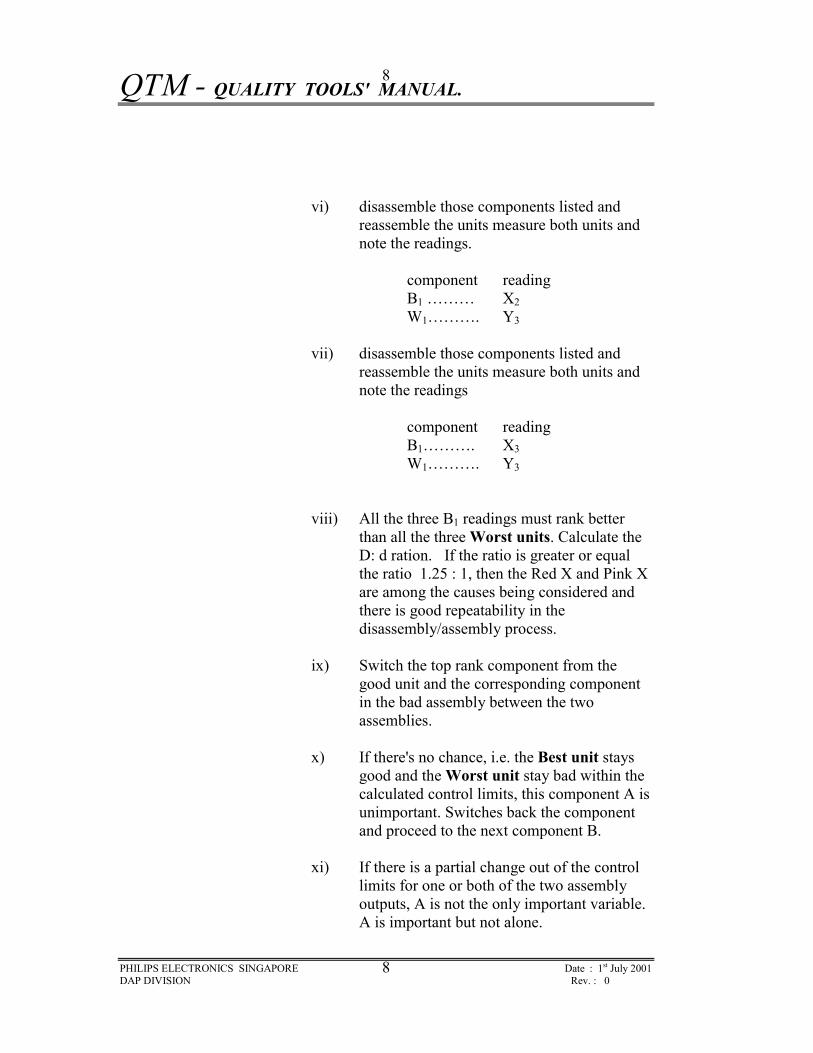
vi) disassemble those components listed andreassemble the units measure both units andnote the readings.
component readingB1 ……… X2W1………. Y3
vii) disassemble those components listed andreassemble the units measure both units andnote the readings
component readingB1………. X3W1………. Y3
viii) All the three B1 readings must rank betterthan all the three Worst units. Calculate theD: d ration. If the ratio is greater or equalthe ratio 1.25 : 1, then the Red X and Pink Xare among the causes being considered andthere is good repeatability in thedisassembly/assembly process.
ix) Switch the top rank component from thegood unit and the corresponding componentin the bad assembly between the twoassemblies.
x) If there's no chance, i.e. the Best unit staysgood and the Worst unit stay bad within thecalculated control limits, this component A isunimportant. Switches back the componentand proceed to the next component B.
xi) If there is a partial change out of the controllimits for one or both of the two assemblyoutputs, A is not the only important variable.A is important but not alone.

QTM - QUALITY TOOLS' MANUAL.
PHILIPS ELECTRONICS SINGAPORE Date : 1st July 2001DAP DIVISION Rev. : 0
9
9
xii) Further, A's interaction effect with othercomponents cannot be needed out. Switchesback the component A and go to the nextcomponent B.
xiii) If there were a complete reversal in theoutputs of the two assemblies, A would be thepart having a Red X quality characteristics.Switches back the component A and go to thenext component B.
xiv) Repeat until the component list is completed.
xv) Ultimately, the RED X family involving twoor more components will be indicated. If thereare two for more significant changes, A REDX interaction could be found at a later stage.
xvi) With the important components identified, acapping run of these important componentsbanded together in the good and worstassemblies must be conducted to verify theimportance.
xvii) Repeat the capping run with another two orthree pairs, to verify that the first pair is not afluke shot.
The test for significant and repeatabledifference
� Measured pair #1 and note the reading
B1… X1N1… Y1
QTM - QUALITY TOOLS' MANUAL.
PHILIPS ELECTRONICS SINGAPORE Date : 1st July 2001DAP DIVISION Rev. : 0
10
10
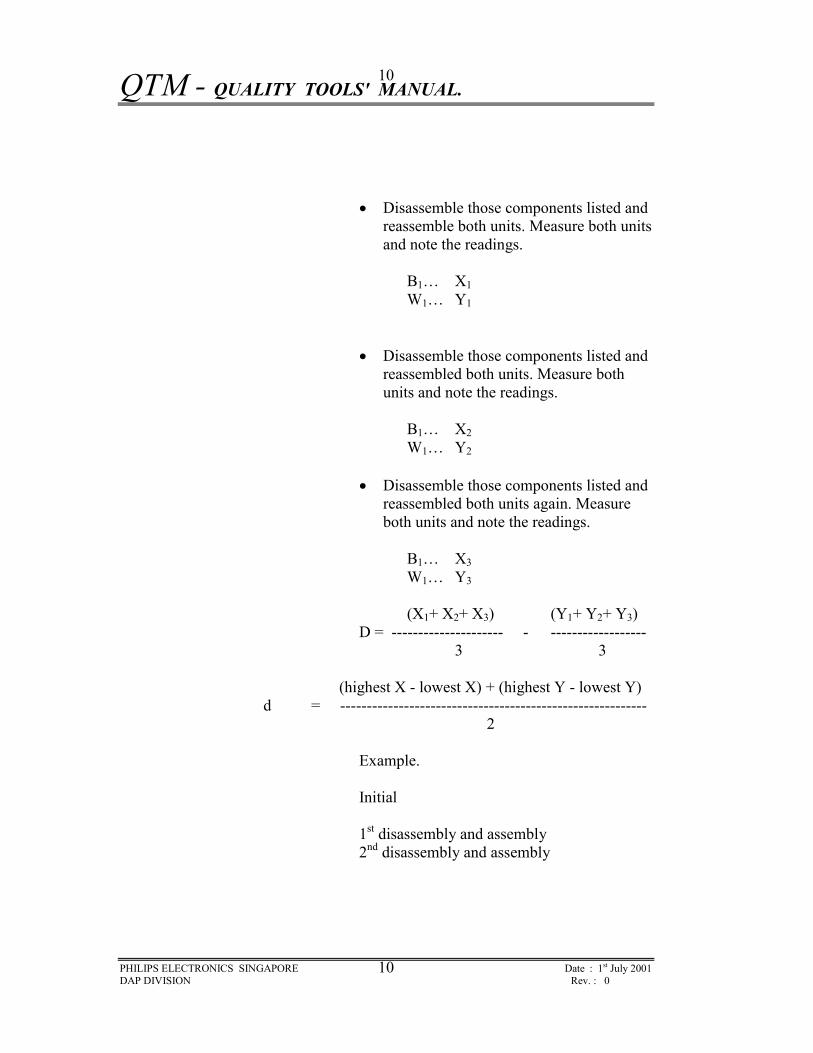
� Disassemble those components listed andreassemble both units. Measure both unitsand note the readings.
B1… X1W1… Y1
� Disassemble those components listed andreassembled both units. Measure bothunits and note the readings.
B1… X2W1… Y2
� Disassemble those components listed andreassembled both units again. Measureboth units and note the readings.
B1… X3W1… Y3
(X1+ X2+ X3) (Y1+ Y2+ Y3)D = --------------------- - ------------------
3 3
(highest X - lowest X) + (highest Y - lowest Y)d = ----------------------------------------------------------
2
Example.
Initial
1st disassembly and assembly2nd disassembly and assembly

QTM - QUALITY TOOLS' MANUAL.
PHILIPS ELECTRONICS SINGAPORE Date : 1st July 2001DAP DIVISION Rev. : 0
11
11
(X1+ X2+ X3) (Y1+ Y2+ Y3)D = --------------------- - ------------------
3 3
(9.8 + 9.7 + 10.2) (5.7 + 5.8 + 6) = --------------------- - -------------------
3 3
= 9.9 - 5. 8333
= 4.066
(highest X - lowest X) + (highest Y - lowest Y)d = ----------------------------------------------------------
2
= (10.2 - 9.7) + (6.0 - 5.7) ------------------------------- = 0.4
2
Thus D: d is 10.1666: 1, which is greater than 1.25: 1Indicating that the Xs' are captured.
X
9.8
9.7
10.2
dB
dB
dB
Y
6
5.8
5.7
dB
dB
dB

QTM - QUALITY TOOLS' MANUAL.
PHILIPS ELECTRONICS SINGAPORE Date : 1st July 2001DAP DIVISION Rev. : 0
12
12
� Control limits
Control limits are used to determinewhether a component and its associatedinteraction effects are important (outsideof control limits) or unimportant (insidethe control limits) and eliminated.
The control limits for each new swappedresult are given by the formula
Control limits = Average +/- {A2 *average range)
With three units of two samples (goodand worst), A2 is 1.023. From theexample the control limits for the goodunits are
= average (X1+ X2+ X3) +/- 1.023 * (average range)= average (9.8 + 9.7 + 10.2) +/- 1.023 * (0.4)= 9.9 +/- 1.3299
UCL = 11.2299LCC = 8.5701
For the worst units the control level is
= average (Y1+ Y2+ Y3) +/- 1.023 (average range)= average (6.0 + 5.8 + 5.7) +/- 1.023 *(1.3)= 5.833
UCL = 7.16323LCL = 4.50343

QTM - QUALITY TOOLS' MANUAL.
PHILIPS ELECTRONICS SINGAPORE Date : 1st July 2001DAP DIVISION Rev. : 0
13
13
� Component to be searched
Component Label Component LabelC2503 A C2412GC2505 B T7501HC2504 C C2425 IL5501 D C2502JL5407 E C2501KC2426 F L5406L
� Construct the component search chart
� Test result
The graphical representation of resultshows the clear separation between theoriginal high (good) and low (worst)assemblies.
121110987654
A B C D E F G H I J K
Note: X …. Interchange between Good and Worst unit O …. Return to original unit

QTM - QUALITY TOOLS' MANUAL.
PHILIPS ELECTRONICS SINGAPORE Date : 1st July 2001DAP DIVISION Rev. : 0
14
14
The graph shows a partial conveyancebetween the high and low assemblies whencomponents C (C2504) and E (L5407) is switched. Thecontributions of the remaining componentsare minor or zero?
In the capping run, when both the Pink Xcomponents, C ands E are switched, thereis a reversal in the result, indicating thatthe family of the RED X is a narroweddown to C and E, that are othercomponents are unimportant for thisparameter.
3.4.3 Paired Comparisons.
3.4.3 a) The pair comparison method is similar to components
search with the objective of reducing a large numberof possible causes of operation down to the family ofthe RED X by providing clues derived fromcomparisons of paired "Good" and "Bad" units.
3.4.3 b) The technique is applicable in assembly work or processes
or in test equipment, where there are similar units,workstations or instruments, respectively. It is also apowerful tool in failure analysis.
3.4.3 c) The pre-requisites of paired comparisons
� Components or sub-assemblies in units cannot bedisassembled or re-assembled (unlike componentsearch)
� There are several good and few bad units that canbe paired.

QTM - QUALITY TOOLS' MANUAL.
PHILIPS ELECTRONICS SINGAPORE Date : 1st July 2001DAP DIVISION Rev. : 0
15
15
� A suitable output can be found to distinguishgood from bad.
3.4.3 d) The procedure for paired comparisons
i) Select one good unit and one bad unit (drawnwhenever possible at the same time)
ii) Call this pair one. Observe in detail to notedifferences between these two units. Thedifference can be visual, dimensional,electrical, mechanical, chemical, etc. Theobservation techniques could involve the eye,measurable parameters, X-rays…
iii) Select a second pair of good and bad units.Observe and note the difference as in Step 2.
iv) Repeat the search process with a third, forth,fifth and sixth pair.
v) If it is a measurable output, rank all the sixpairs in descending orders. If the END Countis greater than six are then the output or thatpart that is contributing to the output is apossible X.
vi) If it is an observable output (physical), thensummarized all difference observed for allthe six pairs. From the list, count the numbersof observable, repeatable difference betweenthe good and the bad units.
Note: disregard differences that showcontrary directions among the pairs.
With this, the consistent differences will benarrowed down to a few factors, providing astrong clue for the major cause of variation.

QTM - QUALITY TOOLS' MANUAL.
PHILIPS ELECTRONICS SINGAPORE Date : 1st July 2001DAP DIVISION Rev. : 0
16
16
Example: UV 1216 D/P Crackle
End CountAccording to Turkey Test
End Count Confidence Level5 81%6 90%7 95%10 99%13 99.9%
Example: B1 48.0B2 46.5B3 46.9B4 47.6B5 48.3B6 45.7W1 42.7W2 43.6W3 46.7W4 44.6W5 45.9W6 44.9
Ranking: B5 48.3B1 48.0B4 47.6B3 46.9B2 46.5W3 46.7W5 45.9B6 45.7W6 44.9

QTM - QUALITY TOOLS' MANUAL.
PHILIPS ELECTRONICS SINGAPORE Date : 1st July 2001DAP DIVISION Rev. : 0
17
17
W4 44.6W2 43.6W1 42.7
Total end count = 9 thus confidence is greater than 95% but less than 99%
3.4.4 Variables search
3.4.4 a) The systematic reduction of variation starts with� Multi-vari chart� Components search� Paired comparison
3.4.4 b) The aim to reduce a very large number of unrelatedcauses
down to a smaller family of related causes wherevariable search is the next tools where it's objectivesare � To pin-point the RED X� To pin-point the PINK X� To pin-point interacting variables� Separate the important variables from the
unimportant ones
3.4.4 c) The pre-requisites of the variable search are� When there are 5 to 10 variables to be
investigated� Output preferable to be measurable� Quantifiable BEST and WORST event
3.4.4 d) The procedures for the variable search
i) List the most important factors A, B, C, D, E,F ….and so on in descending orders ofimportance. The listed factors are usuallyderived from the Multi-vari charts,

QTM - QUALITY TOOLS' MANUAL.
PHILIPS ELECTRONICS SINGAPORE Date : 1st July 2001DAP DIVISION Rev. : 0
18
18
component search or paired comparisons.However, if the product is new, then conducta brainstorming session, using all theexpertise you can organize.
ii) Assign two levels to each factor- a High (-), which is most likely to
contribute to good or even best results.- A Low (-), which represents a most likely
deviation from the HIGH level in day-to-day production with normal maintenance
iii) Run two experiments, one with all factors attheir high levels, the other with all at theirlow levels. Repeat these two experiments.Twice more randomize the experiments.
iv) Apply the (D: d) greater than (1.25: 1) rule.
v) Stage A is over when both stated below aresatisfied.- all three high levels are better than three
low levels- the (D : d) ratio is greater than 1.25
If all three high levels are worse than all three lowlevels just change the "High" and "Low" assignment.
vi) If either of the two conditions in the earlierstep is not met, then switch the level of onefactor, generally if the factors have beencarefully selected this step is not necessary.
vii) If the repeatability is poor, it is an indicationthan an important factor has been left out.Look for a clue from the previousexperiments for one or more factors to beadopted and to re-run the tests.
1) Map out the experiments to be conducted
Test Combination Result Average1 Alow Bhigh2 Ahigh Rlow3 Blow Rhigh
QTM - QUALITY TOOLS' MANUAL.
PHILIPS ELECTRONICS SINGAPORE Date : 1st July 2001DAP DIVISION Rev. : 0
19
19
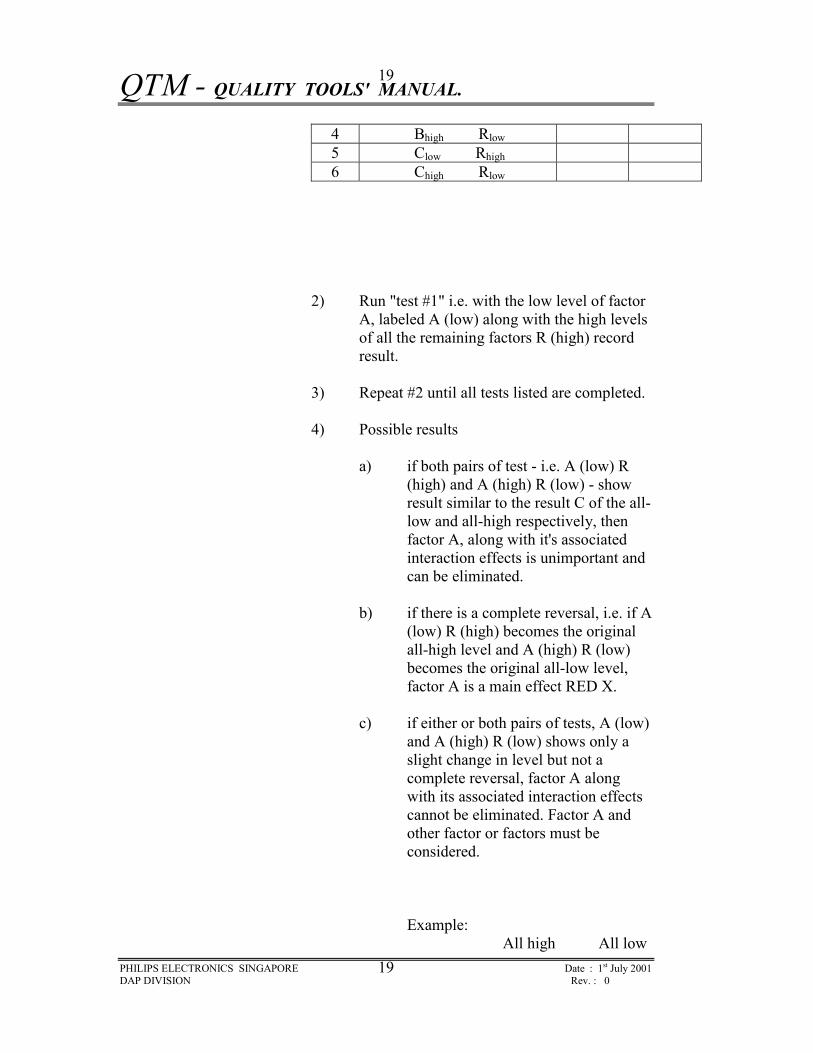
4 Bhigh Rlow5 Clow Rhigh6 Chigh Rlow
2) Run "test #1" i.e. with the low level of factorA, labeled A (low) along with the high levelsof all the remaining factors R (high) recordresult.
3) Repeat #2 until all tests listed are completed.
4) Possible results
a) if both pairs of test - i.e. A (low) R(high) and A (high) R (low) - showresult similar to the result C of the all-low and all-high respectively, thenfactor A, along with it's associatedinteraction effects is unimportant andcan be eliminated.
b) if there is a complete reversal, i.e. if A(low) R (high) becomes the originalall-high level and A (high) R (low)becomes the original all-low level,factor A is a main effect RED X.
c) if either or both pairs of tests, A (low)and A (high) R (low) shows only aslight change in level but not acomplete reversal, factor A alongwith its associated interaction effectscannot be eliminated. Factor A andother factor or factors must beconsidered.
Example:All high All low
QTM - QUALITY TOOLS' MANUAL.
PHILIPS ELECTRONICS SINGAPORE Date : 1st July 2001DAP DIVISION Rev. : 0
20
20
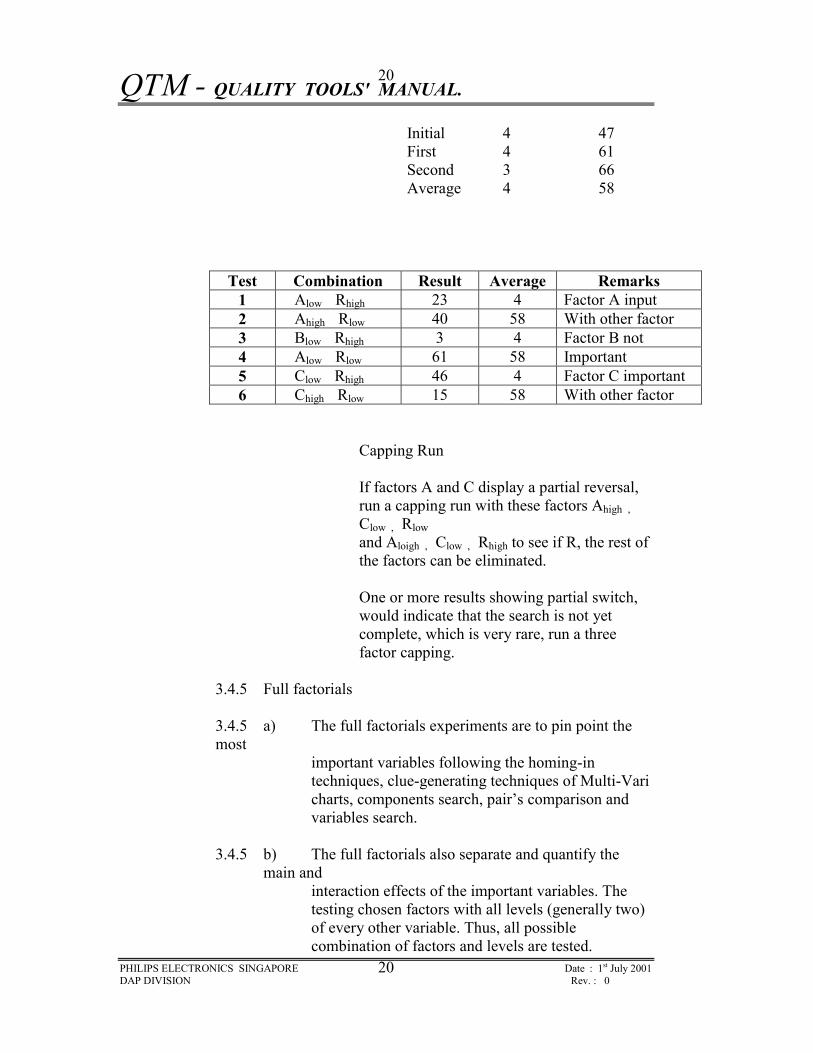
Initial 4 47First 4 61Second 3 66Average 4 58
Test Combination Result Average Remarks1 Alow Rhigh 23 4 Factor A input2 Ahigh Rlow 40 58 With other factor3 Blow Rhigh 3 4 Factor B not4 Alow Rlow 61 58 Important5 Clow Rhigh 46 4 Factor C important6 Chigh Rlow 15 58 With other factor
Capping Run
If factors A and C display a partial reversal,run a capping run with these factors Ahigh ,Clow , Rlow and Aloigh , Clow , Rhigh to see if R, the rest ofthe factors can be eliminated.
One or more results showing partial switch,would indicate that the search is not yetcomplete, which is very rare, run a threefactor capping.
3.4.5 Full factorials
3.4.5 a) The full factorials experiments are to pin point themost
important variables following the homing-intechniques, clue-generating techniques of Multi-Varicharts, components search, pair’s comparison andvariables search.
3.4.5 b) The full factorials also separate and quantify themain and
interaction effects of the important variables. Thetesting chosen factors with all levels (generally two)of every other variable. Thus, all possiblecombination of factors and levels are tested.

QTM - QUALITY TOOLS' MANUAL.
PHILIPS ELECTRONICS SINGAPORE Date : 1st July 2001DAP DIVISION Rev. : 0
21
21
3.4.5 c) The pre-requisites of full factorial.� When there are four or less factors.� Output variable to be measurable.� Two levels to be assigned (-), usually for the
current level and (+) for the better result level.� Know the number of experiments that must be
conducted by
C = LP
Where C = nos. of experiments(combination)
L = nos. of levelP = nos. of factors
Example: If there are 3 factors having 2 levels,how many combinations are there?
L = 2 therefore C = 23
P = 3 =8
3.4.5 d) The procedures for full factorial.
1) Use the factor based on previous homing-inexperiments.
2) Determine two levels of each factor, the first levellabeled (-) is usually, but not necessarily the current level.
The second level, labeled (+) is assumed to producebetter results but again not necessarily so.
3) Draw up a matrix showing the combinations bywhich each factor is tested with each level of everyother factor. Number each cell.

QTM - QUALITY TOOLS' MANUAL.
PHILIPS ELECTRONICS SINGAPORE Date : 1st July 2001DAP DIVISION Rev. : 0
22
22
4) Randomized the sequence of experiments of eachcell, as indicated by the random order table and read theoutput of each cell.
5) Repeat Step #4 using another random order for thesecond test sequence (the full set of experiments canbe repeated for a few times if the experiments is notdifficult to execute).
6) Calculate the average of the readings in each cell.
7) Add all the average readings in each cell where "A"is (-) and all the average cell readings where "A" is(+). The difference between A(-) and A(+) is due tofactor A alone because all other factor …. B, C, andD balance one another i.e. have added, or subtracted,a constant or from both levels thereby not changingthe original differences.
8) Repeat Step #7 for other factors.
9) Construct an Analysis of Variance (ANOVA) table.
10) For the "Factors" column enter the appropriate sign(-) or (+) as appear in the cell number.
11) For the "2 factors interactions", multiplyalgebraically the Signs of A and B in cell #1 and record the sign ofproduct in the AB column. Here A & B are both (-).The product sign for AB is therefore (+).Repeat for the rest of the interactions.
12) In the "output" column, enter the average of theoutputs recorded in each cell.
13) In the last row, assign the signs under column A tothe output column and record the sum under column A.

QTM - QUALITY TOOLS' MANUAL.
PHILIPS ELECTRONICS SINGAPORE Date : 1st July 2001DAP DIVISION Rev. : 0
23
23
14) Repeat Step 13 for the rest of the column.
15) The last row now displays, in precise quantified form
the contribution of each column (main effect, interaction effect) to the total variation.
16) Interpretation of the result from table :
- select from the last row, the top two highestnumbers disregard the sign at this moment ofselection……...The RED X …… interaction betweenthe factors A and B…….. The PINK X ….. interaction betweenthe factors A and D
The main effects of A, B, C and D are relativelysmall compared to the interaction effects.
17) Interaction effect
a) For AB interactionExample: Add all the output of those cellswhen both A and B are (-) i.e. 19 + 4 + 16 +33 which equals to 72.
30
60
90
120
150
180
B+ (11)
B+ (134)B (160)
B 72)
0 A- A+
Repeat for the rest of the interaction, AC, BC, AD, BD and CD

QTM - QUALITY TOOLS' MANUAL.
PHILIPS ELECTRONICS SINGAPORE Date : 1st July 2001DAP DIVISION Rev. : 0
24
24
AD interaction
30
60
90
120
150
180
D+ (71)
D+ (72)
D+ (74)
0 B- B+
30
60
90
120
150
180
D+ (11)
D+ (123)
0 A+ A-
BD Interaction
D- (80)
D+ (65)

QTM - QUALITY TOOLS' MANUAL.
PHILIPS ELECTRONICS SINGAPORE Date : 1st July 2001DAP DIVISION Rev. : 0
25
25
BC Interaction
30
60
90
120
150
180
C+ (61)
C- (144)
0 B- B+
C+ (88)
30
60
90
120
150
180
D+ (71)
C- (111) C- (1174)
0 A- A+
AC Interaction
C+ (95)

QTM - QUALITY TOOLS' MANUAL.
PHILIPS ELECTRONICS SINGAPORE Date : 1st July 2001DAP DIVISION Rev. : 0
26
26
18) The interpretation of the interaction graphs
� From the AB and AD interaction graphs, the bestresults occur when A is (+). This is confirmed inthe last row of table where the value undercolumn A is "-35", indicating that A (-) is worsethan A (+) by 35.
� From the AB interaction, the best results occurwhen B (+), which is also confirmed by the lastrow under B (-87)
� In the BD interaction, the best results appear tobe B (-) and D (+), yet the D (+) slope is muchless steep than the D (-) slope. In such cases, thelower slope i.e. D (+) should be chosen.
CD Interaction
30
60
90
120
150
180
D+ (56)
D- (150)
D- (93)
0 C- C+
D+ (70)
QTM - QUALITY TOOLS' MANUAL.
PHILIPS ELECTRONICS SINGAPORE Date : 1st July 2001DAP DIVISION Rev. : 0
27
27
19) Capping Run
Using the factors derived from the ANOVA table i.e.A(+), B(+), C(+) and D(+) run a test to monitor theresults.
3.4.6 B Vs C
3.4.6 a) In the B Vs C analysis the symbols B and C standsfor two
levels, (+) and (-) of a variable, or two processes or apair of alternate method that need to be compared.
3.4.6 b) C is generally the current © process and B issupposedly a
better (B) processes but they could be also two newprocesses.
3.4.6 c) B Vs C is a non-parametric comparativeexperimentation,
where no assumption of normality is necessary foreither the B or the C process distribution.
3.4.6 d) The term non-parametric is a third form of data observation. In variable data, there is measurementsuch as dimension, where there can be a continuousscale of a vast number of different readings in theattribuite data, there is only 'good' or 'bad' 'pass' or'fail'.
3.4.6 e) In non-parametric data, there are no measurementsas in
variables but only ranking of units from the best toworst.
3.4.6 f) The power of non-parametric ranking is that it takesonly a

QTM - QUALITY TOOLS' MANUAL.
PHILIPS ELECTRONICS SINGAPORE Date : 1st July 2001DAP DIVISION Rev. : 0
28
28
comparison between extremely small sample sizefrom the two processes. … often three from Bprocess and three from C processes, to ensure with ahigh degree of confidence, that one is better than theother.
3.4.6 g) The pre-requisites of B Vs C.
� Final validation of previous techniques that hadisolated the Xs
� Two processes to be validated� Two sets of units, a good and bad to be validated
(pair’s comparison).
3.4.6 h) Significant of End-count
- No overlap end count
1) There are twenty ways which three Bs and three Cscan be ranked in order of these there is only one way out oftwenty in which the three Bs come out on top andthe three Cs are at the bottom.
2) When that happens, the hypothesis of no differenceis rejected. Such a rejection is the objective of B Vs C
test.
3) There is only one in twenty or 5%, risk that 3 Bscome out on top and 3 C's are at the bottom, it is throughchance alone.
4) Concluding that B is better than C represents a onein twenty or 5%, chance or risks. This is known asthe alpha risk.
3.4.6 g) This formula can be use also

QTM - QUALITY TOOLS' MANUAL.
PHILIPS ELECTRONICS SINGAPORE Date : 1st July 2001DAP DIVISION Rev. : 0
29
29
In the case of 3 B’s and 3 C’sthe alpha risk is
3! X 3!= -------- (3 + 3)!
(3 x 2 x 1) + (3 x 2 x 1)= ------------------------------
6 x5 x4 x3 x2 x1
1 = -------
5 x 4
= 1 -----
20
= 0.05 or 5%
No. of combination M is
(nB + nC)!M = ------------------ (nB)! X (nC)!
Where nB = no.s of B samples nC = no.s of C samples l = is a factorial
The alpha risk then is (1/M)
(n[B])! x (nC)!thus 1/M = ------------------ (nB + nC)!

QTM - QUALITY TOOLS' MANUAL.
PHILIPS ELECTRONICS SINGAPORE Date : 1st July 2001DAP DIVISION Rev. : 0
30
30
3.4.7 Scatter Plots
3.4.7 a) After identifying the factors that is causing thevariation in
response (output) the RED X, PINK X ….. teamshould also know how the factor level variation isaffecting the response.
3.4.7 b) Knowing the relationship between the factor leveland the
output will help to establish a realistic tolerance.
3.4.7 c) If there is no relationship between the output and thefactor
is level, then the factor is not important and it's valueand tolerance can be placed at much lessconservative levels that are the most economical.
3.4.7 d) From the above, the output variation observed factor level will be the same at all level. Changing factor's
level will only bring about a change in the average value and does not significantly affect the capability of the output.
3.4.7 e) For this type of correlationship, we would only apply
tolerance control which is usually the leasteconomical control method.
3.4.7 f) From the relationship curve below, it indicate a non-linear
relationship curve. Discovering non-linearrelationship is like finding a pot of gold at the end ofthe rainbow.

QTM - QUALITY TOOLS' MANUAL.
PHILIPS ELECTRONICS SINGAPORE Date : 1st July 2001DAP DIVISION Rev. : 0
31
31
3.4.7 g) The non-linear relationship provide an opportunity to
reduce output variation simply by choosing thecorrect level to run.
3.4.7 h) The most benefit is generally gained by selecting the factors level to coincide with the position on thecurve where the slope is least, or visually where thecurve is flat.
3.4.7. i) Procedure for determining the Realistic Tolerances
1) Select the output to be met. Practically RED X andPINK X etc. will have been pinpoint using earlierDOE methods.
2) Select a range of values for the RED X factor that islikely to fine-tune the output. Run at least 30 such values ofthe RED X and note the corresponding outputvalues. Plot the results.
3) Draw a median line, called the line of regressionthrough the thirty plots. Draw two parallel lines on each sideof the median so as to contain all but one of thethirty points. Draw a vertical line through the centerof the thirty points, to intercept the two externalparallel lines.
The width (between the two external parallel linesand the vertical line) is known as the vertical scatter.
Vertical scatter is a measure of the total contributionto the output of all the variables added together,other than the particular factor X.

QTM - QUALITY TOOLS' MANUAL.
PHILIPS ELECTRONICS SINGAPORE Date : 1st July 2001DAP DIVISION Rev. : 0
32
32
For factor X to be RED X, the vertical scatter mustbe the lowest value. If this intercept is large, thefactor is a PINK X or even PALE PINK X ratherthan RED X.
4) If the output is a customer requirement, or there is a+/- specification (tolerance) limit, plot these pointson the Y axis and draw two lines from their upperspecification intersects the upper boundary of thescatter. Drop two lines from these intersection pointsperpendicular to the X-axis.
5) The horizontal intercept on the X-axis between thesetwo lines determines the maximum tolerancespermitted in order to ensure conformance tospecifications. This would specify a minimum CD ofI.O. Using the pre control rules, the horizontalintercept could be divided into four equal parts andonly the middle half allowed as the preferredtolerance for the RED X. This would ensure aminimum cp of 20. Further, the larger value of theRED X variable should be at the center of thehorizontal intercept.
6) These realistic target values and tolerances for the RED X should be compared against existing values and tolerances and the necessary changes made to ensure zero defects.

Shanghai Best9000 Management Consulting Co., Ltd.
谢宁(Shainin)DOE 工具培训课程大纲
多利安.谢宁(Dorian Shainin)的谢宁(Shainin)DOE 工具作为一个系
统解决问题的方法,具有计算简单、解决问题针对性强、成本低、效果好的优
点。“没有戴明,美国就不会有质量哲学;没有朱兰,美国就不会有质量的方向;
没有谢宁,美国就无从解决质量问题”。这句名言总结了美国最伟大的三位质量
大师的贡献。
谢宁(Shainin)DOE 工具一些原始案例主要是针对产品问题
的,然而国内厂家更加关注工艺过程质量问题,所以本课程重点在
谢宁(Shainin)DOE 工具解决工艺过程质量问题方面的应用。
一.培训目的: 通过本课程的学习, 使学员能掌握谢宁(Shainin)DOE 工
具解决工艺过程质量问题。
二. 培训对象: 产品设计开发人员、工艺设计开发人员、质量人员、管理
质量工程师和现场工程师。
三. 课程内容
谢宁 DOE 简介
过程改进与优化
系统解决问题的方法
制造过程的稳健设计
试验设计简介
过程多层变量图 Multi-Vari Chart
过程多层变差模型
分层法调查表
多层变量图

Shanghai Best9000 Management Consulting Co., Ltd.
多层变量过程分析案例
过程的 B 与 C比较 B vs .C
过程分析工具 :排列图、因果图、KKC&KPC 矩阵
过程的 B 与 C比较
G8D 变化比较法分过程
B 与 C比较过程分析案例
过程的成对比较 Paired Comparisons
好的和坏的过程选取
因果图、KCC&KPC 矩阵
成对比较过程分析案例
过程的搜索 Process Search
工艺方案的确定
过程的搜索确定工艺方案
变量搜索技术 Variables Search
工艺参数的确定
过程的搜索确定工艺参数
6. 全因子实验 Full Factorials
7. 公差设计 Realistic Tolerance Parallelogram
过程工艺参数优化设计和目标值
同步工程
制造过程能力和测量过程能力分析
回归分析确定过程工艺参数上下公差
四. 课程学时: 每天七小时 ,共三天

Shanghai Best9000 Management Consulting Co., Ltd.
正交试验设计培训课程大纲
一.培训目的: 通过本课程的学习, 使学员能掌握 DOE 工具,进行产品、过
程的健壮设计及持续改进。
二. 培训对象: 产品设计开发人员、工艺设计开发人员、质量人员、管理
质量工程师和现场工程师。
三. 课程内容
试验设计发展三个阶段
三次设计 结构设计 参数设计 容差设计
实验设计的目的
实验设计四种方法
试误法
一次一因子实验法
全因子实验法
田口式正交表实验法
田口式正交试验设计
田口式正交表的优点
正交表性质
正交表分类
无交互作用正交表
无交互作用正交表
混合水平正交表
正交试验设计的基本步骤
DOE 案例

Shanghai Best9000 Management Consulting Co., Ltd.
无交互作用正交表案例
无交互作用正交表案例
混合水平正交表案例
DOE 方差分析及案例
MINITAB 软件正交试验设计及案例
田口博士的 S/N 比
三种质量计量方法之比较
望目特性之 S/N 比及案例
望小特性之 S/N 比及案例
原点直线型之 S/N 比及案例
稳健质量设计的原理
质量损失函数之应用
因子效应的混淆及直交表实验的分辨率
实验误差及变差的分解
MINITAB 软件
实验分组(Blocking)
试验随机化(Randomization)
全因子设计
部分因子设计
筛选试验 Plackett - Burman Design
概率图和 Pareto 图
中心组合设计
Box-Behnken 试验设计

Shanghai Best9000 Management Consulting Co., Ltd.
田口正交设计
混料试验设计
DOE 方差分析
四. 课程学时: 每天七小时 ,共三天
培公开课和内训需求请垂询
电话:0510-83709004 传真:0510-83012489
E-mail: [email protected] (无锡)13812264739, (上海)13816949004
质量培训网 www.best9000.com
培训师金舟军简历
姓名:金舟军 网名:jinzhoujun 性别:男 年龄:四十多岁 学历:物理
本科 学士 职称:工程师 国家注册审核员 证书号:2004-1-NQ0117
工作经历
亊从 职工成人教育两年
航天工业部研发工程师及分厂质量主管十二年
咨询公司咨询师和认证公司审核员九年
专业从事
汽车制造行业 TS16949 及其质量工具、六西格玛质量改进工具培训
培训的客户
重庆长安集团、延锋伟世通、NEC、德尔福、德纳、科世达华阳、麦格纳、
生益科技、奥托立夫、马勒发动机、曙光汽车集团、NEC、日立、韩泰轮
胎等。