qr-4 2017 fs dasasfaeif - international-petroleum.com · report of independent registered public...
TRANSCRIPT

Q4Audited ConsolidatedFinancial StatementsFor the years ended December 31, 2017 and 2016
International Petroleum Corporation

International Petroleum Corporation Consolidated Financial Statements For the years ended December 31, 2017 and 2016 AUDITED
2
Contents
Report of Management 3
Report of Independent Registered Public Accounting Firm 4
Consolidated Statement of Operations 6
Consolidated Statement of Comprehensive Income 7
Consolidated Balance Sheet 8
Consolidated Statement of Cash Flow 9
Consolidated Statement of Changes in Equity 10
Notes to the Consolidated Financial Statements 11
International Petroleum Corp. Company No BC1103721
Suite 2000, 885 West Georgia Street Vancouver, BC V6C 3E8 Canada

International Petroleum Corporation Consolidated Financial Statements For the years ended December 31, 2017 and 2016 AUDITED
3
REPORT OF MANAGEMENT The accompanying consolidated financial statements of International Petroleum Corporation (“IPC” or the “Corporation” and, together with its subsidiaries, the “Group”) and other information contained in the management’s discussion and analysis are the responsibility of management and have been approved by the Board of Directors. The consolidated financial statements have been prepared by management in accordance with International Financial Reporting Standards (“IFRS”) as issued by the International Accounting Standards Board (“IASB”) as outlined in Part 1 of the Handbook of the Chartered Professional Accountants of Canada, and include some amounts that are based on management’s estimates and judgment. The Board of Directors carries out its responsibility for the consolidated financial statements principally through its Audit Committee, which is comprised solely of independent directors. The Audit Committee reviews the Group’s annual consolidated financial statements and recommends its approval to the Board of Directors. The Corporation’s auditors have full access to the Audit Committee, with and without management being present. These consolidated financial statements have been audited by PricewaterhouseCoopers AG, Chartered Professional Accountants, Licensed Public Accountants. (Signed) Mike Nicholson (Signed) Christophe Nerguararian Director, President and Chief Executive Officer Chief Financial Officer Vancouver, Canada February 26, 2018

PricewaterhouseCoopers AG, St. Jakobs-Strasse 25, Postfach, CH-4002 Basel, Switzerland Telephone: +41 58 792 51 00, Facsimile: +41 58 792 51 10, www.pwc.ch
PricewaterhouseCoopers AG is a member of the global PricewaterhouseCoopers network of firms, each of which is a separate and independent legal entity.
February 26, 2018
Independent Auditor’s Report To the Shareholders of International Petroleum Corporation
We have audited the accompanying consolidated financial statements of International Petroleum Corporation, which comprise the Consolidated Balance Sheet as at December 31, 2017 and December 31, 2016 and the Consolidated Statement of Operations, Consolidated Statement of Comprehensive Income, Consolidated Statement of Cash Flow and Consolidated Statement of Changes in Equity for the years ended December 31, 2017 and December 31, 2016, and the related notes including a summary of significant accounting policies.
Management’s responsibility for the consolidated financial statements Management is responsible for the preparation and fair presentation of these consolidated financial statements in accordance with International Financial Reporting Standards, and for such internal control as management determines is necessary to enable the preparation of consolidated financial statements that are free from material misstatement, whether due to fraud or error.
Auditor’s responsibility Our responsibility is to express an opinion on these consolidated financial statements based on our audits. We conducted our audits in accordance with Canadian Generally Accepted Auditing Standards. Those standards require that we comply with ethical requirements and plan and perform the audits to obtain reasonable assurance about whether the consolidated financial statements are free from material misstatement.
An audit involves performing procedures to obtain audit evidence about the amounts and disclosures in the consolidated financial statements. The procedures selected depend on the auditor’s judgment, including the assessment of the risks of material misstatement of the consolidated financial statements, whether due to fraud or error. In making those risk assessments, the auditor considers internal control relevant to the entity’s preparation and fair presentation of the consolidated financial statements in order to design audit procedures that are appropriate in the circumstances, but not for the purpose of expressing an opinion on the effectiveness of the entity’s internal control. An audit also includes evaluating the appropriateness of accounting policies used and the reasonableness of accounting estimates made by management, as well as evaluating the overall presentation of the consolidated financial statements.
We believe that the audit evidence we have obtained in our audits is sufficient and appropriate to provide a basis for our audit opinion.
Opinion In our opinion, the consolidated financial statements present fairly, in all material respects, the consolidated balance sheet of International Petroleum Corporation as at December 31, 2017 and December 31, 2016 and its financial performance and its cash flows for the years ended December 31, 2017 and December 31, 2016 in accordance with International Financial Reporting Standards.

Emphasis of Matter We draw attention to the fact that, as described in Note 2 “Basis of Preparation and Significant Accounting Policies” to the financial statements, for the period from January 1, 2016 through April 24, 2017, the oil and gas assets spun off to International Petroleum Corporation were not operated as a separate entity as they formed part of Lundin Petroleum AB. The amounts included in these financial statements related to the period prior to Spin Off are, therefore, not necessarily indicative of results that would have occurred if the oil and gas assets of Lundin Petroleum AB spun off to International Petroleum Corporation had been a separate stand-alone entity during this period. Our opinion is not qualified in respect of this matter.
PricewaterhouseCoopers AG
Stephen Johnson Colin JohnsonCoCoCoCoColililililinnnnn JoJoJoJoJohnhnhnhnhnnnnnnnnnsososososssosssssssss nnnnn

International Petroleum Corporation Consolidated Statement of Operations For the years ended December 31, 2017 and 2016 AUDITED
6
USD Thousands Note 2017 2016
Revenue 4 203,001 209,880
Cost of sales
Production costs 5 (64,437) (59,155)
Depletion and decommissioning costs (54,555) (85,187)
Depreciation of other assets (31,629) (31,073)
Exploration and business development costs (3,786) (14,141)
Impairment costs 164 (125,963)
Gross profit/(loss) 6 48,758 (105,639)
Other income 7 – 4,804
Sale of assets 8 – (3,452)
General, administration and depreciation expenses (10,400) (1,931)
Profit/(loss) before financial items 38,358 (106,218)
Finance income
9 94
19,132
Finance costs 10 (15,001) (3,747)
Net financial items (14,907) 15,385
Profit/(loss) before tax 23,451 (90,833)
Income tax
11 (728) (4,887) Net result 22,723 (95,720)
Net result attributable to:
Shareholders of the Parent Company 22,718 (95,728)
Non-controlling interest 5 8
22,723 (95,720)
Earnings per share – USD1
19
0.23
(0.84)
Earnings per share fully diluted – USD1 19 0.23 (0.84)
1 Based on net result attributable to shareholders of the Parent Company.
See accompanying notes to the consolidated financial statements.

International Petroleum Corporation Consolidated Statement of Comprehensive Income For the years ended December 31, 2017 and 2016 AUDITED
7
USD Thousands 2017 2016
Net result 22,723 (95,720)
Other comprehensive income/(loss):
Items that may be reclassified to profit or loss:
Cash flow hedges 1,292 –
Currency translation adjustments1 (3,374) –
Total comprehensive income/(loss) 20,641 (95,720)
Total comprehensive income/(loss) attributable to:
Shareholders of the Parent Company 20,620 (95,728)
Non-controlling interest 21 8
20,641 (95,720)
1 Currency translation adjustments recognized from Spin-Off date.
See accompanying notes to the consolidated financial statements.

International Petroleum Corporation Consolidated Balance Sheet For the years ended December 31, 2017 and 2016 AUDITED
8
USD Thousands Note December 31, 2017 December 31, 2016
ASSETS
Non-current assets
Exploration and evaluation assets 12 7,380 2,904
Property, plant and equipment, net 13 312,401 317,808 Other tangible fixed assets, net 14 123,051 152,157 Financial assets 5 5 Deferred tax assets 11 12,398 12,049 Total non-current assets 455,235 484,923
Current assets
Inventories 15 24,611 25,067
Trade and other receivables 16 74,794 48,226 Derivative instruments 22 1,372 – Current tax 11 20 406 Cash and cash equivalents 17 33,679 13,410 Total current assets 134,476 87,109
TOTAL ASSETS 589,711 572,032
EQUITY AND LIABILITIES
Shareholders’ equity 307,166 405,348
Non-controlling interest (224) (252) Net shareholders equity / Net parent company investment 306,942 405,096
Non-current liabilities
Financial liabilities 21 59,267 –
Provisions 23 105,887 93,581 Deferred tax liabilities 11 53,943 46,616
Total non-current liabilities 219,097 140,197
Current liabilities
Trade and other payables 24 57,388 22,924
Provisions 23 6,025 3,815 Current tax liabilities 11 259 – Total current liabilities 63,672 26,739
TOTAL EQUITY AND LIABILITIES 589,711 572,032
Approved by the Board of Directors
(Signed) C. Ashley Heppenstall (Signed) Mike Nicholson Director Director See accompanying notes to the consolidated financial statements.

International Petroleum Corporation Consolidated Statement of Cash Flow For the years ended December 31, 2017 and 2016 AUDITED
9
USD Thousands 2017 2016
Cash flow from operating activities
Net result 22,723 (95,720)
Adjustments for non-cash related items: Depletion, depreciation and amortization 87,162 117,510 Exploration costs 917 14,141 Impairment costs (164) 125,963 Current tax 196 (2,199) Deferred tax 532 7,086 Capitalized financing fees 700 – Foreign currency exchange 8,922 (19,070) Interest expense 1,378 8 Result on sale of the Singa field, Indonesia (see Note 8) – 3,452 Changes in estimates 3,674 3,571 Share-based costs (see Note 20) 3,224 – Other (1,058) 1,608 Cash flow generated from operations (before working capital
adjustments and income taxes) 128,206 156,350
Changes in working capital 20,344 (51,790) Income taxes paid 476 4,880 Net cash flow from operating activities 149,026 109,440
Cash flow used in investing activities Investment in oil and gas properties (23,077) (34,905) Investment in other fixed assets (546) 1,724 Deposit for business acquisition (see Note 16) (32,632) – Decommissioning costs paid (5,169) (9,710) Disposal of fixed assets – 23,770 Other payments – (206) Net cash (outflow) from investing activities (61,424) (19,327)
Cash flow from financing activities Borrowings 120,000 Repayments of borrowings (60,000) – Paid financing fees (1,391) –
Cash funded from / (to) Lundin Petroleum (31,394) (102,774)
Share purchase (90,632) –
Net cash (outflow) from financing activities (63,417) (102,774)
Change in cash and cash equivalents 24,185 (12,661)
Cash and cash equivalents at the beginning of the period 13,410 29,488 Currency exchange difference in cash and cash equivalents (3,916) (3,417) Cash and cash equivalents at the end
of the period 33,679 13,410
See accompanying notes to the consolidated financial statements.

International Petroleum Corporation Consolidated Statement of Changes in Equity For the years ended December 31, 2017 and 2016 AUDITED
10
USD Thousands
Parental
investment
Share
capital
Share
premium
Retained
earnings
Non-
controlling
interest
IFRS 2
reserve
MTM
reserve CTA Total
Balance at January 1, 2016 603,850 – – – (260) – – – 603,590
Parent Company net investment/(proceeds) (102,774) – – – – – – – (102,774)
Net result prior to Spin-Off (95,728) – – – 8 – – – (95,720)
Balance at December 31, 2016 405,348 – – – (252) – – – 405,096
Parent Company net investment/(proceeds) (31,394) – – – 7 – – – (31,387)
Net result prior to Spin-Off (3,362) – – – 9 – – – (3,353)
Balance at Spin-Off date 370,592 – – – (236) – – – 370,356
Formation of the Corporation (410,000) 86,342 323,658 – – – – – –
Valuation adjustments1
39,408 – (39,408) – – – – – –
Net result after formation of the Corporation
–
–
– 26,080 (4)
– –
–
26,076
Cash flow hedge
–
–
– – – – 1,292 – 1,292
Other comprehension income – – – – 16 231 80 (3,701) (3,374) Purchase and cancellation of common shares
–
(19,436)
(71,196)
–
–
–
–
–
(90,632)
Share based payments2
– – – – – 3,224 – – 3,224
Balance at December 31, 2017 – 66,906 213,054 26,080 (224) 3,455 1,372 (3,701) 306,942
1 Arises due to the use of the predecessor basis method of accounting. 2 See Note 20.

International Petroleum Corporation Notes to the Consolidated Financial Statements For the years ended December 31, 2017 and 2016 AUDITED
11
1. CORPORATE INFORMATION
In February 2017, Lundin Petroleum AB (“Lundin Petroleum“) announced its intention to spin-off its oil and gas assets in Malaysia, France and the Netherlands into a newly formed company called International Petroleum Corporation (“IPC” or the “Corporation” and, together with its subsidiaries, the “Group”) and to distribute the IPC shares, on a pro-rata basis, to Lundin Petroleum shareholders (the “Spin-Off”).
IPC acquired the Malaysian, French and Dutch assets through a series of reorganization transactions completed on April 7, 2017. On April 24, 2017, the Spin-Off was completed and IPC’s shares commenced trading on the Toronto Stock Exchange and Nasdaq First North under the ticker symbol “IPCO”. The Corporation is incorporated and domiciled in British Columbia, Canada under the Business Corporations Act. The address of its registered office is Suite 2600, Three Bentall Centre, 595 Burrard Street, P.O. Box 49314, Vancouver, BC V7X 1L3, Canada.
2. BASIS OF PREPARATION AND SIGNIFICANT ACCOUNTING POLICIES
A. Basis of preparation
The consolidated financial statements have been prepared in accordance with International Financial Reporting Standards (“IFRS”) as issued by the International Accounting Standards Board (“IASB”). The financial statements include the accounts of the Group from the Spin-Off date of April 24, 2017 and also incorporate the carve-out combined financial statements of IPC as if it had operated as a stand-alone entity prior to this date – see section ‘Basis of Preparation Prior to the Spin-Off date’ below.
These consolidated financial statements are presented in United States Dollars (USD), which is the Group’s presentation and functional currency. The consolidated financial statements have been prepared on a historical cost basis, except for items that are required to be accounted for at fair value as detailed In the Group’s accounting policies. Intercompany transactions and balances have been eliminated. Basis of preparation prior to the Spin-Off date Prior to the Spin-Off date, separate financial statements were not prepared for the assets that were spun-off as they were not operated as a single business by Lundin Petroleum AB and accordingly, the results up until the Spin-Off date have been carved out from the historical consolidated financial statements of Lundin Petroleum AB. The carve-out combined financial statements for 2016 and the operating results for 2017 prior to the Spin-Off date have been derived from the accounting records of Lundin Petroleum on a carve-out basis and should be read in conjunction with Lundin Petroleum’s annual consolidated financial statements and the notes thereto for the year ended December 31, 2016 and Lundin Petroleum’s subsequently published quarterly reports for 2017.
As the carve-out combined financial statements for 2016 and the 2017 results up to the Spin-Off date represent portions of Lundin Petroleum’s business, which were not previously organized into a single legal entity, the net assets of IPC have been reflected as a Parent Company net investment up to the Spin-Off date.
The majority of the assets and liabilities in the carve-out combined statements of balance sheet of IPC have been derived from the following legal entities which were historically a part of Lundin Petroleum before the Spin-Off:
- Lundin Services Limited - IPC Netherlands BV (formerly known as Lundin Netherlands BV) - IPC Netherlands Facilities BV (formerly known as Lundin Netherlands Facilities BV) - IPC Petroleum Holdings SA (formerly known as Lundin Holdings SA) - IPC Petroleum France SA (formerly known as Lundin International SA) - IPC Petroleum Gascogne SNC (formerly known as Lundin Gascogne SNC) - IPC Malaysia BV (formerly known as Lundin Malaysia BV).

International Petroleum Corporation Notes to the Consolidated Financial Statements For the years ended December 31, 2017 and 2016 AUDITED
12
In addition, the activities of International Petroleum BV (formerly known as Lundin Petroleum BV) which relate to the Malaysia, France and the Netherlands oil and gas businesses acquired by IPC from Lundin Petroleum and the legacy non-producing interests and non-active entities transferred as part of the reorganization have been included in these financial statements to the extent separately identifiable.
The preparation of financial statements requires management to make certain estimates and assumptions, either at the balance sheet date or during the year that affect the reported amounts of assets or liabilities as well as expenses. Actual outcomes and results could differ from those estimates and assumptions. In particular due to the fact that the presented historical combined financial information for 2016 and operating results for 2017 up to the Spin-Off date have been extracted from Lundin Petroleum's financial information the following has to be considered:
- In the past, the business of IPC did not form a separate legal company. Therefore it is not possible to provide an
analysis of share capital and reserves. The Corporation’s invested capital in these combined financial statements represents the excess of total assets over total liabilities. Net parent company investment primarily represents the contributions from Lundin Petroleum prior to the Spin-Off. The net assets of the Group are represented by the cumulative investment of Lundin Petroleum prior to the Spin-Off in the business (presented as "net parent company investment").
- Prior to the Spin-Off, all funding of the Group came from Lundin Petroleum. These historical funding costs of Lundin
Petroleum are not allocated to the operations and have therefore not been reflected in the combined income statement or combined balance sheet.
B. Going concern
The Group’s consolidated financial statements for the year ended December 31, 2017 have been prepared on a going concern basis, which assumes that the Group will be able to realize its assets and discharge its liabilities in the normal course of business as they become due in the foreseeable future.
C. Changes in accounting policies and disclosures
There are no IFRS or interpretations that have been issued effective for financial years beginning on or after January 1, 2017, that would have a material impact on the Group’s consolidated financial statements.
D. Future accounting changes
Accounting standards that have been previously issued by the International Accounting Standards Board (“IASB”) but are not yet effective, and have not been applied by the Corporation, include International Financial Reporting Standards (“IFRS”) 9 “Financial Instruments”, IFRS 15 “Revenue from Contracts with Customers” and IFRS 16 “Leases”.
IFRS 9 “Financial Instruments” IFRS 9 will replace IAS 39 “Financial Instruments: Recognition and Measurement”. IFRS 9 introduces a revised model for classification and measurement, a forward-looking “expected loss” impairment model and a substantially reformed approach to hedge accounting. IFRS 9 is effective for annual periods beginning on or after January 1, 2018, with earlier adoption permitted. The Group plans to adopt the standard beginning January 1, 2018. The Group has reviewed its financial assets and liabilities and has made the following conclusions from the adoption of the new standard on January 1, 2018: - There will be no impact on the Group’s accounting for financial liabilities, as the new requirements only affect the
accounting for financial liabilities that are designated at fair value through profit or loss and the Group does not have any such liabilities. The derecognition rules have been transferred from IAS 39 Financial Instruments: Recognition and Measurement and have not been changed.
- The new hedge accounting rules will align the accounting for hedging instruments more closely with risk management
practices. The Group has confirmed that its current hedge relationships will qualify as continuing hedges upon the adoption of IFRS 9.
- The new impairment model requires the recognition of impairment provisions based on expected credit losses (ECL) rather than only incurred credit losses as is the case under IAS 39. It applies to financial assets classified at amortised cost, debt instruments measured at Fair Value through other comprehensive income (FVOCI), contract assets under IRS 15, lease receivables, loan commitments and certain financial guarantee contracts. Based on the assessments undertaken to date, the Group expects an immaterial increase in the loss allowance for trade debtors. A preliminary assessment has been made and it is anticipated that there will be no material change as a result of adopting this new standard.

International Petroleum Corporation Notes to the Consolidated Financial Statements For the years ended December 31, 2017 and 2016 AUDITED
13
IFRS 15 “Revenue from Contracts with Customers” IFRS 15 provides guidance on the nature, amount, timing and uncertainty of revenue and cash flows arising from a contract with a customer. The effective date of the standard is January 1, 2018, with earlier adoption permitted. The Group plans to adopt the standard beginning January 1, 2018. The Group has reviewed its revenue contracts and has made a preliminary assessment and does not expect any material effect on the financial statements with respect to the application of IFRS 15. IFRS 16 “Leases”
IFRS 16 will result in almost all leases being recognized on the balance sheet, as the distinction between operating and finance leases is removed. Under the new standard, an asset (the right to use the leased item) and a financial liability to pay rentals are recognized. The only exceptions are short-term and low-value leases. Application of the standard is mandatory for annual reporting periods beginning on or after January 1, 2019, with early adoption permitted. The Group does not intend to adopt the standard before its effective date. The standard will affect primarily the accounting for the Group’s operating leases. As at the reporting date, the group has no material non-cancellable operating lease commitments. A preliminary assessment has been made and it is anticipated that there will be no material change as a result of adopting this new standard.
E. Basis of Consolidation Subsidiaries Subsidiaries are all entities over which the Group has control and are consolidated. The Corporation controls an entity when it is exposed to, or has rights to, variable returns from its involvement with the entity and has the ability to affect those returns through its power over the entity. The non-controlling interest in a subsidiary represents the portion of the subsidiary not owned by Group companies. The equity of the subsidiary relating to the non-controlling shareholders is shown as a separate item within changes in net equity. Inter-company transactions, balances, income and expenses on transactions between companies are eliminated. Profits and losses resulting from intercompany transactions that are recognized in assets are also eliminated.
F. Joint Arrangements Oil and gas operations of the Group are conducted as co-licencees in unincorporated joint ventures with other companies and are classified as joint operations. The consolidated financial statements reflect the relevant proportions of production, capital costs, operating costs and current assets and liabilities of the joint operation applicable to the Corporations’ interests.
G. Foreign Currency Translation Transactions and balances Monetary assets and liabilities denominated in foreign currencies are translated at the rates of exchange prevailing at the balance sheet date and foreign exchange currency differences are recognized in the consolidated statement of operations. Transactions in foreign currencies are translated at exchange rates prevailing at the transaction date. Foreign exchange gains and losses are presented within finance income and costs in the consolidated statement of operations. Functional and presentation currency Items included in the financial statements of each of the operational entities are measured using the currency of the primary economic environment in which the entity operates (the “functional currency”). The functional currency of the Corporation’s operational entities are the EUR and USD. The consolidated financial statements are presented in USD which is the Corporation’s presentation currency. The balance sheets and income statements of foreign companies are translated using the current rate method. All assets and liabilities are translated at the balance sheet date rates of exchange, whereas the income statements are translated at average rates of exchange for the year, except for transactions where it is more relevant to use the rate of the day of the transaction. The translation differences which arise are recorded directly in net assets.

International Petroleum Corporation Notes to the Consolidated Financial Statements For the years ended December 31, 2017 and 2016 AUDITED
14
For the preparation of the financial statements, the following currency exchange rates have been used.
December 31, 2017 December 31, 2016 Average Period end Average Period end
1 EUR equals USD 1.1293 1.1993 1.1066 1.0541
1 USD equals CAD 1.2982 1.2540 1.3256 1.3460
1 USD equals MYR 4.2994 4.0470 4.1455 4.4860
H. Classification of assets and liabilities Non-current assets, long-term liabilities and provisions consist of amounts that are expected to be recovered or paid more than twelve months after the balance sheet date. Current assets and current liabilities consist solely of amounts that are expected to be recovered or paid within twelve months after the balance sheet date.
I. Oil and gas properties Oil and gas properties are recorded at historical cost less depletion. All costs for acquiring concessions, licences or interests in production sharing contracts and for the survey, drilling and development of such interests are capitalized on a field area cost centre basis. Costs directly associated with an exploration well are capitalized until the determination of reserves is evaluated. If it is determined that a commercial discovery has not been achieved, these exploration costs are charged to the income statement. During the exploration and development phases, no depletion is charged. The field will be transferred from the non-producing assets to the producing assets within oil and gas properties once production commences, and accounted for as a producing asset. Routine maintenance and repair costs for producing assets are expensed to the income statement when they occur. Net capitalized costs to reporting date, together with anticipated future capital costs for the development of the proved and probable reserves determined at the balance sheet date price levels, are depleted based on the year’s production in relation to estimated total proved and probable reserves of oil and gas in accordance with the unit of production method. Depletion of a field area is charged to the income statement through cost of sales once production commences. Proved reserves are those quantities of petroleum which, by analysis of geological and engineering data, can be estimated with reasonable certainty to be commercially recoverable, from a given date forward, from known reservoirs and under current economic conditions, operating methods and governmental regulations. Proved reserves can be categorised as developed or undeveloped. If deterministic methods are used, the term reasonable certainty is intended to express a high degree of confidence that the quantities will be recovered. If probabilistic methods are used, there should be at least a 90 percent probability that the quantities actually recovered will equal or exceed the estimates. Probable reserves are those unproved reserves which analysis of geological and engineering data suggests are more likely than not to be recoverable. In this context, when probabilistic methods are used, there should be at least a 50 percent probability that the quantities actually recovered will equal or exceed the sum of estimated proved plus probable reserves. Proceeds from the sale or farm-out of oil and gas concessions in the exploration stage are offset against the related capitalized costs of each cost centre with any excess of net proceeds over all costs capitalized included in the income statement. In the event of a sale in the exploration stage, any deficit is included in the income statement. Impairment tests are performed annually or when there are facts and circumstances that suggest that the net book value of capitalized costs within each field area cost centre less any provision for asset retirement obligation costs, royalties and deferred production or revenue related taxes is higher than the anticipated future net cash flow from oil and gas reserves attributable to the Corporation’s interest in the related field areas. Capitalized costs cannot be carried unless those costs can be supported by future cash flows from that asset. Provision is made for any impairment, where the net carrying value, according to the above, exceeds the recoverable amount, which is the higher of value in use and fair value less costs of disposal, determined through estimated future discounted net cash flows using prices and cost levels used by management in their internal forecasting. If there is no decision to continue with a field specific exploration program, the costs will be expensed at the time the decision is made. .

International Petroleum Corporation Notes to the Consolidated Financial Statements For the years ended December 31, 2017 and 2016 AUDITED
15
J. Other property, plant and equipment Other property, plant and equipment are stated at cost less accumulated depreciation. The cost includes the original purchase price of the asset and the costs attributable to bringing the asset to its working condition for its intended use. Depreciation is based on cost and is calculated on a straight line basis over the estimated economic life of 3 to 5 years for office equipment and other assets. The Floating Production Storage and Offloading (“FPSO”) located on the Bertam field, Malaysia, is being depreciated over the committed contract term. Additional costs to existing assets are included in the assets’ net book value or recognized as a separate asset, as appropriate, only when it is probable that future economic benefits associated with the item will flow to the Group and the cost of the item can be measured reliably. The net book value of any replaced parts is written off. Other additional expenses are deemed to be repair and maintenance costs and are charged to the income statement when they are incurred. The net book value is written down immediately to its recoverable amount when the net book value is higher. The recoverable amount is the higher of an asset’s fair value less cost of disposal and value in use. The assets’ residual values and useful lives are reviewed, and adjusted if appropriate, at the end of each reporting period.
K. Impairment of Assets At each balance sheet date, an assessment is made as to whether there is an indication that an asset may be impaired. Where an indicator of impairment exists or when impairment testing for an asset is required, the formal assessment of the recoverable amount is made. Where the carrying value of an asset exceeds its recoverable amount the asset is considered impaired and is written down to its recoverable amount. The recoverable amount is the higher of fair value less costs of disposal and value in use. In determining fair value less costs of disposal, recent market transactions are considered, if available. In the absence of such transactions, an appropriate valuation model is used. Value in use is calculated by discounting estimated future cash flows to their present value using a discount rate that reflects current market assessments of the time value of money and the risks specific to the asset. When the recoverable amount is less than the carrying value an impairment loss is recognized with the expensed charge to the income statement. If indications exist that previously recognized impairment losses no longer exist or are decreased, the recoverable amount is estimated. When a previously recognized impairment loss is reversed the carrying amount of the asset is increased to the estimated recoverable amount but the increased carrying amount may not exceed the carrying amount after depreciation that would have been determined had no impairment loss been recognized for the asset in prior years. If the asset does not generate cash inflows that are largely independent of those from other assets or groups of assets, the asset is tested as part of a CGU, which is the smallest identifiable group of assets that generates cash inflows that are largely independent of the cash inflows from other assets or groups of assets. An impairment loss is the amount by which the carrying amount of the individual asset or CGU exceeds its recoverable amount.
L. Financial Instruments Financial instruments are recognized on the consolidated balance sheet on the trade date, the date on which a Group company becomes a party to the contractual provisions of the financial instrument. All financial instruments are required to be classified and measured at fair value on initial recognition. Measurement in subsequent periods is dependent upon the classification of the financial instrument. The Group classifies its financial instruments in the following categories: Loans and receivables Loans and receivables are carried at amortized cost using the effective interest method less provision for impairment. Translation differences are reported in the income statement except for the translation differences arising from long-term loans to subsidiaries, used for financing exploration activities and for which no fixed terms of repayment exists, which are recorded directly in other comprehensive income.
Financial liabilities at amortized cost Financial liabilities are measured at amortized cost using the effective interest method. Bank debt and long-term debt are recognized initially at fair value, net of any transaction costs incurred, and subsequently at amortized cost using the effective interest method. The effective interest method is a method of calculating the amortized cost of a financial liability and of allocating interest expense over the relevant period. The effective interest rate is the rate that exactly discounts estimated future cash payments through the expected life of the financial liability, or (where appropriate) a shorter period, to the net carrying amount on initial recognition.

International Petroleum Corporation Notes to the Consolidated Financial Statements For the years ended December 31, 2017 and 2016 AUDITED
16
M. Derivative Financial Instruments and Hedging Activities
Derivatives are initially recognized at fair value on the date a derivative contract is entered into and are subsequently remeasured to their fair value. The method of recognizing the resulting gain or loss depends on whether the derivative is designated as a hedging instrument, and if so, the nature of the item being hedged. The Group designates certain derivatives as either hedges of a particular risk associated with a recognized asset or liability or a highly probable forecasted transaction, hedges of the fair value of recognized assets and liabilities or a firm commitment, or hedges of a net investment in a foreign operation. The Group documents at the inception of the transaction the relationship between hedging instruments and the hedged items, as well as its risk management objectives and strategy for undertaking various hedging transactions. The Group also documents its assessment, both at hedge inception and on an ongoing basis, of whether the derivatives that are used in hedging transactions are highly effective in offsetting changes in fair values or cash flows of the hedged items. The fair values of various derivative financial instruments used for hedging purposes are disclosed in Note 22. Movements on the hedging reserve in other comprehensive income. The full fair value of a hedging derivative is classified as a non-current asset or liability when the remaining maturity of the hedged item is more than twelve months and as a current asset or liability when the remaining maturity of the hedged item is less than twelve months. Cash flow hedge The effective portion of changes in the fair value of derivatives that are designated and qualify as cash flow hedges is recognized in other comprehensive income. The gain or loss relating to the ineffective portion is recognized immediately within finance income or costs. Amounts accumulated in equity are reclassified to profit or loss in the periods when the hedged item affects profit or loss. When a hedging instrument expires or is sold, or when a hedge no longer meets the criteria for hedge accounting, any cumulative gain or loss existing in equity at that time remains in equity and is recognized when the forecast transaction is ultimately recognized in the profit or loss. When a forecasted transaction is no longer expected to occur, the cumulative gain or loss that was reported in equity is immediately recognized in profit or loss as finance income or costs.
N. Inventories
Inventories of consumable well supplies are stated at the lower of cost and net realisable value, cost being determined on a weighted average cost basis. Net realisable value is the estimated selling price in the ordinary course of business, less applicable variable selling expenses. Inventories of hydrocarbons are stated at the lower of cost and net realisable value. Under or overlifted positions of hydrocarbons are valued at market prices prevailing at the balance sheet date. An underlift of production from a field is included in the current receivables and valued at the reporting date spot price or prevailing contract price and an overlift of production from a field is included in the current liabilities and valued at the reporting date spot price or prevailing contract price. A change in the over or underlift position is reflected in the income statement as revenue.
O. Cash and cash equivalents Cash and cash equivalents include cash at bank and cash in hand.
P. Provisions A provision is reported when the Group has a legal or constructive obligation as a consequence of an event and when it is more likely than not that an outflow of resources is required to settle the obligation and a reliable estimate can be made of the amount. Provisions are measured at the present value of the expenditures expected to be required to settle the obligation using a discount rate that reflects current market assessments of the time value of money and the risks specific to the obligation. The increase in the provision due to passage of time is recognized as financial expense. On fields where there is an obligation to contribute to asset retirement obligation costs, a provision is recorded to recognize the future commitment. An asset is created, as part of the oil and gas property, to represent the discounted value of the anticipated asset retirement obligation liability and depleted over the life of the field on a unit of production basis. The corresponding accounting entry to the creation of the asset recognizes the discounted value of the future liability. The discount applied to the anticipated asset retirement obligation liability is subsequently released over the life of the field and is charged to financial expenses. Changes in asset retirement obligation costs and reserves are treated prospectively and consistent with the treatment applied upon initial recognition.
International Petroleum Corporation Notes to the Consolidated Financial Statements For the years ended December 31, 2017 and 2016 AUDITED
17
Q. Revenue and Other Operating Revenue Sales of oil and gas are recognized in the income statement upon delivery of products and customer acceptance or on performance of services. Production and sales taxes directly attributable to fields, including export duties, are expensed in the income statement and classified as direct production taxes included within production costs. Production taxes payable in cash are accrued in the accounting period in which the liability arises. The Group recognizes revenue from the FPSO in other operating revenue as earned from third party participants in the Bertam field, Malaysia. Other operating revenue also includes pipeline tariffs earned.
R. Employee Benefits
Short-term employee benefits Short-term employee benefits such as salaries, social premiums and holiday pay, are expensed when incurred. Pension obligations The pension obligations consist of defined contribution plans. A defined contribution plan is a pension plan under which the Group pays fixed contributions. The Group has no further payment obligations once the contributions have been paid. The contributions are recognized as an expense when they are due. Share-based payments The Group operates an equity-settled, share-based compensation plan under which the entity receives services from employees, directors and officers as consideration for equity instruments of the Corporation. Equity-settled share-based payments are recognized in the income statement as expenses during the vesting period and as equity in the balance sheet. The option is measured at fair value at the date of the grant using an appropriate options pricing model and is charged to the income statement over the vesting period without revaluation of the value of the option.
S. Taxation The components of tax are current and deferred. Tax is recognized in the income statement, except to the extent that it relates to items recognized in other comprehensive income or directly in equity, in which case it is accounted for consistently with the related item. Current tax is tax that is to be paid or received for the year in question and also includes adjustments of current tax attributable to previous periods. Deferred income tax is a non-cash charge provided, using the liability method, on temporary differences arising between the tax bases of assets and liabilities and their carrying values. Temporary differences can occur for example where investment expenditure is capitalized for accounting purposes but the tax deduction is accelerated or where asset retirement obligation costs are provided for in the financial statements but not deductible for tax purposes until they are actually incurred. However, the deferred income tax is not accounted for if it arises from initial recognition of an asset or liability in a transaction other than a business combination that at the time of the transaction affects neither accounting nor taxable profit nor loss. Deferred income tax is provided on temporary differences arising on investments in subsidiaries and associates, except where the timing of the reversal of the temporary difference is controlled by the Corporation and it is probable that the temporary difference will not reverse in the foreseeable future. Deferred income tax is determined using tax rates (and laws) that have been enacted or substantively enacted by the balance sheet date and are expected to apply when the related deferred income tax asset is realized or the deferred income tax liability is settled. Deferred income tax assets are recognized to the extent that it is probable that future taxable profit will be available against which the temporary differences can be utilized. Deferred tax assets are offset against deferred tax liabilities in the balance sheet where they relate to the same jurisdiction.
T. Segment Reporting Operating segments are reported in a manner consistent with the internal reporting provided to the chief operating decision maker, which, due to the unique nature of each country’s operations, commercial terms or fiscal environment, is at a country level.

International Petroleum Corporation Notes to the Consolidated Financial Statements For the years ended December 31, 2017 and 2016 AUDITED
18
U. Business combinations
Acquisitions of businesses are accounted for using the purchase method of accounting whereby all identifiable assets and liabilities are recorded at their fair values as at the date of acquisition. Any excess purchase price over the aggregate fair value of net assets is recorded as goodwill. Goodwill is identified and allocated to cash-generating units (“CGU”), or groups of CGUs, that are expected to benefit from the synergies of the acquisition. Goodwill is not amortized. Any excess of the aggregate fair value of net assets over the purchase price is recognized in the consolidated statement of earnings. A CGU to which goodwill has been allocated is tested for impairment at least annually or when events or circumstances indicate that an assessment for impairment is required. For goodwill arising on an acquisition in a financial year, the CGU to which the goodwill has been allocated is tested for impairment before the end of that financial year. When the recoverable amount of the CGU is less than the carrying amount of that CGU, the impairment loss is allocated to reduce the carrying amount of any goodwill allocated to that CGU first, and then to the other assets of that CGU pro rata on the basis of the carrying amount of each asset in the CGU. Any impairment loss for goodwill is recognized directly in the consolidated statement of earnings. An impairment loss for goodwill is not reversed in subsequent periods. On disposal of a subsidiary, the attributable amount of goodwill is included in the determination of the gain or loss on disposal.
3. CRITICAL ACCOUNTING ESTIMATES AND JUDGMENTS In connection with the preparation of the consolidated financial statements, the Group’s management has made assumptions and estimates about future events and applied judgments that affect the reported values of assets, liabilities, revenues, expenses and related disclosures. The assumptions, estimates and judgments are based on historical experience, current trends and other factors that management believes to be relevant at the time the consolidated financial statements are prepared. On a regular basis, management reviews the accounting policies, assumptions, estimates and judgments to ensure that the consolidated financial statements are presented fairly in accordance with IFRS. However, because future events and their effects cannot be determined with certainty, actual results could differ from these assumptions and estimates, and such differences could be material. Management believes the following critical accounting policies affect the more significant judgments and estimates used in the preparation of the consolidated financial statements: Estimates in oil and gas reserves Estimates of oil and gas reserves are used in the calculations for impairment tests and accounting for depletion and asset retirement obligation. Standard recognized evaluation techniques are used to estimate the proved and probable reserves. These techniques take into account the future level of development required to produce the reserves. An independent qualified reserves auditor reviews these estimates. Changes in estimates in oil and gas reserves, resulting in different future production profiles, will affect the discounted cash flows used in impairment testing, the anticipated date of site decommissioning and restoration and the depletion charges in accordance with the unit of production method. Changes in estimates in oil and gas reserves could for example result from additional drilling, observation of long-term reservoir performance or changes in economic factors such as oil price and inflation rates. Impairment of oil and gas properties Key assumptions in the impairment models relate to prices and costs that are based on forward curves and the long-term corporate assumptions. Annual impairment tests are performed in conjunction with the annual reserves certification process. The calculation of the impairment requires the use of estimates. For the purpose of determining a potential impairment, the assumptions that management uses to estimate the future cash flows for value-in-use are future oil and gas prices and expected production volumes. These assumptions and judgements of management that are based on them are subject to change as new information becomes available. Changes in economic conditions can also affect the rate used to discount future cash flow estimates and the discount rate applied is reviewed throughout the year.

International Petroleum Corporation Notes to the Consolidated Financial Statements For the years ended December 31, 2017 and 2016 AUDITED
19
Provision for asset retirement obligations Amounts used in recording a provision for asset retirement obligations are estimates based on current legal and constructive requirements and current technology and price levels for the removal of facilities and decommissioning. Due to changes in relation to these items, the future actual cash outflows in relation to the site decommissioning and restoration can be different. To reflect the effects due to changes in legislation, requirements and technology and price levels, the carrying amounts of asset retirement obligation provisions are reviewed on a regular basis. Deferred income tax assets The Group accounts for differences that arise between the carrying amount of assets and liabilities and their tax bases in accordance with IAS 12, Income Taxes, which requires deferred income tax assets only to be recognized to the extent that is probable that future taxable profits will be available against which the temporary differences can be utilized. Management estimates future taxable profits based on the financial models used to value its oil and gas properties. Any change to the estimates and assumptions used for the key operational and financial variables used within the business models could affect the amount of deferred income tax assets recognized.
The effects of changes in estimates do not give rise to prior year adjustments and are treated prospectively over the estimated remaining commercial reserves of each field. While the Group uses its best estimates and judgement, actual results could differ from these estimates.

International Petroleum Corporation Notes to the Consolidated Financial Statements For the years ended December 31, 2017 and 2016 AUDITED
20
4. REVENUE
USD Thousands 2017 2016
Crude oil 169,881 165,752
Condensate 338 447
Gas 14,963 24,517
Net sales of oil and gas 185,182 190,716
Change in under/over lift position (613) 217
Other operating revenue 18,432 18,947
Revenue 203,001 209,880
5. PRODUCTION COSTS
USD Thousands 2017 2016
Cost of operations 53,389 52,905
Tariff and transportation expenses 3,361 3,943
Direct production taxes 3,999 3,301
Operating costs 60,749 60,149
Change in inventory position 3,688 (994)
Total production costs 64,437 59,155
6. SEGMENT INFORMATION
The Group operates within several geographical areas. Operating segments are reported at a country level which is consistent with the internal reporting provided to the CEO, who is the chief operating decision maker.
The following tables present segment information regarding: revenue, production costs, exploration and evaluation costs, impairment costs of oil and gas properties and gross profit. In addition certain identifiable asset segment information is reported in Notes 12 and 13. 2017
USD Thousands Malaysia France Netherlands Other Total
Crude oil 122,595 47,238 48 – 169,881
NGLs – – 338 – 338
Gas – – 14,963 – 14,963
Net sales of oil and gas 122,595 47,238 15,349 – 185,182
Change in under/over lift position – 66 (679) – (613)
Other operating revenue 15,513 1,099 1,472 348 18,432
Revenue 138,108 48,403 16,142 348 203,001
Production costs (30,393) (26,118) (7,926) – (64,437)
Depletion and decommissioning costs (34,228) (13,581) (6,746) – (54,555)
Depreciation of other assets (31,629) – – – (31,629)
Exploration and business development costs 346 (1,263) – (2,869) (3,786)
Impairment costs 164 – – – 164
Gross profit/(loss) 42,368 7,441 1,470 (2,521) 48,758

International Petroleum Corporation Notes to the Consolidated Financial Statements For the years ended December 31, 2017 and 2016 AUDITED
21
2016 USD Thousands Malaysia France Netherlands Other 1
Total
Crude oil 125,823 39,887 42 – 165,752
NGLs – – 447 – 447
Gas – – 15,248 9,269 24,517
Net sales of oil and gas 125,823 39,887 15,737 9,269 190,716
Change in under/over lift position – 391 (174) – 217
Other operating revenue 15,110 1,187 1,721 929 18,947
Revenue 140,933 41,465 17,284 10,198 209,880
Production costs (27,343) (20,507) (9,947) (1,358) (59,155)
Depletion and decommissioning costs (61,086) (14,380) (9,721) – (85,187)
Depreciation of other assets (31,073) – – – (31,073)
Exploration and business development costs (13,053) (51) (1,339) 302 (14,141)
Impairment costs 2 (125,963) – – – (125,963)
Gross profit/(loss) (117,585) 6,527 (3,723) 9,142 (105,639)
1 Mainly relates to the Singa field, Indonesia, which was sold in April 2016. 2 Mainly relates to Malaysian exploration and appraisal activity expenditures.
Assets Liabilities
USD Thousands 2017 2016 2017 2016
Malaysia 307,334 343,649 293,864 465,976
France 264,266 220,757 147,251 121,719
Netherlands 87,078 74,993 50,046 45,064
Canada 3,512 – 14,873 –
Corporate 180,196 716,908 94,069 146,395
Other 69,826 63,063 5,167 235,120
Intercompany balance elimination (322,501) (847,338) (322,501) (847,338)
Total Assets / Liabilities 589,711 572,032 282,769 166,936
Shareholders equity N/A N/A 307,166 405,348
Non-controlling interest N/A N/A (224) (252)
Total equity for the group N/A N/A 306,942 405,096
Total consolidated 589,711 572,032 589,711 572,032
7. OTHER INCOME
USD Thousands 2017 2016
Other income – 4,804
– 4,804
Other income relates to a final settlement of a 2007 legal dispute in France which was accrued in 2016 and received in full in January 2017.
International Petroleum Corporation Notes to the Consolidated Financial Statements For the years ended December 31, 2017 and 2016 AUDITED
22
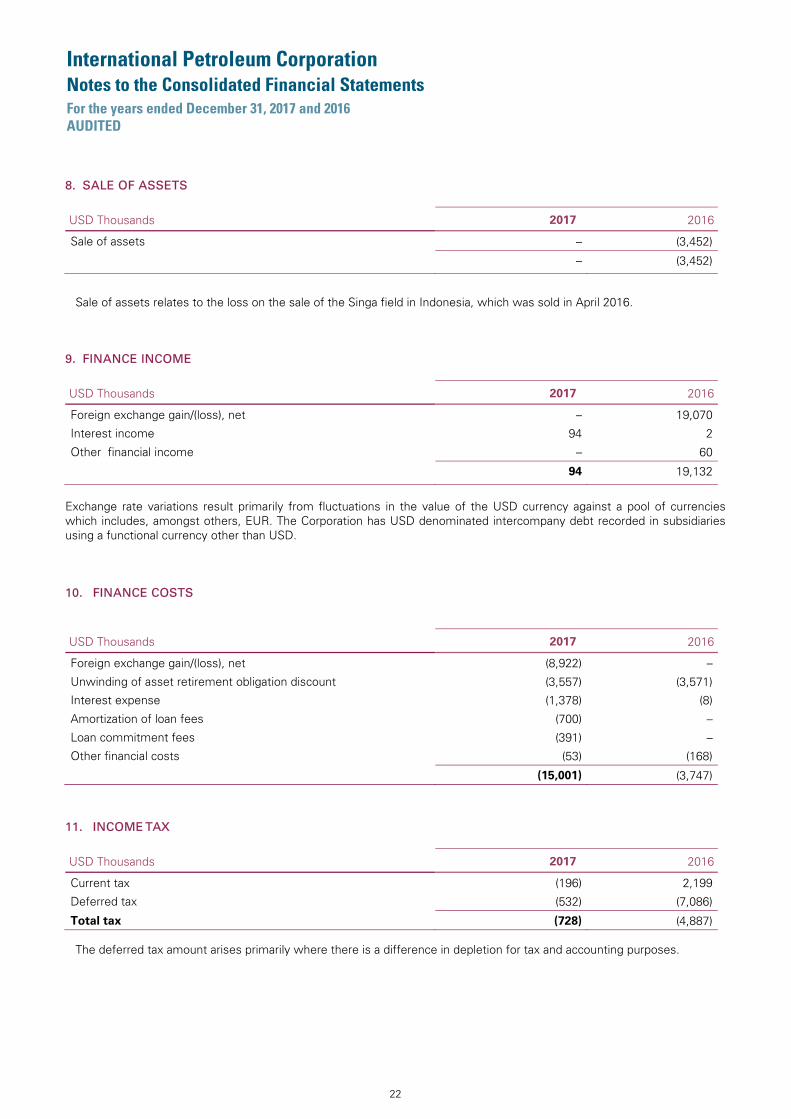
8. SALE OF ASSETS
USD Thousands 2017 2016
Sale of assets – (3,452)
– (3,452)
Sale of assets relates to the loss on the sale of the Singa field in Indonesia, which was sold in April 2016.
9. FINANCE INCOME
USD Thousands 2017 2016
Foreign exchange gain/(loss), net – 19,070
Interest income 94 2
Other financial income – 60
94 19,132
Exchange rate variations result primarily from fluctuations in the value of the USD currency against a pool of currencies which includes, amongst others, EUR. The Corporation has USD denominated intercompany debt recorded in subsidiaries using a functional currency other than USD.
10. FINANCE COSTS
USD Thousands 2017 2016
Foreign exchange gain/(loss), net (8,922) –
Unwinding of asset retirement obligation discount (3,557) (3,571)
Interest expense (1,378) (8)
Amortization of loan fees (700) –
Loan commitment fees (391) –
Other financial costs (53) (168)
(15,001) (3,747)
11. INCOME TAX
USD Thousands 2017 2016
Current tax (196) 2,199
Deferred tax (532) (7,086)
Total tax (728) (4,887)
The deferred tax amount arises primarily where there is a difference in depletion for tax and accounting purposes.

International Petroleum Corporation Notes to the Consolidated Financial Statements For the years ended December 31, 2017 and 2016 AUDITED
23
The tax on the Group’s profit before tax differs from the theoretical amount that would arise using the tax rate of Canada as follows:
USD Thousands 2017 2016
Profit/(loss) before tax 23,451 (90,833)
Tax calculated at the corporate tax rate in Canada 26% (6,097) 23,617
Effect of foreign tax rates (711) (2,853)
Tax effect of expenses non-deductible for tax purposes (580) (15,840)
Tax effect of uplift on expenses 167 1,081
Tax effect of income not subject to tax 6,145 5,326
Tax effect of utilisation of unrecorded tax losses 555 (334)
Tax effect of creation of unrecorded tax losses 62 (17,371)
Adjustments to prior year tax assessments (269) 1,487
Profit/(loss) before tax (728) (4,887)
Specification of deferred tax assets and tax liabilities1
USD Thousands 2017 2016
Unused tax loss carry forward 15,466 13,508
Asset retirement obligation provision 2,680 2,029
Other 1,465 945
Deferred tax assets 19,611 16,482
Accelerated allowances 59,884 49,105
Other 1,272 1,944
Deferred tax liabilities 61,156 51,049
Deferred taxes, net 41,545 34,567
1 The specification of deferred tax assets and tax liabilities does not agree to the face of the balance sheet due to the netting off of balances in the balance sheet when they relate to the same jurisdiction.
The deferred tax liabilities consist of accelerated allowances, being the difference between the book and the tax value of oil and gas properties. The deferred tax liabilities will be released over the life of the oil and gas assets as the book value is depleted for accounting purposes. Deferred tax assets in relation to tax loss carried forwards are only recognized in so far that there is a reasonable certainty as to the timing and the extent of their realization. Unrecognized tax losses
The Corporation has Dutch tax loss carry forwards of approximately USD 171,183 thousand (USD 210,611 thousand in 2016). The tax losses can be carried forward and utilised for up to 9 years. A deferred tax asset of USD 42,796 thousand (USD 52,652 thousand in 2016) relating to the tax loss carry forwards has not been recognized as at 31 December 2017 due to the uncertainty as to the timing and the extent of the tax loss carry forward utilisation. This treatment is consistent with the comparative year’s accounts.
International Petroleum Corporation Notes to the Consolidated Financial Statements For the years ended December 31, 2017 and 2016 AUDITED
24
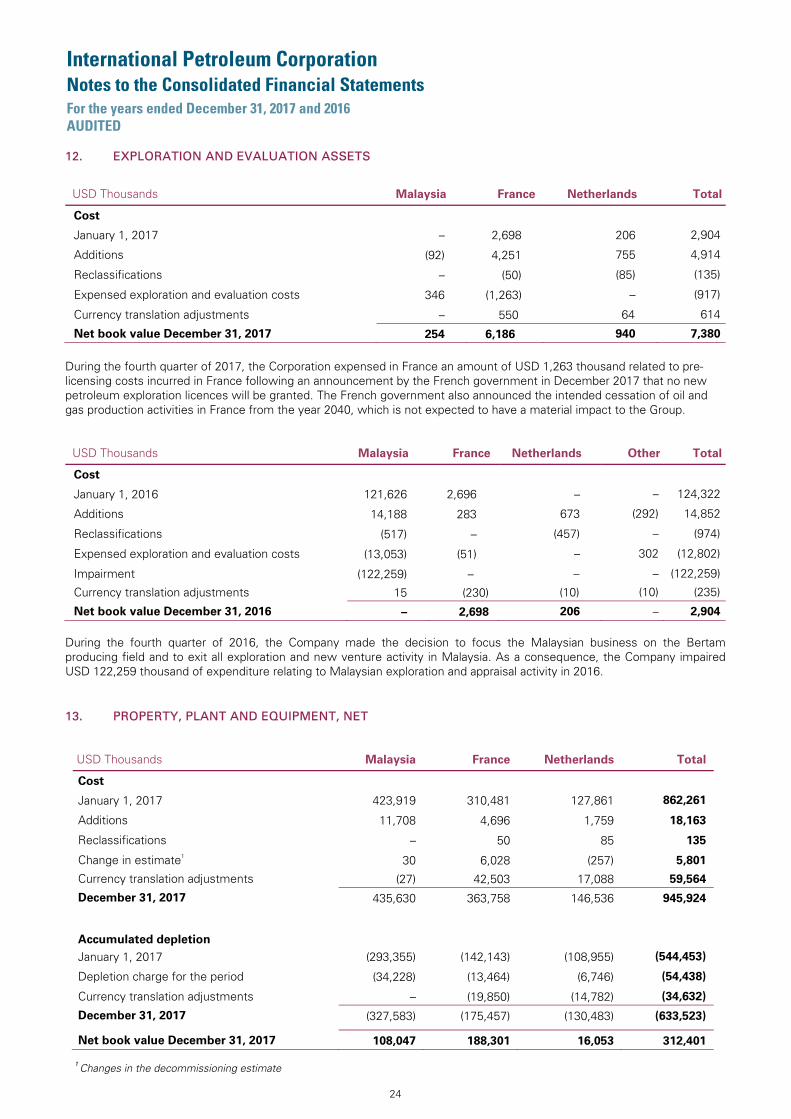
12. EXPLORATION AND EVALUATION ASSETS
USD Thousands Malaysia France Netherlands Total
Cost
January 1, 2017 – 2,698 206 2,904
Additions (92) 4,251 755 4,914
Reclassifications – (50) (85) (135)
Expensed exploration and evaluation costs 346 (1,263) – (917)
Currency translation adjustments – 550 64 614
Net book value December 31, 2017 254 6,186 940 7,380
During the fourth quarter of 2017, the Corporation expensed in France an amount of USD 1,263 thousand related to pre-licensing costs incurred in France following an announcement by the French government in December 2017 that no new petroleum exploration licences will be granted. The French government also announced the intended cessation of oil and gas production activities in France from the year 2040, which is not expected to have a material impact to the Group.
USD Thousands Malaysia France Netherlands Other Total
Cost
January 1, 2016 121,626 2,696 – – 124,322
Additions 14,188 283 673 (292) 14,852
Reclassifications (517) – (457) – (974)
Expensed exploration and evaluation costs (13,053) (51) – 302 (12,802)
Impairment (122,259) – – – (122,259)
Currency translation adjustments 15 (230) (10) (10) (235)
Net book value December 31, 2016 – 2,698 206 – 2,904
During the fourth quarter of 2016, the Company made the decision to focus the Malaysian business on the Bertam producing field and to exit all exploration and new venture activity in Malaysia. As a consequence, the Company impaired USD 122,259 thousand of expenditure relating to Malaysian exploration and appraisal activity in 2016. 13. PROPERTY, PLANT AND EQUIPMENT, NET
USD Thousands Malaysia France Netherlands Total
Cost
January 1, 2017 423,919 310,481 127,861 862,261
Additions 11,708 4,696 1,759 18,163
Reclassifications – 50 85 135
Change in estimate1 30 6,028 (257) 5,801
Currency translation adjustments (27) 42,503 17,088 59,564
December 31, 2017 435,630 363,758 146,536 945,924
Accumulated depletion
January 1, 2017 (293,355) (142,143) (108,955) (544,453)
Depletion charge for the period (34,228) (13,464) (6,746) (54,438)
Currency translation adjustments – (19,850) (14,782) (34,632)
December 31, 2017 (327,583) (175,457) (130,483) (633,523)
Net book value December 31, 2017 108,047 188,301 16,053 312,401
1 Changes in the decommissioning estimate
International Petroleum Corporation Notes to the Consolidated Financial Statements For the years ended December 31, 2017 and 2016 AUDITED
25
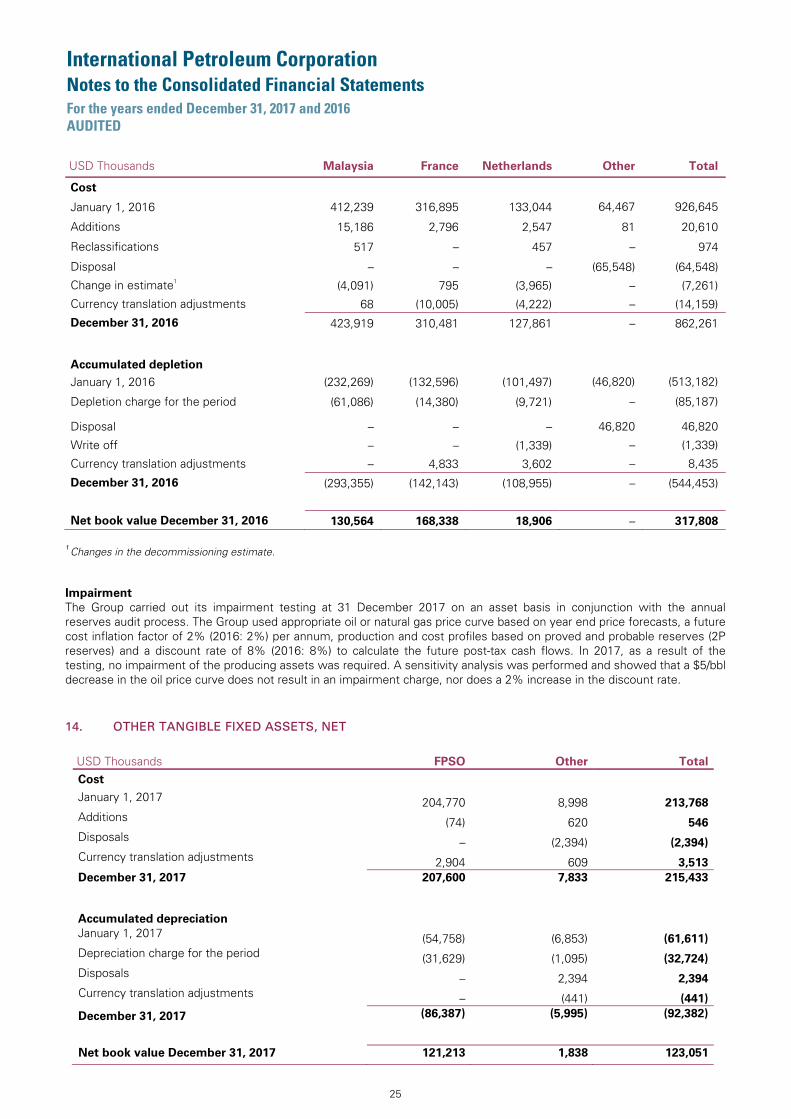
USD Thousands Malaysia France Netherlands Other Total
Cost
January 1, 2016 412,239 316,895 133,044 64,467 926,645
Additions 15,186 2,796 2,547 81 20,610
Reclassifications 517 – 457 – 974
Disposal – – – (65,548) (64,548)
Change in estimate1 (4,091) 795 (3,965) – (7,261)
Currency translation adjustments 68 (10,005) (4,222) – (14,159)
December 31, 2016 423,919 310,481 127,861 – 862,261
Accumulated depletion
January 1, 2016 (232,269) (132,596) (101,497) (46,820) (513,182)
Depletion charge for the period (61,086) (14,380) (9,721) – (85,187)
Disposal – – – 46,820 46,820
Write off – – (1,339) – (1,339)
Currency translation adjustments – 4,833 3,602 – 8,435
December 31, 2016 (293,355) (142,143) (108,955) – (544,453)
Net book value December 31, 2016 130,564 168,338 18,906 – 317,808
1 Changes in the decommissioning estimate.
Impairment
The Group carried out its impairment testing at 31 December 2017 on an asset basis in conjunction with the annual reserves audit process. The Group used appropriate oil or natural gas price curve based on year end price forecasts, a future cost inflation factor of 2% (2016: 2%) per annum, production and cost profiles based on proved and probable reserves (2P reserves) and a discount rate of 8% (2016: 8%) to calculate the future post-tax cash flows. In 2017, as a result of the testing, no impairment of the producing assets was required. A sensitivity analysis was performed and showed that a $5/bbl decrease in the oil price curve does not result in an impairment charge, nor does a 2% increase in the discount rate. 14. OTHER TANGIBLE FIXED ASSETS, NET
USD Thousands FPSO Other Total
Cost January 1, 2017 204,770 8,998 213,768
Additions (74) 620 546
Disposals – (2,394) (2,394)
Currency translation adjustments 2,904 609 3,513
December 31, 2017 207,600 7,833 215,433
Accumulated depreciation
January 1, 2017 (54,758) (6,853) (61,611)
Depreciation charge for the period (31,629) (1,095) (32,724)
Disposals – 2,394 2,394
Currency translation adjustments – (441) (441)
December 31, 2017 (86,387) (5,995) (92,382)
Net book value December 31, 2017 121,213 1,838 123,051
International Petroleum Corporation Notes to the Consolidated Financial Statements For the years ended December 31, 2017 and 2016 AUDITED
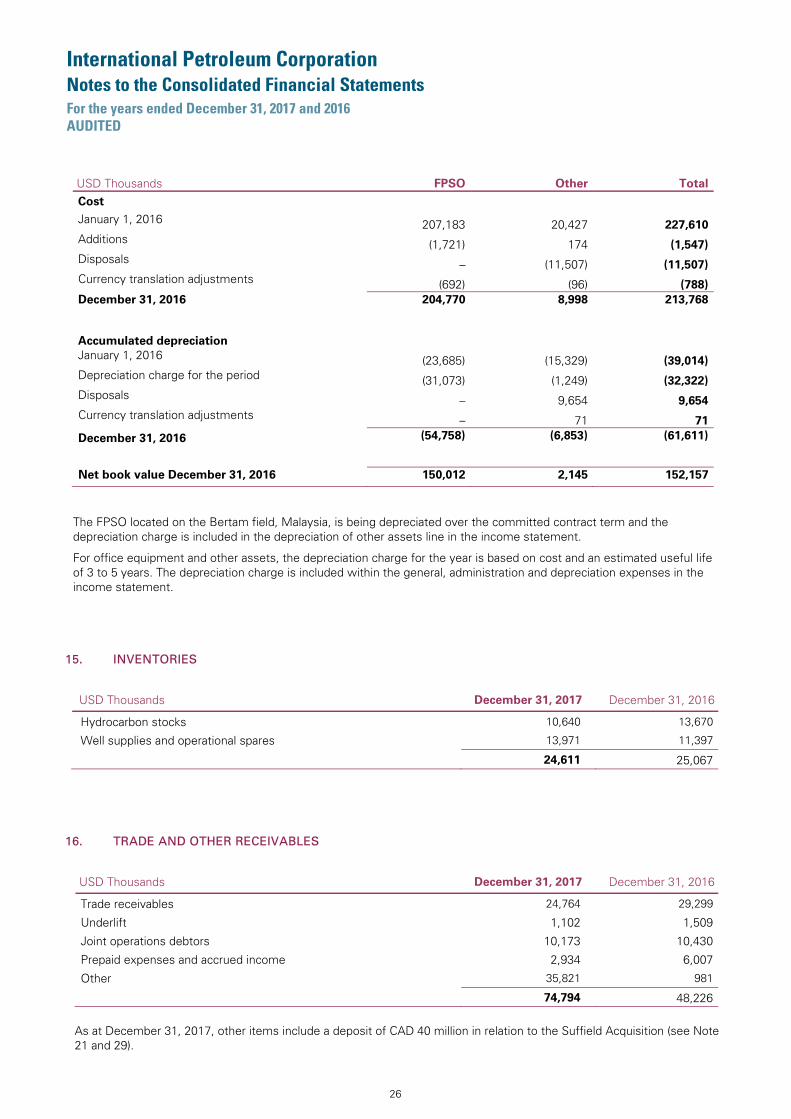
26
USD Thousands FPSO Other Total
Cost January 1, 2016 207,183 20,427 227,610
Additions (1,721) 174 (1,547)
Disposals – (11,507) (11,507)
Currency translation adjustments (692) (96) (788)
December 31, 2016 204,770 8,998 213,768
Accumulated depreciation
January 1, 2016 (23,685) (15,329) (39,014)
Depreciation charge for the period (31,073) (1,249) (32,322)
Disposals – 9,654 9,654
Currency translation adjustments – 71 71
December 31, 2016 (54,758) (6,853) (61,611)
Net book value December 31, 2016 150,012 2,145 152,157
The FPSO located on the Bertam field, Malaysia, is being depreciated over the committed contract term and the depreciation charge is included in the depreciation of other assets line in the income statement.
For office equipment and other assets, the depreciation charge for the year is based on cost and an estimated useful life of 3 to 5 years. The depreciation charge is included within the general, administration and depreciation expenses in the income statement.
15. INVENTORIES
USD Thousands December 31, 2017 December 31, 2016
Hydrocarbon stocks 10,640 13,670
Well supplies and operational spares 13,971 11,397 24,611 25,067
16. TRADE AND OTHER RECEIVABLES
USD Thousands December 31, 2017 December 31, 2016
Trade receivables 24,764 29,299
Underlift 1,102 1,509
Joint operations debtors 10,173 10,430
Prepaid expenses and accrued income 2,934 6,007
Other 35,821 981 74,794 48,226
As at December 31, 2017, other items include a deposit of CAD 40 million in relation to the Suffield Acquisition (see Note 21 and 29).

International Petroleum Corporation Notes to the Consolidated Financial Statements For the years ended December 31, 2017 and 2016 AUDITED
27
17. CASH AND CASH EQUIVALENTS
Cash and cash equivalents include only cash at hand or held in bank accounts. 18. SHARE CAPITAL
The common shares of IPC started trading on both the Toronto Stock Exchange and the Nasdaq First North in Stockholm on April 24, 2017 with a total of 113,462,148 common shares issued and outstanding. As part of the share purchase offer by a subsidiary of IPC announced following listing, 25,540,302 common shares were tendered (including the 22,805,892 common shares owned by Statoil) for approximately USD 90.6 million and, as part of a subsequent internal reorganization, these shares were subsequently cancelled. The Corporation has authorized share capital consisting of an unlimited number of common shares of which 87,921,846 are issued and outstanding at December 31, 2017. In addition, IPC has 117,485,389 outstanding class A preferred shares, issued as a part of an internal corporate structuring to a wholly-owned subsidiary of IPC. Such preferred shares are not listed on any stock exchange and do not carry the right to vote on matters to be decided by the holders of IPC’s common shares. The Group’s issued common share capital is as follows:
Share capital
Number of shares Par value
CAD Thousands
Par value
USD Thousands
Share issuance at spin-off date 113,462,148 113,462 86,342
Cancellation of shares (25,540,302) (25,540) (19,436) Balance at December 31, 2017 87,921,846 87,922 66,906
19. EARNINGS PER SHARE
Basic earnings per share are based on net result attributable to the common shareholders and is calculated based upon the weighted-average number of common shares outstanding during the periods presented. For comparative purposes, the Group’s common shares issued under the Spin-Off have been assumed to be outstanding as of the beginning of each period prior to the Spin-Off.
2017 2016
Net result attributable to shareholders of the Parent Company, USD 22,718,036 (95,728,259)
Weighted average number of shares for the year 98,587,027 113,462,148
Earnings per share, USD 0.23 (0.84)
Weighted average diluted number of shares for the year 99,138,548 113,462,148 Earnings per share fully diluted, USD 0.23 (0.84)

International Petroleum Corporation Notes to the Consolidated Financial Statements For the years ended December 31, 2017 and 2016 AUDITED
28
20. SHARE-BASED PAYMENTS
The Group has the following share-based compensation plans: a stock option plan (“Stock Option Plan”) and a one- time transitional performance and restricted share plan, under which awards have been made in performance shares (“IPC transitional PSP) or in restricted shares (“IPC transitional RSP”) in connection with the Spin-Off.
Stock Option Plan
The Stock Option Plan was approved by the Board and provides for the grant of stock option awards to employees, consultants and directors. The plan gives the participants a right to buy common shares of IPC at an exercise price equal to the market value at the date of grant. The Board granted stock options under the Stock Option Plan on February 21, 2017 with a three year vesting period and a four year term, whereby the stock options vest equally in three tranches: one third after one year, one third after two years and the final third after three years. The plan is effective from February 21, 2017 and the total outstanding number of stock options at December 31, 2017 is 1,856,600. Each original stock-option was fair valued at the date of grant at CAD 2.01 using a Black-Scholes option pricing model. The assumptions used in the calculation were a risk free rate of 1.02%, expected volatility of 53.70%, dividend yield rate of 0%, and an exercise price of CAD 4.77. The number of awards outstanding under the Stock Option Plan at December 31, 2017 are summarized in the table below.
IPC Stock Option Plan 2017
Outstanding at January 1, 2017 –
Awarded during the period 1,856,600
Forfeited during the period –
Exercised during the period –
Outstanding at December 31, 2017 1,856,600
Vesting date
February 21, 2018 618,867
February 21, 2019 618,867
February 21, 2020 618,867
Outstanding at December 31, 2017 1,856,600
In connection with the Spin-off, the Group agreed to put in place certain one-time transitional equity-based compensation plans for certain officers and employees of the Corporation. The IPC transitional PSP and IPC transitional RSP awards were made effective as of April 24, 2017 and vest subject to certain conditions.
IPC Transitional PSP Plan
The 2015 IPC transitional PSP awards are effective from April 24, 2017 subject to certain performance conditions being met. The total outstanding number of awards at December 31, 2017 is 421,262 which vest on June 30, 2018. 75 percent of the awards will vest subject to continued employment only and have been fair valued at the grant date at CAD 4.77. The remaining 25 percent will vest subject to continued employment and on a straight-line basis for the share price performance between 100 percent and 125 percent of CAD 4.77 and have been fair valued at the grant date at CAD 2.50 using an adjusted share price calculated with a hybrid valuation model based on the Monte Carlo simulation. The assumptions used in the calculation of the adjusted share price were a risk free rate of 0.76%, expected volatility of 52.80%, dividend yield rate of 0%, and an exercise price of CAD 0.
The 2016 IPC transitional PSP awards are effective from April 24, 2017 subject to certain performance conditions being met. The total outstanding number of awards at December 31, 2017 is 733,307 which vest on June 30, 2019. 75 percent of the awards will vest subject to continued employment only and have been fair valued at the grant date at CAD 4.77. The remaining 25 percent will vest subject to continued employment and on a straight-line basis for the share price performance between 100 percent and 125 percent of CAD 4.77 and have been fair valued at the grant date at CAD 2.79 using an adjusted share price calculated with a hybrid valuation model based on the Monte Carlo simulation. The assumptions used in the calculation of the adjusted share price were a risk free rate of 0.76%, expected volatility of 52.80%, dividend yield rate of 0%, and an exercise price of CAD 0.

International Petroleum Corporation Notes to the Consolidated Financial Statements For the years ended December 31, 2017 and 2016 AUDITED
29
The number of awards outstanding under the IPC Transitional PSP Plan at December 31, 2017 are summarized in the table below.
IPC Transitional PSP Plan Plan 2015 Plan 2016 Total
Outstanding at January 1, 2017 – – –
Awarded during the period 421,262 733,307 1,154,569
Forfeited during the period – – –
Exercised during the period – – –
Outstanding at December 31, 2017 421,262 733,307 1,154,569
Vesting date
June 30, 2018 421,262 – 421,262
June 30, 2019 – 733,307 733,307
Outstanding at December 31, 2017 421,262 733,307 1,154,569
IPC Transitional RSP Plan
The 2015 IPC transitional RSP awards are effective from April 24, 2017. The total outstanding number of awards at December 31, 2017 is 35,088 which vest on May 31, 2018, subject to continued employment. Each award was fair valued at the grant date at CAD 4.77.
The 2016 IPC transitional RSP awards are effective from April 24, 2017. The total outstanding number of awards at December 31, 2017 is 117,702 which vest on May 31, 2018 and on May 31, 2019, subject to continued employment. Each award was fair valued at the grant date at CAD 4.77. The number of awards outstanding under the IPC Transitional RSP Plan at December 31, 2017 are summarized in the table below.
IPC Transitional RSP Plan Plan 2015 Plan 2016 Total
Outstanding at January 1, 2017 – – –
Awarded during the period 35,088 117,702 152,790
Forfeited during the period – – –
Exercised during the period – – –
Outstanding at December 31, 2017 35,088 117,702 152,790
Vesting date
May 31, 2018 35,088 58,851 93,939
May 31, 2019 – 58,851 58,851
Outstanding at December 31, 2017 35,088 117,702 152,790
The costs charged to the statement of operations of the Group associated with the Share-Based payments are summarized in the following table.
USD Thousands 2017 2016
IPC Stock Option Plan 1,482 –
IPC Transitional PSP – Plan 2015 754 –
IPC Transitional PSP – Plan 2016 724 –
IPC Transitional RSP – Plan 2015 77 –
IPC Transitional RSP – Plan 2016 187 – 3,224 –

International Petroleum Corporation Notes to the Consolidated Financial Statements For the years ended December 31, 2017 and 2016 AUDITED
30
21. FINANCIAL LIABILITIES
USD Thousands December 31, 2017 December 31, 2016
Bank loans 60,000 –
Capitalized financing fees (733) – 59,267 –
On April 20, 2017, members of the Group entered into a 2.25-year senior secured USD 100 million reserve-based lending credit facility, which was used to fund the purchase of IPC shares tendered under the share purchase offer announced on April 24, 2017.
The credit facility was initially drawn for USD 80.0 million on May 31, 2017 to partly fund the share purchase offer made to all shareholders totaling USD 90.6 million. Operating cash flows were used to repay some of the initial debt and in September 2017, USD 30.0 million was drawn to partly fund a CAD 40.0 million deposit in respect of the Suffield Acquisition (see Note 29).
In connection with the completion of the Suffield acquisition (see Note 29), members of the Group entered into an amendment to the existing reserve-based lending credit facility on December 20, 2017 to increase such facility from USD 100 million to USD 200 million and IPC entered into a CAD 250 million reserve-based lending credit facility and a CAD 60 million second lien facility in Canada on January 5, 2018. The amendment to the existing reserve-based lending credit facility became effective in January 2018.
22. DERIVATIVE FINANCIAL INSTRUMENTS
USD Thousands December 31, 2017 December 31, 2016
Derivative financial assets – current 1,372 – 1,372 –
In connection with the financing of the Suffield acquisition (see Note 29), IPC entered into two USD/CAD foreign exchange forward contracts. The contracts had a combined notional amount of USD 125.0 million with a maturity date of June 2018. Both contracts were contingent on the closing of the Suffield Acquisition. These instruments are classified within level 2 of the fair value hierarchy. At December 31, 2017, these instruments qualified for hedge accounting with fair value movements accounted for within equity as the forecasted business combination was considered to be highly probable of occurring as of the balance sheet date. A 1% increase in the exchange rate (CAD to USD) would have resulted in a decrease of USD 1.3 million to the fair value of our foreign currency derivatives.
23. PROVISIONS
USD Thousands
Asset retirement
obligation
Farm in
obligation Other Total
January 1, 2017 90,994 5,022 1,380 97,396
Additions – – 286 286
Unwinding of asset retirement obligation discount 3,557 – – 3,557
Decommissioning costs 117 117
Changes in estimates 5,801 – – 5,801
Payments (5,029) (9) (131) (5,169)
Currency translation adjustments 9,193 544 187 9,924
December 31, 2017 104,633 5,557 1,722 111,912
Non-current 99,843 4,322 1,722
105,887
Current 4,790 1,235 – 6,025
Total 104,633 5,557 1,722 111,912
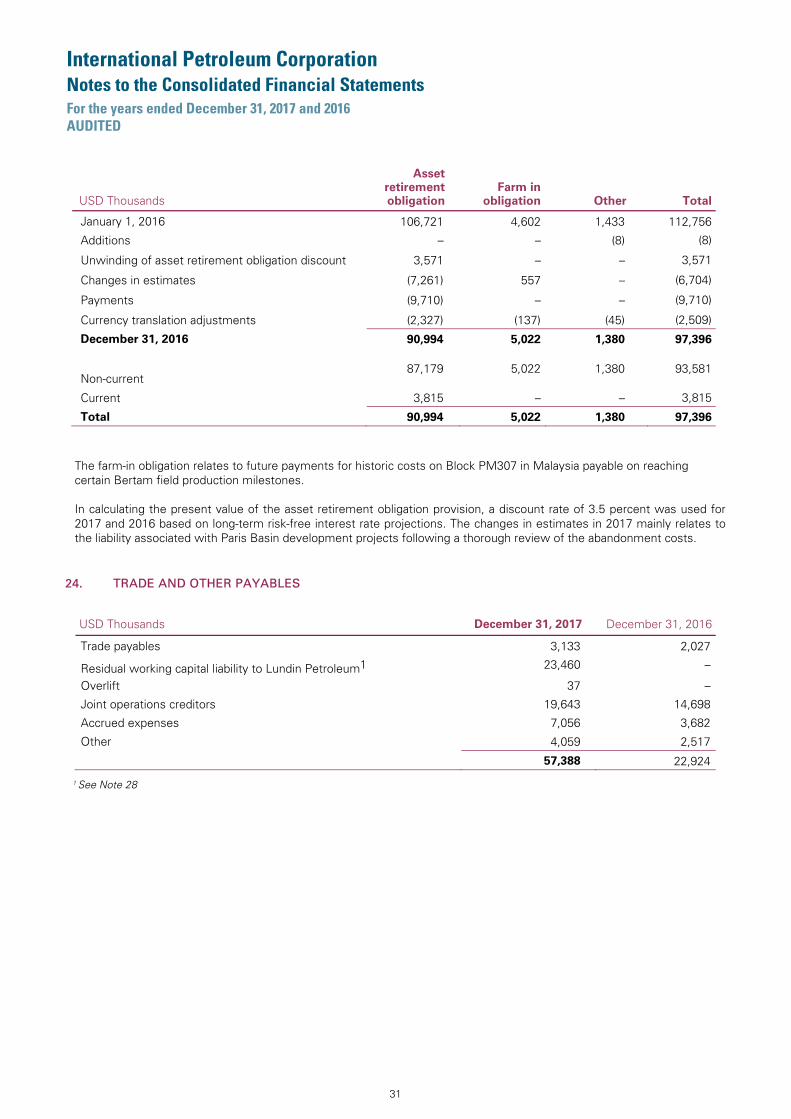
International Petroleum Corporation Notes to the Consolidated Financial Statements For the years ended December 31, 2017 and 2016 AUDITED
31
USD Thousands
Asset retirement obligation
Farm in obligation Other Total
January 1, 2016 106,721 4,602 1,433 112,756
Additions – – (8) (8)
Unwinding of asset retirement obligation discount 3,571 – – 3,571
Changes in estimates (7,261) 557 – (6,704)
Payments (9,710) – – (9,710)
Currency translation adjustments (2,327) (137) (45) (2,509)
December 31, 2016 90,994 5,022 1,380 97,396
Non-current 87,179 5,022 1,380 93,581
Current 3,815 – – 3,815
Total 90,994 5,022 1,380 97,396
The farm-in obligation relates to future payments for historic costs on Block PM307 in Malaysia payable on reaching certain Bertam field production milestones. In calculating the present value of the asset retirement obligation provision, a discount rate of 3.5 percent was used for 2017 and 2016 based on long-term risk-free interest rate projections. The changes in estimates in 2017 mainly relates to the liability associated with Paris Basin development projects following a thorough review of the abandonment costs.
24. TRADE AND OTHER PAYABLES
USD Thousands December 31, 2017 December 31, 2016
Trade payables 3,133 2,027
Residual working capital liability to Lundin Petroleum1 23,460 –
Overlift 37 –
Joint operations creditors 19,643 14,698
Accrued expenses 7,056 3,682
Other 4,059 2,517 57,388 22,924
1 See Note 28

International Petroleum Corporation Notes to the Consolidated Financial Statements For the years ended December 31, 2017 and 2016 AUDITED
32
25. FINANCIAL ASSETS AND LIABILITIES
Financial assets and liabilities by category
The accounting policies for financial instruments have been applied to the line items below:
1 Prepayments are not included in other current assets, as prepayments are not deemed to be financial instruments.
December 31, 2017
USD Thousands Total
Other liabilities at
amortized cost
Financial
liabilities at
amortized cost
Fair value
recognized in
profit or loss
Financial liabilities 59,267 – 59,267 – Joint operation creditors 19,643 19,643 – – Other current liabilities 30,948 30,911 – 37 Financial liabilities 109,858 50,554 59,267 37
1 Prepayments are not included in other current assets, as prepayments are not deemed to be financial instruments.
December 31, 2016 USD Thousands Total
Other liabilities at
amortized cost
Financial
liabilities at
amortized cost
Fair value
recognized in
profit or loss
Joint operation creditors 14,698 14,698 – –
Other current liabilities 4,544 4,544 – –
Financial liabilities 19,242 19,242 – – The fair value of loan receivables and other receivables equal the book value.
December 31, 2017
USD Thousands Total
Loans receivables
and other
receivables at amortized cost
Financial
assets at
amortized
cost
Assets at
fair value
within
OCI
Fair value
recognized in
profit or loss
Derivatives
used for
hedging
Other non-current financial assets 5 – 5 – – – Derivative instruments
1,372 – – – – 1,372 Joint operation debtors
10,173 10,173 – – – – Other current receivables1
61,707 60,605 – – 1,102 – Cash and cash equivalents 33,679 33,679 – – – – Financial assets 106,936 104,457 5 – 1,102 1,372
December 31, 2016 USD Thousands Total
Loans receivables
and other
receivables at
amortized cost
Financial
assets at
amortized
cost
Assets at fair
value within
OCI
Fair value
recognized in
profit or loss
Other non-current financial assets 5 – 5 – –
Joint operation debtors 10,430 10,430 – – –
Other current receivables 1 32,195 30,686 – – 1,509
Cash and cash equivalents 13,410 13,410 – – –
Financial assets 56,040 54,526 5 – 1,509

International Petroleum Corporation Notes to the Consolidated Financial Statements For the years ended December 31, 2017 and 2016 AUDITED
33
For financial instruments measured at fair value in the balance sheet, the following fair value measurement hierarchy is used:
– Level 1: based on quoted prices in active markets; – Level 2: based on inputs other than quoted prices as within level 1, that are either directly or indirectly observable; – Level 3: based on inputs which are not based on observable market data.
Based on this hierarchy, financial instruments measured at fair value can be detailed as follows:
December 31, 2017
USD Thousands
Level 1
Level 2
Level 3
Other current receivables 1,102 – –
Derivative instruments - current – 1,372 –
Financial assets 1,102 1,372 –
December 31, 2016
USD Thousands Level 1 Level 2 Level 3
Other current receivables 1,509 – –
Financial assets 1,509 – –
26. MANAGEMENT OF FINANCIAL RISK The Corporation’s financial instruments are exposed to certain financial risks, including credit risk, liquidity risk, foreign exchange risk, commodity price risk and interest rate risk. a) Credit risk The exposure to credit risk arises through the failure of a customer or another third party to meet its contractual obligations to the Corporation. The Corporation believes that its maximum exposure to credit risk as at December 31, 2017 is the carrying value of its trade receivables. The Company’s policy is to limit credit risk by limiting the counterparties to major oil and gas companies. Where it is determined that there is a credit risk for oil and gas sales, the policy is to require an irrevocable letter of credit for the full value of the sale. The policy on joint operation parties is to rely on the provisions of the underlying joint operating agreements to take possession of the licence or the partner’s share of production for non-payment of cash calls or other amounts due. As at December 31, 2017, the trade receivables amounted to USD 24,764 thousand and there is no recent history of default. Cash and cash equivalents are maintained with banks having strong long-term credit ratings. b) Liquidity risk Liquidity risk is defined as the risk that the Company could not be able to settle or meet its obligations on time or at a reasonable price. Corporation treasury is responsible for liquidity, funding as well as settlement management. The Corporation has in place a planning and forecasting process to help determine the funds required to support the Corporation’s normal operating requirements on an ongoing basis. The Corporation ensures that there is sufficient available capital to meet its short-term business requirements, taking into account its anticipated cash flows from operations and its holdings of cash and cash equivalents. The Corporation has credit facilities in place to assist with meeting its cash flow needs as required (Note 21). The table below analyses the Group’s financial liabilities into relevant maturity groupings based on the remaining period at the balance sheet date to the contractual maturity date. Loan repayments are made upon a net present value calculation of the assets’future cash flows. No loan repayments are currently forecast under this calculation.
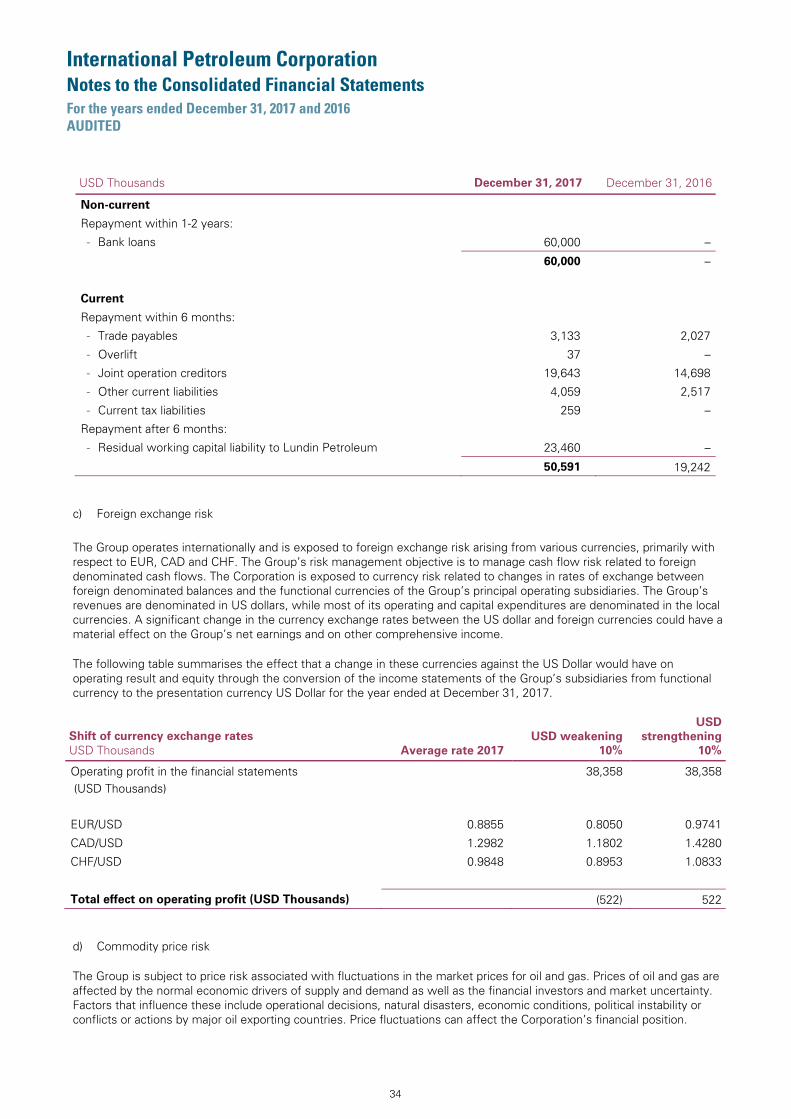
International Petroleum Corporation Notes to the Consolidated Financial Statements For the years ended December 31, 2017 and 2016 AUDITED
34
USD Thousands December 31, 2017 December 31, 2016
Non-current
Repayment within 1-2 years:
- Bank loans 60,000 –
60,000 –
Current
Repayment within 6 months:
- Trade payables 3,133 2,027
- Overlift 37 –
- Joint operation creditors 19,643 14,698
- Other current liabilities 4,059 2,517
- Current tax liabilities 259 –
Repayment after 6 months:
- Residual working capital liability to Lundin Petroleum 23,460 – 50,591 19,242 c) Foreign exchange risk The Group operates internationally and is exposed to foreign exchange risk arising from various currencies, primarily with respect to EUR, CAD and CHF. The Group’s risk management objective is to manage cash flow risk related to foreign denominated cash flows. The Corporation is exposed to currency risk related to changes in rates of exchange between foreign denominated balances and the functional currencies of the Group’s principal operating subsidiaries. The Group’s revenues are denominated in US dollars, while most of its operating and capital expenditures are denominated in the local currencies. A significant change in the currency exchange rates between the US dollar and foreign currencies could have a material effect on the Group’s net earnings and on other comprehensive income. The following table summarises the effect that a change in these currencies against the US Dollar would have on operating result and equity through the conversion of the income statements of the Group’s subsidiaries from functional currency to the presentation currency US Dollar for the year ended at December 31, 2017.
Shift of currency exchange rates USD Thousands Average rate 2017
USD weakening
10%
USD
strengthening
10%
Operating profit in the financial statements (USD Thousands)
38,358 38,358
EUR/USD 0.8855 0.8050 0.9741
CAD/USD 1.2982 1.1802 1.4280
CHF/USD 0.9848 0.8953 1.0833
Total effect on operating profit (USD Thousands) (522) 522
d) Commodity price risk The Group is subject to price risk associated with fluctuations in the market prices for oil and gas. Prices of oil and gas are affected by the normal economic drivers of supply and demand as well as the financial investors and market uncertainty. Factors that influence these include operational decisions, natural disasters, economic conditions, political instability or conflicts or actions by major oil exporting countries. Price fluctuations can affect the Corporation’s financial position.

International Petroleum Corporation Notes to the Consolidated Financial Statements For the years ended December 31, 2017 and 2016 AUDITED
35
The table below summarises the effect that a change in the oil price would have had on the net result and equity at December 31, 2017:
Net income in the financial statements (USD Thousands) 22,723 22,723
Possible shift (%) (10%) 10%
Total effect on net income (USD Thousands) (12,489) 12,489 Based on analysis of the circumstances, the Group will assess the benefits of forward hedging monthly sales contracts for the purpose of establishing cash flow. If it believes that the hedging contracts will provide an enhanced cash flow then it may choose to enter into an oil price hedge. For the years ended December 31, 2017 and 2016, the Group did not enter into any oil price hedging contracts. e) Interest rate risk The Group’s exposure to interest rate risk arises from both the interest rate impact on its cash and cash equivalents as well as on its debt facilities. As at December 31, 2017, the Group’s long-term debt is comprised of partialy floating rate debt tied to LIBOR. As such, changes in interest rate will have an impact on interest expense. The total interest expense for 2017 amounted to USD 1,378 thousand. A 100 basis point shift in the interest rate would have resulted in a change in the total interest expense for the year of USD 361 thousand.
27. MANAGEMENT OF CAPITAL RISK
The objectives when managing capital are to safeguard the Group’s ability to continue as a going concern and to meet its committed work program requirements in order to create shareholder value. The Corporation may put in place new credit facilities, repay debt, or other such restructuring activities as appropriate. Management continuously monitors and manages the capital, liquidity and net debt position in order to assess the requirement for changes to the capital structure to meet the objectives and to maintain flexibility. No significant changes were made in the objectives, policies or procedures during the year ended December 31, 2017, or in the comparative periods. Through the ongoing management of its capital, the Corporation will modify the structure of its capital based on changing economic conditions in the jurisdictions in which it operates. In doing so, the Corporation may issue new shares or debt, buy back issued shares, or pay off any outstanding debt.
28. RELATED PARTIES
Transactions with corporate entities
As at the date of the Spin-Off, the Group had a residual liability for working capital owed to Lundin Petroleum AB of USD 27,429 thousand which has been reduced to USD 23,460 thousand as at December 31, 2017. Instalments of this amount bear interest at 3.5% from the date of an original repayment schedule. This amount is reflected as a current liability as it is due before the end of December 2018. Expensed interest of USD 31 thousand is included in the 2017 consolidated financial statements related to this liability.
Lundin Petroleum has charged the Group USD 504 thousand in respect of office space rental and USD 2,042 thousand in respect of shared services provided since the Spin-Off date. IPC has charged Lundin Petroleum USD 461 thousand in respect of consultancy fees in 2017.
Remuneration of Directors and Senior Management
Remuneration of Directors and Senior Management includes all amounts earned and awarded to the Group’s Board of Directors and Senior Management. Senior Management includes the Group’s President and Chief Executive Officer, Chief Financial Officer, General Counsel and Corporate Secretary, Vice President of Operations, Vice President of Reservoir Development and Vice President of Corporate Planning and Investor Relations.

International Petroleum Corporation Notes to the Consolidated Financial Statements For the years ended December 31, 2017 and 2016 AUDITED
36
Directors’ fees include Board and Committee fees. Management’s short-term wages, bonuses and benefits include salary, benefits, bonuses and any other compensation earned or awarded in 2017 from the Spin-Off date.
USD Thousands
2017
Directors’ fees 334
Management’s short-term wages, bonuses and benefits 2,712
3,046
At December 31, 2017, IPC share-based incentive plans remain unvested.
29. SUBSEQUENT EVENTS
A member of the Group entered into an agreement with Cenovus Energy on September 22, 2017 to acquire certain oil and gas properties in Canada for a total consideration of CAD 512 million, subject to closing adjustments and to certain additional contingent consideration. The acquisition received the necessary regulatory approvals and closed on January 5, 2018, with purchase consideration paid by the Group at completion of approximately CAD 449 million, after taking into account closing adjustments. This consideration amount includes a deposit of CAD 40 million which was made by the Group on September 22, 2017. This deposit is currently reflected on the balance sheet in “Trade and Other Receivables”. An additional CAD 12 million of deferred consideration will be payable at the end of June 2018. The final purchase price may be further adjusted by certain capped additional contingent consideration. These contingent purchase price payments may become payable based on actual average monthly oil and natural gas prices during 2018 and 2019. Payments are due for each month when the average daily price of West Texas Intermediate (WTI) is above USD 55 per barrel (bbl) or natural gas prices at the Henry Hub are above USD 3.50 per million British thermal units (MMBtu). These payments are capped for each commodity on a per month basis (CAD 375 thousand per month for oil and CAD 1,125 thousand per month for gas) with a maximum combined payment of CAD 36 million in aggregate. The Company will make a payment to Cenovus Energy of CAD 375,000 in February 2018 related to oil prices realized in January 2018, with no amount owing related to January 2018 gas production. The acquisition was financed through a draw-down of approximately CAD 250 million from the new facilities in Canada and USD 125 million from the amended, existing reserve-based lending credit facility. The FX forward contingent hedges described in Note 22 were settled in relation to the reserve-based lending draw-down in connection with the completion of the transaction resulting in a realized settlement of CAD 158.5 million on the USD 125 million notional amount.

Corporate OfficeInternational Petroleum CorpSuite 2000885 West Georgia StreetVancouver, BCV6C 3E8, Canada
Tel: +1 604 689 7842E-mail: [email protected]: international-petroleum.com