qos comparative management and evaluation of gsm · pdf fileqos – comparative management...
TRANSCRIPT
The Pacific Journal of Science and Technology –134– http://www.akamaiuniversity.us/PJST.htm Volume 17. Number 2. November 2016 (Fall)
QoS – Comparative Management and Evaluation of GSM Telephone System in Nigeria.
A.O. Ogunlewe; O. Shoewu*; and N.T. Makanjuola.
Department of Electronics and Computer Engineering, Lagos State University, Epe Campus, Nigeria.
E-mail: [email protected]*
ABSTRACT The Nigerian Communications Commission (NCC) outlined a benchmark of Quality of Service (QoS) indicators in form of technical parameters that must be followed by all Nigerian operators. This, according to NCC will be closely monitored and evaluated on quarterly basis while stiff penalties were also spelt out for any erring operators for non-compliance. Enforcing this regulations, the four Nigerian mobile service providers, MTN Nigeria, Etisalat Nigeria, Airtel Nigeria and Globacom were mandated to pay a cumulative sum of 1,170,000,000 Naira penalty for the poor quality of services rendered to their different subscribers in the months of March and April, 2012 after being given the below par services rendered in the months of January and February as grace period. The penalties were due to the contravention of the provisions of the Quality of Service Regulations by the Nigerian Communications Commission as the operators failed to meet with the minimum required standard of quality of service including the key performance indicators. To this end, the researchers presents a treatise on the ways and means of measuring and evaluating telecommunications services (bearing the NCC benchmark in mind) that is simple and straightforward enough to be appreciated by anyone, and also detailed enough to be informative and useful to telecommunications professionals. This study assess the quality of service in voice call over the four service providers; MTN, AIRTEL, GLOBACOM and ETISALAT, in some parts of Ikorodu Local Government Area, Lagos State, Nigeria.
(Keywords: communications, mobile, Nigerian Communications Commission, NCC, penalties,
service providers, quality of service)
INTRODUCTION Sustainable economic growth of a country is dependent on a sound infrastructure in the telecommunication sector. Nigeria is a developing economy. In dynamic global environment, it is striving to bridge the digital divide and become competitive. Privatization and deregulation policies adopted in the mobile phone market by the government led to the introduction of Global System for mobile Communications (GSM) network providers, these network providers operates on the 900/1800 MHz (2G) and now 2100 MHz(3G) spectrum, MTN Nigeria, Airtel, Globacom, and Etisalat. Use of cell-phones has fast risen, and has mostly replaced the services of the Nigerian Telecommunications Limited (NITEL) which have been unreliable. The estimate lies at about 110 million mobile phones as at September 2013, with most people having more than one cell phone. In the field of telephony, quality of service was defined by international telecommunication union (ITU) in 1994. Quality of service (QoS) is said to comprise of requirements on all the aspects of a connection, such as receive level, signal loss, signal-to-noise ratio, echo, interrupts, frequency response, speech quality, and so on. QoS means different things to different people. In some developing countries where it is a struggle for QoS managers to wrestle with out-dated equipment, even making a network perform in the way it was designed as an improvement in QoS. The ‘service’ in the term ‘quality of telecommunications service’ is understood to pertain to something that is provided day-to-day for the use of someone, referred to as a user of that service (Hardy, 2001).

The Pacific Journal of Science and Technology –135– http://www.akamaiuniversity.us/PJST.htm Volume 17. Number 2. November 2016 (Fall)
As such, a telecommunication service is a particular capability to communicate with other parties by transmitting and receiving information in a way that is fully specified with respect to: how the user initiates a transaction; the mode in which the information is exchanged; how the information is formatted for transmission; how end-to-end exchanges of the information are affected. Over fourteen years ago, Nigeria embraced the global system for mobile communication (GSM). Its adoption is expected to serve as a viable alternative to the then analog (Nitel) system. Also, during its launching in July 2001, the core objective is to provide effective telecommunication services that will support good speech quality, roaming, spectral efficiency, minimized crosstalk, etc.(Adegoke A. S. and Babalola I. T., 2011) The deployment of GSM system into Nigerian market was universally embraced and found to be relatively efficient at the inception. With time, operators in the industry experienced an unprecedented growth in customer base which later incapacitated the networks to function efficiently. Adegoke (2011) further stated that although this explosive growth has brought huge revenue to both the operators and government through tax and license fee, as revolutionary as GSM may seem to be, many problems bedeviled the sector in recent past. Some of the problems are:
Instability in power supply
Security of infrastructure
Inter-Network connectivity
Network congestion
Call setup failure
Call retention / call drop All these factors contribute in one way or the other to the poor quality of services rendered by GSM operators in the country. Worried by the spate of development in the industry, the nation’s lawmakers (upper legislative house, 2007) set up a committee to investigate the below par services rendered by the service providers. While this was going on, the house of representative on July 18, 2007 invited the service providers to appear before its ad hoc
committee mandated to investigate the activities of the service providers. They maintained that public outcry on the epileptic services rendered necessitated the investigation, as well as its economic and social implications. The CEO of the Nigerian Communications Commission (NCC) made a statement on the 11th of Feb. 2009 at a public forum on QoS issue, he said: “Our focus for 2009 is to administer and monitor closely a performance management program to ensure that operating companies maintain minimum performance levels jointly agreed between the GSM operators, consumer representatives and NCC and, in consistent with the world class standards” (Adegoke and Babalola, 2011). METHODOLOGY This analysis was performed for benchmark between AIRTEL, MTN, GLO and ETISALAT. This study involves obtaining the key performance indicators (voice calls only) of these service providers under evaluation. The vehicle adhered to specific routes in Ikorodu axis using dedicated equipment to collect data. EXPERIMENT LOCATION The drive test route covers some parts Ikorodu local government as shown in Figure 1. EXPERIMENTAL EQUIPMENT SETUP The experiment was performed with the help of a custom vehicle with dedicated equipment. The drive test equipment are Power Supply Unit, Personal Computer, Hub, Car GPS, and Mobile Stations. The experiment was performed using the set of equipment as connected in Figure 2. Power Supply Unit This is an inverter connected to the motor vehicle to power the computer and hence the whole set-up. It converts the 12V DC power supplied from the vehicle to 220V AC required by the system.

The Pacific Journal of Science and Technology –136– http://www.akamaiuniversity.us/PJST.htm Volume 17. Number 2. November 2016 (Fall)
Figure 1: Drive Test Route.
Figure 2: Experimental Equipment Setup.
Personal Computer On the personal computer is the operating system, data collection software (Sony Ericsson TEMS 9.1 data collection) and also the drivers for both the phones used and the GPS which makes them communicate with the TEMS data collection software.
Car Global Positioning System (GPS) The GPS (Garmin Car GPS) determines the position of the system. Hence, it is used to get the co-ordinates (latitude and longitude) of the system’s location on a map pre-installed on the personal computer.
The Pacific Journal of Science and Technology –137– http://www.akamaiuniversity.us/PJST.htm Volume 17. Number 2. November 2016 (Fall)
Mobile Stations Four mobile stations (TEMS Sony Ericsson C-702) were connected to the personal computer. The mobile stations were used to capture the behaviour of the KPIs with each phone being used for each service provider under evaluation Hub. The hub was used to connect the mobile stations to the personal computer. DATA COLLECTION Data was collected from GSM test mobile stations (MS). Each MS was placed on short calls .i.e. ninety (90) seconds call duration with a wait time of ten (10) seconds between each call. MS1 – AIRTEL NIGERIA MS2 – MTN NIGERIA MS3 – GLOBACOM NIGERIA MS4 – ETISALAT NIGERIA
POST PROCESSING TOOLS
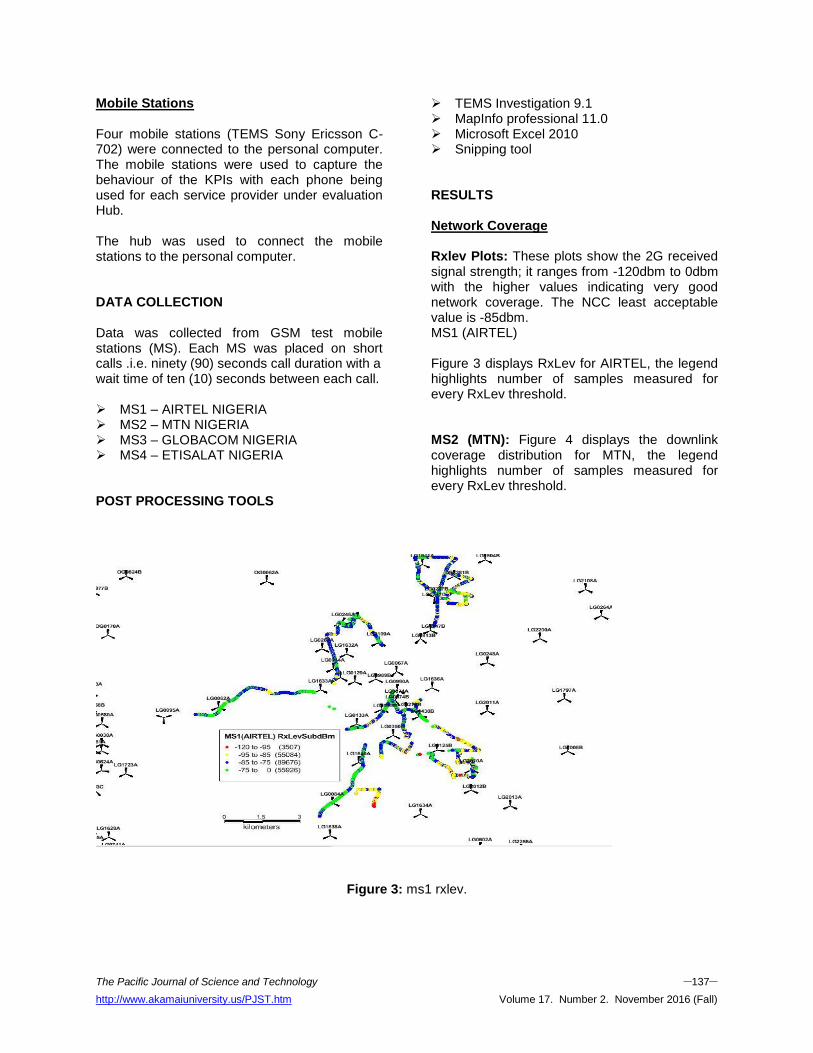
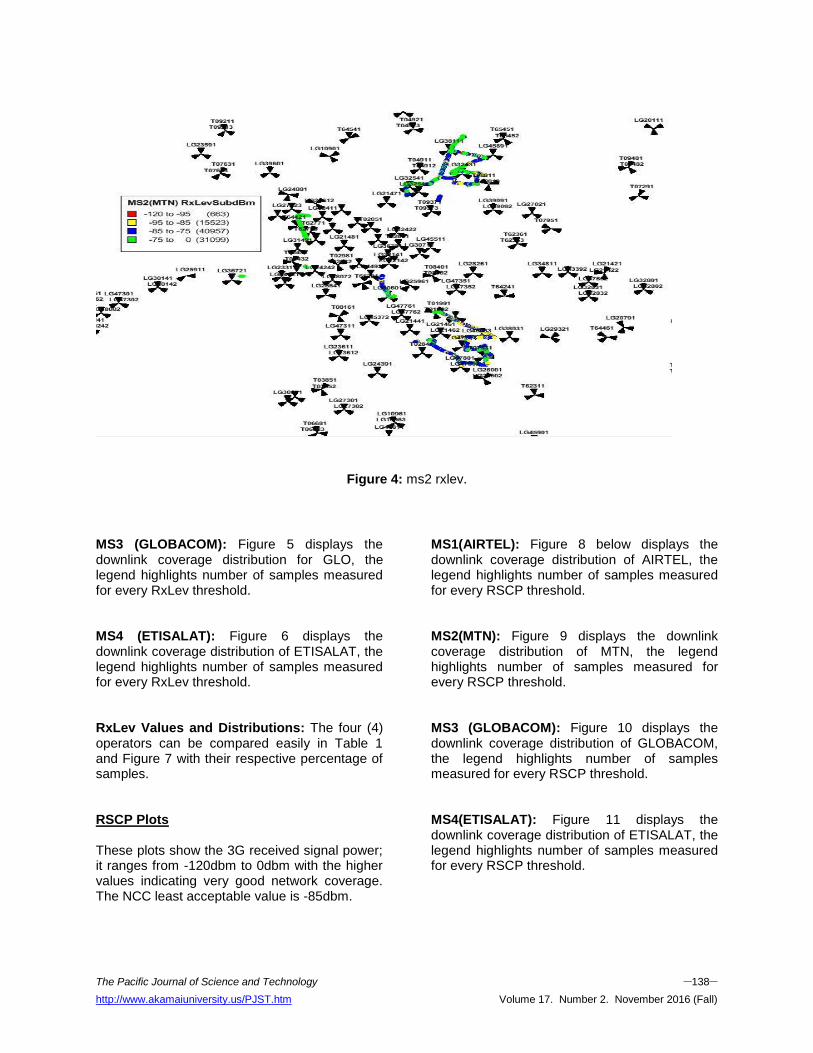
TEMS Investigation 9.1 MapInfo professional 11.0 Microsoft Excel 2010 Snipping tool RESULTS Network Coverage Rxlev Plots: These plots show the 2G received signal strength; it ranges from -120dbm to 0dbm with the higher values indicating very good network coverage. The NCC least acceptable value is -85dbm. MS1 (AIRTEL) Figure 3 displays RxLev for AIRTEL, the legend highlights number of samples measured for every RxLev threshold. MS2 (MTN): Figure 4 displays the downlink coverage distribution for MTN, the legend highlights number of samples measured for every RxLev threshold.
Figure 3: ms1 rxlev.
The Pacific Journal of Science and Technology –138– http://www.akamaiuniversity.us/PJST.htm Volume 17. Number 2. November 2016 (Fall)
Figure 4: ms2 rxlev.
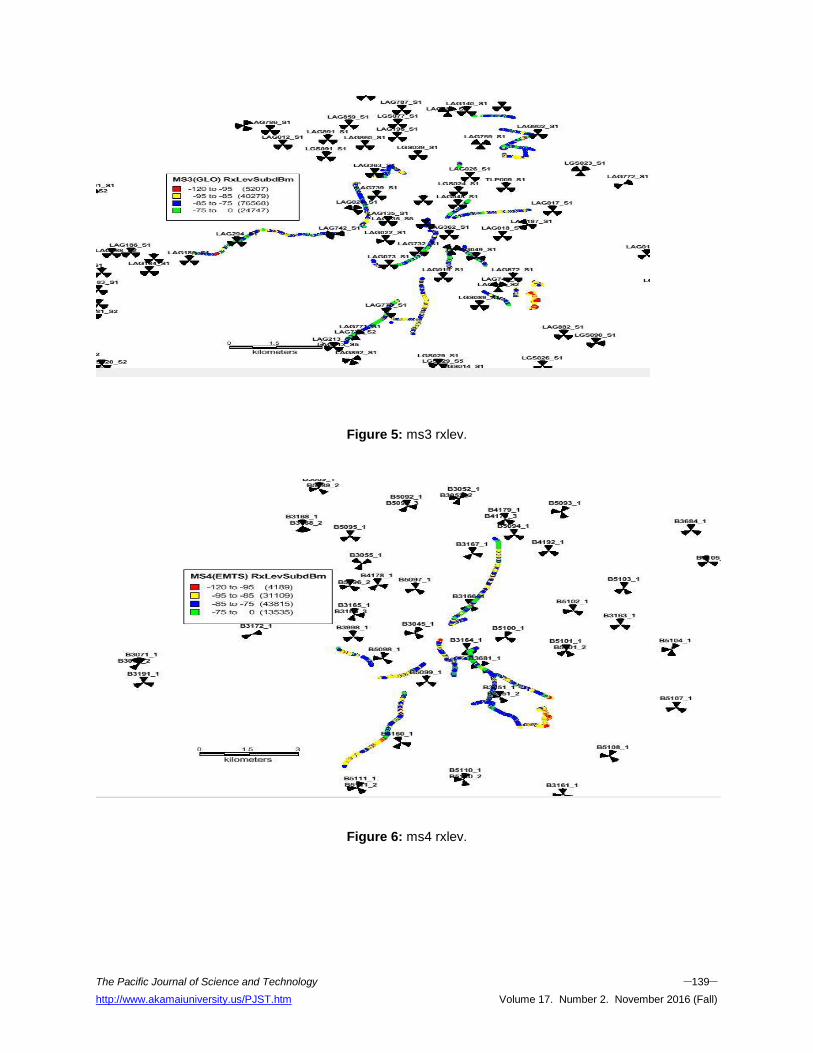
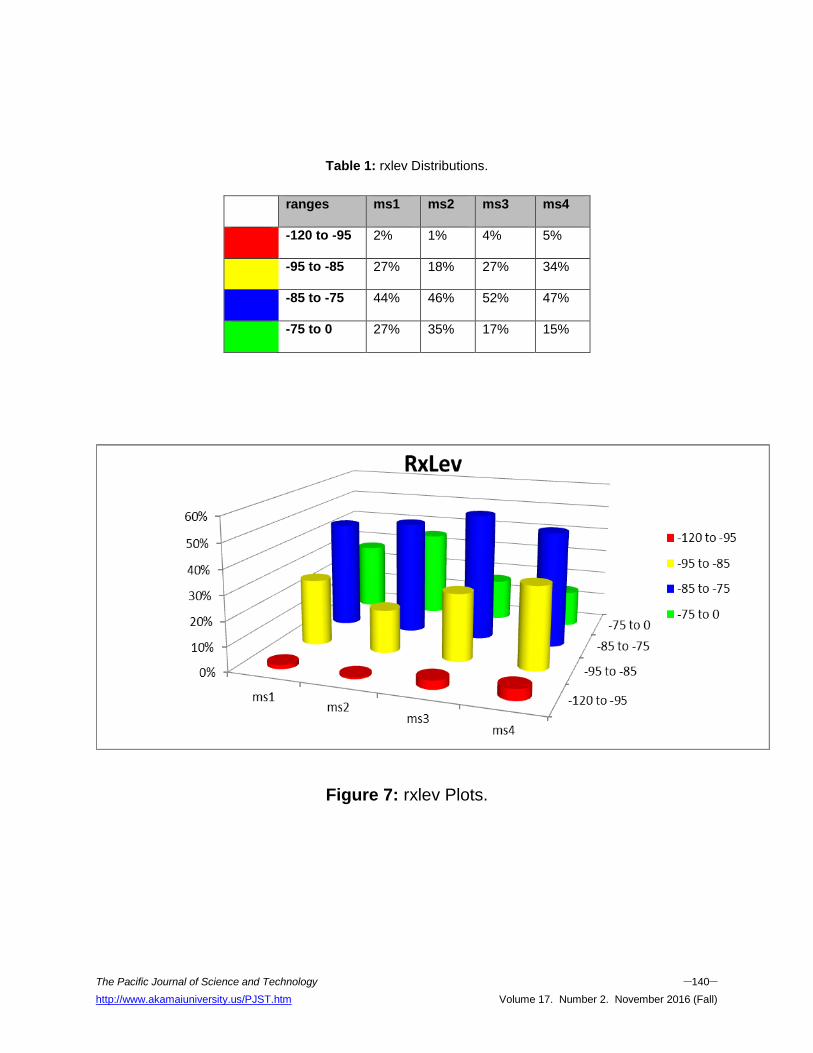
MS3 (GLOBACOM): Figure 5 displays the downlink coverage distribution for GLO, the legend highlights number of samples measured for every RxLev threshold. MS4 (ETISALAT): Figure 6 displays the downlink coverage distribution of ETISALAT, the legend highlights number of samples measured for every RxLev threshold. RxLev Values and Distributions: The four (4) operators can be compared easily in Table 1 and Figure 7 with their respective percentage of samples. RSCP Plots These plots show the 3G received signal power; it ranges from -120dbm to 0dbm with the higher values indicating very good network coverage. The NCC least acceptable value is -85dbm.
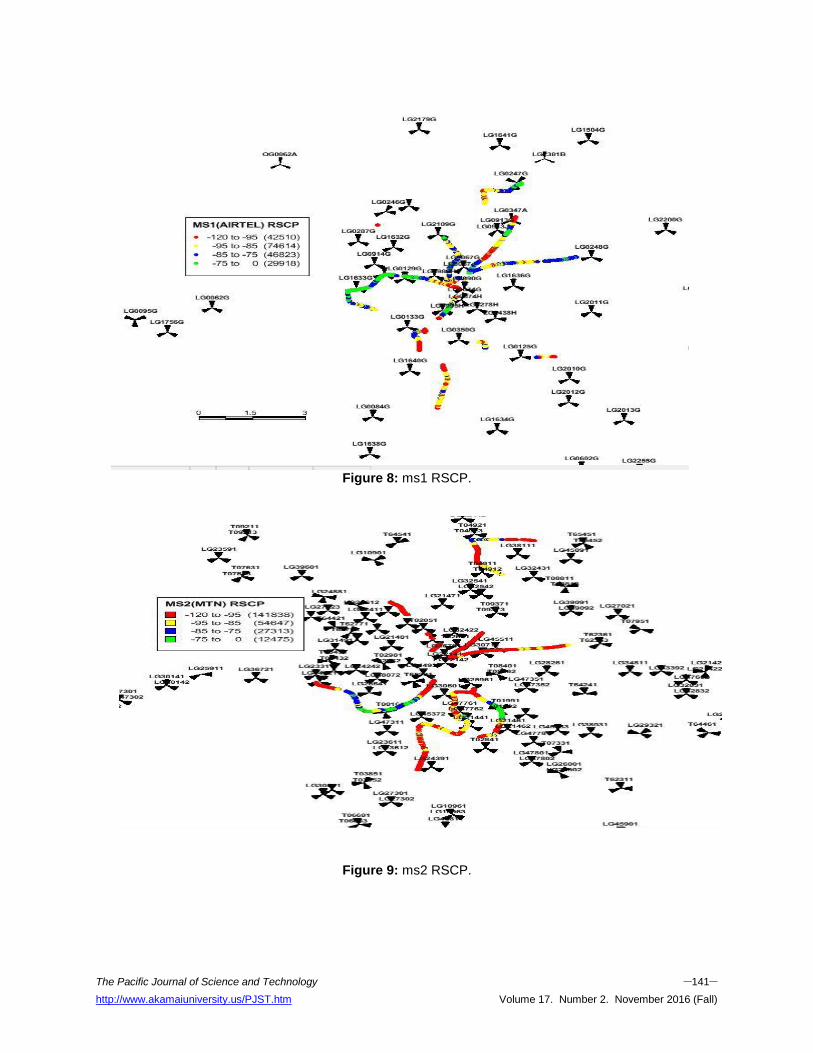
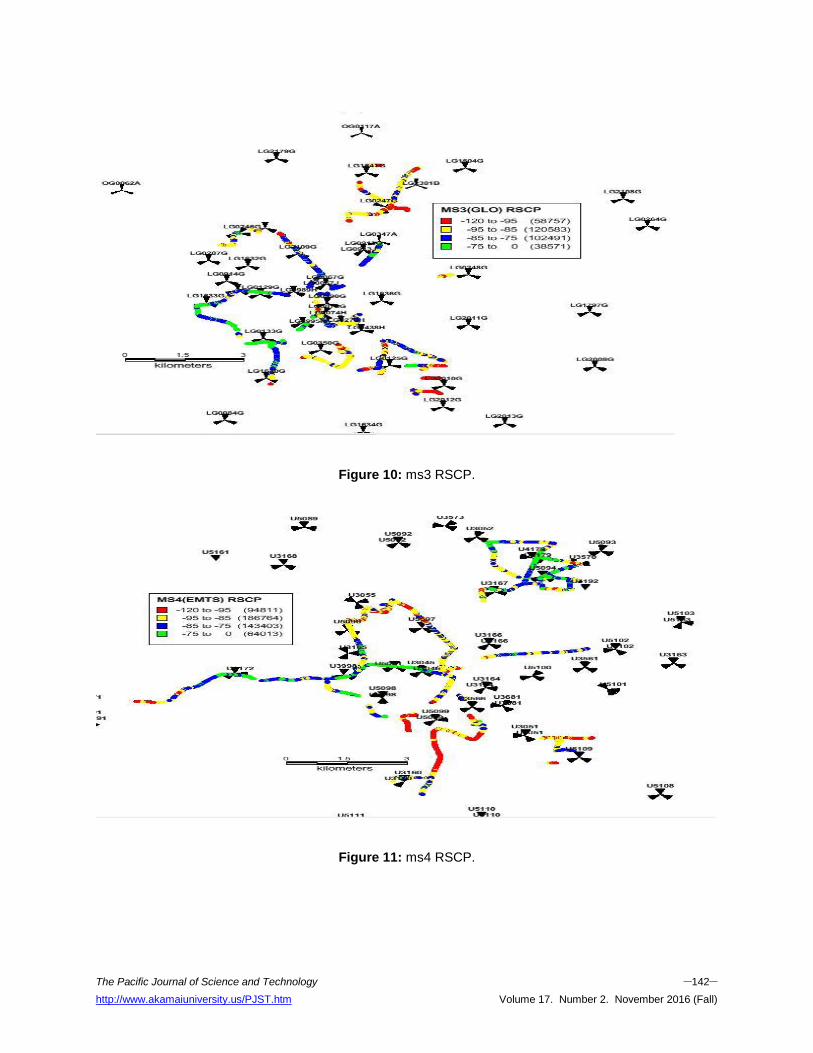
MS1(AIRTEL): Figure 8 below displays the downlink coverage distribution of AIRTEL, the legend highlights number of samples measured for every RSCP threshold. MS2(MTN): Figure 9 displays the downlink coverage distribution of MTN, the legend highlights number of samples measured for every RSCP threshold. MS3 (GLOBACOM): Figure 10 displays the downlink coverage distribution of GLOBACOM, the legend highlights number of samples measured for every RSCP threshold. MS4(ETISALAT): Figure 11 displays the downlink coverage distribution of ETISALAT, the legend highlights number of samples measured for every RSCP threshold.
The Pacific Journal of Science and Technology –139– http://www.akamaiuniversity.us/PJST.htm Volume 17. Number 2. November 2016 (Fall)
Figure 5: ms3 rxlev.
Figure 6: ms4 rxlev.
The Pacific Journal of Science and Technology –140– http://www.akamaiuniversity.us/PJST.htm Volume 17. Number 2. November 2016 (Fall)
Table 1: rxlev Distributions.
ranges ms1 ms2 ms3 ms4
-120 to -95 2% 1% 4% 5%
-95 to -85 27% 18% 27% 34%
-85 to -75 44% 46% 52% 47%
-75 to 0 27% 35% 17% 15%
Figure 7: rxlev Plots.
The Pacific Journal of Science and Technology –141– http://www.akamaiuniversity.us/PJST.htm Volume 17. Number 2. November 2016 (Fall)
Figure 8: ms1 RSCP.
Figure 9: ms2 RSCP.
The Pacific Journal of Science and Technology –142– http://www.akamaiuniversity.us/PJST.htm Volume 17. Number 2. November 2016 (Fall)
Figure 10: ms3 RSCP.
Figure 11: ms4 RSCP.
The Pacific Journal of Science and Technology –143– http://www.akamaiuniversity.us/PJST.htm Volume 17. Number 2. November 2016 (Fall)
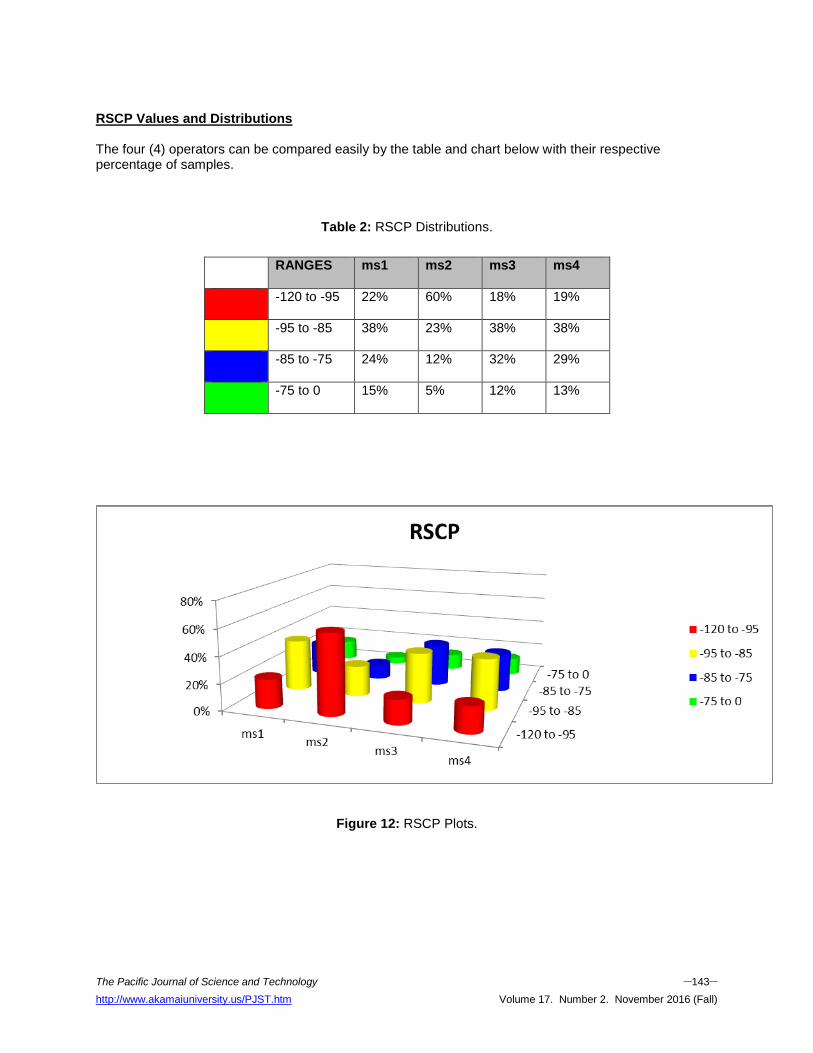
RSCP Values and Distributions The four (4) operators can be compared easily by the table and chart below with their respective percentage of samples.
Table 2: RSCP Distributions.
RANGES ms1 ms2 ms3 ms4
-120 to -95 22% 60% 18% 19%
-95 to -85 38% 23% 38% 38%
-85 to -75 24% 12% 32% 29%
-75 to 0 15% 5% 12% 13%
Figure 12: RSCP Plots.
The Pacific Journal of Science and Technology –144– http://www.akamaiuniversity.us/PJST.htm Volume 17. Number 2. November 2016 (Fall)
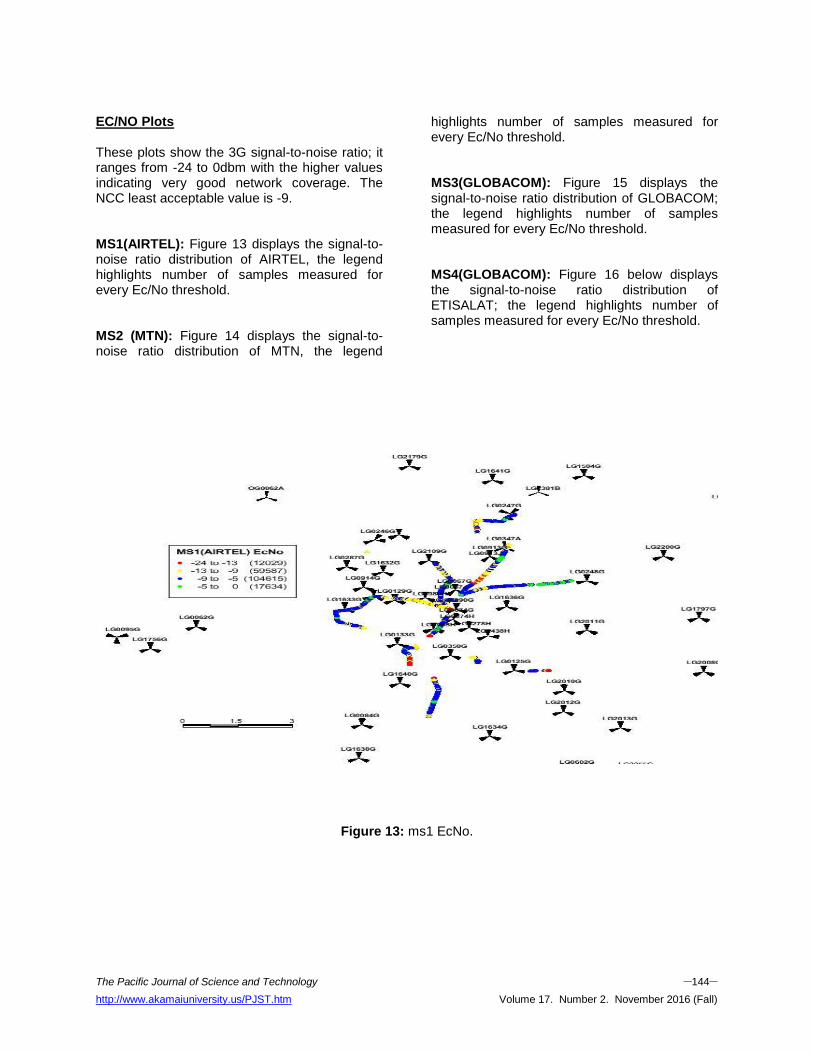
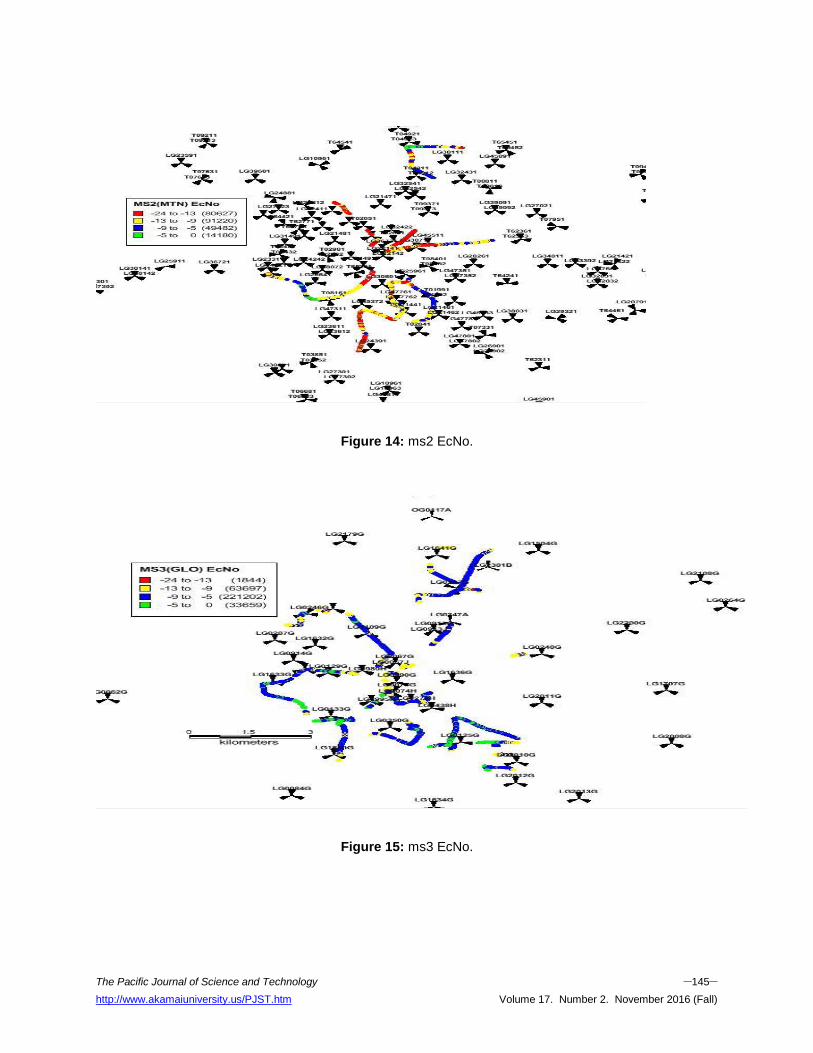
EC/NO Plots These plots show the 3G signal-to-noise ratio; it ranges from -24 to 0dbm with the higher values indicating very good network coverage. The NCC least acceptable value is -9. MS1(AIRTEL): Figure 13 displays the signal-to-noise ratio distribution of AIRTEL, the legend highlights number of samples measured for every Ec/No threshold. MS2 (MTN): Figure 14 displays the signal-to-noise ratio distribution of MTN, the legend
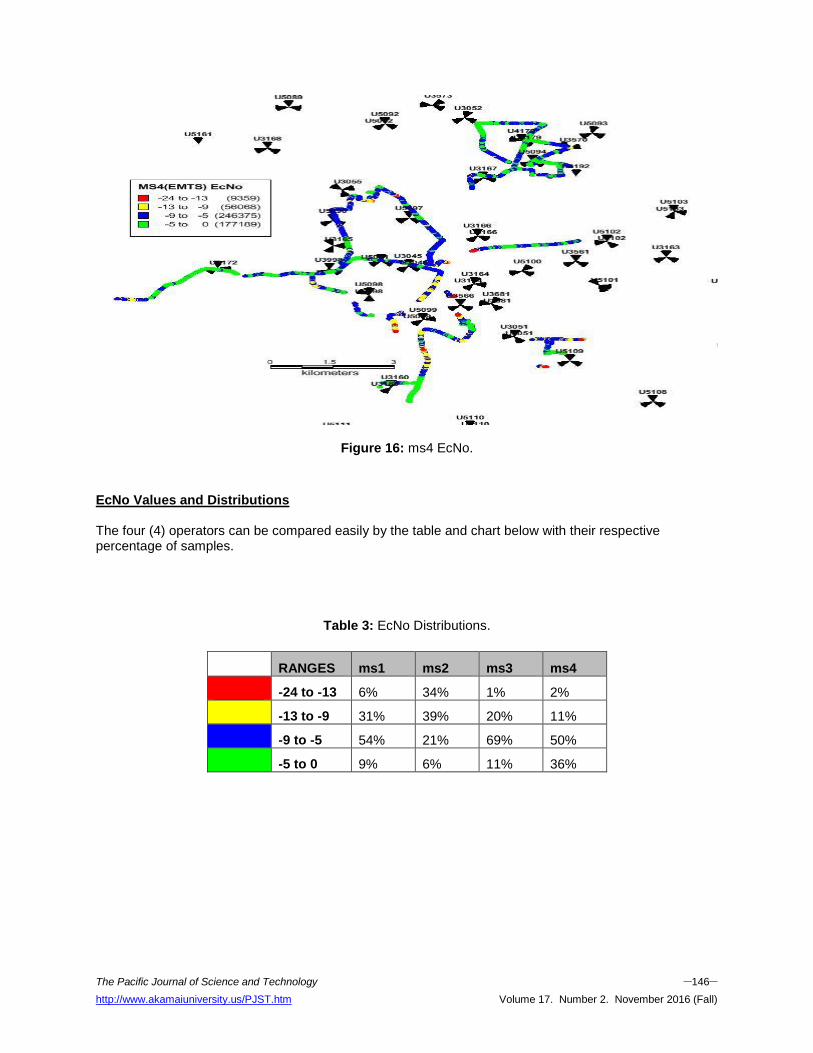
highlights number of samples measured for every Ec/No threshold. MS3(GLOBACOM): Figure 15 displays the signal-to-noise ratio distribution of GLOBACOM; the legend highlights number of samples measured for every Ec/No threshold. MS4(GLOBACOM): Figure 16 below displays the signal-to-noise ratio distribution of ETISALAT; the legend highlights number of samples measured for every Ec/No threshold.
Figure 13: ms1 EcNo.
The Pacific Journal of Science and Technology –145– http://www.akamaiuniversity.us/PJST.htm Volume 17. Number 2. November 2016 (Fall)
Figure 14: ms2 EcNo.
Figure 15: ms3 EcNo.
The Pacific Journal of Science and Technology –146– http://www.akamaiuniversity.us/PJST.htm Volume 17. Number 2. November 2016 (Fall)
Figure 16: ms4 EcNo.
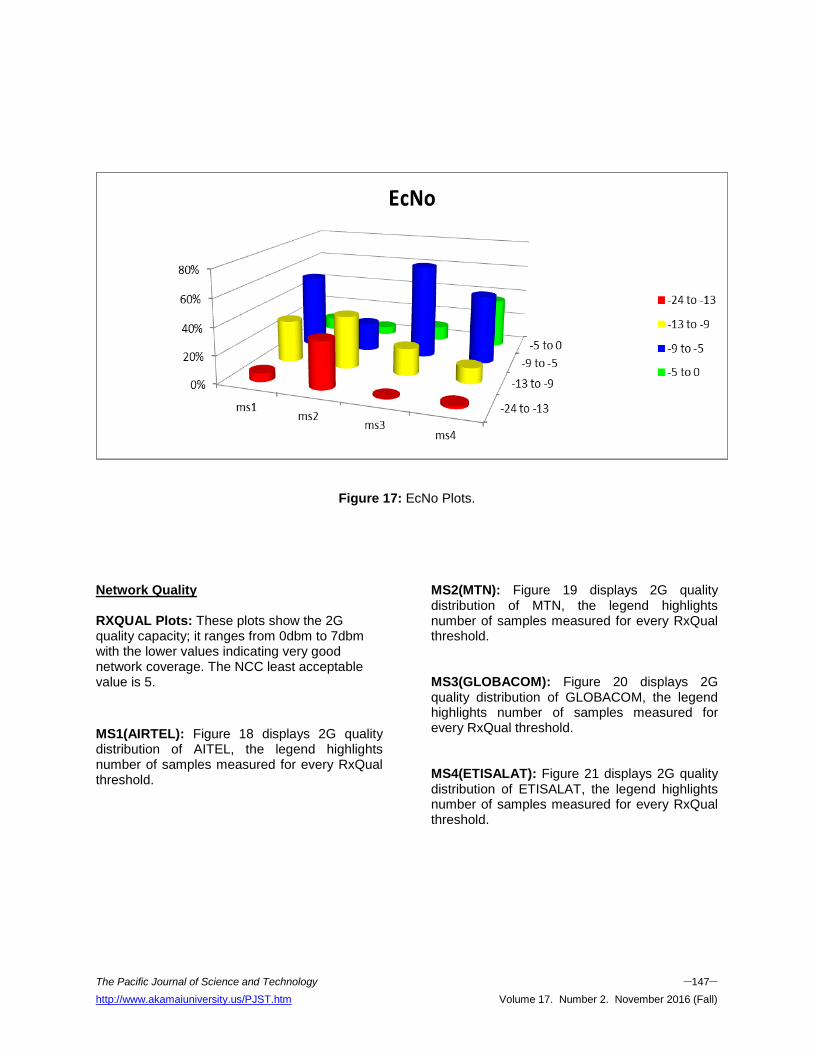
EcNo Values and Distributions The four (4) operators can be compared easily by the table and chart below with their respective percentage of samples.
Table 3: EcNo Distributions.
RANGES ms1 ms2 ms3 ms4
-24 to -13 6% 34% 1% 2%
-13 to -9 31% 39% 20% 11%
-9 to -5 54% 21% 69% 50%
-5 to 0 9% 6% 11% 36%
The Pacific Journal of Science and Technology –147– http://www.akamaiuniversity.us/PJST.htm Volume 17. Number 2. November 2016 (Fall)
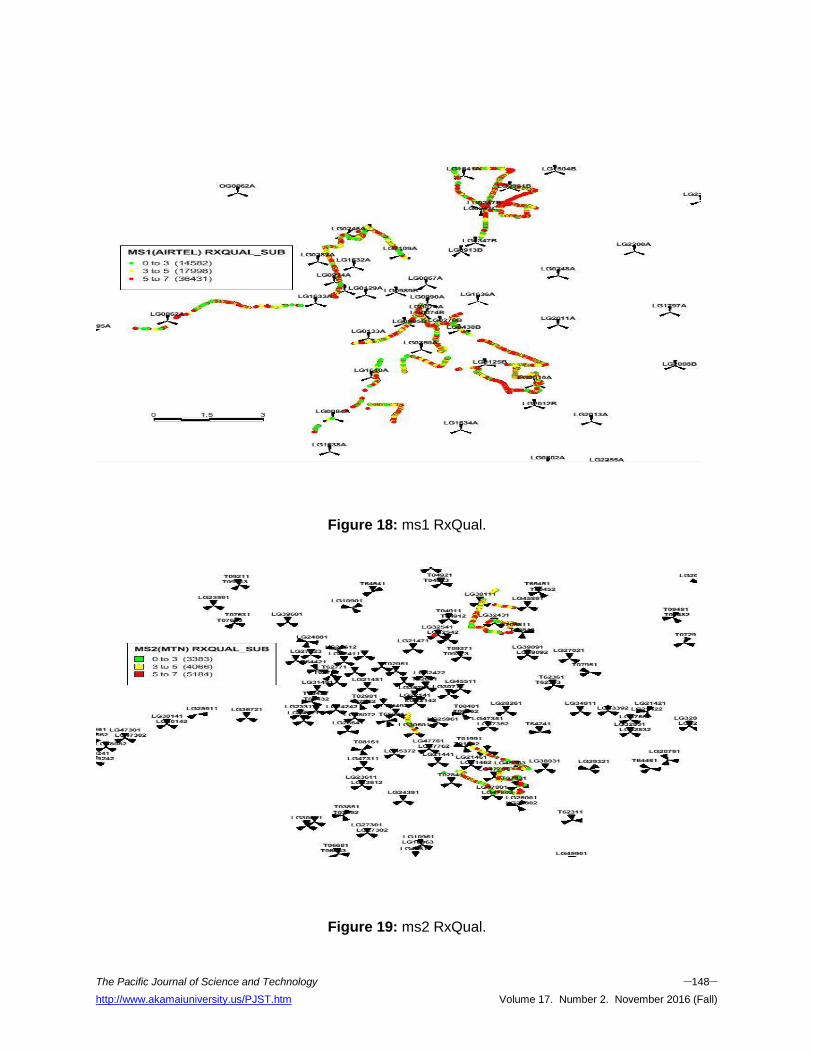
Figure 17: EcNo Plots. Network Quality RXQUAL Plots: These plots show the 2G quality capacity; it ranges from 0dbm to 7dbm with the lower values indicating very good network coverage. The NCC least acceptable value is 5.
MS1(AIRTEL): Figure 18 displays 2G quality distribution of AITEL, the legend highlights number of samples measured for every RxQual threshold.
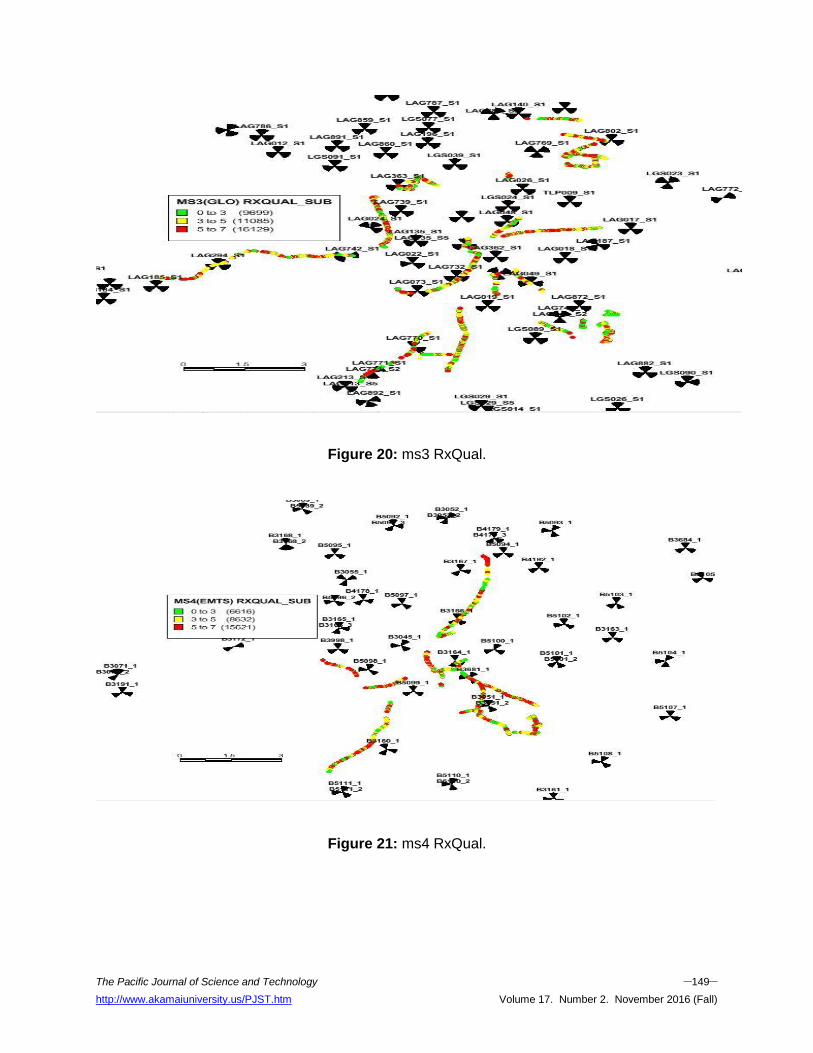
MS2(MTN): Figure 19 displays 2G quality distribution of MTN, the legend highlights number of samples measured for every RxQual threshold. MS3(GLOBACOM): Figure 20 displays 2G quality distribution of GLOBACOM, the legend highlights number of samples measured for every RxQual threshold. MS4(ETISALAT): Figure 21 displays 2G quality distribution of ETISALAT, the legend highlights number of samples measured for every RxQual threshold.
The Pacific Journal of Science and Technology –148– http://www.akamaiuniversity.us/PJST.htm Volume 17. Number 2. November 2016 (Fall)
Figure 18: ms1 RxQual.
Figure 19: ms2 RxQual.
The Pacific Journal of Science and Technology –149– http://www.akamaiuniversity.us/PJST.htm Volume 17. Number 2. November 2016 (Fall)
Figure 20: ms3 RxQual.
Figure 21: ms4 RxQual.
The Pacific Journal of Science and Technology –150– http://www.akamaiuniversity.us/PJST.htm Volume 17. Number 2. November 2016 (Fall)
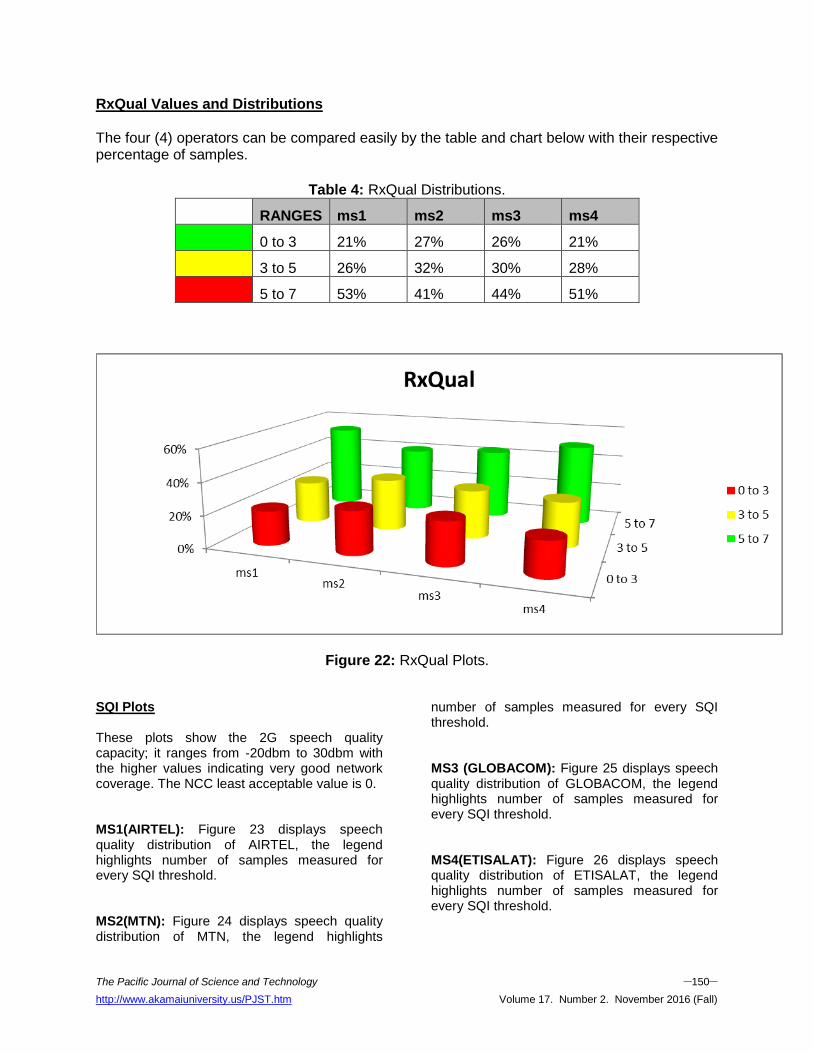
RxQual Values and Distributions The four (4) operators can be compared easily by the table and chart below with their respective percentage of samples.
Table 4: RxQual Distributions.
RANGES ms1 ms2 ms3 ms4
0 to 3 21% 27% 26% 21%
3 to 5 26% 32% 30% 28%
5 to 7 53% 41% 44% 51%
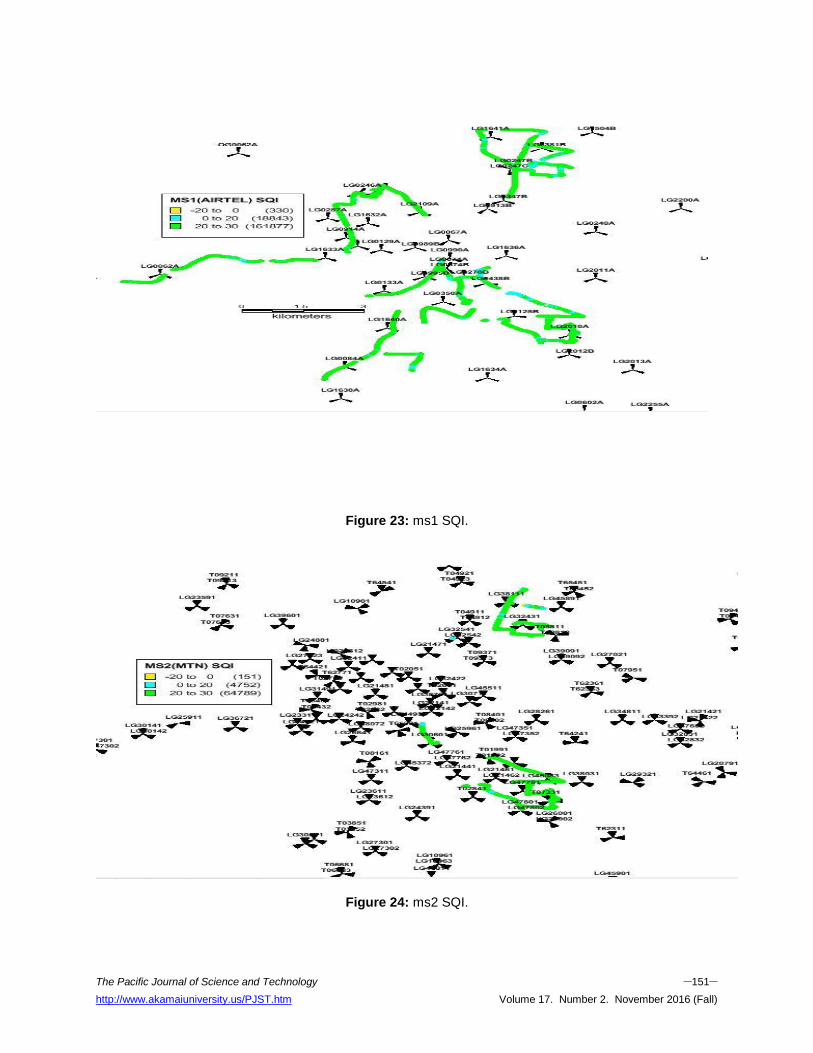
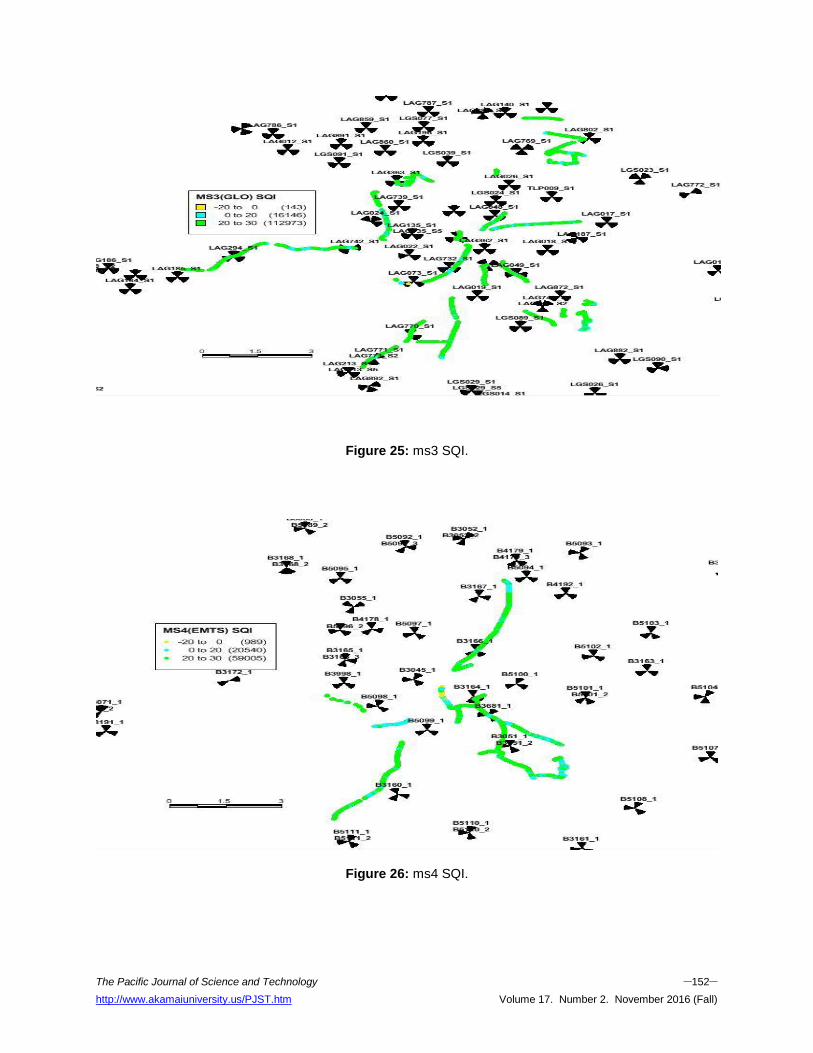
Figure 22: RxQual Plots. SQI Plots These plots show the 2G speech quality capacity; it ranges from -20dbm to 30dbm with the higher values indicating very good network coverage. The NCC least acceptable value is 0. MS1(AIRTEL): Figure 23 displays speech quality distribution of AIRTEL, the legend highlights number of samples measured for every SQI threshold. MS2(MTN): Figure 24 displays speech quality distribution of MTN, the legend highlights
number of samples measured for every SQI threshold. MS3 (GLOBACOM): Figure 25 displays speech quality distribution of GLOBACOM, the legend highlights number of samples measured for every SQI threshold. MS4(ETISALAT): Figure 26 displays speech quality distribution of ETISALAT, the legend highlights number of samples measured for every SQI threshold.
The Pacific Journal of Science and Technology –151– http://www.akamaiuniversity.us/PJST.htm Volume 17. Number 2. November 2016 (Fall)
Figure 23: ms1 SQI.
Figure 24: ms2 SQI.
The Pacific Journal of Science and Technology –152– http://www.akamaiuniversity.us/PJST.htm Volume 17. Number 2. November 2016 (Fall)
Figure 25: ms3 SQI.
Figure 26: ms4 SQI.
The Pacific Journal of Science and Technology –153– http://www.akamaiuniversity.us/PJST.htm Volume 17. Number 2. November 2016 (Fall)
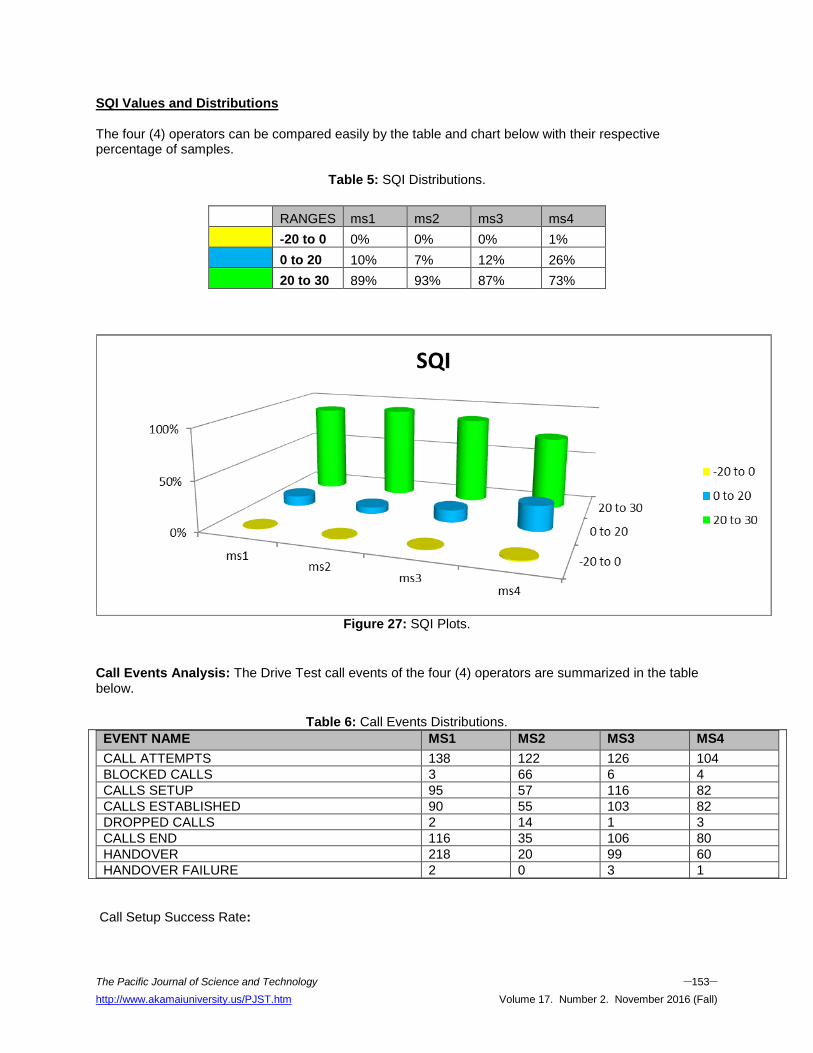
SQI Values and Distributions The four (4) operators can be compared easily by the table and chart below with their respective percentage of samples.
Table 5: SQI Distributions.
RANGES ms1 ms2 ms3 ms4
-20 to 0 0% 0% 0% 1%
0 to 20 10% 7% 12% 26%
20 to 30 89% 93% 87% 73%
Figure 27: SQI Plots.
Call Events Analysis: The Drive Test call events of the four (4) operators are summarized in the table below.
Table 6: Call Events Distributions.
EVENT NAME MS1 MS2 MS3 MS4
CALL ATTEMPTS 138 122 126 104
BLOCKED CALLS 3 66 6 4
CALLS SETUP 95 57 116 82
CALLS ESTABLISHED 90 55 103 82
DROPPED CALLS 2 14 1 3
CALLS END 116 35 106 80
HANDOVER 218 20 99 60
HANDOVER FAILURE 2 0 3 1
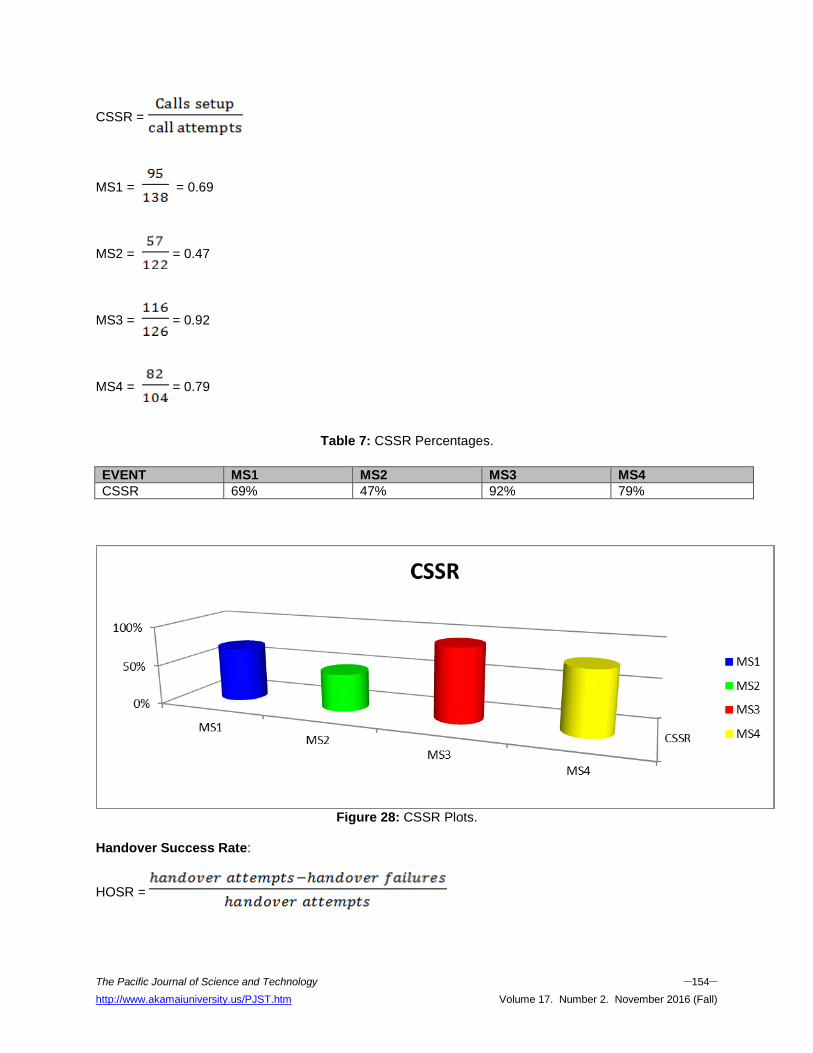
Call Setup Success Rate:
The Pacific Journal of Science and Technology –154– http://www.akamaiuniversity.us/PJST.htm Volume 17. Number 2. November 2016 (Fall)
CSSR =
MS1 = = 0.69
MS2 = = 0.47
MS3 = = 0.92
MS4 = = 0.79
Table 7: CSSR Percentages.
EVENT MS1 MS2 MS3 MS4
CSSR 69% 47% 92% 79%
Figure 28: CSSR Plots.
Handover Success Rate:
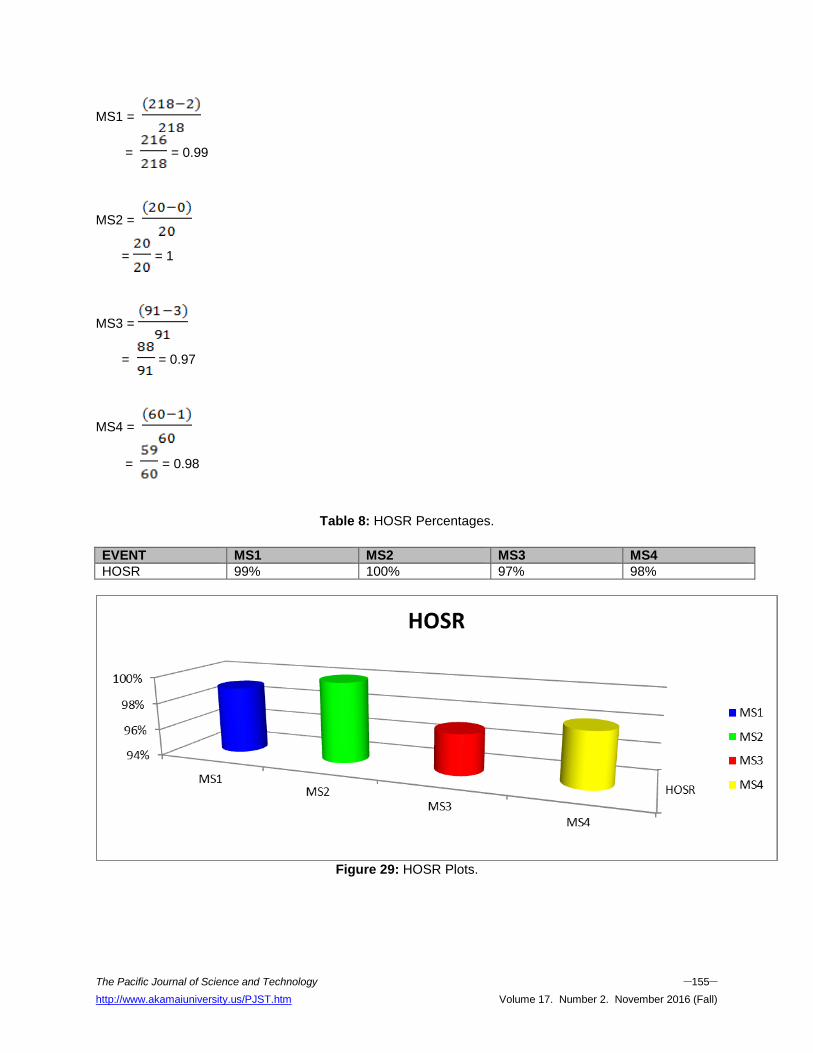
HOSR =
The Pacific Journal of Science and Technology –155– http://www.akamaiuniversity.us/PJST.htm Volume 17. Number 2. November 2016 (Fall)
MS1 =
= = 0.99
MS2 =
= = 1
MS3 =
= = 0.97
MS4 =
= = 0.98
Table 8: HOSR Percentages.
EVENT MS1 MS2 MS3 MS4
HOSR 99% 100% 97% 98%
Figure 29: HOSR Plots.
The Pacific Journal of Science and Technology –156– http://www.akamaiuniversity.us/PJST.htm Volume 17. Number 2. November 2016 (Fall)
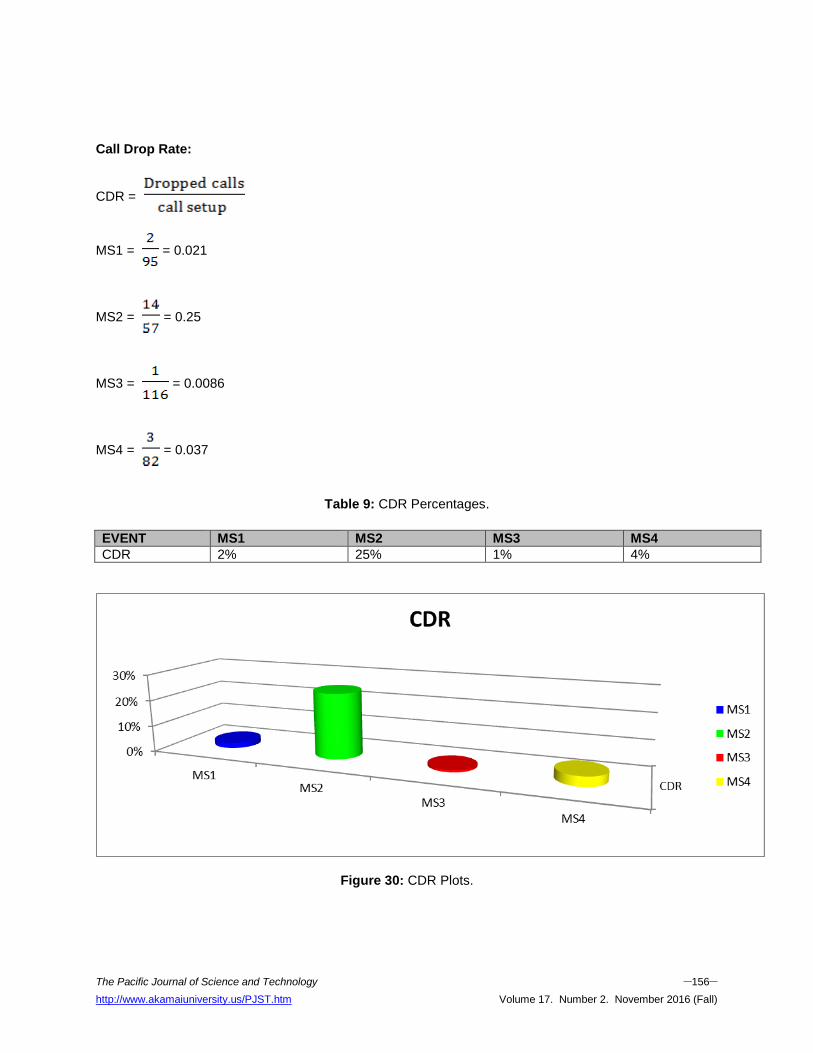
Call Drop Rate:
CDR =
MS1 = = 0.021
MS2 = = 0.25
MS3 = = 0.0086
MS4 = = 0.037
Table 9: CDR Percentages.
EVENT MS1 MS2 MS3 MS4
CDR 2% 25% 1% 4%
Figure 30: CDR Plots.
The Pacific Journal of Science and Technology –157– http://www.akamaiuniversity.us/PJST.htm Volume 17. Number 2. November 2016 (Fall)
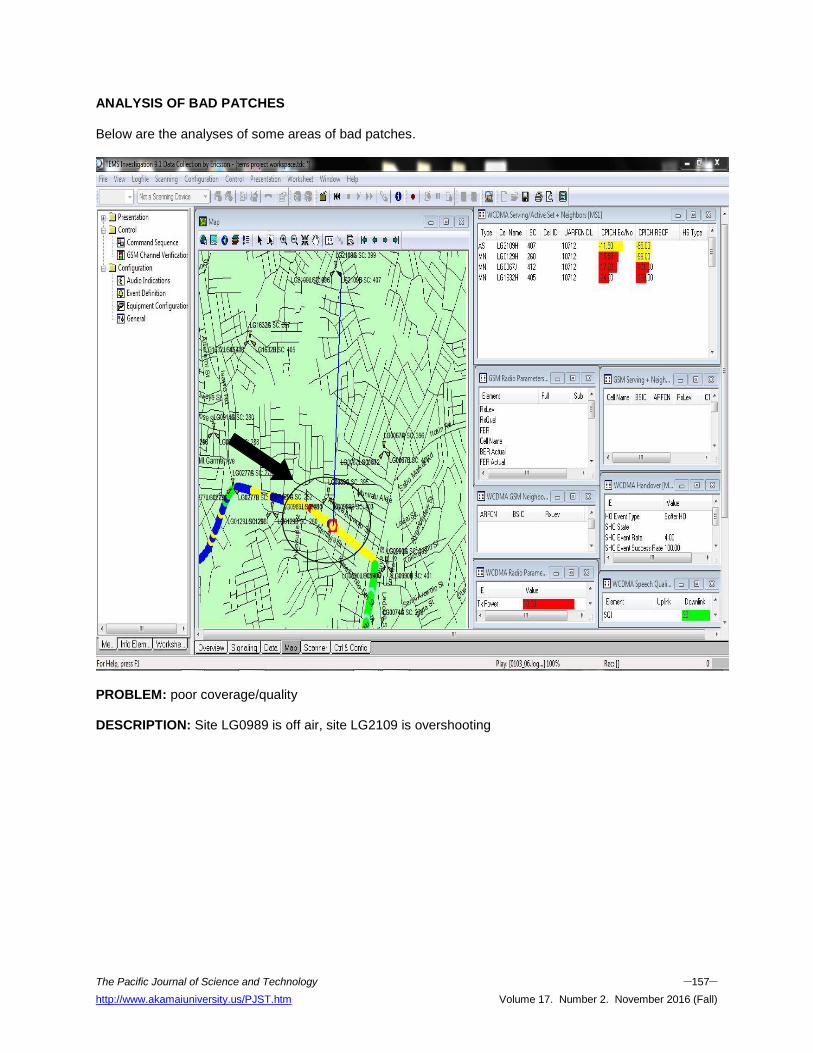
ANALYSIS OF BAD PATCHES Below are the analyses of some areas of bad patches.
PROBLEM: poor coverage/quality DESCRIPTION: Site LG0989 is off air, site LG2109 is overshooting
The Pacific Journal of Science and Technology –158– http://www.akamaiuniversity.us/PJST.htm Volume 17. Number 2. November 2016 (Fall)
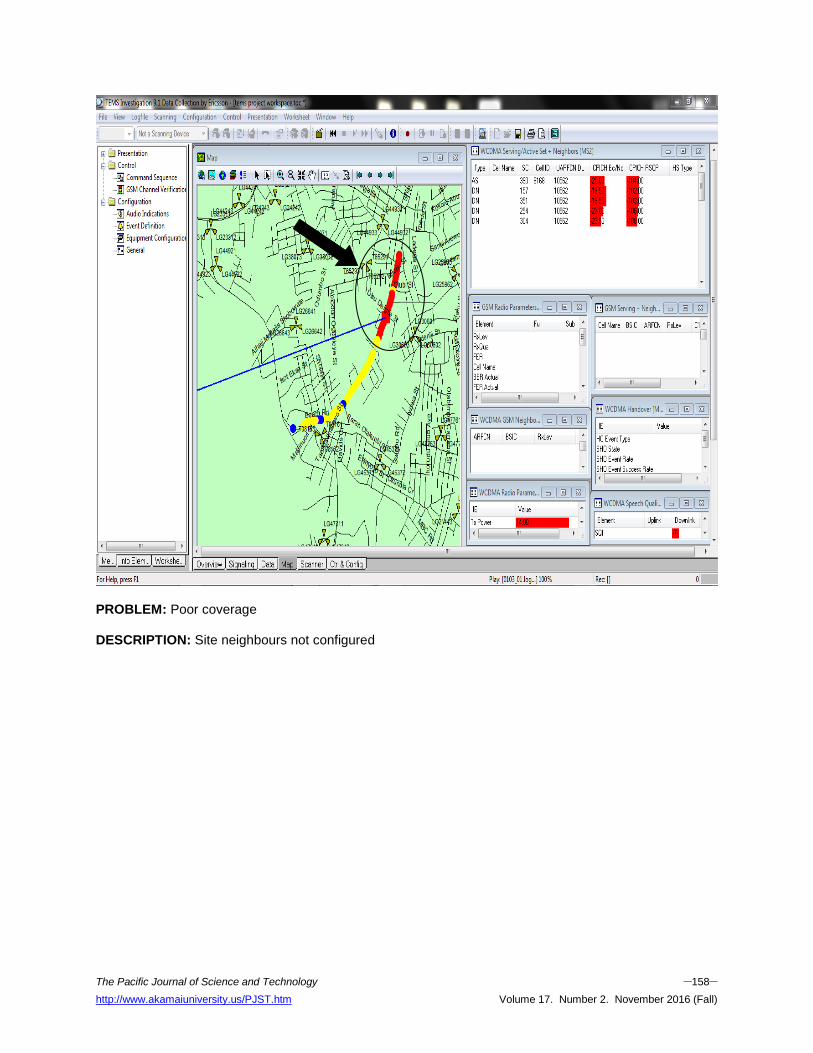
PROBLEM: Poor coverage DESCRIPTION: Site neighbours not configured
The Pacific Journal of Science and Technology –159– http://www.akamaiuniversity.us/PJST.htm Volume 17. Number 2. November 2016 (Fall)
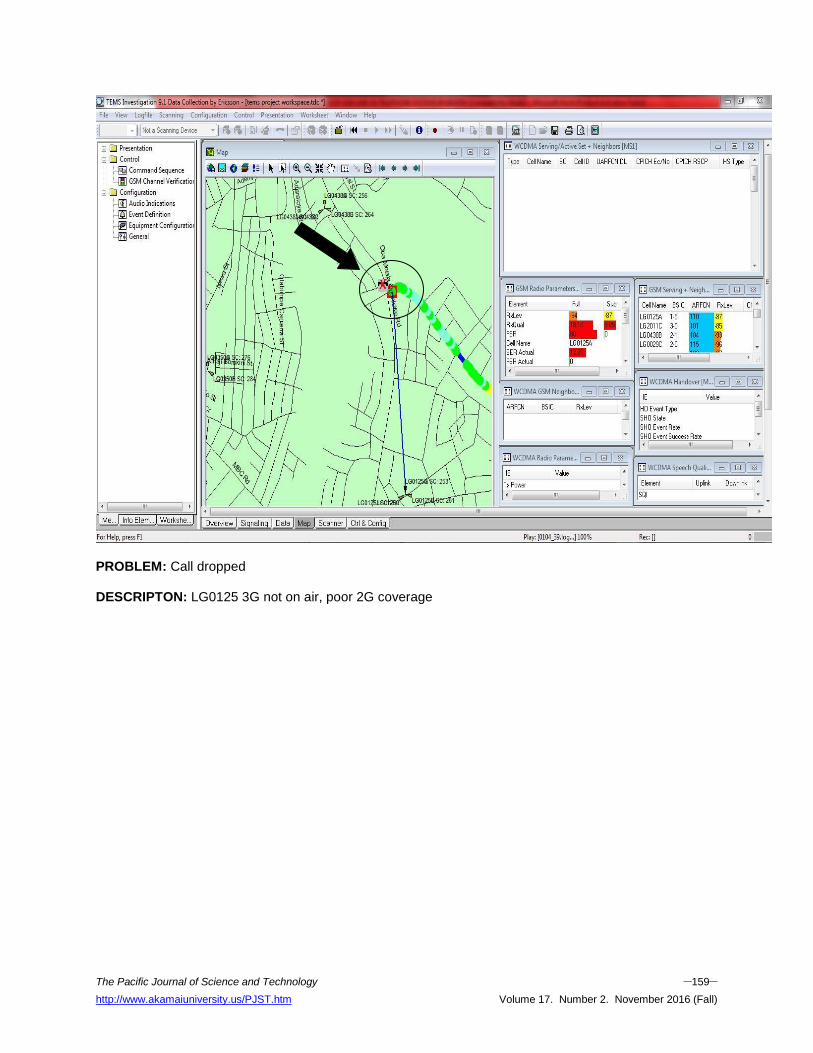
PROBLEM: Call dropped DESCRIPTON: LG0125 3G not on air, poor 2G coverage
The Pacific Journal of Science and Technology –160– http://www.akamaiuniversity.us/PJST.htm Volume 17. Number 2. November 2016 (Fall)
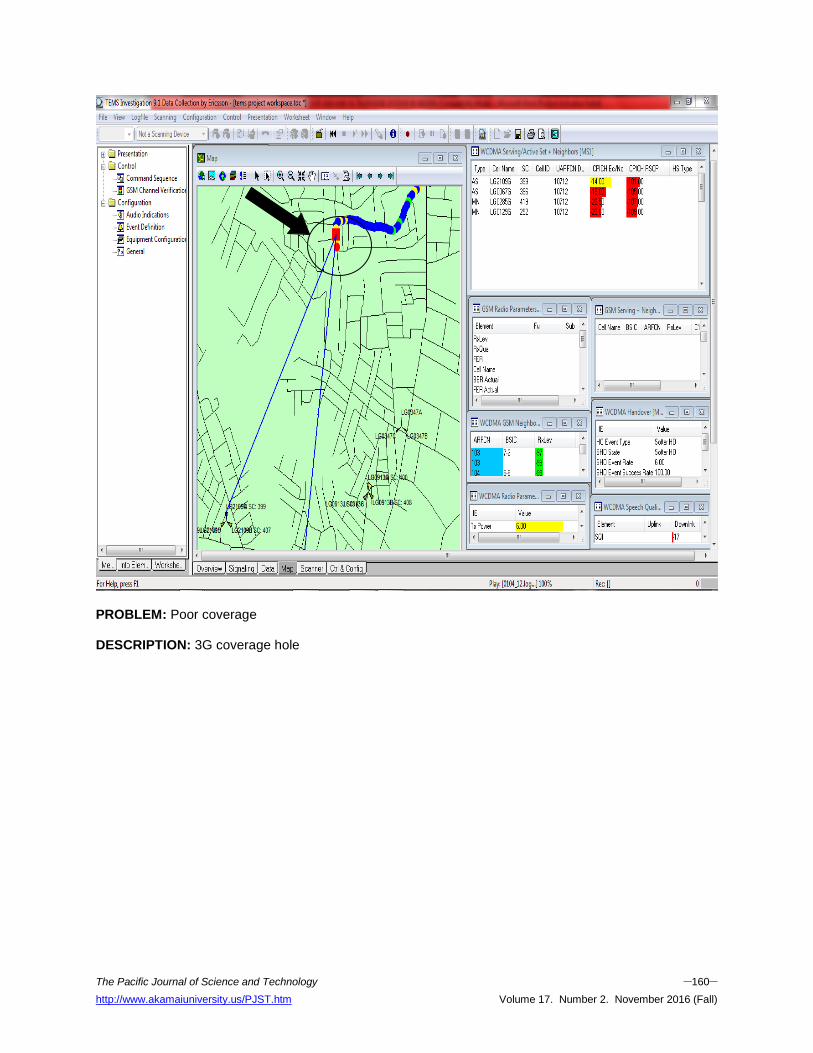
PROBLEM: Poor coverage DESCRIPTION: 3G coverage hole

The Pacific Journal of Science and Technology –161– http://www.akamaiuniversity.us/PJST.htm Volume 17. Number 2. November 2016 (Fall)
PROBLEMS:
A- Handover failure B- Coverage hole
DESCRIPTION:
A- No service mode B- Poor coverage
RESULTS As seen in the RSCP rankings, GLOBACOM
has the best 3G coverage while MTN is the poorest.
For EcNo rankings, ETISALAT has the best signal-to-noise while MTN has the worst.
MTN has the best 2G coverage with ETISALAT being the poorest.
AIRTEL generally has the worst 2G quality capacity while MTN has the best 2G quality.
The CSSR table shows that GLOBACOM has the best call setup rate while MTN has the worst call setup rate.
As seen in the HOSR table, AIRTEL has no handover failure while GLOBACOM has the highest number of handover failure with percentage of 3%.
From the CDR table, GLOBACOM has the lowest call drop, with MTN having the highest call drop
The Pacific Journal of Science and Technology –162– http://www.akamaiuniversity.us/PJST.htm Volume 17. Number 2. November 2016 (Fall)
CONCLUSION The following conclusions have been drawn from the results of this research. MTN has poor network retainability, service
retainability and network retainability
AIRTEL has good 2G coverage level and quality but a poor 3G coverage and quality
AIRTEL has poor CSSR and below par CDR
GLOBACOM has a fair 2G coverage and quality and a good 3G coverage and quality
GLOBACOM has good CSSR and CDR
ETISALAT has poor 2G coverage and quality but good 3G coverage and fair 3G quality
ETISALAT has good CSSR and poor CDR
All the networks have very high handover success rate
All the networks do not meet up the NCC standard for network coverage and quality
RECOMMENDATION Based on the result deduced from the above analysis, the following measures are recommended to improve the quality of service rendered to subscribers. 1. Power stability can help reduce over-
dependence of base stations on generators for power supply, this can help reduce call tariff.
2. Additional base stations should be installed to decongest the existing base stations.
3. More 3G equipment should be installed on base stations for effective coverage and quality.
4. Equipment not working as expected should be changed.
5. Neighbour list should be configured for effective handover both within a base station and between base stations.
6. In cases where there are alarms on site, they should be cleared.
7. For cases of overshooting, antenna sectors should be down tilted.
8. Swaps should be corrected.
9. Base stations that are offline should be brought on air.
10. General optimization of base stations should be done.
11. Additional switching centres should be built across the country to increase capacity.
REFERENCES 1. Abdullahi, S.U. 2008. Evaluation Of Quality Of
Service Key Performance Indicators. Kaduna.
2. Adegoke, A.S. and I.T. Babalola. 2011. “Quality of Service Analysis of GSM Telephone System in Nigeria”. American Journal Of Scientific And Industrial Research. 1-6.
3. Sireesha, B.V., S.Varadarajan, and V. Naresh. (N.D.). “Increasing Of Call Success Rate In Gsm Service Area”. International Journal of Engineering Research, 1479-1485.
4. Emagbetere, J.O., F.A. Aigbodioh, and F.O. Edeko. 2009. “Radio Network Planning For Gsm900 In A Rural Environment”. Journal of Mobile Communication. 3(1):8- 11.
5. Hardy, C.W. 2001. QOS - Measurement and
Evaluation of Telecom. John Wiley & Sons, Ltd.: London, UK.
6. Helhel, S.¸ S. Ozen, and H.G. Oksu. 2008. “Investigation of GSM Signal Variation Dry”. Progress in Electromagnetics Research. 1-11.
7. Kuboye, B M. 2010. “Optimization Models for
Minimizing Congestion in GSM in Nigeria”. Journal Media and Communication Studies. 122-126.
8. Longe, F.A. 2011. “Subscribers’ Perception of the
Quality of Service (QOS) of the GSM Services in Ibadan, Nigeria”. Computing, Information Systems & Development Informatics Journal, 1-26.
9. Moses, E. 2010. “QOS Reliability in GPRS Systems”. Modern Applied Science, 1-14.
10. Muhammad, A A. 2001. Inter Operator Benchmarking Reports. 28.
The Pacific Journal of Science and Technology –163– http://www.akamaiuniversity.us/PJST.htm Volume 17. Number 2. November 2016 (Fall)
11. Nandakumar, N. 2009. Rough Guide to 3G and HSOA. Nandu’s Rough Guides, 40.
12. Ndukwe, E. 2008. ”Seven Years of Telecoms Revolution”. Tell Magazine of Nigeria.
13. Ndukwe, E. 2004, “An Overview of the Nigerian Telecommunications Environment”. Nigerian Communications Commission.
14. Rodrigo. 2012, “Mobile Telecommunications Providers in Nigeria”. Write Pass Journal.
15. Sebiotimo, A.A. and E. Oladoyin. 2012. Analysis Of Log Files. Huawei.
16. Shalangwa, D.A. and S.K. Singh. 2011. “Monitoring
and Evaluation of GSM Signal Strength”. International Journal of Computer Science and Network Security. 1-4.
17. Shoewu, O.O. and L.A. Akinyemi. 2013. “Reliable Mobility Management in Future Communication Networks”. Research Journal of Computer Systems Engineering.
18. Shoewu, O.O. and L.A. Akinyemi. “The Effect of Climatic Change on GSM Signal Propagation”. Research Journal Of Computer Systems Engineering.
19. Shoewu, O. and F.O. Edeko. 2011. “Analysis of Radio Wave Propagation in Lagos Environs”. American Journal Of Scientific And Industrial Research. 1-18.
20. Shoewu, O. and F.O. Edeko. 2011. “Outgoing Call Quality Evaluation of GSM Network Services in Epe, Lagos”. American Journal of Scientific and Industrial Research. 1-9.
21. Somer, G. 2003. “Optimization and Logfile Analysis
In GSM”. 1-94.
22. Stangierski. 2010. “Measures of Quality of Telecommunications Services in the Channel Islands”.. Channel Islands Competitions And Regulatory Authorities, 1-33.
SUGGESTED CITATION A.O. Ogunlewe, O. Shoewu, and N.T. Makanjuola. 2016. “QoS – Comparative Management and Evaluation of GSM Telephone System in Nigeria”. Pacific Journal of Science and Technology. 17(2):134-163.
Pacific Journal of Science and Technology