qms cattle & sheep enterprise profitability in scotland 2013
DESCRIPTION
ÂTRANSCRIPT

2013 Edition
Cattle and Sheep Enterprise Profitability in Scotland

Quality Meat Scotland (QMS)
© QMS copyright 2013
ISSN 2051-560X
Cattle and Sheep Enterprise Profitability in Scotland
Cattle and Sheep Enterprise Profitability in Scotland 3
EXECUtiVE SUMMARY 4
intRodUCtion 8
Cost Price Changes During 2012 10
2013 Prospects 13
Structural Changes in 2012 15
CAttLE EntERPRiSES
Results from LFA hill suckler herds 17
Results from LFA suckler herds 20
Results from non-LFA lowground suckler herds 26
Results from rearer finisher enterprises 29
Results from cereal-based cattle finishing enterprises 33
Results from forage-based cattle finishing enterprises 36
SHEEP EntERPRiSES
Results from LFA hill ewe flocks 41
Results from LFA upland ewe flocks 44
Results from lowground breeding flocks 46
Results from store lamb finishing enterprises 48
iMPRoVinG REtURnS tHRoUGH QUALitY 52
EStiMAtion oF non-CASH CoSt oF PRodUCinG CAttLE And SHEEP 54
CoMPARiSonS WitH 2010 And 2011 57
Cattle Enterprises
Suckler herds 59
Cattle finishing 62
Sheep Enterprises
LFA sheep 63
Lowground sheep 64
Lamb finishing 65
GLoSSARY 66
ContEntS

4 Cattle and Sheep Enterprise Profitability in Scotland
• This report on enterprise profitability covers the 2012 calf and lamb crop year, a period of challenging weather conditions that tested the resilience of farmers and livestock alike. For many businesses it resulted in increased feed and veterinary costs and greater wear and tear on infrastructure. For others it resulted in changed sale profiles resulting in the sale of lighter animals. These challenging weather conditions were a major contributor to the results of the 2012 Scottish calf and lamb crop year survey showing a decline in margins over the past year across all enterprise types surveyed except intensive cereal-based finishers of cattle.
• The results continue to demonstrate the difficulty among suckler cattle producers to achieve a positive margin from the market place. Only 22% of the suckler herds surveyed reported a positive net margin from which to pay family labour and reward the risk capital invested in the business, down from 30% last year. Margins were maintained more easily among store cattle finishers where 59% of businesses surveyed achieved a positive net margin, little changed from the 60% which achieved this objective last year. Falling margins among ewe flocks resulted in 19% of hill flocks returning a positive margin, down from 57% last year. Forty seven per cent of upland flocks recorded a positive net margin, down from 100% last year, while among lowground flocks 83% of those surveyed recorded a positive margin, down from 100% last year. Half of the store lamb finishers achieved a positive net margin compared to 92% achieving this objective last year. Nevertheless, even those businesses reporting positive net margins still struggled to deliver a fair return for labour and capital.
• The survey results continue to show significant variation in levels of financial and technical performance within the industry. Indeed across several of the cattle enterprise types, those in the top third reported higher margins than those in the top third in 2011 even although the average margin fell in all cases. In common with previous years there are a number of recurring themes that characterise top performance.
• Top producers continue to be characterised by: – High physical, or technical, performance; – Strong control over costs; and – Maximising returns from the market place.
• Across suckler herds, those in the top third of net margin per animal achieved higher output through higher calf rearing percentages, generally selling heavier calves resulting in higher yield per cow in the herd. They also typically received 4-9 p/kg lwt more for the calves they sold. They also had lower herd maintenance costs.
EXECUtIVE SUMMARY

Cattle and Sheep Enterprise Profitability in Scotland 5
• Suckler herds in the top third of financial performance were also characterised by strong variable cost control. In all cases those in the top third had lower total variable costs than the average while achieving higher output. Fixed costs were also firmly controlled. In all cases top third producers had lower fixed costs per kg of output even if, on occasion, fixed cost per cow was higher than the average.
• Those in the top third of sheep producers similarly achieved higher outputs through higher stock performance. Typically they reared about 15-20 more lambs per 100 ewes than the average. Although they did not necessarily rear lambs to the heaviest weights, the larger lamb crop typically resulted in top third flocks selling 9 to 13 kg lwt more lamb per ewe. They also typically sold the highest proportion of lambs for immediate slaughter. The net effect being that income per ewe from lamb sales was £20 per ewe more than the average.
• The LFA hill suckler herds surveyed had an average gross margin of £233 per cow. The top third averaged £425 per cow gross margin, an improvement of £192 per cow. The top third achieved a positive net margin of £27 per cow against the average of (-) £135. Of the fifteen producers surveyed, six achieved a positive net margin, an improvement on last year but still emphasising the challenges of farming in an extensive way on severely disadvantaged land.
• The LFA upland suckler herds were split into two categories, one group selling at weaning and a second group selling yearling stores. Those selling at weaning made an average gross margin of £241 per cow, but were outperformed by their counterparts selling yearlings who achieved an average gross margin of £316 per head. Top third producers selling at weaning made £349 gross margin per cow with 10% more liveweight produced per cow than the average while at the same time keeping variable costs 18% lower. Of those selling yearlings, the top third achieved a gross margin of £460 per cow. Again variable costs were strictly controlled and compared to the average were 25% lower while still producing 2.5% more liveweight per cow. Ten per cent of businesses selling calves at weaning achieved a positive net margin. In contrast, among those selling yearlings, 26% of the businesses achieved a positive net margin.
• Non-LFA suckler herds reported an average gross margin of £242 per cow while those in the top third achieved a gross margin of £403. A significant contributor to this improvement was the 14% greater sale weight per cow. Although the top third did manage variable costs to a level 20% below the average they did carry higher fixed costs which reduced their advantage at net margin level. Twenty four per cent of businesses surveyed achieved a positive net margin.

6 Cattle and Sheep Enterprise Profitability in Scotland
• Rearer finisher businesses surveyed recorded an average gross margin of £397 per cow with the top-third averaging £574. However, the average net margin remained negative at (-) £71, a decline of £46 over the year. Eighteen per cent of the businesses surveyed achieved a positive net margin, half the rate of last year.
• Cereal-based cattle finishers surveyed reported an average gross margin of £199 per beast and a net margin of £107. Those in the top third achieved an £86 improvement in net margin over the average. Indeed eighty percent of businesses in the survey reported a positive net margin - the only group to show an improvement on last year.
• Forage-based finishers have been split into two groups, those selling cattle under 22 months of age and those selling cattle over 22 months of age. Those selling younger cattle achieved an average gross margin of £252 per beast and reported a net margin of £36. Those selling older cattle achieved a gross margin of £140 per head and net margin of (-) £68. Those in the top third of both groups achieved this objective largely through their ability to realise better returns from the market place, having the biggest spread between purchase and sale price and achieving the highest growth rates from their cattle. Sixty per cent of those selling younger cattle achieved a positive net margin compared to 40% of those selling the older cattle.
• LFA hill sheep enterprises in the survey achieved an average gross margin of £26 per ewe. The top third benefited from higher prolificacy and lamb weights resulting in a net output £20 per ewe higher than the average. With variable costs only £1 per ewe higher, this improved productivity transferred almost entirely into a gross margin which was £19 per ewe better. Slightly higher fixed costs among the top third eroded this improvement to £15 at net margin level which left the top third with a positive net margin of £2 per ewe compared to an average net margin of (-) £13 per ewe. Twenty per cent of these businesses achieved a positive margin, a significant decline from the 57% who achieved this objective for their 2011 lamb crop.
• Eighty per cent of upland ewe enterprises surveyed reported a positive net margin, down from 100% last year, with an average of £13 per ewe and those in the top third achieving a net margin of £28 per ewe. Variable costs and fixed costs among the top third were higher than the average. Thus, the major contributor to improved returns was improved physical performance which saw those in the top third produce 15% more lamb per ewe.
• Lowground breeding ewe businesses in the survey also saw a decline in financial performance compared to last year. Eighty per cent of those surveyed achieved a positive margin, a ten percentage point decline on the year.
• Store lamb producers achieved an average gross margin per lamb sold of £1 per lamb and net margins slipped into negative territory at (-) £3.50 on average. Only half of the businesses surveyed achieved a positive net margin.

Cattle and Sheep Enterprise Profitability in Scotland 7
IntRoDUCtIon

8 Cattle and Sheep Enterprise Profitability in Scotland
This report summarises the results of a survey of Scottish beef and sheep enterprise profitability during the 2012 calf and lamb crop year. The survey was commissioned by Quality Meat Scotland (QMS) and carried out by SAC Consulting, part of Scotland’s Rural College.
The survey covers 70 breeding ewe enterprises farming 42,000 ewes and 115 suckler cattle enterprises farming 11,150 suckler cows as well as 12 enterprises finishing some 8,750 store lambs and 51 cattle finishing enterprises selling just over 3600 prime cattle. Eight per cent of the suckler herds and eight per cent of the ewe flocks surveyed were farmed to organic standards. The survey provides a snapshot of the industry during 2012. This report compares, for each sector, the costs, revenues and margins achieved by the top third of producers, the bottom third and the sample average.
The concluding sector of the report provides some comparative analysis with the results from 2010 and 2011. However, it must be stressed that the comparisons are not identical samples of businesses.
Within the analysis of the survey, an enterprise’s estimated fixed and variable costs can be found as well as their estimated gross and net margins. The gross margin is left after variable costs have been deducted from an enterprise’s revenues. Then, once fixed costs have been subtracted from the gross margin, one is left with the enterprise’s net margin, which rewards the farmer for his/her labour and capital investment. Fixed costs have been allocated to the livestock enterprises on a farm in direct proportion to their share of the total sales revenue of that business. Within mixed livestock farms, fixed costs have been allocated between cattle and sheep enterprises in relation to their proportion of Grazing Livestock Units. The results are again ranked by gross margin per head of livestock.
The analysis has been extended to include estimates of the time committed to the enterprises by family labour for which no charge has been recorded in the estimate of net margins. The level of income required to provide a five per cent return on an enterprise’s working capital has also been estimated in addition to the opportunity cost of the land used.
All area based support payments have been excluded from this year’s analysis of the returns derived from livestock enterprises since there is no obligation for livestock production to take place in order to receive area payments. However, the Scottish beef calf premium has been included since it is coupled to the level of production.

Cattle and Sheep Enterprise Profitability in Scotland 9
The considerable range of land types and production systems found in Scotland inevitably mean that any survey of businesses cannot cover all options. However, results are presented for a comprehensive range of enterprise types, namely:
• LFA hill herds selling calves at weaning;
• LFA upland herds selling calves at weaning;
• LFA upland herds selling forward stores;
• Non-LFA herds;
• Rearer-finisher herds;
• Cereal based finishing enterprises finishing cattle under 20 months of age;
• Forage based enterprises finishing cattle at under 22 months of age;
• Forage based enterprises finishing cattle at over 22 months of age;
• Non-LFA breeding flocks;
• LFA upland ewe flocks;
• LFA hill flocks using Blackface or Cheviot stock;
• Store lamb finishers.
Both the range of performance and the key contributing factors to these differences in performance between businesses are demonstrated by the results of the survey. The results also provide individual businesses with a benchmark against which to gauge their own performance, thereby allowing them to investigate the strengths and weaknesses of their enterprise compared with those of similar businesses.

10 Cattle and Sheep Enterprise Profitability in Scotland
Cost Price Changes During 2012Ex-farm cattle prices began 2012 50p/kg (17%) higher than a year earlier at 345p/kg dwt. Prices eased a touch through January but then picked up steadily through February, March and April. After a slight fall in May they recovered the lost ground in June and early July. As demand slowed seasonally in late July, prices eased once again before rising slowly through August and September. Prices then steadied in October before trending higher through November and into December on strong festival season demand. They reached their annual peak in late December at 373p/kg dwt, closing the year 28p/kg (8%) higher than they had started it.
Prime cattle producer prices averaged well above year earlier levels throughout 2012. However, as prices had risen at a faster pace in 2011 the year-on-year gap narrowed as 2012 progressed. Starting the year at a 17% premium, it briefly widened to 20% in February before declining steadily between mid-March and mid-November where it bottomed out at 4.5%. The premium then increased again, reaching 7.5% at the year-end.
Store cattle prices started 2012 around 20-25% higher than 12 months earlier. This was sustained throughout much of the first half of the year. However, once prices steadied in May they were broadly flat for the remainder of the year and followed an almost identical trend to 2011 between August and November. In the second half of the year, prices averaged only one per cent higher than a year earlier and in fact closed 2012 down nearly four per cent year-on-year.
440
420
400
380
360
340
320
300
280
260
Scottish Deadweight Steer Price
2011 2012 2013
p/kg
dw
t
2011 2012 2013
1050
1000
950
900
850
800
750
700
650
600
550
Store Steers 12-18 Months Old
J F M A M J J A S O N D
2011 2012 2013
2011 2012 2013
600
550
500
450
400
350
300
GB Lambs and Hoggs Standard Quality Quotation
J F M A M J J A S O N D
£ p
er h
ead
140
130
120
110
100
90
80
70
2011
=10
0
55
50
45
40
35
30
25Aug Sep Oct Nov Dec
Blackface Store Lamb Autumn Sales Average Prices
£ p
er h
ead
J F M A M J J A S O N D J F M A M J J A S O N D J F M A M J J A
Energy
2011 2012 2013
Fertilisers Feed Veterinary All Inputs
p/kg
dw
t
40
50
60
70
80
90
%
GB seasonal variation in carcases graded R3L or better
Selected Agricultural Input Costs Source: Defra
J F M A M J J A S O N D
Cattle and Sheep Enterprise Profitability in Scotland 11
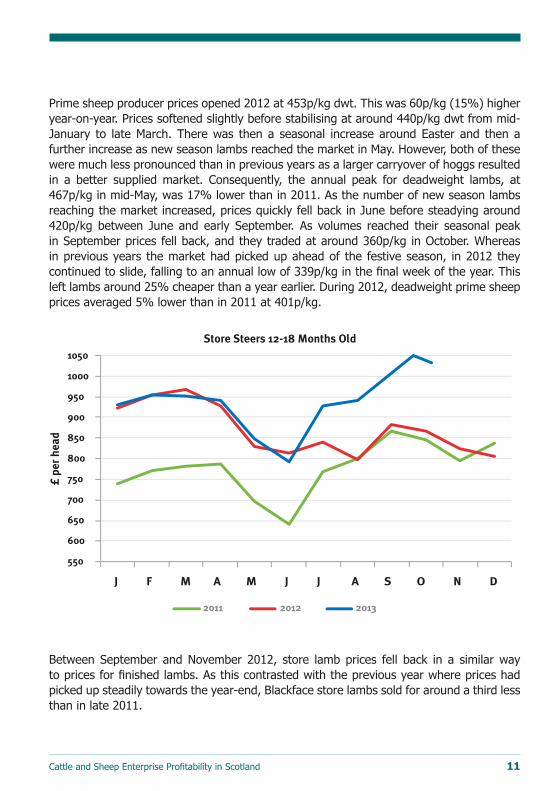
Prime sheep producer prices opened 2012 at 453p/kg dwt. This was 60p/kg (15%) higher year-on-year. Prices softened slightly before stabilising at around 440p/kg dwt from mid-January to late March. There was then a seasonal increase around Easter and then a further increase as new season lambs reached the market in May. However, both of these were much less pronounced than in previous years as a larger carryover of hoggs resulted in a better supplied market. Consequently, the annual peak for deadweight lambs, at 467p/kg in mid-May, was 17% lower than in 2011. As the number of new season lambs reaching the market increased, prices quickly fell back in June before steadying around 420p/kg between June and early September. As volumes reached their seasonal peak in September prices fell back, and they traded at around 360p/kg in October. Whereas in previous years the market had picked up ahead of the festive season, in 2012 they continued to slide, falling to an annual low of 339p/kg in the final week of the year. This left lambs around 25% cheaper than a year earlier. During 2012, deadweight prime sheep prices averaged 5% lower than in 2011 at 401p/kg.
Between September and November 2012, store lamb prices fell back in a similar way to prices for finished lambs. As this contrasted with the previous year where prices had picked up steadily towards the year-end, Blackface store lambs sold for around a third less than in late 2011.
440
420
400
380
360
340
320
300
280
260
Scottish Deadweight Steer Price
2011 2012 2013
p/kg
dw
t
2011 2012 2013
1050
1000
950
900
850
800
750
700
650
600
550
Store Steers 12-18 Months Old
J F M A M J J A S O N D
2011 2012 2013
2011 2012 2013
600
550
500
450
400
350
300
GB Lambs and Hoggs Standard Quality Quotation
J F M A M J J A S O N D
£ p
er h
ead
140
130
120
110
100
90
80
70
2011
=10
0
55
50
45
40
35
30
25Aug Sep Oct Nov Dec
Blackface Store Lamb Autumn Sales Average Prices
£ p
er h
ead
J F M A M J J A S O N D J F M A M J J A S O N D J F M A M J J A
Energy
2011 2012 2013
Fertilisers Feed Veterinary All Inputs
p/kg
dw
t
40
50
60
70
80
90
%
GB seasonal variation in carcases graded R3L or better
Selected Agricultural Input Costs Source: Defra
J F M A M J J A S O N D

12 Cattle and Sheep Enterprise Profitability in Scotland
The 2012 peak store lamb selling season failed to match 2011 with the average price between August and December down 17% year-on-year.
In the opening months of 2012, agricultural input prices increased slowly. Energy costs rose significantly as the oil price spiked due to the combination of strong demand from emerging economies and the prospect of tighter supplies due to the threat of conflict between the US and Iran. Feed prices also picked up as an extremely cold period of weather in Ukraine and Russia impacted on grain supplies. After a brief hiatus in the second quarter, input prices trended higher again in the third and fourth quarters. The principal driver was spiking feed costs as a drought in the US reduced grain and protein crop production, while a wet summer led to a poor harvest in the UK. However, broadly flat oil prices helped stabilise energy costs while fertiliser prices trended lower, providing at least some respite for under pressure producers.
440
420
400
380
360
340
320
300
280
260
Scottish Deadweight Steer Price
2011 2012 2013
p/kg
dw
t2011 2012 2013
1050
1000
950
900
850
800
750
700
650
600
550
Store Steers 12-18 Months Old
J F M A M J J A S O N D
2011 2012 2013
2011 2012 2013
600
550
500
450
400
350
300
GB Lambs and Hoggs Standard Quality Quotation
J F M A M J J A S O N D
£ p
er h
ead
140
130
120
110
100
90
80
70
2011
=10
0
55
50
45
40
35
30
25Aug Sep Oct Nov Dec
Blackface Store Lamb Autumn Sales Average Prices
£ p
er h
ead
J F M A M J J A S O N D J F M A M J J A S O N D J F M A M J J A
Energy
2011 2012 2013
Fertilisers Feed Veterinary All Inputs
p/kg
dw
t
40
50
60
70
80
90
%
GB seasonal variation in carcases graded R3L or better
Selected Agricultural Input Costs Source: Defra
J F M A M J J A S O N D
440
420
400
380
360
340
320
300
280
260
Scottish Deadweight Steer Price
2011 2012 2013
p/kg
dw
t
2011 2012 2013
1050
1000
950
900
850
800
750
700
650
600
550
Store Steers 12-18 Months Old
J F M A M J J A S O N D
2011 2012 2013
2011 2012 2013
600
550
500
450
400
350
300
GB Lambs and Hoggs Standard Quality Quotation
J F M A M J J A S O N D
£ p
er h
ead
140
130
120
110
100
90
80
70
2011
=10
0
55
50
45
40
35
30
25Aug Sep Oct Nov Dec
Blackface Store Lamb Autumn Sales Average Prices
£ p
er h
ead
J F M A M J J A S O N D J F M A M J J A S O N D J F M A M J J A
Energy
2011 2012 2013
Fertilisers Feed Veterinary All Inputs
p/kg
dw
t
40
50
60
70
80
90
%
GB seasonal variation in carcases graded R3L or better
Selected Agricultural Input Costs Source: Defra
J F M A M J J A S O N D

Cattle and Sheep Enterprise Profitability in Scotland 13
440
420
400
380
360
340
320
300
280
260
Scottish Deadweight Steer Price
2011 2012 2013
p/kg
dw
t
2011 2012 2013
1050
1000
950
900
850
800
750
700
650
600
550
Store Steers 12-18 Months Old
J F M A M J J A S O N D
2011 2012 2013
2011 2012 2013
600
550
500
450
400
350
300
GB Lambs and Hoggs Standard Quality Quotation
J F M A M J J A S O N D
£ p
er h
ead
140
130
120
110
100
90
80
70
2011
=10
0
55
50
45
40
35
30
25Aug Sep Oct Nov Dec
Blackface Store Lamb Autumn Sales Average Prices
£ p
er h
ead
J F M A M J J A S O N D J F M A M J J A S O N D J F M A M J J A
Energy
2011 2012 2013
Fertilisers Feed Veterinary All Inputs
p/kg
dw
t
40
50
60
70
80
90
%
GB seasonal variation in carcases graded R3L or better
Selected Agricultural Input Costs Source: Defra
J F M A M J J A S O N D
2013 ProspectsSince the survey data was collected, there have been some changes in the marketplace. Cattle supplies tightened further in the first third of 2013 before increasing slightly over the summer months. Nevertheless, supplies remain tight. Prime cattle prices increased steadily and for most of the year have been around 15% higher than in 2012. Store cattle prices matched year earlier levels in early 2013 and were well ahead of year earlier levels at the autumn sales.
On the sheep side, producer prices have shown a more normal seasonal variation this year. After a slow start to the year, prices picked up as weaker sterling underpinned overseas demand. Nevertheless, it was not until April that producer prices matched year earlier levels and this is reflected in the lower margins from store lamb enterprises. The 2013 lamb marketing year got off to a slow start, in respect to volumes, due to the difficult weather conditions in late 2012 and early 2013 - that led to a smaller lamb crop, delayed grass growth and slowed growth rates. As a result, lamb prices made a strong start to the season but fell sharply in July as lamb marketing surged to reach a six-year high. Demand also eased as consumers shifted their purchases away from fresh meat. Prices then held slightly behind 2012 levels until late September when processors began to secure product for an Islamic festival in mid-October. The market has since held firm into late October and prices have been trading around 10% higher than last year. Since the start of the new lamb marketing year in May 2013, prices have averaged 7% higher year-on-year.

14 Cattle and Sheep Enterprise Profitability in Scotland
The domestic economy has finally begun to show signs of recovery, growing strongly in the first three quarters of the year and picking up momentum. Although inflation has remained above target and earnings growth has been particularly sluggish, British consumers have become increasingly confident. However, despite considerable improvement in the general economy, the volume of beef retailed in GB was up only slightly year-on-year in the four weeks in mid-September as retail price growth outpaced increased consumer spending. So despite spending more on beef the consumer did not increase the volume of beef bought to the same degree.
It was a similar story on the lamb side as retail prices began to rise. Nevertheless, in the year-to-date lamb sales volumes have been much higher than in 2012. On the export side, conditions have improved this year due to the positive impact of a weaker sterling on UK price competitiveness, plus stronger demand as the Euro Area has begun to show signs of recovery. By contrast, beef exports have eased due to tight domestic supplies leaving less meat available for export.
Input costs have eased slightly through 2013 with notable declines in fertiliser and feed costs as the year has progressed. Nevertheless, feed has only returned to the price levels seen in autumn 2012. However, with improved weather conditions, it is likely that the requirement for purchased feed will be lower than last year. However, the benefit of falling input prices will be influenced by the timing of input buying as feed prices remained well above year earlier levels throughout the first half of the year. Therefore, while it may seem obvious that 2013 will prove to be a much better year for beef farmers, those who bought significant volumes of feed in the early part of both years may not see a substantial improvement in their bottom line.
In the sheep sector, lower average farmgate prices indicate that margins are likely to have narrowed; although more favourable growing conditions over the summer months may well have benefited technical performance and purchased input requirements. Those selling later in the season will have benefited from higher prime lamb prices although store lamb prices have struggled to match last year’s levels. Then again, significant lamb losses due to the harsh lambing conditions seem likely to have held down profitability in the worst hit areas of the country.
As is always the case, though, profitability will also be linked to the timing of sales and input purchases. At certain points of the year prices have been above 2012 levels and at other times lower. In general, however, the cost-price balance favours improved margins among both cattle and sheep producers in the 2013 production year.

Cattle and Sheep Enterprise Profitability in Scotland 15
Structural Changes in 2012Among the suckler herds surveyed, 22% increased cow numbers by more than 5% while 29% reduced cow numbers by more than 5%. Overall, the number of cows farmed by those in the survey was unchanged in contrast to the national decline of 1% reported in the Scottish agricultural census of December 2012.
However, there were significant differences in behaviour between farm type. Hill and upland herds showed a net decline in cow numbers while rearer finishers and lowground suckler herds shown some increase in cow numbers. The biggest proportionate decline in cow numbers occurred amongst upland herds selling yearling calves and the biggest proportionate increase occurred among non-LFA suckler herds.
With regard to breeding sheep enterprises, the total number of ewes farmed by those in the survey increased by one per cent, the same level of change reported in the national flock in the December 2012 Scottish agricultural census. Nevertheless, 13% of flocks increased in size by more than five per cent while 20% reduced flocks by more than 5%. The biggest proportional increase in ewe numbers occurred among upland flocks while the hill flock was unchanged and the lowground flock declined.

16 Cattle and Sheep Enterprise Profitability in Scotland
CAttLE EntERPRISES

Cattle and Sheep Enterprise Profitability in Scotland 17
Results from LFA hill suckler herdsThe 15 herds in this category are those enterprises where open, unimproved hill land makes up more than three-quarters of the farm area, resulting in low stocking densities, and where more than half the calves are sold at weaning. Herd size ranged from six to 190 cows with an average size of 57 head.
• Hill suckler herds achieved an average gross margin of £234 per cow. The top third achieved an average gross margin of £425, 82% better than the average and more than three times the level among the bottom-third.
• Fixed costs averaged £369 per cow, but with a considerable variation from £100 to £614 per cow. This resulted in an average net margin of (-) £136 per cow. Despite spending £29 per head more on fixed costs, those among the top third spent £95 per cow less on variable costs but achieved an output £117 better than the average resulting in a net margin of £27 per cow some £163 better than the average.
• The main contributors to this improved margin were higher prolificacy among the herd and higher sale weights. Those in the top third sold calves at an average weight of 313kg, 15kg higher than the average but also reared five more calves per 100 cows than the average. This resulted in them selling 10% more calf weight per cow in the herd. Furthermore, they achieved this with less recourse to purchased concentrates and forage expenditure.
• Across the businesses surveyed, the average number of calves reared per 100 cows was 90. Top third producers’ calf rearing rate was 94 calves per 100 cows while bottom third producers reared two calves per 100 cows less than the average. Typically, four calves per 100 cows were born dead or died before weaning with little difference in losses across the surveyed farms. However, those in the bottom third did suffer higher rates of cow mortality.
• The most profitable herds show a high level of technical performance, measured as calves reared ratios and growth rates along with lower cow mortality, not withstanding lower veterinary costs and lower feed costs. However, these top third herds did have higher fixed costs, most notably in respect of power, machinery and property costs. With lower paid and unpaid labour this would suggest those in the top-third were more capital intensive in their day-to-day operation. In contrast those in the bottom third are more labour intensive and made greater use of contractors.
• When compared to their upland counterparts selling weaned calves but farming more favoured land, these hard hill suckler herds returned net margins some £7 below those in the slightly more favoured farming environment. However, those in the top third of financial performance fared better than their top third counterparts among upland herds selling weaned calves.

18 Cattle and Sheep Enterprise Profitability in Scotland
LFA hill suckler herds - financial performance measures
Bottom third Average top third
Number in sample 5 15 5Average herd size (head) 83 57 50
£ per cowCalf output after valuation changes 470.18 560.19 639.31Subsidies 38.45 45.48 51.35Gross output 508.62 605.67 690.67less replacements 55.03 49.76 38.56net output 453.59 555.91 652.11
Variable CostsPurchased concentrates 93.15 109.80 85.98Home grown concentrates 36.13 17.45 0Roughages purchased 31.02 46.34 14.06Forage 104.88 78.63 74.86Total Feed and Forage 265.17 252.22 174.90Veterinary 23.61 29.70 12.26Bedding 5.89 11.57 23.94Other costs 30.66 28.73 15.71total variable costs 325.33 322.22 226.81Gross Margin 128.26 233.69 425.30
Fixed costsLabour 131.85 113.22 94.03Contractors 27.44 17.02 2.61Power and machinery 48.02 70.00 97.71Property maintenance and rent 49.73 74.30 108.36Depreciation 65.82 59.86 60.34Finance 3.35 5.08 3.87Administration 36.69 29.75 31.29total Fixed Costs 362.90 369.24 398.20
net Margin (-) 234.64 (-) 135.55 27.10
Annual herd maintenance cost Pence per kg calf produced
23 19 13
Variable cost Pence per kg calf produced 138 121 77Fixed cost Pence per kg calf produced 154 139 77Unpaid family labour hours 11 hrs 20 mins 10 hrs 40 mins 8 hrs 15 mins
Totals may not add up exactly due to rounding

Cattle and Sheep Enterprise Profitability in Scotland 19
Bottom third Average top third
Calves born dead or alive per 100 cows 91 94 98
Calves born dead per 100 cows 2 3 3
Calves died before weaning per 100 cows 2 1 1
Calves reared per 100 cows 87 90 94
Daily liveweight gain (kg) 0.99 0.98 1.02
Weight - kg per calf sold 273 298 313
Weight produced kg per 100 cows 23600 26800 29300
Cow replacement rate per 100 cows 13 14 14
Cow mortality % 2 1.4 1.5
Purchased concentrates kg per cow 380 490 370
Home grown concentrates kg per cow 174 84 0
Nitrogen kg per ha 6 2.2 1
Stocking rate GLU/ha 0.14 0.25 0.5
Totals may not add up exactly due to rounding
LFA hill suckler herds - financial performance measures

20 Cattle and Sheep Enterprise Profitability in Scotland
Results from LFA suckler herds The upland suckler herd sample has been split into two sub-groups in order to give a better reflection of the production systems in use in Scotland. One group includes farms of a more extensive nature that sell the majority of calves at weaning, while the other group has farms that sell calves as forward stores at around one year. Although the main calving period was noted, the sample size of autumn calving herds was insufficient to allow separate analysis of the different cost structures between spring and autumn calving.
Extensive upland herds selling calves at weaning
The 31 herds in this category farmed 3,310 cows, an average herd size of 104 cows within a range from 32 to 313 cows, and reported an average gross margin of £241 per cow and a net margin of (-) £142 per cow. The top third of enterprises returned a gross margin of £349 per cow, £108 (45%) better than the average and £197 per cow better than the bottom third. Top third producers reported a net margin of (-) £36, £106 per head better than the average. Ten percent of businesses reported a positive net margin.
• Top third producers produced 34kg more calf weight per cow than the average and 67kg more than the bottom third. This was achieved through a combination of factors: – Higher calving percentages - 87 calves reared per 100 cows (one more than the average); and – 22 kg per calf higher sale weights;
• Top third producers had lower cow mortality rates and lower herd maintenance rates resulting in lower herd maintenance charges.
• Variable costs were 18% lower among the top third than the average. Although they used more concentrates, particularly purchased concentrates, they spent less on forage and roughages, bedding and veterinary costs.
• Fixed costs per cow were little different between the average and the top third although the top third producers did carry higher machinery and property costs than the average along with higher depreciation and finance charges. The lower paid labour and contractor charges across the top third suggests that these businesses were more capital intensive than the average although they did have a much greater dependence on unpaid family labour. However, because of better technical performance, those in the top third spread their fixed costs over a greater weight of calf produced and fixed costs per kg of calf reared were some 25% lower than the average.

Cattle and Sheep Enterprise Profitability in Scotland 21
Upland herds selling calves at around one year old
Thirty herds farming an average of 116 cows each were categorised as herds selling calves at an older age of about 12 months. This older age at sale resulted in the average weight of calves sold being 380kg, some 29% higher than those sold at weaning. As a consequence, not surprisingly, variable costs per cow were higher among this group than those of their counterparts selling calves at weaning, by almost 40%. However, when considered against the weight of animal sold rather than per cow, the variable costs among this group were almost 25% lower when measured per kg of calf reared.
Heavier sale weights resulted in an income considerably higher than those selling weaned calves and the extra variable costs associated with keeping the calves longer were easily recouped from the marketplace. The average gross margin among this group was consequently some 30% better than for those selling weaned calves.
However, timing of sale also played a part in income to these businesses. Those selling calves at weaning in the autumn of 2012 averaged 206 p/kg lwt while those selling older calves in early 2013 averaged 217 p/kg.
Fixed costs, however, were much higher among this group particularly in respect of labour, administration and finance costs. As a result the £75 per cow improvement in gross margin was eroded to a point where the net margin among those selling yearling stores was only £33 per cow better than those selling weaned calves.
• Top third businesses selling yearlings returned a gross margin of £461 per cow, £145 (45%) better than the average and £244 better than the bottom third producers. They achieved this better financial return through improved herd productivity rearing four more calves per 100 cows than the average. Although they sold these calves at a lower weight the yield per cow in the herd was 2.5% more than the group average.
• Top third producers fed a significantly smaller quantity of purchased and home grown feed. In contrast bottom third producers incurred more concentrate feed, roughage and forage costs per cow than the average without seeing any benefits in increased production.
• Top third producers had a higher fixed cost burden than the average, largely as a result of substituting unpaid family labour for paid labour. However, they did carry the highest finance charges and had the highest depreciation charges, suggesting a higher degree of mechanisation and capital investment in the business. Nevertheless, 70% of businesses in the top third achieved a positive net margin.
Over the year those businesses selling yearling calves reduced their herd size by two per cent while those selling weaned calves maintain their herd size.

22 Cattle and Sheep Enterprise Profitability in Scotland
Extensive upland suckler herds selling weaned calves Financial performance measures
Bottom third Average top third
Number in sample 11 31 11Average herd size (head) 121 104 87
£ per cowCalf output after valuation changes 466.41 522.98 573.92Subsidies 38.56 41.09 43.35Gross output 504.97 564.07 617.26less replacements 81.05 71.96 62.56net output 423.92 492.11 554.70
Variable CostsPurchased concentrates 43.97 29.33 24.14Home grown concentrates 3.83 18.31 31.63Roughages purchased 31.93 29.15 21.46Forage 106.36 95.68 80.59Total Feed and Forage 186.08 172.47 157.83Veterinary 38.45 36.85 23.52Bedding 24.12 21.84 5.92Other costs 23.48 19.68 18.24total variable costs 272.13 250.84 205.52Gross Margin 151.79 241.27 349.18
Fixed costsLabour 71.62 66.21 32.94Contractors 27.28 34.66 29.81Power and machinery 113.93 98.78 102.52Property maintenance and rent 81.16 80.03 89.35Depreciation 76.24 68.88 82.43Finance 14.40 15.84 20.33Administration 9.97 18.95 28.31total Fixed Costs 394.61 383.35 385.68
net Margin (-) 242.82 (-) 142.08 (-) 36.50
Annual herd maintenance cost Pence per kg calf produced
36 28 20
Variable cost Pence per kg calf produced 120 99 74Fixed cost Pence per kg calf produced 174 151 139Unpaid family labour hours 6 hrs 40 mins 8 hrs 25 mins 13 hrs 55 mins
Totals may not add up exactly due to rounding

Cattle and Sheep Enterprise Profitability in Scotland 23
Extensive upland suckler herds selling weaned calves technical performance measures
Bottom third Average top third
Calves born dead or alive per 100 cows 89 92 94
Calves born dead per 100 cows 5 4 4
Calves died before weaning per 100 cows 3 3 2
Calves reared per 100 cows 82 86 87
Daily liveweight gain (kg) 1.03 1.05 1.04
Weight - kg per calf sold 278 295 317
Weight produced kg per 100 cows 22700 25300 27800
Cow replacement rate per 100 cows 16 14 14
Cow mortality % 4.3 2.7 1.7
Purchased concentrates kg per cow 194 127 103
Home grown concentrates kg per cow 25 176 389
Nitrogen kg per ha 33 21 15
Stocking rate GLU/ha 0.87 0.94 1.06Totals may not add up exactly due to rounding

24 Cattle and Sheep Enterprise Profitability in Scotland
Upland suckler herds selling yearling calves Financial performance measures
Bottom third Average top third
Number in sample 10 30 10Average herd size (head) 112 116 97
£ per cowCalf output after valuation changes 654.32 704.43 750.48Subsidies 34.47 38.31 42.40Gross output 688.79 742.74 792.88less replacements 74.35 78.69 73.70net output 614.45 664.05 719.18
Variable CostsPurchased concentrates 146.52 91.85 61.33Home grown concentrates 5.63 26.48 14.51Roughages purchased 40.56 30.59 13.43Forage 100.60 86.55 84.35Total Feed and Forage 293.31 235.47 173.62Veterinary 58.30 48.00 30.32Bedding 25.77 37.49 26.06Other costs 20.50 27.06 28.20total variable costs 397.89 348.03 258.20Gross Margin 216.56 316.03 460.98
Fixed costsLabour 62.77 87.30 38.49Contractors 43.08 29.42 25.51Power and machinery 118.41 98.23 92.71Property maintenance and rent 98.43 81.10 71.88Depreciation 76.87 67.83 86.92Finance 20.91 27.81 45.93Administration 34.52 33.65 26.91total Fixed Costs 455.00 425.35 388.35
net Margin (-) 238.43 (-) 109.32 72.63
Annual herd maintenance cost Pence per kg calf produced
24 24 22
Variable cost Pence per kg calf produced 130 76 78Fixed cost Pence per kg calf produced 149 131 117Unpaid family labour hours 7 hrs 20 mins 7 hours 14 hrs 10 mins
Totals may not add up exactly due to rounding

Cattle and Sheep Enterprise Profitability in Scotland 25
Upland suckler herds selling yearling calves technical performance measures
Bottom third Average top third
Calves born dead or alive per 100 cows 91 92 94Calves born dead per 100 cows 5 4 3Calves died before weaning per 100 cows 5 3 2Calves reared per 100 cows 81 85 89Daily liveweight gain (kg) 0.86 0.90 0.90Weight - kg per calf sold 379 380 372Weight produced kg per 100 cows 30500 32400 33200Cow replacement rate per 100 cows 18 16 10Cow mortality % 3 2.5 1.7Purchased concentrates kg per cow 659 390 261Home grown concentrates kg per cow 38 133 88Nitrogen kg per ha 12 10 10Stocking rate GLU/ha 0.59 0.75 0.87
26 Cattle and Sheep Enterprise Profitability in Scotland
Results from non-LFA lowground suckler herdsSeventeen non-LFA suckler enterprises farming 1398 cows were surveyed. They achieved an average gross margin of £242 per cow and an average net margin of (-) £131 in a range from (-) £525 to +£184. Only three businesses reported a positive net margin per cow.
• Top third producers achieved an average gross margin of £394 per cow, £150 (63%) better than the overall average. Fixed costs per cow among the top third were higher than the average and thus the improvement in financial performance diminished to £115 at net margin level.
• Improved margin was aided by better physical performance including: – Higher calf rearing rates - three more calves reared per 100 cows than the average; – Higher sale weights - 29 kg per head heavier at sale than the average; This greater physical output per cow was also complemented by better sale prices which collectively resulted in gross output £93 per cow higher than the average. Buying in replacement cows at a lower price than the average helps to reduce the herd maintenance charge among the top third so net output was £109 higher than the average
• Those in the top third by gross margin had strict control over variable costs without compromising physical performance. Not only did they spend less than the average on feed and forage they also used less bedding and achieved savings in general livestock expenses.
• However, the top third did carry higher fixed costs. Savings in paid labour were more than offset by higher expenditure on contractors and machinery and property costs. Finance costs were also slightly higher than the average.
• As with other enterprise types among the suckler herds, the bottom third producers were characterised by low physical performance combined with higher input costs per cow.

Cattle and Sheep Enterprise Profitability in Scotland 27
non-LFA lowground suckler herds - financial performance measures
Bottom third Average top third
Number in sample 6 17 6Average herd size (head) 57 82 47
£ per cowCalf output after valuation changes 376.71 526.27 611.22Subsidies 38.75 42.52 50.86Gross output 415.46 568.79 662.09less replacements 86.66 70.20 54.87net output 328.80 498.59 607.21
Variable CostsPurchased concentrates 42.41 22.41 30.73Home grown concentrates 11.50 21.01 7.34Roughages purchased 28.97 31.70 20.55Forage 92.52 66.86 64.96Total Feed and Forage 175.41 141.98 123.58Veterinary 58.55 50.06 49.31Bedding 28.54 41.81 29.98Other costs 25.52 22.57 10.30total variable costs 288.02 256.42 213.17Gross Margin 40.78 242.17 394.04
Fixed costsLabour 147.48 83.80 57.28Contractors 20.35 23.14 39.57Power and machinery 67.54 95.43 118.39Property maintenance and rent 35.63 82.34 101.54Depreciation 45.66 60.23 63.88Finance 14.58 10.47 13.61Administration 22.82 18.41 16.18total Fixed Costs 354.05 373.83 410.45
net Margin (-) 313.27 (-) 131.66 (-) 16.41
Annual herd maintenance cost Pence per kg calf produced
44 27 18
Variable cost Pence per kg calf produced 145 98 68Fixed cost Pence per kg calf produced 179 143 138
Unpaid family labour hours 2 hrs 15 mins 6 hrs 10 mins 6 hrs 10 mins
Totals may not add up exactly due to rounding

28 Cattle and Sheep Enterprise Profitability in Scotland
non-LFA lowground suckler herds - technical performance measures
Bottom third Average top third
Calves born dead or alive per 100 cows 80 91 97Calves born dead per 100 cows 3 2 3Calves died before weaning per 100 cows 1 3 5Calves reared per 100 cows 76 86 89Daily liveweight gain (kg) 1.02 1.08 1.15Weight - kg per calf sold 262 306 335Weight produced kg per 100 cows 19800 26200 29800Cow replacement rate per 100 cows 14 16 19Cow mortality % 1.9 1.8 4.2Purchased concentrates kg per cow 194 97 145Home grown concentrates kg per cow 70 124 49Nitrogen kg per ha 13 16 4Stocking rate GLU/ha 1.4 1.5 1.0
Totals may not add up exactly due to rounding
Cattle and Sheep Enterprise Profitability in Scotland 29
Results from rearer finisher enterprisesIn the case of these 22 enterprises farming 2,090 cows, the reported margins relate to the costs and income for a 12 month period to the end of April 2013.
The businesses surveyed produced an average gross margin per cow of £397, within a range of £21 to £770 per cow, and an average net margin of (-) £70 per cow. Eight (36%) enterprises reported a positive net margin.
• The top third producers ranked by gross margin per cow achieved a net output £140 higher than the average largely through the production of 26% more saleable output per cow. This was partially the result of higher prolificacy (one more calf reared per 100 cows), heavier sale weights (+8kg) and better sale prices (+3p/kg lwt) and partly due to valuation changes in respect of yearling cattle. Net output was also impacted by the lower cow replacement rates among the top third and hence lower herd maintenance charges.
• Higher output was the greatest contributor to higher margins among the top third although they did spend £38 (7%) per cow less on variable costs than the average. Although they spent more on concentrates and purchased roughages they spent less on forage production and in veterinary expenses.
• Fixed costs were also strictly controlled among the top third where £57 per cow less was spent than the average, largely the result of lower property and depreciation charges.
• Bottom third producers had significantly lower output per cow, a reflection of lower calving rates and higher herd maintenance charges. A lower number of animals within the enterprise meant that savings could be made on variable costs but insufficient to offset the lower output and so bottom third gross margins were some £172 per cow lower than the average. Fixed costs were little different between the average and the bottom third.

30 Cattle and Sheep Enterprise Profitability in Scotland
Rearer finisher herds - financial performance measures
Bottom third Average top third
Number in sample 7 22 7Average herd size (head) 98 95 87
£ per cowCalf output after valuation changes 713.40 957.50 1072.51Subsidies 39.74 41.89 43.54Gross output 753.13 999.39 1116.05less replacements 99.77 75.96 53.24net output 653.36 923.44 1062.80
Variable CostsPurchased concentrates 68.38 119.46 100.68Home grown concentrates 50.94 98.71 133.01Roughages purchased 45.94 48.45 60.11Forage 128.34 115.86 67.67Total Feed and Forage 293.61 382.49 361.47Veterinary 54.32 49.64 31.82Bedding 45.96 52.16 50.61Other costs 34.69 41.94 44.38total variable costs 428.58 526.24 488.28Gross Margin 224.78 397.20 574.52
Fixed costsLabour 81.70 94.93 94.20Contractors 43.18 50.43 35.27Power and machinery 108.71 106.62 108.24Property maintenance and rent 113.71 98.13 105.83Depreciation 69.21 65.79 54.15Finance 22.84 20.82 11.42Administration 36.81 31.31 20.84total Fixed Costs 476.17 468.03 429.94
net Margin (-) 251.39 (-) 70.83 144.58
Annual herd maintenance cost pence per kg calf produced
29 19 11
Variable cost Pence per kg calf produced 123 131 96Fixed cost Pence per kg calf produced 136 120 85
Unpaid family labour hours 9 hrs 10 mins 7 hrs 10 mins 5 hrs 10 mins
Totals may not add up exactly due to rounding

Cattle and Sheep Enterprise Profitability in Scotland 31
Rearer finisher herds - technical performance measures
Bottom third Average top third
Calves born dead or alive per 100 cows 91 94 94Calves born dead per 100 cows 5 4 3Calves died before weaning per 100 cows 3 2 2Calves reared per 100 cows 83 88 89Daily liveweight gain (kg) 0.88 0.83 0.84Weight - kg per calf sold 593 580 588Weight - kg per calf sold store 400 400 0Weight produced kg per 100 cows 34800 40100 50700Cow replacement rate per 100 cows 19 15 14Cow mortality % 4.2 2.6 2.1Purchased concentrates kg per cow 283 505 406Home grown concentrates kg per cow 288 721 1122Nitrogen kg per ha 14 14 14
Stocking rate GLU/ha 0.65 0.88 1.27
Selling price p/kg dwt finished 362 364 370Selling price p/kg lwt store 200 200 0
Totals may not add up exactly due to rounding

32 Cattle and Sheep Enterprise Profitability in Scotland
Cattle FinishingResults from cereal based cattle finishing enterprises
Fifteen cereal based cattle finishing enterprises were surveyed. They sold 1,100 cattle and achieved an average gross margin of £166 per animal. The average net margin among those surveyed was positive at £107 per head and ranged from (-) £79 to £337 per head. Twelve businesses (80%) reported a positive net margin.
• Enterprises in the top third of those surveyed had the longest feeding period, 247 days, although this was only four days more than the average. They sold the heaviest cattle having added the greatest weight as a result of having the highest growth rates. Although they paid 2p/kg lwt more for their store cattle, they achieved a selling price some 12-13 p/kg lwt better than the average. Almost 90% of the cattle finished among the top third were males, although young bulls were only 30% of the total. Those in the bottom third had the shortest feeding period, and had the greatest proportion of heifers (40%) in their sales mix.
• Those in the top third, despite the longest feeding period, used both less concentrate feed per animal reared and less concentrate fed per day the animal was being finished. Ninety per cent of the concentrate feed used by top-third producers was derived from home grown cereals while among the bottom third this fell to 72%.
• However, although those in the top third used more concentrates they used less roughage and forage and spent less on animal health. As a consequence they achieved their higher output with £20 less expenditure on variable costs. There was little difference in fixed costs between the average and the top third although the top third did spend an average of £3 less per cow on fixed costs and had the lowest fixed costs across the sample.

Cattle and Sheep Enterprise Profitability in Scotland 33
Cereal based cattle finishing enterprises - financial performance measures
Bottom third Average top third
Number in sample 5 15 5Average herd size (head) 49 72 94
£ per cowStock Sales 1019.70 1229.11 1381.75Less stock purchases 573.85 657.38 745.58net output 445.84 571.73 636.17
Variable CostsPurchased concentrates 89.54 84.72 46.28Home grown concentrates 170.15 178.62 206.86Other Feeds 21.91 22.98 19.36Forage 20.41 7.63 3.29Total Feed and Forage 302.01 293.95 275.79Veterinary 26.85 12.93 8.39Bedding 49.24 30.69 28.82Other costs 34.92 35.10 40.83total variable costs 413.02 372.68 353.84Gross Margin 32.83 199.05 282.33
Fixed costsLabour 23.36 22.47 26.18Contractors 10.54 8.20 8.25Power and machinery 32.84 21.00 18.74Property maintenance and rent 25.13 18.06 10.65Depreciation 15.32 13.02 13.07Finance 5.34 4.24 4.73Administration 1.69 5.04 7.10total Fixed Costs 114.23 92.02 88.72
net Margin (-) 81.40 107.03 193.61
Stores purchased – pence per kg lwt sold 102 108 112Variable cost 73 61 53Pence per lwt soldFixed cost Pence per kg calf produced 20 15 13
Unpaid family labour hours 1 hr 50 mins 1 hour 30 mins
Totals may not add up exactly due to rounding

34 Cattle and Sheep Enterprise Profitability in Scotland
Cereal based cattle finishing enterprises - technical performance measures
Bottom third Average top third
Feeding period (days) 229 243 247Start weight (kg lwt) 312 289 324Finish weight (kg lwt) 563 610 664Daily liveweight gain (kg) 1.10 1.32 1.37Mortality (%) 0 0.1 0.1Purchased concentrates kg/head 433 328 164Home grown concentrates kg/head 1140 1202 1348
Purchase price (£ per kg lwt) 1.84 2.27 2.29Purchased concentrates kg/head 3.27 3.51 3.58
SalesSteers % of sales 32 33 59Liveweight at sale 550 659 687Steer selling price p/kg dwt 328 362 370Heifers % of sales 40 33 11Liveweight at sale 532 510 549Heifer selling price p/kg dwt 323 337 321Young bulls % of sales 28 34 30Liveweight at sale 623 657 660Young bull selling price p/kg dwt 329 351 347
Results from forage based cattle finishing enterprises
This year the forage based finishers surveyed have been split into two groups based on the age at which the majority of the cattle have been sold. The average age at which Scottish prime cattle are slaughtered is twenty two months of age. This has been taken as the age for splitting the business surveyed. Thus the two groups are those selling finished cattle under 22 months of age and those selling finished cattle over 22 months of age.
The first group, selling younger cattle, comprises 18 businesses finishing an average of 57 cattle and the second group, selling older cattle, also comprises 18 businesses but with a slightly larger average size of 85 cattle.
• Those selling younger cattle reported a gross margin of £252 per animal sold falling to a net margin of £36 per animal sold; 60% of businesses in this group achieved a positive net margin. Their counterparts selling older cattle reported a gross margin of £140 per head and a net margin of (-) £68, 40% of businesses in this group achieved a positive net margin.

Cattle and Sheep Enterprise Profitability in Scotland 35
• Although they kept cattle for longer and sold heavier cattle, those in the older age group reported lower daily growth rates and a 10% greater use of concentrate feeds. Equally, and not unexpectedly, they had higher forage costs. However, as a result of lower bedding and general livestock costs the group selling older cattle had variable costs £7 per head lower than those selling younger cattle.
• Those selling younger cattle had a greater dependence on paid labour and a greater expense on machinery and property maintenance than their counterparts selling older cattle. This was the major contributor to those selling younger cattle carrying fixed costs £7 per head higher. Total cost per head then were £14 per head (2.5%) higher among those selling the younger cattle in practice there is then little difference in the cost structure between the two groups.
• The major difference in financial performance is derived from the market place. Both groups sold a similar proportion of steers and heifers so the difference in financial performance really came from the buying and selling of stock. Those selling younger cattle sold lighter cattle but at a better price than those selling older cattle. They also bought smaller cattle at a lower price.
• Among those selling younger cattle the best margins were achieved by businesses achieving the highest price per kg for prime stock although they did sell the lightest animals. However, because they also bought the smallest animals, weight added was no different from the average. Nevertheless the weight gain was achieved from a lower use of concentrates and greater use of forage. Veterinary and bedding costs were much higher among the top third. They also had much higher fixed costs reflecting a lower use of contractors but a greater investment in machinery and property costs.
• Among those selling older cattle the best margins were once again characterised by the highest selling price and lowest purchase price. However, among this group the top-third added the most weight per animal and sold the heaviest cattle. Variable costs were a little higher largely through greater use of roughages and forage in the diet. Although the top third did achieve positive net margins, they did carry higher fixed costs than the average largely due to higher contractor costs and machinery and depreciation charges, suggesting a greater capital investment in business infrastructure.

36 Cattle and Sheep Enterprise Profitability in Scotland
Forage based cattle finishing under 22 months - financial performance measures
Bottom third Average top third
Number in sample 6 18 6Average herd size (head) 69 57 61
£ per cowStock Sales 1272.48 1294.33 1360.06Less stock purchases 734.93 662.37 615.62net output 537.55 631.96 744.44
Variable CostsPurchased concentrates 212.21 124.69 34.51Home grown concentrates 18.60 82.93 149.54Other Feeds 21.33 22.82 25.49Forage 37.21 48.56 52.22Total Feed and Forage 289.35 279.00 261.75Veterinary 8.57 13.47 17.19Bedding 29.12 39.85 61.85Other costs 45.36 47.84 47.65total variable costs 372.39 380.16 388.47Gross Margin 165.16 251.80 355.97
Fixed costsLabour 25.04 33.17 31.99Contractors 22.59 18.37 4.91Power and machinery 27.26 51.27 68.54Property maintenance and rent 46.35 54.92 68.13Depreciation 30.85 36.57 48.80Finance 12.28 10.32 6.36Administration 10.22 11.28 12.50total Fixed Costs 174.59 215.92 241.24
net Margin (-) 9.43 35.88 114.73
Stores purchased – pence per kg lwt sold 119 111 107Variable cost pence per lwt sold 60 64 68Pence per lwt soldFixed cost pence per kg calf produced 28 36 42
Unpaid family labour hours 2 hrs 20 mins 1 hr 40 mins 50 mins
Totals may not add up exactly due to rounding
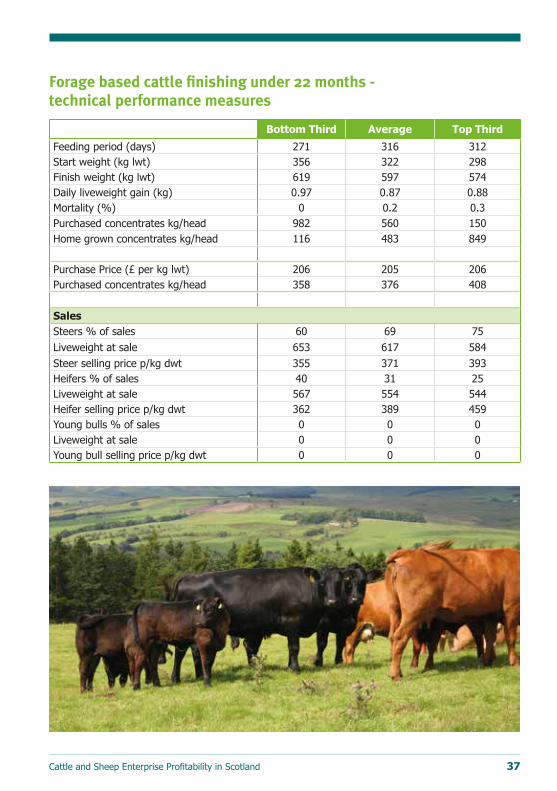
Cattle and Sheep Enterprise Profitability in Scotland 37
Forage based cattle finishing under 22 months - technical performance measures
Bottom third Average top third
Feeding period (days) 271 316 312Start weight (kg lwt) 356 322 298Finish weight (kg lwt) 619 597 574Daily liveweight gain (kg) 0.97 0.87 0.88Mortality (%) 0 0.2 0.3Purchased concentrates kg/head 982 560 150Home grown concentrates kg/head 116 483 849
Purchase Price (£ per kg lwt) 206 205 206Purchased concentrates kg/head 358 376 408
SalesSteers % of sales 60 69 75Liveweight at sale 653 617 584Steer selling price p/kg dwt 355 371 393Heifers % of sales 40 31 25Liveweight at sale 567 554 544Heifer selling price p/kg dwt 362 389 459Young bulls % of sales 0 0 0Liveweight at sale 0 0 0Young bull selling price p/kg dwt 0 0 0

38 Cattle and Sheep Enterprise Profitability in Scotland
Forage based cattle finishing over 22 months - financial performance measures
Bottom third Average top third
Number in sample 6 18 6Average herd size (head) 153 85 63
£ per cowStock Sales 1312.70 1356.99 1502.34less Stock Purchases 916.24 843.54 793.03net output 396.46 513.44 709.31
Variable CostsPurchased concentrates 100.82 103.82 58.31Home grown concentrates 104.71 103.86 128.03Other Feeds 6.72 21.34 58.70Forage 49.87 60.03 63.65Total Feed and Forage 262.13 289.05 308.69Veterinary 13.62 14.14 13.69Bedding 26.01 29.63 21.42Other costs 34.75 40.26 38.83total variable costs 336.50 373.07 382.64Gross Margin 59.96 140.37 326.68
Fixed costsLabour 20.13 25.56 29.36Contractors 11.04 19.50 32.29Power and machinery 38.82 45.40 63.99Property maintenance and rent 36.06 36.97 36.48Depreciation 38.19 47.42 80.08Finance 9.85 14.88 24.88Administration 17.22 18.91 31.31total Fixed Costs 171.31 208.64 298.38
net Margin (-) 111.36 (-) 68.27 28.30
Stores purchased – pence per kg lwt sold 142 129 113Variable cost pence per lwt sold 52 57 54Pence per lwt soldFixed cost pence per kg calf produced 26 32 42
Unpaid family labour hours 3 hrs 20 mins 3 hrs 40 mins 1 hr 55 mins
Totals may not add up exactly due to rounding

Cattle and Sheep Enterprise Profitability in Scotland 39
Forage based cattle finishing over 22 months - technical performance measures
Bottom third Average top third
Feeding period (days) 364 415 418Start weight (kg lwt) 397 371 355Finish weight (kg lwt) 647 656 703Daily liveweight gain (kg) 0.69 0.68 0.84Mortality (%) 0.3 0.3 0Purchased concentrates kg/head 418 437 267Home grown concentrates kg/head 624 629 798
Purchase Price (£ per kg lwt) 230 226 222Purchased concentrates kg/head 352 355 366
SalesSteers % of sales 74 69 66Liveweight at sale 653 674 742Steer selling price p/kg dwt 349 356 370Heifers % of sales 26 31 33Liveweight at sale 615 614 630Heifer selling price p/kg dwt 361 357 357Young bulls % of sales 0 0 0Liveweight at sale 0 0 0Young bull selling price p/kg dwt 0 0 0

40 Cattle and Sheep Enterprise Profitability in Scotland
SHEEP EntERPRISES
Cattle and Sheep Enterprise Profitability in Scotland 41
Results from LFA hill ewe flocksThis group of enterprises comprises purebred Blackface and Cheviot flocks farmed on some of the most disadvantaged land in Scotland. The sample covered 26 such flocks farming over 18,300 ewes. These flocks are characterised by low lambing percentages, averaging 99% lambs reared within a range of less than 70% to over 120%. The average gross margin achieved across this group was £26 per ewe, while the average net margin was (-) £13 per ewe within a range of (-) £40 to £25 per ewe. Five producers (20%) within this group made a small positive net margin.
• Producers in the top third benefit from better technical performance. The improvement in gross margin per ewe of £19 over the average is largely due to: – A higher number of lambs reared - 21 more lambs per ewe than average; – A higher proportion sold finished - 40% compared to an average of 26% - and a higher proportion sold for breeding; This in turn resulted in 35% more lamb produced per ewe; and a net output £20 per head higher than the average.
• Bottom third producers achieved a gross margin of £10, £23 lower than the average and a net margin of (-) £20, £17 worse than the average. However, it must be recognised that the producers in the bottom third were drawn almost exclusively from the North West Highlands and Islands region where climate and topography have a severe impact on ewe performance and the ability of producers to sell anything other than store lambs. This is reflected in a lamb reared percentage of 82% and only three lambs per 100 ewes sold finished.
• Variable costs among the top third producers were £4 per ewe lower than the average but little changed from those in the bottom third. Almost all of the variability among the top third was due to lower purchased concentrate use although forage and other feed costs were higher. In contrast bottom third producers had lower forage costs, perhaps a reflection of land quality and lower veterinary costs.
• Top third producers obtained the best returns from lamb sales through having a higher number of finished lambs to sell and consequently heavier lambs to sell, than the bottom third dependent on only store lamb sales.
• Top third producers carried much higher fixed costs particularly those associated with power and machinery and property. However, higher output among the top third easily outweighed the extra fixed costs. This left those in the top third reporting a positive net margin per ewe.
• In sharp contrast, the challenges of low productivity despite savings in fixed costs were amply illustrated by the significant negative gross margins reported among the bottom third of producers. Bottom third producers suffered considerably from lower lamb sales. Gross output for bottom third producers was less than half the average and, despite having a lower cost base per ewe, this was insufficient to offset the lower output and return from the market place.

42 Cattle and Sheep Enterprise Profitability in Scotland
LFA hill ewe flocks - financial performance measures
Bottom third Average top third
Number in sample 9 26 9Flock size 764 706 462
£ per eweLamb sales 35.65 59.48 77.91Wool 1.68 2.38 3.00Gross output 37.34 61.86 80.90Less replacement costs 9.95 11.34 10.78net output 27.38 50.52 70.13
Variable costsPurchased concentrates 4.59 6.63 5.40Home grown concentrates 0 0.26 0.56Other feeds 1.11 1.90 2.22Forage 4.25 3.78 5.43Total feed and forage 9.95 12.57 13.61Veterinary 4.33 6.21 7.08Bedding 0 0.14 0.31Other costs 3.79 5.51 4.43total variable costs 18.07 24.43 25.43Gross margin 9.31 26.09 44.70
Fixed costsLabour 8.15 13.19 11.38Contractors 2.79 2.32 3.91Power and machinery 4.50 7.05 8.76Property maintenance and rent 3.67 5.68 6.98Depreciation 6.12 6.00 5.98Finance 0.48 0.78 1.13Administration 2.49 3.83 4.54Total fixed costs 28.21 38.85 42.69
net Margin (-) 18.89 (-) 12.77 2.01
Flock replacements - pence per kg lamb produced
38 32 22
Variable cost - pence per kg lamb produced
69 68 52
Fixed cost - pence per kg lamb produced
107 108 88
Unpaid family labour hours 40 mins 30 mins 50 minsTotals may not add up exactly due to rounding

Cattle and Sheep Enterprise Profitability in Scotland 43
LFA hill ewe flocks - technical performance
Bottom third Average top third
Ewes per ram 26 30 33Ewe replacement rate % 20 26 32Lambs born dead or alive per 100 ewes
98 116 133
Lamb mortality % 18 17 11Lambs reared per 100 ewes 80 99 122Average weight of lambs kg 32.9 36.2 39.8Weight of lamb produced per 100 ewes kg
2622 3578 4851
Purchased concentrates kg/ewe 17 25 22Home grown concentrates kg/ewe 0 2 4
Lambs sold finished per 100 ewes 6 26 49Value per lamb £/head 55.04 63.46 65.77Lambs sold/transferred store per 100 ewes
49 40 30
Value per lamb £/head 41.79 42.79 41.55Lambs sold/transferred for breeding per 100 ewes
26 33 41
Value per lamb £/head 48.21 78.27 77.84
44 Cattle and Sheep Enterprise Profitability in Scotland
Results from LFA upland ewe flocksLFA upland breeding flocks are identified as LFA farms running crossbred flocks. Thirty- two such flocks were recorded in this survey which collectively farmed some 19,700 ewes. These enterprises achieved an average gross margin of £59 per ewe and average net margin of £13 per ewe. Eighty percent of the businesses surveyed returned a positive net margin, a deterioration from last year’s survey when all upland flocks achieved a positive net margin per ewe. The range of net margins reported was (-) £16 to £52 per ewe.
• Producers in the top third produced a gross margin of £79 per ewe, 33% better than the average and 88% better than the bottom third.
• Almost all of this improvement in gross margin among the top third came from higher returns from the marketplace as variable costs were little different from the average while and fixed costs per ewe were higher than the average. Higher output was achieved through improved flock performance including: – 14 more lambs reared per 100 ewes than the average; – 1.7kg higher prime lamb sale weights plus the highest proportion of prime lambs sold (73% of lambs compared to 64% on average); resulting in – 15% more liveweight of lamb produced per ewe than the average; and – A lower lamb mortality rate – Higher sale prices across all classes of stock.
• In contrast, bottom third producers achieved: – 16 fewer lambs reared per 100 ewes than the average; – The lowest proportion of prime lambs sold (51% compared to an average of 64%) plus lower store and breeding lamb weights than average; resulting in – 14% less liveweight lamb produced per ewe than the average.
• Variable costs per ewe were £4.50 higher than the average for those businesses in the top third, an increase of 14% over the average. This was due largely to heavier use of concentrates.
• Those in the top third carried fixed costs £4 (8%) per ewe higher than the average. This is largely accounted for through higher paid labour costs.

Cattle and Sheep Enterprise Profitability in Scotland 45
LFA upland ewe flocks - financial performance measures
Bottom third Average top third
Number in sample 11 32 11Flock size 659 616 604
£ per eweLamb sales 86.74 103.46 124.39Wool 3.80 3.50 2.98Gross output 90.55 106.96 127.37less replacement costs 12.03 11.93 11.92net output 78.52 95.03 115.45
Variable costsPurchased concentrates 13.16 11.53 11.09Home grown concentrates 0.60 0.73 0.89Other feeds 0.80 1.55 1.35Forage 7.60 7.71 8.21Total feed and forage 22.16 21.52 21.54Veterinary 8.22 7.62 7.11Bedding 0.26 0.64 0.65Other costs 5.98 6.40 7.25total variable costs 36.62 36.17 36.54Gross margin 41.90 58.86 78.90
Fixed costsLabour 5.99 9.19 11.38Contractors 4.00 3.42 2.55Power and machinery 8.80 10.60 12.82Property maintenance and rent 7.35 8.82 10.40Depreciation 8.06 7.99 8.52Finance 2.88 2.34 3.01Administration 2.51 3.24 2.31Total fixed costs 39.60 45.60 50.98
net Margin 2.30 13.26 27.92
Flock replacements - pence per kg lamb produced
24 21 18
Variable cost – pence per kg lamb produced
74 63 56
Fixed cost – pence per kg lamb produced
80 80 78
Unpaid family labour hours 1 hr 30 mins 1 hr 10 mins 1 hr 20 mins
Totals may not add up exactly due to rounding

46 Cattle and Sheep Enterprise Profitability in Scotland
LFA upland ewe flocks - technical performance
Bottom third Average top third
Ewes per ram 36 34 33Ewe replacement rate % 22 23 21Lambs born dead or alive per 100 ewes
146 159 172
Lamb mortality % 19 16 15Lambs reared per 100 ewes 127 143 157Average weight of lambs kg 38.9 40.1 41.8Weight of lamb produced per 100 ewes kg
4922 5723 6575
Purchased concentrates kg/ewe 50 45 45Home grown concentrates kg/ewe 4 5 6
Lambs sold finished per 100 ewes 65 91 114Value per lamb £/head 68.43 71.99 75.92Lambs sold/transferred store per 100 ewes
39 27 13
Value per lamb £/head 64.86 61.40 65.93Lambs sold/transferred for breeding per 100 ewes
23 25 30
Value per lamb £/head 75.55 87.14 97.44
Results from lowground breeding flocksThe twelve businesses in the survey farmed a some 4,150 ewes. The small sample size means that it is not sufficiently large to make sensible comparisons between the top and bottom third of businesses.
• All but two flocks in this group achieved a positive net margin with the average being £9 per ewe within a range form (-) £20 to £38 per ewe. This level of financial return was slightly lower than the average net margin of £13 per ewe among the LFA upland flocks.
• Although the business with the lowest margin did have the lowest ewe productivity the top two businesses did not have the highest ewe performance, although they were slightly better than the average performance of 134 lambs reared per 100 ewes. Compared to the upland flock average, the average lowground producer had a lower lambs reared percentage but sold, or used, a similar proportion of their lamb crop as prime lamb, stores and breeding sheep. However, they did achieve a better market return for prime lambs and breeding sheep. Nevertheless, having fewer lambs to sell than the upland average did result in lowground flocks having a lower net output than upland flocks.
Cattle and Sheep Enterprise Profitability in Scotland 47
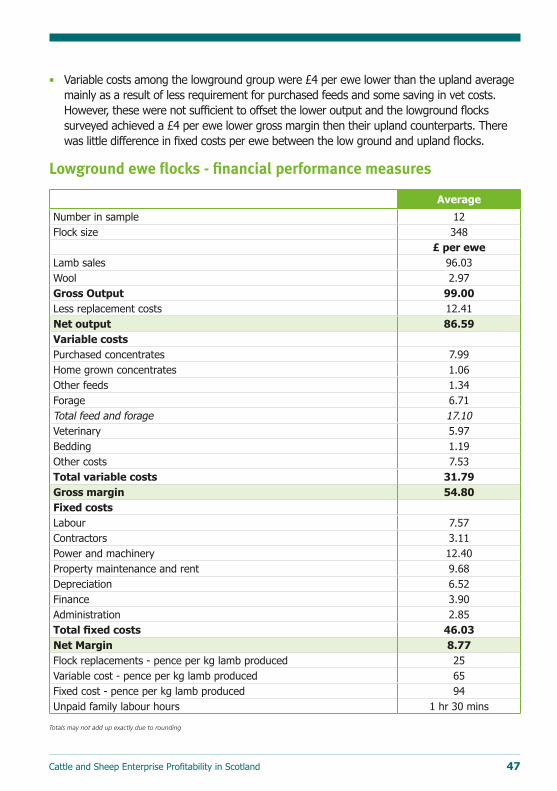
• Variable costs among the lowground group were £4 per ewe lower than the upland average mainly as a result of less requirement for purchased feeds and some saving in vet costs. However, these were not sufficient to offset the lower output and the lowground flocks surveyed achieved a £4 per ewe lower gross margin then their upland counterparts. There was little difference in fixed costs per ewe between the low ground and upland flocks.
Lowground ewe flocks - financial performance measures
Average
Number in sample 12Flock size 348
£ per eweLamb sales 96.03Wool 2.97Gross output 99.00Less replacement costs 12.41net output 86.59Variable costsPurchased concentrates 7.99Home grown concentrates 1.06Other feeds 1.34Forage 6.71Total feed and forage 17.10Veterinary 5.97Bedding 1.19Other costs 7.53total variable costs 31.79Gross margin 54.80Fixed costsLabour 7.57Contractors 3.11Power and machinery 12.40Property maintenance and rent 9.68Depreciation 6.52Finance 3.90Administration 2.85Total fixed costs 46.03net Margin 8.77Flock replacements - pence per kg lamb produced 25Variable cost - pence per kg lamb produced 65Fixed cost - pence per kg lamb produced 94Unpaid family labour hours 1 hr 30 mins
Totals may not add up exactly due to rounding

48 Cattle and Sheep Enterprise Profitability in Scotland
Lowground ewe flocks - technical performance
Average
Ewes per ram 43Ewes replacement rate % 23Lambs born dead or alive per 100 ewes 150Lambs mortality per 100 ewes 16Lambs reared per 100 ewes 134Average weight of lambs kg 37.4Weight of lamb produced per 100 ewes kg 4920Purchased concentrates kg/ewe 32Home grown concentrates kg/ewe 6
Lambs sold finished per 100 ewes 86Value per lamb £/head 73.76Lambs sold/transferred store per 100 ewes 28Value per lamb £/head 59.06Lambs sold/transferred for breeding per 100 ewes 20Value per lamb £/head 88.38
Results from store lamb finishing enterprisesThirteen store lamb finishing businesses, selling some 8,750 lambs achieved an average gross margin of £1 per lamb. Net margins averaged (-) £3.50 per lamb in a range from (-) £12 to £6.50 per lamb with only half those surveyed achieving a positive net margin. The size of the group was insufficient to make sensible comparisons between top and bottom third performance.
• The average finishing period of 100 days within a range of 46 days to 175 days, with the average finisher added some 7kg to their lamb’s purchase weight of 32.65kg. Both long and short keep finishers were equally represented among those with the best financial performance.
• Average mortality among the group was 2.0% within a range from 0% to 6%. Not surprisingly those with lowest mortality rates were more profitable.

Cattle and Sheep Enterprise Profitability in Scotland 49
Store lamb finishing - financial performance measures
Average
Number in sample 13Flock size 673
£ per lambLamb sales 64.99Less purchases 51.38net output 13.61
Variable costsPurchased concentrates 5.54Home grown concentrates 0.31Other feeds 0.18Forage 0.93Total feed and forage 6.97Veterinary 0.77Bedding 0.14Other costs 4.57total variable costs 12.45Gross margin 1.15
Fixed costsLabour 0.92Contractors 0.38Power and machinery 0.88Property maintenance and rent 1.34Depreciation 0.65Finance 0.19Administration 0.28Total fixed costs 4.64
net Margin (-) 3.49
Lambs purchased - pence per kg lwt lamb sold 130Variable cost – pence per kg lwt lamb sold 31Fixed cost - pence per kg lwt lamb sold 12Unpaid family labour hours 10 mins

50 Cattle and Sheep Enterprise Profitability in Scotland
Store lamb finishing - technical performance
Average
Weight of lamb purchased kg 32.6Liveweight of lamb sold 39.5Carcase weight of lamb sold 18.6Sale price p/kg dwt 350Daily liveweight gain 0.07Finishing period – days 100Mortality % 2Purchased concentrates kg/lamb 21Home grown concentrates kg/lamb 2
Cattle and Sheep Enterprise Profitability in Scotland 51
CoMPARISonS

52 Cattle and Sheep Enterprise Profitability in Scotland
IMPRoVInG REtURnS tHRoUGH QUALItY
BeefThe quality of the stock presented to the market and its value to processors through improved meat yield, or less carcase trimming, will be reflected in market prices. For example, in 2012 the average price paid for a –U3 steer exceeded that of an R4L steer by 2.7p/kg dwt, while for heifers this differential was higher at 5.1p/kg dwt. An improvement in carcase quality from O+4H to R4L was worth 6.6p/kg dwt to producers for steers and 5.9p/kg dwt for heifers during 2011.
Compared to 2011 the premium for leaner better conformation steers and heifers (-U3) was little changed. By contrast, the premium between the benchmark R4L grading and the poorer conformation and fatter O+4H grade reduced by 20% for steers and 30% for heifers as stock supplies tightened up. As supplies tightened further into 2013 price differentials between grades narrowed further.
Using the average carcase weights of steers and heifers slaughtered in Scottish abattoirs during 2010, 2011 and 2012, a comparison can be made between the average carcase values of the differently graded animals and is summarised in the table below:
Average -U3 premium over R4L (£/head)
Average R4L premium over o+4H (£/head)
2010 2011 2012 2010 2011 2012
Steer 6 11 10 29 31 25
Heifer 15 17 17 19 27 19
LambAs is the case for beef, there is also a financial reward from the market place where a lamb carcase meets an improved conformation and fat level. The average premium in Great Britain at price reporting abattoirs for a carcase achieving a grade of U2 over a carcase with an R3L grading was 9.2 /kg dwt during 2012, down marginally from 10.1p/kg in 2011. The average extra price paid for an R3L carcase over an O3H lamb increased substantially to 13.9p/kg in 2012 from 8.9p/kg dwt in 2011.
During 2012, the average carcase weight of a lamb killed at a Scottish abattoir was approximately 20kg. Consequently, a lamb that achieved a U2 grade was worth, on average, £1.84 per carcase more than a lamb graded at R3L. Lambs graded at R3L were worth £2.78 more than those achieving an O3H grade. In 2011 these premia stood at £2.03 and £1.82 respectively.

Cattle and Sheep Enterprise Profitability in Scotland 53
Average U2 premium over R3L (£/head)
Average R3L premium over o3H (£/head)
2010 2011 2012 2010 2011 2012
Lambs 2.05 2.03 1.84 1.90 1.82 2.78
However, in late 2012 the differentials for improved quality increased as the problems of climate impacted on both lamb supplies and quality. Over the first two-thirds of 2013 the price differentials have remained at these higher levels of 11p kg dwt price improvement for a U2 over R3L and 18 p/kg dwt for an R3L over an O3H.
These figures are average variations across Great Britain, but individual processors will have different requirements, and hence different pricing structures, which may have led to deviation from these levels. Therefore, a good relationship between producer and buyer which involves regular dialogue and feedback is very important.
The following chart illustrates the seasonality of lamb quality. As the new season began in 2012, 75% of lambs at price reporting abattoirs achieved at least an R3L grading. This was further deterioration from the peak figure of 82% from the 2010 season and back at levels seen in 2008. The challenges of lamb quality and climate were apparent through the June to October period where carcase quality trailed the average for the same period of the previous year by around 1.5 percentage points; averaging just under 70%. However, as the marketing year progressed and despite the climatic challenges, lamb quality was similar to a year earlier, then quality improved at the start of the 2013 marketing season.
440
420
400
380
360
340
320
300
280
260
Scottish Deadweight Steer Price
2011 2012 2013
p/kg
dw
t
2011 2012 2013
1050
1000
950
900
850
800
750
700
650
600
550
Store Steers 12-18 Months Old
J F M A M J J A S O N D
2011 2012 2013
2011 2012 2013
600
550
500
450
400
350
300
GB Lambs and Hoggs Standard Quality Quotation
J F M A M J J A S O N D
£ p
er h
ead
140
130
120
110
100
90
80
70
2011
=10
0
55
50
45
40
35
30
25Aug Sep Oct Nov Dec
Blackface Store Lamb Autumn Sales Average Prices
£ p
er h
ead
J F M A M J J A S O N D J F M A M J J A S O N D J F M A M J J A
Energy
2011 2012 2013
Fertilisers Feed Veterinary All Inputs
p/kg
dw
t
40
50
60
70
80
90
%
GB seasonal variation in carcases graded R3L or better
Selected Agricultural Input Costs Source: Defra
J F M A M J J A S O N D

54 Cattle and Sheep Enterprise Profitability in Scotland
EStIMAtIon oF non-CASH CoSt oF PRoDUCInG CAttLE & SHEEPThe enterprise costings produced in this survey indicate the reward for the unpaid labour of those working with the herds and flocks and the reward for investing capital in an enterprise. A negative net margin indicates that there is no return for the labour and investment committed to an enterprise.
In this chapter, estimates are made of how much should be set against an enterprise if unpaid labour were to be charged for and if a return of 5% was required from the investment in livestock and running costs (but not buildings and land). The reward for investment in land and buildings can be considered to be the rental value of the land used by an enterprise. This analysis draws rental values from the Scottish Government RERAD 2013 report1 on tenanted land. This rental value gives a measure of the opportunity cost of the land used by beef and sheep enterprises.
The value of unpaid labour is estimated using the proportion of a man-year committed to the enterprise and an average value for an hour of work. Time committed by the average farmer is drawn from the survey data, with one man-year defined as 2,200 hours of annual work2. One hour of labour has been valued at £14.14, an increase of one per cent on the year.
Cattle enterprises
Unpaid labour
Return on working capital3
Rent of land and buildings
p/kg liveweight sold
Hill suckler herds 56 20 34
Upland suckler herds selling calves at weaning 47 27 10
Upland suckler herds selling yearlings 30 21 10
Lowground suckler herds 33 23 27
Rearer finisher herds 25 24 15
Cereal based store finishing 2 7 1
Forage based store finishing <22 months old 4 8 3
Forage based store finishing >22 months old 8 9 5
1 “Tenanted Agricultural Land in Scotland 2012” Scottish Statistical Publication June 2013
2 47 hour average week, assuming five weeks of leave

Cattle and Sheep Enterprise Profitability in Scotland 55
Sheep enterprises
Unpaid labourReturn on
working capital3 Rent of land
and buildings
p/kg liveweight sold
Hill flocks 19 14 21
Upland flocks 28 11 6
Lowground non-LFA flocks 29 14 9
Store lamb finishers 6 8 2
3 Return required to give a 5% return on working capital.
total cost of producing a kilogramme of beef or sheepmeatAdding together the value of non-cash costs and the running costs of an enterprise provides an indication of the total cost of producing a kilogramme of beef or sheep meat. However, before doing this all enterprises need to be brought to a common standard. Thus, finance charges and rents paid have been excluded from the fixed costs of the enterprises surveyed in making the following estimate. They have been replaced by the imputed value for return on working capital and rental value for the land used for the livestock enterprise.
The table on the following page summarises the cost of production for a kilogramme liveweight of beef or sheepmeat produced by the average performer among the enterprises covered by the survey.

56 Cattle and Sheep Enterprise Profitability in Scotland
Repl cost
Var cost
Fixed cost
Non cash estimatesTotal
Cost
Selling priceLabour
Working capital
Rental value
Pence per kg liveweight sold
Sheep enterprises
Store lambs 130 31 10 6 8 2 187 164
Hill ewe 32 68 97 19 14 21 251 166
Upland ewe 21 63 67 28 11 6 196 181
Lowland 25 65 73 29 14 9 215 195
Cattle enterprises
Hill suckler 19 121 126 56 20 34 376 210
Upland selling at weaning
28 99 129 47 27 10 340 207
Upland selling yearlings
24 107 114 30 21 10 306 217
Non LFA suckler 27 98 91 33 23 27 299 200
Rearer finisher 19 131 102 25 24 15 316 238
Forage finisher <22 month
111 64 29 4 8 3 219 218
Forage finisher >22 month
129 57 26 8 9 5 234 206
Cereal finisher 108 61 13 2 7 1 192 203
Labour based on £14.14 per hour and 2,200 hours per man year
Rental values based on values published in Scottish Government’s Tenanted Agricultural land in Scotland 2012
Working capital charged at 5%
Fixed cost adjusted for property and finance paid.

Cattle and Sheep Enterprise Profitability in Scotland 57
CoMPARISonS WItH 2010 AnD 2011The following tables summarise and compare the results from the 2012 calf and lamb crop with those of 2010 and 2011. Analysis is based on a comparison of the average from each of the three years surveyed and does not compare an identical sample.
Cattle EnterprisesSuckler herds
• All suckler herds saw a deterioration in gross and net margins for the 2012 calf crop. This reflects the difficult farming conditions of the year which resulted in lower growth rates resulting in lighter calves for sale and, despite better per kg prices, lower revenue. Furthermore, productivity, measured as calves reared per 100 cows to the bull, was also compromised resulting in a lower quantity of livestock sold per cow in the herd.
• Despite fertiliser prices reducing over the year, all suckler enterprises faced higher forage costs. Escalating purchased feed costs in the second half of 2012 resulted in higher feed costs for those herds selling yearlings while those selling younger cattle made some savings in feed costs but this reflected in lower weights of cattle at sale. With the exception of hill herds, all the suckler herd systems faced rising veterinary costs with the upland herds also facing higher bedding costs, both elements associated with the challenges of the poor weather conditions prevalent for most of 2012.
• Fixed costs control was also challenging. Most herds say fixed costs increasing at a faster rate than the general level of agricultural input price inflation as weather induced changes to farm practices resulted in higher labour, machinery and property costs being carried by herds.
Cattle finishing
• Rearer finisher enterprises surveyed in 2012 saw useful increases in calf output as prime cattle prices increased over the year. However, herd maintenance costs eroded most of the improved prime stock price. Notwithstanding the escalation in feed prices variable costs were well controlled as greater use of forage was made resulting in only a modest increase in variable costs and limited the decline in gross margin. However, fixed cost proved harder to control increasing by 11% to result in an overall decline of £45 in the net margin per cow.
• Intensive store cattle finishers with housed cattle fed a predominately cereal diet benefitted for the increase in prime cattle prices during 2012 which more than offset the increase in feed costs and stock purchases. However, the general challenge of controlling fixed costs was sufficient to constrain improvements in net margin to £50 per animal finished.
58 Cattle and Sheep Enterprise Profitability in Scotland
Forage based finishing systems also benefited from increased returns from the market place but hand on most of the increased income from prime stock prices to store cattle producers resulting in little change in the net output of the enterprise. Expenditure on variable costs increased as a consequence of higher purchased feed prices and in the cost of producing forage. In combination with little change in output the increase in variable costs resulted in gross margins falling £20 per head. Increases in fixed costs further aggravated the situation and the average forage based finishers found net margins sliding into negative territory in 2012.
Sheep enterprisesLFA Sheep
• All LFA ewe flocks were impacted by declining lamb prices from late 2012. Lower lamb rearing percentages were also recorded and collectively these two elements resulted in a decline in output of more than 10%.
• Poor weather conditions led to increased feeding of concentrates, particularly among upland flocks, and cost of producing forage. There was also some increase in veterinary costs. The increase in variable costs was greater among the upland flocks than hill flocks largely because of higher lamb numbers requiring supplementary feed. Fixed costs were little different among upland flocks but did escalate slightly among hill flocks.
• The net effect of these changes in income and expenditure was for margins to fall by £17 per head among upland flocks but still remained positive. Hill flock net margin fell £9 per ewe and moved further into a loss situation than in 2011.
Lowground sheep
• Although lowground flocks achieved a positive net margin this was £20 lower than 2011 and the lowest level for three years. The reason for the decline in margins is attributable to a changed sales pattern and lower physical performance. By changing sales behaviour lowground flocks surveyed constrained both variable and fixed costs to the same levels as 2011. However, the greater proportion of store lambs sold and lower revenue from smaller prime lambs resulted in net output falling over £20 per head, and net margins likewise.
Lamb finishing
• Prime lamb prices were much lower in late 2012 and 2013 than 12 months earlier and despite selling prime lambs of similar weight store lamb finishers saw market returns fall some £10 per head, more than offsetting the decline in store lamb purchase price.
• The climatic challenges of autumn 2012 resulted in store lamb finishers using a greater quantity of more expensive purchased feeds further eroding margins where gross margins fell £10 per lamb and despite good control of fixed costs net margins became negative for the first time in three years.

Cattle and Sheep Enterprise Profitability in Scotland 59
Hill herds Lowland herds2010 2011 2012 2010 2011 2012
Physical performance Calves born alive per 100
86 93 94 89 90 91
Calves reared per 100 84 91 89 85 88 86Daily liveweight gain (kg)
0.97 0.95 0.98 1.16 1.17 1.08
Return per calf (£ per head)
602.88 694.72 626.64 565.27 660.50 612.00
Calf price (£ per kg lwt)
1.80 2.11 2.10 1.69 1.91 2.00
Weight per calf (kg) 334 329 298 333 345 306
Suckler herds
Hill suckler herds Lowland suckler herds2010 2011 2012 2010 2011 2012
Number in sample 15 18 15 17 16 17Avg. herd size (head) 91 75 57 62 60 82
£ per cowCalf output including beef calf premium
550.67 675.90 605.67 523.23 630.14 568.79
less replacements 42.21 41.83 49.76 53.00 72.27 70.20net output 508.46 634.07 555.91 470.23 557.87 498.59
Variable CostsTotal concentrates 115.05 156.14 127.25 38.26 52.71 43.42Other Feeds 23.23 44.54 46.34 41.78 44.14 31.70Forage 63.27 67.57 78.63 46.64 56.46 66.86Total Feed and Forage 201.55 268.25 252.22 126.68 153.31 141.98Veterinary 49.27 41.04 29.70 30.11 43.90 50.06Bedding 31.46 27.51 11.57 38.68 42.44 41.81Other costs 22.47 17.73 28.73 27.37 21.56 22.57total variable costs 304.73 354.53 322.22 222.84 261.20 256.42Gross Margin 203.71 279.54 233.69 247.39 296.67 242.17Fixed costs 392.65 374.61 369.24 326.42 362.62 373.83net Margin (-) 188.94 (-) 95.07 (-)135.55 (-) 79.03 (-) 65.95 (-) 131.66
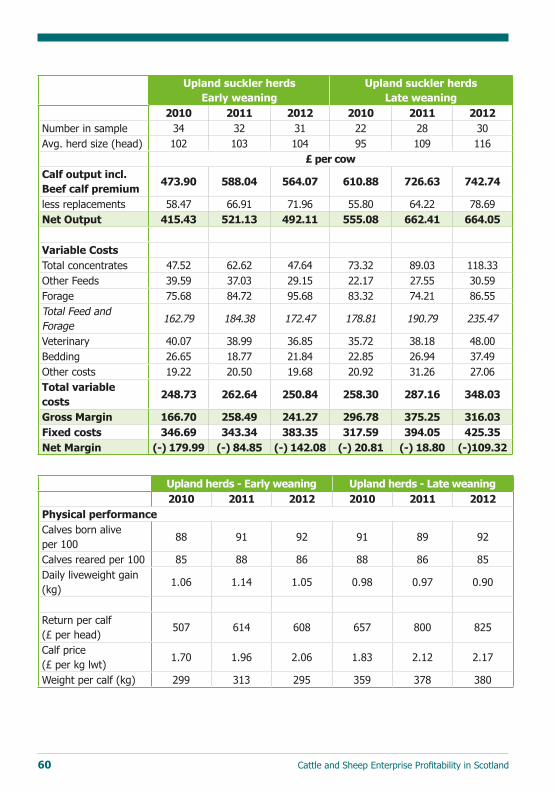
60 Cattle and Sheep Enterprise Profitability in Scotland
Upland herds - Early weaning Upland herds - Late weaning2010 2011 2012 2010 2011 2012
Physical performance Calves born alive per 100
88 91 92 91 89 92
Calves reared per 100 85 88 86 88 86 85Daily liveweight gain (kg)
1.06 1.14 1.05 0.98 0.97 0.90
Return per calf (£ per head)
507 614 608 657 800 825
Calf price (£ per kg lwt)
1.70 1.96 2.06 1.83 2.12 2.17
Weight per calf (kg) 299 313 295 359 378 380
Upland suckler herds Early weaning
Upland suckler herds Late weaning
2010 2011 2012 2010 2011 2012Number in sample 34 32 31 22 28 30Avg. herd size (head) 102 103 104 95 109 116
£ per cowCalf output incl. Beef calf premium
473.90 588.04 564.07 610.88 726.63 742.74
less replacements 58.47 66.91 71.96 55.80 64.22 78.69net output 415.43 521.13 492.11 555.08 662.41 664.05
Variable CostsTotal concentrates 47.52 62.62 47.64 73.32 89.03 118.33Other Feeds 39.59 37.03 29.15 22.17 27.55 30.59Forage 75.68 84.72 95.68 83.32 74.21 86.55Total Feed and Forage
162.79 184.38 172.47 178.81 190.79 235.47
Veterinary 40.07 38.99 36.85 35.72 38.18 48.00Bedding 26.65 18.77 21.84 22.85 26.94 37.49Other costs 19.22 20.50 19.68 20.92 31.26 27.06total variable costs
248.73 262.64 250.84 258.30 287.16 348.03
Gross Margin 166.70 258.49 241.27 296.78 375.25 316.03Fixed costs 346.69 343.34 383.35 317.59 394.05 425.35net Margin (-) 179.99 (-) 84.85 (-) 142.08 (-) 20.81 (-) 18.80 (-)109.32

Cattle and Sheep Enterprise Profitability in Scotland 61
Rearer/Finishers2010 2011 2012
Number in sample 21 22 22Average herd size (head) 103 96 95
£ per cowCalf output incl. Beef calf premium
820.94 961.22 999.39
less replacements 59.43 44.71 75.96net output 761.51 916.51 923.44
Variable CostsTotal concentrates 180.04 213.91 218.17Other Feeds 50.08 60.29 48.45Forage 94.79 106.29 115.86Total Feed and Forage 324.88 381.12 382.49Veterinary 42.25 45.87 49.64Bedding 48.16 52.87 52.16Other costs 45.17 44.15 41.94total variable costs 460.46 524.00 526.24Gross Margin 301.05 392.51 397.20Fixed costs 441.37 437.22 468.03net Margin (-) 140.32 (-) 44.71 (-) 70.83
Physical performance Calves born alive per 100 88 90 94Calves reared per 100 85 88 88Daily liveweight gain (kg) 0.90 0.91 0.83
Return per calf (£ per head) 976 1139 1183Sale price (pence per kg dwt) 291 330 352Weight per calf (kg) 583 616 580

62 Cattle and Sheep Enterprise Profitability in Scotland
Businesses finishing cattle under cereal based and forage based systems
Cereal based Forage based2010 2011 2012 2010 2011 2012
£ per headNumber in sample 15 15 15 35 35 36Stock Sales 978.78 1086.09 1229.11 1014.97 1174.01 1250.91Less stock purchases 554.44 634.13 657.38 615.87 652.28 727.49net output 424.34 451.96 571.73 399.10 521.73 523.42
Variable CostsConcentrates 209.05 223.76 263.34 142.69 175.72 193.07Other Feeds 19.05 27.11 22.98 22.33 35.30 21.93Forage 8.09 7.13 7.63 27.19 46.25 52.73Total Feed and Forage 236.19 258.01 293.95 192.21 257.26 267.74Veterinary 10.64 11.17 12.93 9.27 9.83 13.25Bedding 35.85 30.69 30.69 25.44 31.03 32.23Other Costs 26.62 23.24 35.10 40.38 33.51 39.49total variable costs 309.30 323.10 372.68 267.30 331.63 352.80Gross Margin 115.04 128.86 199.05 131.80 190.09 170.62Fixed Costs 64.87 72.33 92.02 180.99 176.51 198.95net Margin 50.17 56.52 107.03 (-)49.19 13.58 (-)28.33
Physical performance Feeding period (days) 206 217 243 334 333 368Start Wt (kg lwt) 325 340 289 345 358 355Average carcase weight (kg dwt)
339 343 353 341 345 377
Daily LWT gain (kg) 1.2 1.2 1.3 0.76 0.77 0.81Mortality (%) 0.5 0 0.1 0.5 0.1 0.4
Sale price (£ per kg dwt) 2.94 3.17 3.51 2.92 3.39 3.64Purchase price (£ per kg lwt)
1.70 1.86 2.27 1.77 1.83 2.18
Gross Margin per day (£ per day of feeding period)
0.56 0.59 0.82 0.39 0.57 0.46

Cattle and Sheep Enterprise Profitability in Scotland 63
Results from LFA sheep flocks
LFA Upland Sheep Flocks LFA Hill Sheep Flocks2010 2011 2012 2010 2011 2012
£ per ewe
Number in Sample 29 33 32 23 21 26Lamb sales 103.42 118.73 103.46 59.28 64.85 59.48Wool 1.58 2.95 3.50 1.05 2.24 2.38Gross output 105.00 121.68 106.96 60.33 67.08 61.86less replacement costs 9.00 11.03 11.93 9.84 10.21 11.34net output 96.00 110.65 95.03 50.49 56.88 50.52
Variable costsConcentrates 9.38 9.85 12.26 5.35 7.38 6.89Forage cost 5.10 6.33 7.71 1.41 2.72 3.78Roughages 1.47 1.79 1.55 2.44 1.09 1.90Total feed and forage 15.95 17.98 21.52 9.20 11.19 12.57Bedding 0.77 0.89 0.64 0.15 0.18 0.14Veterinary 6.03 7.24 7.62 4.81 5.93 6.21Other costs 6.07 7.06 6.40 7.52 6.28 5.51total variable costs 28.82 33.17 36.17 21.68 23.58 24.43Gross margin 67.18 77.48 58.86 28.81 33.30 26.09Fixed costs 44.92 46.66 45.60 35.13 36.52 38.85net Margin 22.26 30.82 13.26 (-) 6.32 (-) 3.22 (-) 12.77
Physical Performance LFA Upland Sheep Flocks LFA Hill Sheep FlocksAverage no. ewes 568 566 616 750 605 706 Lambs born/100 ewes 161 168 159 106 111 116Lambs died/100 ewes 6 15 16 7 11 17Lambs reared/100 ewes 155 153 143 99 100 99 Lambs sold/retained:Slaughter % 66 62 64 25 31 26Stores % 18 22 19 40 33 40Breeding % 16 16 17 34 36 34Return per lamb sold finished (£)
68.89 78.75 71.99 69.23 72.33 63.46
Carcase weight lambs sold finished (kg)
19.6 19.9 19.6 18.9 18.1 19.8
Return per lamb sold store (£)
60.61 67.00 64.40 47.44 48.90 42.79

64 Cattle and Sheep Enterprise Profitability in Scotland
Results from Lowground sheep flocks
2010 2011 2012£ per ewe
Number in Sample 16 12 12
Lamb sales 103.38 119.01 96.03Wool 1.41 2.52 2.97Gross output 104.79 121.52 99.00less replacement costs 9.96 12.60 12.41net output 94.83 108.93 86.59
Variable costsConcentrates 9.61 9.63 9.07Forage cost 7.41 4.44 6.71Roughages 2.74 3.05 1.34Total feed and forage 19.76 17.12 17.10Bedding 0.88 1.57 1.19Veterinary 5.80 7.08 5.97Other costs 6.59 8.33 7.53total variable costs 33.03 34.10 31.79Gross margin 61.80 74.83 54.80Fixed Costs 44.89 46.74 46.03net Margin 16.91 28.09 8.77
Physical performanceAverage no. ewes 425 382 348 Lambs born per 100 ewes 154 170 150Lambs died per 100 ewes 12 24 16Lambs reared per 100 ewes 145 146 134 Lambs sold/retained:Slaughter % 72 82 64Stores % 18 4 21Breeding % 10 14 15
Return per lamb sold finished (£) 71.42 79.39 73.76Carcase weight lambs sold finished (kg) 20.7 20.3 17.5Return per lamb sold store (£) 64.97 74.97 36.43

Cattle and Sheep Enterprise Profitability in Scotland 65
Store lamb finishing
2010 2011 2012£ per lamb
Number in sample 12 12 13Lamb sales 73.52 75.45 64.99less store lamb purchase costs 55.76 54.62 51.38
output 17.76 20.83 13.61
Concentrates 2.40 2.24 5.85Other feed 0.23 0.12 0.18Forage 1.09 1.78 0.93Total feed and forage 3.73 4.15 6.97Bedding 0.10 0.01 0.14Veterinary 1.44 0.90 0.77Other costs 3.43 3.89 4.57total variable costs 8.70 8.95 12.45Gross margin 9.06 11.88 1.15Fixed costs 5.45 5.40 4.64net Margin 3.61 6.48 (-) 3.49
Physical performance Feeding period (days) 107 102 100 Liveweight at start (kg) 32.3 30.5 32.6 Liveweight at finish (kg) 41.4 39.1 39.5 Mortality (%) 2 2.5 2 Concentrates (kg) 11 10 21Average carcase weight (kg dwt) 19.5 18.4 2

66 Cattle and Sheep Enterprise Profitability in Scotland
GLoSSARY
output: Income to the enterprise after deducting the cost of maintaining the breeding flock or purchasing store livestock and after valuation changes.
Variable costs: Costs which vary directly with the size of production of the enterprise and which can be easily allocated to an enterprise.
Gross margin: The surplus income left over after deducting variable costs from output. It is the contribution of the enterprise towards covering the farmer’s fixed costs and overheads, rewarding the owner of the business for their work and capital investment.
Fixed costs: Costs reflecting the overall running of the business, but cannot be easily allocated to an enterprise because in many cases they are shared costs. In this analysis they have been broken down into the following categories:
Labour costs: All paid labour including regular wages, contract labour and casual wages.
Power & machinery: Machinery repairs; fuel; electricity; hire charges; tax and insurance.
Property maintenance & rent: Farm and property repairs; council taxes and water charges; rent and grazing lets.
depreciation: Machinery and property depreciation charges
Finance: Bank and loan interest and charges
Administration: Insurance; professional fees; miscellaneous expenses.
Contractors: Contract labour and service charges.
net margin: The surplus income left after deducting all costs from the output. It is the contribution the enterprise makes to cover the cost of unpaid family labour and to reward the owner for their investment in the enterprise.
Working capital: The sum of money tied up in productive livestock and the average capital needed to finance the annual costs of running the business; the latter estimated to be half of the total variable and fixed costs for the year.

Quality Meat Scotland The Rural Centre, West Mains, Ingliston, Newbridge EH28 8NZ
Tel: +44(0)131 472 4040 Fax: +44(0)131 472 4038
Email: [email protected] www.qmscotland.co.uk
© Quality Meat Scotland November 2013 QM
2586
_11/
13
This publication is printed on paper manufactured from FSC pulp, supporting
responsible use of forest resources.