qatalum site visit - norsk hydro · qatalum site visit (2) certain statements included within this...
TRANSCRIPT

(1)
January 25-26, 2010
Qatalum site visit

(2)
Certain statements included within this announcement contain forward-looking information, including, without limitation, those relating to (a) forecasts, projections and estimates, (b) statements of management’s plans, objectives and strategies for Hydro, such as planned expansions, investments or other projects, (c) targeted production volumes and costs, capacities or rates, start-up costs, cost reductions and profit objectives, (d) various expectations about future developments in Hydro’s markets, particularly prices, supply and demand and competition, (e) results of operations, (f) margins, (g) growth rates, (h) risk management, as well as (i) statements preceded by “expected”, “scheduled”, “targeted”, “planned”, “proposed”, “intended” or similar statements.
Although we believe that the expectations reflected in such forward-looking statements are reasonable, these forward-looking statements are based on a number of assumptions and forecasts that, by their nature, involve risk and uncertainty. Various factors could cause our actual results to differ materially from those projected in a forward-looking statement or affect the extent to which a particular projection is realized. Factors that could cause these differences include, but are not limited to: our continued ability to reposition and restructure our upstream and downstream aluminium business; changes in availability and cost of energy and raw materials; global supply and demand for aluminium and aluminium products; world economic growth, including rates of inflation and industrial production; changes in the relative value of currencies and the value of commodity contracts; trends in Hydro’s key markets and competition; and legislative, regulatory and political factors.
No assurance can be given that such expectations will prove to have been correct. Hydro disclaims any obligation to update or revise any forward-looking statements, whether as a result of new information, future events or otherwise.
Forward-looking statements
57Qatalum project – Tom Røtjer
97Qatalum operations – Jan Arve Haugan
3Hydro – Jørgen C. Arentz Rostrup
38Market update – Eigil Madsen
Table of contents

Jørgen C. Arentz Rostrup, Executive Vice President and CFO
Hydro

(4)
Hydro’s value proposition
• Leading integrated aluminium and energy company with global reach and attractive positions across the value chain
• Upstream cost position to be improved by the world-class Qatalum smelter
• Strong operational performance and cost focus
• Financial discipline
• Long-term prospects foraluminium remain encouraging

(5)
Business model
EnergyPrimary Metal
Rolled Products
Metal Markets
Extruded Products
• Revenue in NOK• Cost in NOK
• Long-term power supply
• 9.4 Twh of renewable energy production
• Revenue in USD• Cost in USD – alumina,
petroleum coke• Cost in local currency
– energy, labor, maintenance
• High LME and USD sensitivity
• Improving cost position
• Technology
• EUR and USD business
• Margin business
• Expertise in materials
• Flexible system• Strong marketing
organization
• Margin business• Regional business• Volumes-• 80% Europe, 5%
North-America and 15% other
• Close to customers• Innovation• Market leading in litho
and foil
• Margin business• Local business• Volumes: 75%
Europe, 20% North America and 5% other
• Close to customers• Innovation• Market leading in
Building Systems
Aluminium in productsPrimary aluminium production Midstream, recycling

(6)
1Market

(7)
Historic downturn in 2009
-20%
-16%
-12%
-8%
-4%
0%
4%
8%
12%
16%
20%
24%
1971
1972
1973
1974
1975
1976
1977
1978
1979
1980
1981
1982
1983
1984
1985
1986
1987
1988
1989
1990
1991
1992
1993
1994
1995
1996
1997
1998
1999
2000
2001
2002
2003
2004
2005
2006
2007
2008
2009
Gross Domestic Product Aluminium Consumption Industrial Production
Source: Global Insight / CRU / Hydro
World outside China
% change YoY World ex China
(8)
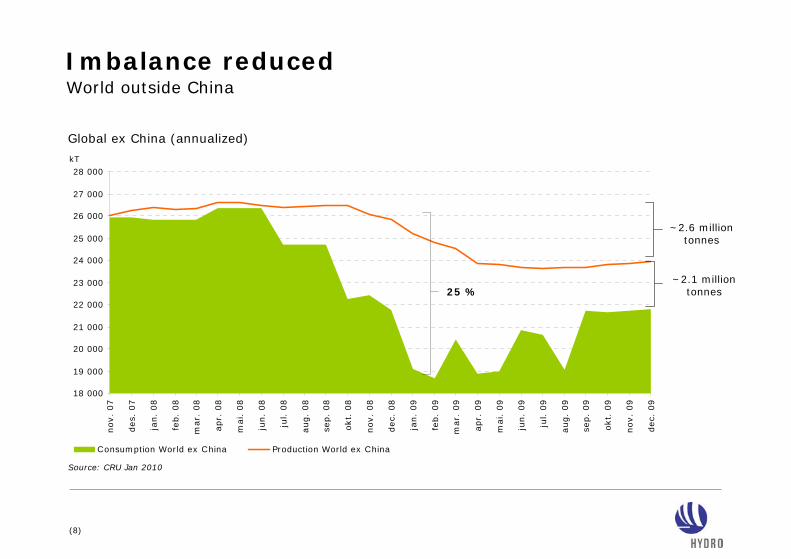
Source: CRU Jan 2010
Imbalance reduced
Global ex China (annualized)
18 000
19 000
20 000
21 000
22 000
23 000
24 000
25 000
26 000
27 000
28 000
nov.
07
des.
07
jan.
08
feb.
08
mar.
08
apr.
08
mai. 0
8
jun.
08
jul. 0
8
aug.
08
sep.
08
okt.
08
nov.
08
dec.
08
jan.
09
feb.
09
mar.
09
apr.
09
mai. 0
9
jun.
09
jul. 0
9
aug.
09
sep.
09
okt.
09
nov.
09
dec.
09
Consumption World ex China Production World ex China
~2.1 million tonnes
~2.6 million tonnes
25 %
World outside China
kT

(9)
Hydro
Mixed signals in markets and economy
• LME inventories at record level
• Supply/demand imbalance
• Sales volumes increasing
• Margins stable
• Relatively strong LME-price in USD
• Risk of
w-shaped
recovery
• Strong NOK
• World GDP
and IP
growing
• Strong equity
markets

(10)
2Strategy

(11)
Solid measures executed in 2009
• Cash costs reduced by 30%• Primary aluminium production curtailed by 26%• Alumina production curtailed by 22%
• Utilized flexible remelt system to quickly respond to demand changes
• Significant cost savings and manning reductions• Agreement to divest Inasa rolling mill
• Operating capital reduced by NOK 5.8 billion• Capital expenditure plans cut by 50% from 2008-level• Permanent and temporary workers reduced by 4 500• Staff and support manning reduced by 30%, NOK 750 million
in reduced manning and external costs
• Significant cost savings and manning reductions• Agreement to divest Automotive Structures• Decision to close Adrian precision tubing plant
Primary Metal
Metal Markets
Rolled Products
Extruded Products
Hydro

(12)
Conversion cost31%
Power27%
Carbon13%
Alumina29%
2009*
* Includes only fully consolidated smelters
Target to reduce cash cost by 100 USD per tonne, representing 20% reductionin conversion cost
Focus on lean smelter operations and operational excellenceFurther upstream improvements necessary

(13)
Ambitious plan to cut cost by 100 USD/tonne
Calculation based on stable assumptions for LME, currencies, rawmaterial prices etc. Includes only fully consolidated smelters.
90% to be realized by end-2011 compared to 2009
0%
10%
20%
30%
40%
50%
60%
70%
80%
90%
100%
2010E 2011E 2012E
• Accelerated operational performance defined within Primary Metals production management system:• Improved current efficiency• Reduced power consumption• Reduced anode consumption
• Reduced fixed cost and lean operations

(14)
Primary Metal
• Implement stretch targets for cost savings and operational performance at existing assets
• Continued efforts on procurement initiatives
• Production curtailments• Additional curtailments – if needed• No restarts before it makes financial and industrial sense
• New growth projects only in first quartile on cost curve
• Qatalum start-up
Next steps in repositioning

(15)
Metal Markets
Primary production
3rd party primaryExtrusion ingot and Sheet ingot external
DownstreamRolled products
Extrusion
Ingot/scrapFoundry alloys/Wire rod/
Ingot external
Midstream casthouses& remelters
Strategy • Increased business volume through limited asset investments
• Optimized sourcing, casthouse operations and commercial marketing of metal products
• Primary casthouses to maximize capacity utilization by streamlining the production
• Gain leading position in scrap conversion
• Basis for strategic alliances

(16)
Extruded Products
• Leading positions in Extrusion Eurasia and Building Systems• Strong entrepreneurial spirit,
management culture and competence• Product quality and service excellence• Product innovation through strong
customer relations• Performance management – operational
excellence
• Strong position in the US and Brazil
• Strategy• Reinforce European extrusion base• Specialist in energy-neutral building
solutions• Selective acquisitions• Entry into new markets
222145
(1)10
459382
325 323380
456390
1 489
2007 2008
NOK millionUnderlying EBITDA*
1 237 367
2009
*Excluding Automotive Structures

(17)
• Strong multi-brand market penetration
• World wide sales organization
• High performing products
• Selective acquisitions
• Buildings of tomorrow
• Energy saving
• Energy gaining
• 100% recyclable
• Interactive with the user
Building SystemsOur way to energy neutral & surplus buildings

(18)
Rolled Products
• Strong position in foil, litho and automotive
• Underutilization and overcapacity is an industry challenge
• Strategy• Margin management and cash
generation• Focus production system on core
assets• High grading product portfolio
175
10079
92
242295
359
268267
383337
NOK millionUnderlying EBITDA
1 079
2007 2008
1 164 354
2009

(19)
Energy
Note: public ownership implies ownership by the state or municipalities
3.1
2.8
3.0 0.5
Røldal Suldal
Sogn
Telemark
TWh
2044-2049
2022
2051-2057
Strategy• Expand solid captive power position
• 0.5 – 1 TWh development potential• Utilizing existing concession areas and infrastructure• Investment NOK 1.2 – 2.5 billion from 2011 onwards• Normal production today 9.4 Twh
• Long-term power sourcing at predictable cost
Reversion• Effects for private companies• No renewal or new concessions
• Can own up to 1/3 of publicly owned plants• Everlasting concessions if sold to public companies
• Implications for Hydro• First large system to revert in 2022• Financial impact muted by:
• Public everlasting concession possibility• Hydro can maintain 1/3 indefinitely
Normal production capacity per region and terms
No reversion

(20)
Going forward
Upstream • Cost reduction
Midstream • Margin management
Downstream• Margin management • Capture possibilities • Cost control
Working capital management
Capital expenditures discipline

(21)
Attractive upstream growth pipeline
• Potential for expanding Qatalum up to 1.2 million mt
• Utilize next-generation smelting technology, HAL4e
• Development potential 0.5 – 1 TWh
• Utilizing existing concession areas and infrastructure
• Joint venture agreement between Vale (61%), Hydro (20%) and Dubal (19%)
• First stage 1.9 million mt of alumina, potential for expansions up to 7.4 million mt
Qatalum 2 – aluminium smelter, Qatar
CAP – alumina refinery, Brazil
Hydro power developments, Norway

(22)
3Qatalumexecution
(23)
60
70
65
290
4015
70
40
120
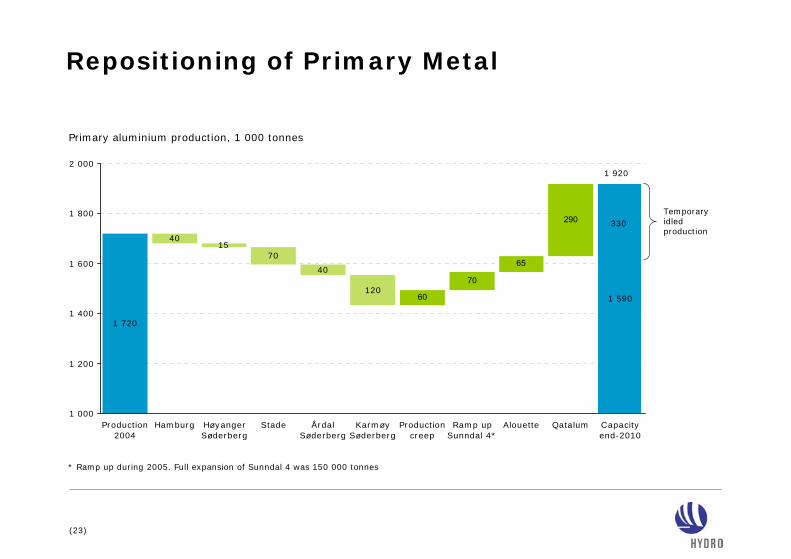
1 720
1 590
1 000
1 200
1 400
1 600
1 800
2 000
Production2004
Hamburg HøyangerSøderberg
Stade ÅrdalSøderberg
KarmøySøderberg
Productioncreep
Ramp upSunndal 4*
Alouette Qatalum Capacityend-2010
Repositioning of Primary Metal
* Ramp up during 2005. Full expansion of Sunndal 4 was 150 000 tonnes
Primary aluminium production, 1 000 tonnes
Temporary idled production
330
1 920

(24)
Qatalum financing
Project economics• First decile position on cash cost
curve when in full operation
Qatalum financing - USD 5.7 billion (100%)• Equity from owners 54%• Project financed 46%
Project financing• Term of loan is 16.5 years from
August 2007• Installment profile adjusted for cash
flow profile• Competitive terms

(25)
Qatalum ramp-up schedule
Production in 1 000 tonnes on 100% basis, annualized
0
100
200
300
400
500
600
1 2 3 4 5 6 7 8 9 10 11 12

(26)
Qatalum earnings
• Build-up costs in 2009 and into 2010
• Depreciated over ~20 years• Marginal tax implications• At current forward prices -
• Earnings negative in 2010• No dividend expected short term
-16
-99 -91
-125
-62
-35
-16
Hydro’s share of underlying EBIT in NOK million 2008 2009

(27)
US South East
US MidwestSouthern Europe/ Mediterranean JapanSouth
Korea
Thailand
Malaysia/SEAsia
ChinaQatar
IstambulLivorno/ Gaeta
BarcelonaSouthern Europe/ MediterraneanLisboa
GCC
India
Planned routes
North America
Hydro‘s metalsourcing system
NorwegianSystem
FromAustralia
Izmir
Qatalum target markets
Taiwan
Total 340 000 tonnes: 75% products & 25% standard ingotGlobal metal sales from Qatalum in 2010

(28)
4Financial flexibility

(29)
Cash flow neutral first nine months 2009
• Significant reductions in operating capital ~NOK 5.8 billion realized in 2009
• Capital discipline – reduced investments
• No dividend payment in 2009
• Qatalum investments• Project financed in first half 2009• Equity contribution from partners
in second half 2009 and 2010
2.5
0.7
3.5
3.33.0
0
1
2
3
4
5
6
Cash endQ4 2008
Operations Investments Financing /currency
Cash endQ3 2009
YTD 2009 in NOK billion

(30)
Capital expenditures
2008 2009E 2010E
Debt-financed investments in joint ventures (upstream)Investments QatalumOtherSustaining capex
NOK billion
~5.3*
~10.2
12.2
* Excluding net operating capital in Qatalum
• ~80% of 2009-2010 investments upstream
• Sustaining capex ~NOK 2.5-3 billion annually
• Qatalum• Project financed in first half 2009• Equity contribution in Q3
– NOK 1.5 billion• Equity contributions from partners
and project financing in Q4• Equity contributions mainly from
partners in 2010
• Additional prospects not included• Holsbru power development• Selective growth in Extrusion and
Building Systems

(31)
Sustaining capital expenditures
Energy
Extruded Products
Rolled Products
Metal Markets
Primary Metal relining
Primary Metal

(32)
Financial position
2.43.03.5
8.7
10.8
Dec 31,2007
June 30,2008
Dec 31,2008
June 30,2009
Sep 30,2009
Cash less interest-bearing debt
(19.0)(19.2)
(15.4)
(2.1)(0.8)
Dec 31,2007
June 30,2008
Dec 31,2008
Jun 30,2009
Sep 30,2009
Adjusted net debt*
* Net interest-bearing debt in equity accounted investments, net pension liability, operating lease commitments and other
NOK billion

(33)
Liquidity well covered
Available long-term credit facilities• EUR 750 million in bank facility
maturing in 2012• USD 1.7 billion in multi-currency
revolving facility maturing in 2014• Currently ~NOK 16 billion undrawn
Qatalum investments• USD 5.7 billion project costs* (100%)
• USD 2.6 billion project financed• USD 0.1 billion outstanding end-Q3
• USD 3.1 billion in equity from owners• USD 1.2 billion remaining end-Q3
* Excluding net operating capital

(34)
Credit quality policy
Maintain investment-grade rating
• Currently: BBB- (S&P), Baa2 (Moody’s), both with negative outlook
• Competitive access to capital and important for Hydro’s business model (partnerships and counterparty risk)
Financial ratios over the business cycle – Hydro’s ambitions
• Funds from operations to net adjusted debt > 40%
• Net adjusted debt to equity < 0.55
Oct-07 Apr-08 Oct-08 Apr-09
Baa1/BBB+
Negative outlook
Baa3/BBB-
Baa2/BBB
Negative outlook
Moody’s
S&P
Ba1/BB+
Investment grade rating

(35)
Price and currency sensitivities
Aluminium price sensitivity +/- 100 USD per tonne NOK/USD sensitivity +/- 0.1 NOK
• Annual sensitivities• Aluminium price sensitivity is net of aluminium price indexed costs• NOK/USD sensitivity includes USD revenues and costs• Based on expected business volumes for 2010 and the following prices:
• Aluminium 1 900 USD/tonne• NOK/USD 5.50
• LME sensitivity excludes unrealized effects related to operational hedging
• USD sensitivity on financial items is based on financial positions end Q3 09
600
450
0
100
200
300
400
500
600
700
EBIT Net income
200
150
0
50
100
150
200
250
EBIT Net income

(36)
Shareholder policy
• Hydro aims to give shareholders competitive returns compared to alternative investments in peers
• Dividend payout ratio* will average 30% over the cycle
• Buyback of shares and extra-ordinary dividends
• When earnings, liquidity position and capital structure allow
• No dividend payout for 2008, but dividend policy maintained
* Dividend divided by net income

(37)
Hydro’s priorities
• Reposition upstream business
• Execute Qatalum
• Proactive corrective measures
• Financial flexibility
• Stay close to customers
• Solid operations
• Competitive shareholder returns
• Dividend policy: 30% of net income over the cycle

(38)
Aluminium market update
Eigil Madsen, Head of Portfolio Development Primary Metal

1 000
1 200
1 400
1 600
1 800
2 000
2 200
2 400
2 600
2 800
3 000
3 200
3 400
Jan.0
8
Feb.0
8
Mar.
08
Apr.
08
May.0
8
Jun.0
8
Jul.08
Aug.0
8
Sep.0
8
Oct
.08
Nov.0
8
Dec.
08
Jan.0
9
Feb.0
9
Mar.
09
Apr.
09
May.0
9
Jun.0
9
Jul.09
Aug.0
9
Sep.0
9
Oct
.09
Nov.0
9
Dec.
09
Jan.1
0
US
D/t
onne
8 000
9 000
10 000
11 000
12 000
13 000
14 000
15 000
16 000
17 000
18 000
19 000
20 000
21 000
22 000
23 000
24 000
25 000
26 000
27 000
NO
K/t
onne
LME 3m USD LME 3m NOK
Aluminium price
-60%
+80%
-48%
+50%
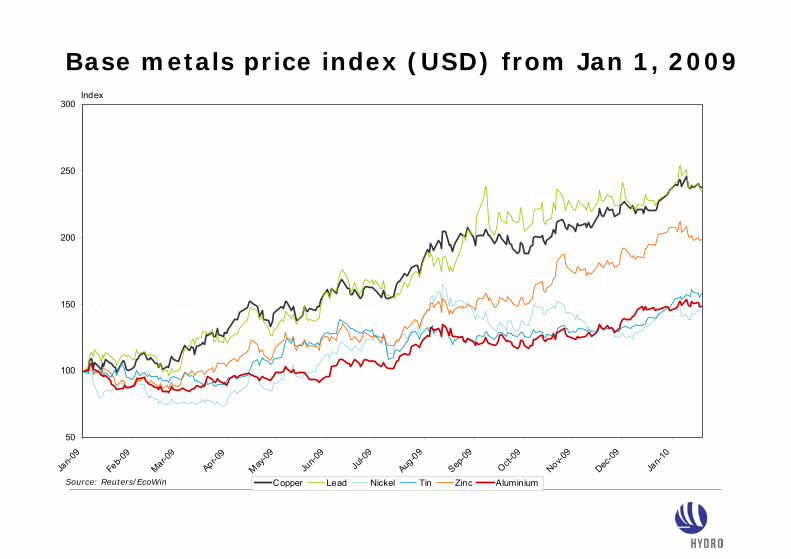
Base metals price index (USD) from Jan 1, 2009
Source: Reuters/EcoWin
50
100
150
200
250
300
Jan-0
9
Feb-0
9
Mar-09
Apr-09
May-09
Jun-0
9
Jul-0
9
Aug-09
Sep-09
Oct-09
Nov-09
Dec-09
Jan-1
0
Index
Copper Lead Nickel Tin Zinc Aluminium
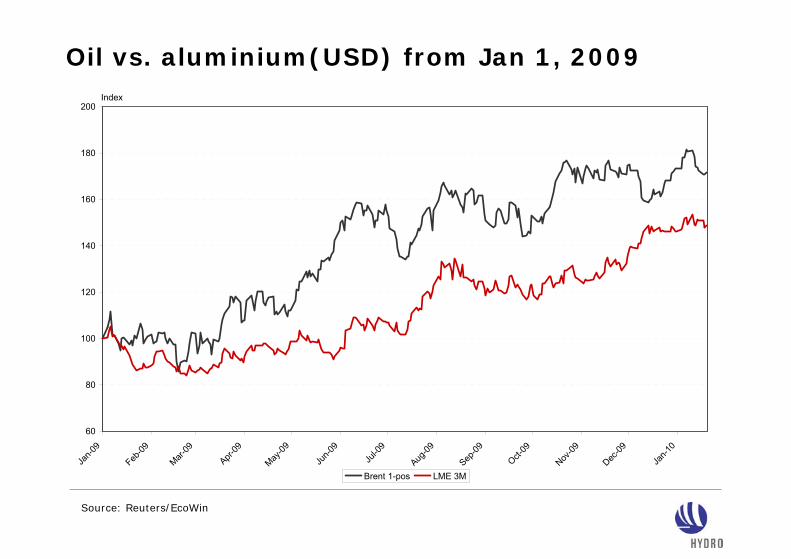
Oil vs. aluminium(USD) from Jan 1, 2009
Source: Reuters/EcoWin
60
80
100
120
140
160
180
200
Jan-0
9
Feb-09
Mar-09
Apr-09
May-09
Jun-0
9
Jul-0
9
Aug-09
Sep-09
Oct-09
Nov-09
Dec-09
Jan-1
0
Index
Brent 1-pos LME 3M
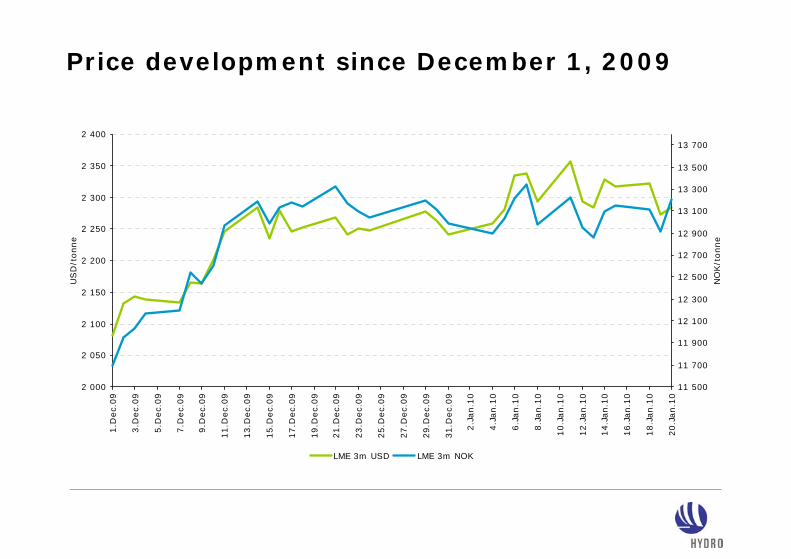
2 000
2 050
2 100
2 150
2 200
2 250
2 300
2 350
2 400
1.D
ec.
09
3.D
ec.
09
5.D
ec.
09
7.D
ec.
09
9.D
ec.
09
11.D
ec.
09
13.D
ec.
09
15.D
ec.
09
17.D
ec.
09
19.D
ec.
09
21.D
ec.
09
23.D
ec.
09
25.D
ec.
09
27.D
ec.
09
29.D
ec.
09
31.D
ec.
09
2.J
an.1
0
4.J
an.1
0
6.J
an.1
0
8.J
an.1
0
10.J
an.1
0
12.J
an.1
0
14.J
an.1
0
16.J
an.1
0
18.J
an.1
0
20.J
an.1
0
US
D/t
onne
11 500
11 700
11 900
12 100
12 300
12 500
12 700
12 900
13 100
13 300
13 500
13 700
NO
K/t
onne
LME 3m USD LME 3m NOK
Price development since December 1, 2009
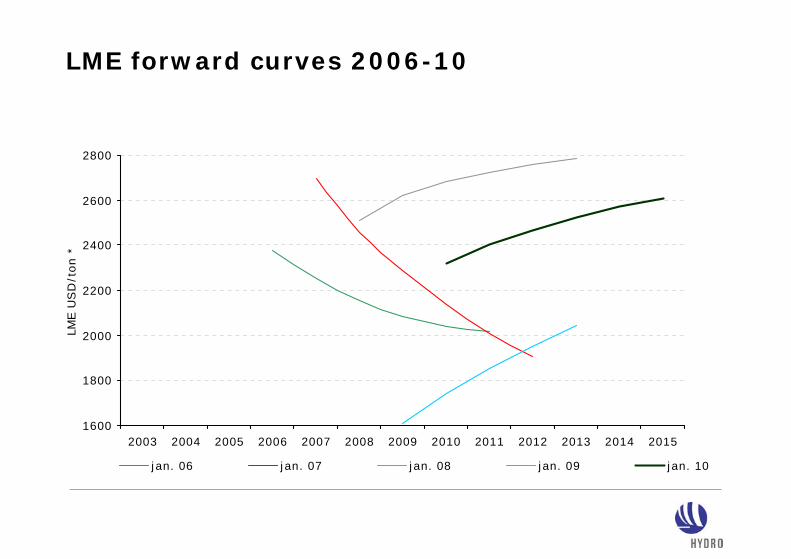
LME forward curves 2006-10
1600
1800
2000
2200
2400
2600
2800
2003 2004 2005 2006 2007 2008 2009 2010 2011 2012 2013 2014 2015
LME U
SD
/ton *
jan. 06 jan. 07 jan. 08 jan. 09 jan. 10

18 000
19 000
20 000
21 000
22 000
23 000
24 000
25 000
26 000
27 000
28 000
nov.
07
des
. 07
jan.
08
feb.
08
mar
. 08
apr.
08
mai
. 08
jun.
08
jul. 0
8
aug.
08
sep.
08
okt
. 08
nov.
08
dec
. 08
jan.
09
feb.
09
mar
. 09
apr.
09
mai
. 09
jun.
09
jul. 0
9
aug.
09
sep.
09
okt
. 09
nov.
09
dec
. 09
jan.
10
kT
Consumption World ex China Production World ex China
Still unbalance, but at a reduced level
Source: CRU
~2.1 mill tons
~2.7 mill tons
Global ex China (annualized)

Source: Reuters/EcoWin
1 000 tonnes
Stock development
0
1 000
2 000
3 000
4 000
5 000
6 000
7 000
Jan.0
8
Feb.0
8
Mar.
08
Apr.
08
May.0
8
Jun.0
8
Jul.08
Aug.0
8
Sep.0
8
Oct
.08
Nov.0
8
Dec.
08
Jan.0
9
Feb.0
9
Mar.
09
Apr.
09
May.0
9
Jun.0
9
Jul.09
Aug.0
9
Sep.0
9
Oct
.09
Nov.0
9
Dec.
09
Jan.1
0
IAI inventories LME inventories

(300)
(200)
(100)
0
100
200
300
400
500
600
700
800
Jan Feb Mar April May June July Aug Sep Oct Nov Dec
LME stocks IAI stocks Japanese Port stocks
Net primary export to China Est. Unreported stocks (CRU) Balance
1 000 tonnes
Sto
ck r
educt
ion/
Net
im
port
Apparent (un)balance demand/production outside China
Sto
ck incr
ease
/
Net
exp
ort

9 000
10 000
11 000
12 000
13 000
14 000
15 000
16 000
17 000
18 000
nov.
07
des
. 07
jan.
08
feb.
08
mar
. 08
apr.
08
mai
. 08
jun.
08
jul. 0
8
aug.
08
sep.
08
okt
. 08
nov.
08
dec
. 08
jan.
09
feb.
09
mar
. 09
apr.
09
mai
. 09
jun.
09
jul. 0
9
aug.
09
sep.
09
okt
. 09
nov.
09
dec
. 09
annualis
ed k
T p
er
month
China Consumption China Production
Chinese production at all-time high
China (annualised per month)
Source: CRU
…and increasing

LME and Shanghai* aluminium price
1 000
1 500
2 000
2 500
3 000
3 500Ja
n.0
7
Mar.
07
May.0
7
Jul.07
Sep.0
7
Nov.0
7
Jan.0
8
Mar.
08
May.0
8
Jul.08
Sep.0
8
Nov.0
8
Jan.0
9
Mar.
09
May.0
9
Jul.09
Sep.0
9
Nov.0
9
Jan.1
0
USD/t
SHFE 3M (*incl VAT) LME 3M

Arbitrage LME vs Shanghai aluminium price
Source: Reuters/EcoWin
3 M Prices
0
100
200
300
400
500
600
700
800
Jan-0
9
Feb-09
Mar-09
Apr-09
May-09
Jun-0
9
Jul-0
9
Aug-09
Sep-09
Oct-09
Nov-09
Dec-09
Jan-1
0
USD/mt
Difference SHFE - LME 17% VAT (LME) Freight (30 USD/t)

(350)(300)(250)(200)(150)(100)(50)
050
100
150200250300350400450500550600
Primary / alloyed Semis Fabricated Scrap Total
China: swift response to market conditions and prices Limited imports of primary metal likely in 2010
• Production curtailments
• Strategic government purchases –lifted inland prices, import became profitable
• Government incentives increased demand in 2009
• Production increase in 2009/2010• Restart of curtailed capacity• New capacity being built
• Imports of primary aluminium expected to stay low, but also primary exports to be limited
Source: Hydro / Antaike Jaunary 2010
1 000 tonnes
Net
im
port
Net
exp
ort
2006 2007 2008 2009

New production from green and brownfieldprojects under construction is coming on stream
0
500
1 000
1 500
2 000
2 500
3 000
3 500
2010 2011 2012 2013
Accumulated new capacity World ex China, 1 000 tonnes
Source: Hydro S&BD , Analysis 2009
Qatalum
• 600 kT
Emal
• 700 kT
India
• ~ 1500 kT
• In addition we assume 300 ktunspecified creep by 2010, and 400 kt in 2011

Industry cost came down from 2008 to 2009, currently the cost curve is moving up
Curtailed capacity
Source: CRU, BOC 2008: LME 2834 USD/tonne, USDNOK 5,16BOC 2009: LME 1940 USD/tonne, USDNOK 5,64
0
400
800
1 200
1 600
2 000
2 400
2 800
3 200
3 600
0 4000 8000 12000 16000 20000 24000 28000Accumulated capacity World ex China (1000 t)
Bus
ines
s O
pera
ting
cost
(US
D/t)
BOC 2008 BOC 2009
Cost curve is currently moving up from 2009 levels as LME drives alumina price up. Energy and other raw materials may follow

18 000
19 000
20 000
21 000
22 000
23 000
24 000
25 000
26 000
27 000
28 000
2006 2007 2008 2009 2010 2011
Production New capacity Demand
2010 balance – same view as shown at CMD World outside China
Source: CRU / Hydro
8%
8%
Primary export
Stock increase
Net curtailments
1 000 tonnes
2009 imbalance handled by:
2010 imbalance “handling” options:
• Consumption upside (GDP, pipeline)• Increased primary demand due to
increased scrap export to China• Stock increase• New curtailments

Demand estimates world excluding China
5 %22.521.4Alcoa – 4Q presentation
9 %22.320.4CRU – January Quarterly
%Demand 2010 million tonnes
Demand 2009 million tonnes
World outside China

Strong LME price in spite of sustained over production
• High inventory levels • Availability of capital at low interest rates• A stable contango has financed stocks that are “locked in” until Q2/Q3 2010
• Strong inflow of investment money – No producers selling
• Physical ingot premiums still elevated – Rusal continuing warehousing deals
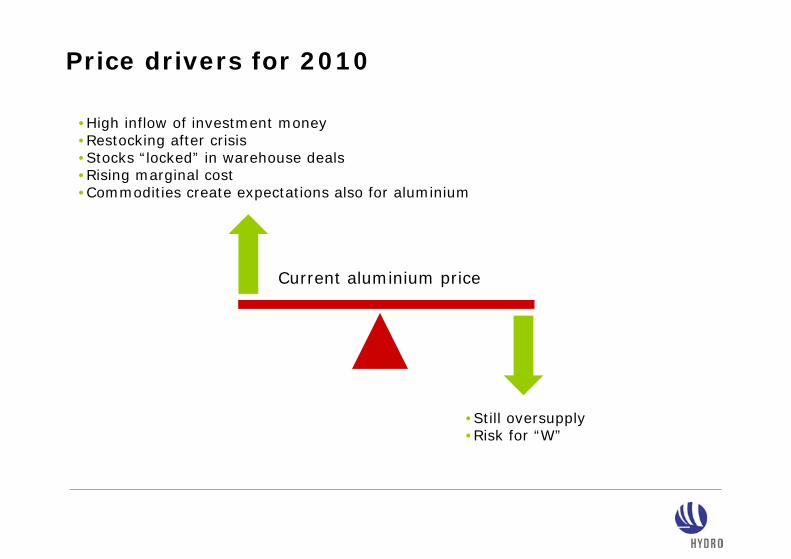
Price drivers for 2010
Current aluminium price
•Still oversupply•Risk for “W”
•High inflow of investment money•Restocking after crisis•Stocks “locked” in warehouse deals •Rising marginal cost•Commodities create expectations also for aluminium

Qatalum project
Tom Røtjer, Executive Vice President and Head of Projetcs

Qatalum location
Mesaieed Industrial City

● Qafco 1 in 1973 ● Qafco 2 in 1979● Qafco 3 in 1997● Qafco 4 in 2004
Hydro history in Qatar
● Qatar Vinyl Company in 2001

Qatalum a 50/50 joint-venture company
Power plant and smelter
Joint venture agreement
Technology and competence
Metal marketing & off-take
Project management
50% 50%
Gas supply
Industrial climate
Site
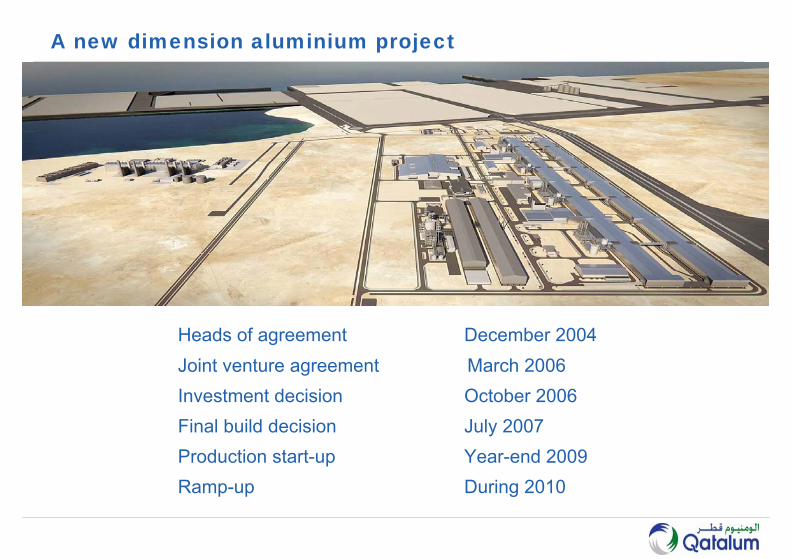
Heads of agreement December 2004Joint venture agreement March 2006Investment decision October 2006Final build decision July 2007Production start-up Year-end 2009Ramp-up During 2010
A new dimension aluminium project

• Hydro technology used in Sunndal, further developed for Qatalum• Project execution, start-up and operations experience implemented
in Qatalum • Personnel with experience from Sunndal key in Qatalum project
Key reference project - Sunndal 4

Power Plant
Cast house
Anode plant
Pot rooms
Port
Qatalum project scope
Silos
Construction Village
10.000 people

Anode Service PlantKempe
Power PlantGeneral Electrics
Service Areas & Potroom BuildingSNC - Lavalin
Construction CampSaudi Arabian Trading & Construction Co.
PotshellAhmed Mansoor Anode Superstructure
Great Wall China
Power PlantDoosan
Pot Tending MachineNKM Noell
BusbarsSalztburger Al.
CasthouseFATA/ K-HomeAnode Baking PlantFATA/ K-Home
HAL3000 Pot Control SystemABB
Paste PlantSolios
FTP & Dist. SystemsSolios
Recitifier PlantABB
Installation Reduction Celland Potroom EquipmentDutco McConnell Dowell
Global procurement
21 Contracts
9 GCC, 2 North America, 7 Europe, 2 Asia, 1 Australia

2007-2008 ”Crunch time”
for project execution in the Gulf area


First site office February 07 Hail storm March 07

Qatalum site September 2007

10 million tonnes of landfill=200.000 truckloadsTotal driving distance ~20 million km1500 truck loads pr day

June 2008 - piling

June 2008 - 7200 people on site and INCREASING

17 000 workers on site – January 2009

Construction village

Construction Village for 10 000 people

Health, Safety & Environment – December 2009
Qatalum HSE statistics Construction hours
0,0
1,0
2,0
3,0
4,0
5,0
HRI rate 1,4 1,2 1,0 1,1 0,9 1,2 1,0 0,8 1,0 1,0 1,0 1,0 1,0 1,0 1,1 1,0 1,0 0,9 1,0 1,1 1,0 1,0 1,1 1,1 1,2
TRI rate 3,2 4,0 3,3 3,1 2,7 2,4 2,9 2,7 3,4 3,2 3,0 2,9 2,9 2,9 3,0 3,1 3,1 3,0 3,0 3,0 3,0 3,0 2,9 3,0 3,0
LTI rate 1,4 2,4 2,0 1,9 1,5 1,4 1,1 1,0 0,8 0,7 0,6 0,6 0,5 0,5 0,5 0,5 0,5 0,4 0,5 0,4 0,4 0,4 0,4 0,4 0,4
LTI-KPI 2 2 2 2 2 2 2 2 2 2 2 2 2 2 2 2 2 2 2 2 2 2 2 2 2
des-07
jan-08
feb-08
mar-08
apr-08
mai-08
jun-08
jul-08
aug-08
sep-08
okt-08
nov-08
des-08
jan-09
feb-09
mar-09
apr-09
mai-09
jun-09
jul-09
aug-09
sep-09
okt-09
nov-09
des-09
Total Project Number of LTI Medical Treatment * Working hours LTI-rate* TRI-rate* High Risk Total No. Cases RWC (Constr. hours) Incidents of HSE
NH Contr. NH Contr. NH Contr. NH Contr. Total NH Contr. Total ObservationsPeriod 0 1 0 5 1 18 912 3 216 293 0 0,3 0,3 0 2,2 2,2 4 4161Accum 0 32 0 139 64 390 042 79 057 222 0 0,4 0,4 0 3,0 3,0 84 66688
Last 12 months Number of LTI Medical Treatment * Working hours LTI-rate* TRI-rate* High Risk Total No. Cases RWC (Constr. hours) Incidents of HSE
NH Contr. NH Contr. NH Contr. NH Contr. Total NH Contr. Total ObservationsPeriod 0 1 0 5 1 18 912 3 216 293 0 0,3 0,3 0 2,2 2,2 4 4161Accum 0 19 0 89 52 241 672 52 972 847 0 0,4 0,4 0 3,0 3,0 61 52713
*Man-hours from NKM Noell and Solios Carbone have not been included as the report has not yet been submitted

No. of cranes related to no. of observations
215 14
33 28
61
37
61 6449
2639
3138
47
30 36
19 187 36
20
82
148
215 216
235
266
248233 230
215
182
0
50
100
150
200
250
300
2008 0
1200
8 0220
08 03
2008 0
420
08 05
2008 0
6200
8 07
2008
0820
08 09
2008 1
020
08 11
2008 1
2200
9 0120
09 02
2009 0
320
09 04
2009 0
5200
9 06
2009
0720
09 08
2009 0
9Number ofMajor/Critical orMedium/Seriouscrane related obs.
No of cranes

December 7, 2009 Halfway there... Pot room installation
Overall progress by end December 2009: 95%

Qatalum completion : some 400.000 tags
THE HYDRO WAY !!!!!!!!!!
Qatalum completion : some 400.000 tags
THE HYDRO WAY !!!!!!!!!!

2009-10-26


2009-10-13 potroom building and fume treatment plant

2009-10-26

Carbon - Baking Furnace Tending Assembly
Anode Baking furnace production:
340 000 anodes per year.
Paste Plant capacity 60 tonnes/hour of green anodes

2009-10-26

2009-12-14 Silos with conveyor belt

2009-09-27

Start-up Potline 2 - December 16, 2009

Qatalum power plant
EPC- Contractor: GE / DoosanEPC value: appr. 900 musdPower production Cap: 1350 MWGrid Connection: 250 MWSite: 252.000 m2

Fuel Gas
Aluminium Plant 220kV GIS
Rectifiers220kV Distribution
Qatalum Power Plant Open Cycle OperationQP
GTGen ~
GTGen ~
GTGen ~
GTGen ~ 219 MW
219 MW
219 MW
219 MW
400kV Grid Connection
250 MW

QP
Fuel Gas
Aluminium Plant 220kV GIS
Rectifiers220kV Distribution
Combined Cycle Operation
GTGen ~
GTGen ~
GTGen ~
GTGen ~
400kV Grid Connection
250 MW
HRSG
HRSG
HRSG
~HP LP Gen
Condr
Steam Turbine 1
~HP LP Gen
Condr
Fume Treatment(6165 m3/hr)
SW Make-Up (8025 m3/hr)
Steam Turbine 2
Cooling Water System
Power Plant OutputMax Power: ~ 1350 MWPower in (n-1) ~ 1100 MWPower in (n-2) ~ 800 MW
HRSG
SW Circ(88 000 m3/hr)

Power plant 2009-10-26

Power plant

Power plant

Qatar newspapers October 5, 2009

Key project success factors
● Well-defined concept at time of decision● Successful contract strategy and selection of contractors● Interface management● Sound risk management● Active stakeholder management● Strong HSE ambitions● Project completion – “The Hydro Way”

Site canteen

Jan Arve Haugan, CEO Qatalum
Qatalum operations

Qatalum
Committed to deliver…

Qatalum Operations- January 26, 2010
Background
Organization development
Start up of Operations
Ramp up plan
Qatalum going forward

Qatalum - Background

Qatalum- A 50/50 Joint Venture

Heads of agreement December 2004Joint venture agreement March 2006Investment decision October 2006Final build decision July 2007Production start-up Year- end 2009Ramp-up During 2010
A new dimension aluminium project


Qatalum

Qatalum

Qatalum


Power Plant
Cast house
Anode plant
Pot rooms
Port
Qatalum project scope
Silos
Construction Camp
10.000 people


Qatalum organization
Deputy CEOHassan Al-Rashid
HR & AdmAhmed Al-Kuwari
Internal Auditor
HSE Manager
CFOOlaf Meissner
CarbonAndrew Robbins
ReductionRoald Holten
CasthousePål Vigeland
TechnicalKurt Nilsson
PowerSteve Davison
CEOJan Arve Haugan

Anode Service PlantKempe
Power PlantGeneral Electrics
Service Areas & Potroom BuildingSNC - Lavalin
Construction CampSaudi Arabian Trading & Construction Co.
PotshellAhmed Mansoor Anode Superstructure
Great Wall China
Power PlantDoosan
Pot Tending MachineNKM Noell
BusbarsSalztburger Al.
CasthouseFATA/ K-HomeAnode Baking PlantFATA/ K-Home
HAL3000 Pot Control SystemABB
Paste PlantSolios
FTP & Dist. SystemsSolios
Recitifier PlantABB
Installation Reduction Celland Potroom EquipmentDutco McConnell Dowell
Global Procurement
21 Contracts9 GCC, 2 North America, 7 Europe, 2 Asia, 1 Australia

1
18
1
1
1
1
1
1
26
5
69
6
61
21
1
1
1
3
1
92
1
201
328
45
5
8
74
1
12
4
2
9
Qatalum’s Global Family

Mobilization Progress
Recruitment Plan Vs Actual
0
200
400
600
800
1000
1200
1400
May-07
Jul-0
7Sep
-07Nov
-07Ja
n-08
Mar-08
May-08
Jul-0
8Sep
-08Nov
-08Ja
n-09
Mar-09
May-09
Jul-0
9Sep
-09Nov
-09Ja
n-10
Mar-10
May-10
Jul-1
0Sep
-10Nov
-10
Date of Employment
No
of E
mpl
oyee
s Recruitment in Progress
Employees Identified
Planned

Our governing documents
Qatalum directives• Code of conduct• Corporate social
responsibility• Etc.
Qatalum policies• Duty visits• Accounting• Etc.
Our Strategic
focus areas
Operational excellence• Entire value chain• Continuous improvement
Environmental integrity• Life-cycle view• Operating philosophy• Communications
Value for Qatar• People development• Industrial relations
Mission, Values, Strategies and Governing Documents
The Qatalum Way
Mission
Values
Strategies
Governing documents
Work processes, roles and relations
Value based management
Qatalum principles

The Qatalum Values Our performance criteria
Beliefs that differentiate and
focus our performance
Our Values
EthicsRelationships, Teamwork, Communication
RespectWe work in an open, cooperative way.
DriveEfficiency, Innovation
ProactiveWe are driven to meet optimum standard while always seeking improvement.
AbilityCompetence, Reliability
TrustworthyWe always keep our word and ensure the job gets done right.
AttitudeMotivation, Seeing big picture
EnthusiasticWe have a positive attitude toward our jobs and each other.

TechnicalBasic Course
Cast houseBasic Course
ReductionBasic Course
CarbonBasic Course
Power PlantBasic Course
Employee training according to role descriptionThe period covers Process training, Supplier training and Special courses
2 days
1-3 days
3-6 weeks
4 days
Special coursesEnglish HSE Energy control Work permit Car certificate SAP-MM
Truck certificate SOP alignment APICS Train the trainer
Vehicle certif. Crane certificate SAP PM SAP-HR SAP FICO1-5 days
Qatalum Basic Course(Introduction, Qatalum Way, HSE, SOPs, Aluminium, Qatalum Plant)
Leadership Course (Supervisors/experts)(Leadership, HSE, communication, cultural understanding, Qatalum Way
Process training – alignment to Q SOPs)
= Operator training
= Supervisor/staff training
A Comprehensive Training Program

Growing international media interest with high level visits
October 2009

October 26, 2009, the first pitch vessel arrived at Qatalum’s inbound dock

Anode Handling and Storage

Rodding Anodes

Dry out of Anode Baking Furnace at December 31, 2009

Qatalum Project and Management

Potline -1 Team ready for Start up

PTM Cranes at Potline 1


CasthouseCast house – Furnace

First Foundry Alloy December 04, 2009

Foundry Alloy ready for market

First Export of Foundry Alloys – December 18, 2009First Export of Foundry AlloysQatar National Day, December 18, 2009

First Extrusion Ingot January 22, 2010

Raw Material storage at Harbour Area
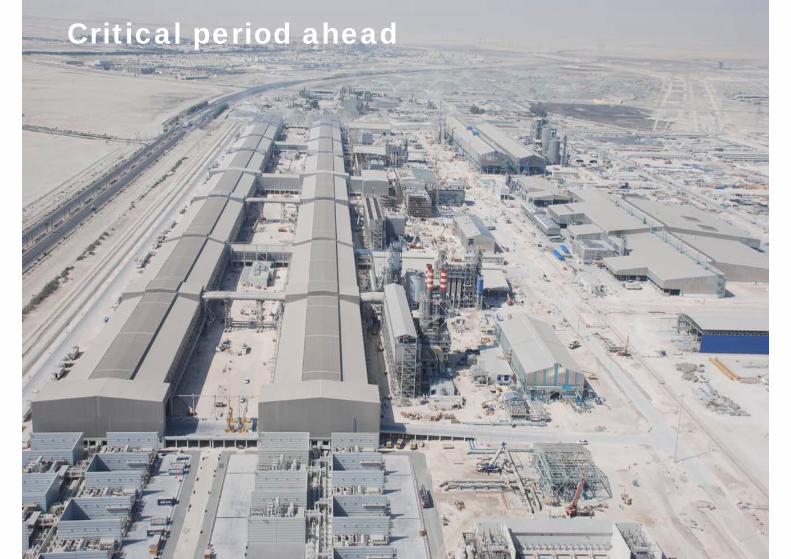
Critical period ahead

Qatalum – competitive cost position
0
400
800
1,200
1,600
2,000
2,400
2,800
3,200
3,600
0 4000 8000 12000 16000 20000 24000 28000
BOC 2008 BOC 2009
Curtailed capacity
Accumulated capacity World ex China (1000 t)
Business Operating cost (USD/t)
2009 2010 2011 2012 2013
Source: CRU, BOC 2008: LME 2834 USD/ton, USDNOK 5,16BOC 2009: LME 1594 USD/ton, USDNOK 6,53

Qatarisation
Established 5 years intake plan
Agreement with Qatar University
Professorship at QU"Aluminum Production Technology"
Relationship with the high schools in Al-Wakrah
Recruit 35 technicians from different disciplines through QP’s corporate training center
Direct recruitment and training of 10 tapping vehicle operators/drivers for the Reduction Dept.
Intake of Technicians/Operators through QP Training Center
Head of Qatarization
Training & Development Supervisor
Recruitment Supervisor(Qatarization)
Qatalum
Deliver as committed

www.hydro.com