qaiqc guidance for sampling and analysis
TRANSCRIPT


QAIQC GUIDANCE FOR SAMPLING AND ANALYSISOF SEDIMENTS, WATER, AND TISSUES
FOR DREDGED MATERIAL EVALUATIONS
CHEMICAL EVALUATIONS
Prepared by
ENVIRONMENTAL PROTECTION AGENCYOffIce of Water
Washington, D.C.
and .
DEPARTMENT OF THE ARMYUnited States Army Corps of Engineers
Washington, D.C.
April 1995

The polices set out in this document are not final agency action, but are intendedsolely as guidance. They are not intended, nor can they be relied upon, to create anyrights enforceable by any patiy in litigation with the United States. EPA officials maydecide to follow the guidance provided in this document, or to act at variance with theguidance, based on an analysis of specific site circumstances. The Agency alsoreserves the right to change this guidance at any time without public notice.
ii
$’%22$ UNITED STATES ENVIRONMENTAL PROTECTION AGENCYSw:
i!yWASHINGTON, D.C. 20460
J41 PRO*
EPA 823-B-95-001
Dear
APR 28
Colleagues:
The U.S. Environmental Protectiontransmit a CODY of the document titled
OFFICEOFWATER
Agency (EPA) is pleased toQA/QC Guidance for
Sampling and %alysis of Sediments, Wat&;”and Tissues forDredged Material Evaluations. Chemical Evaluations. Thisdocument was prepared in response to regional requests forquality assurance/quality control (QA/QC) guidance associatedwith the testing and evaluation of proposed dredged materialdischarges into inland or ocean waters. The workgroup thatdeveloped this national guidance was comprised of individualsfrom headquarters, field offices, and research laboratories ofEPA and the U.S. Army Corps of Engineers (USACE) with experiencerelated to dredged material discharge activities.
EPA and USACE technical guidance for evaluating thepotential for contaminant-related impacts associated with thedischarge of dredged material into inland and ocean waters,respectively, is found in the documents “Evaluation of DredgedMaterial Proposed for Discharge in Waters of the U.S.J17estingManual (Draft)” (the Inland TestingManual) (U.S. EPA and USACE1994), and “Evaluation of Dredged Material Proposed for OceanDisposall?esting Manual” (the Ocean Testing Manual) (U.S. EPA andUSACE 1991). Results of tests conducted using the testingmanuals are the basis of independent evaluations made by EPA andUSACE regarding the suitability of proposed dredged material foraquatic disposal.
This QA/QC guidance document serves as a companion documentto the Inland and Ocean Testing manuals. The purpose of thisdocument is as follows: 1) to provide guidance on thedevelopment of quality assurance project plans for ensuring thereliability of data gathered to evaluate dredged materialproposed for discharge under the Clean Water Act or the MarineProtection Research and Sanctuaries Act, 2) to outline proceduresthat should be followed when sampling and analyzing sediments,water, and tissues, and 3) to provide recommended targetdetection limits for chemicals of concern. This documentpertains largely to physical and chemical evaluations. Though itis directed primarily toward the evaluation of dredged materialfor aquatic disposal, it may be useful in other areas of dredgedmaterial assessment and management as well (e.g., disposal sitemonitoring or evaluation of alternative disposal options). Theaudience for this document is Federal and State agency personneland public with an interest in the evaluation and management of
@ RecyclediFlecycleble
%(9PrlnledMllsoy/canola Inkonpaperthm
caUahstileam50%mcyd6dtlbw

2
dredged material. The information provided herein is for thepurpose of guidance only and does not constitute a regulatoryrequirement.
Requests for copies of this document (EPA document numberEPA 823-B-95-001) should be sent to U.S. Environmental ProtectionAgency, National Center for Environmental Publications andInformation, 11029 Kenwood Road, Building 5, Cincinnati, Ohio45242.
We appreciate your continued interest in EPA’s activitiesrelated to impact assessment of potentially contaminatedsediments.
Sincerely,
MJ& IRobert H. Wayland III
Director DirectorOffice of Science Office of Wetlands,
and Technology Oceans and Watersheds
Enclosure
QA/QC GUIDANCE FOR SAMPLING AND ANALYSISOF SEDIMENTS, WATER, AND TISSUES
FOR DREDGED MATERIAL EVALUATIONS
CHEMICAL EVALUATIONS
OfficeofWaterOffIceofScienceandTechnology
StandardsandAppliedScienceDivisionU.S.EnvironmentalProtectionAgency
Washington,DC 20460
April1995
The polices set out in this document are not final agency action, but are intendedsolely as guidance. They are not intended, nor can they be relied upon, to create anyrights enforceable by any party in litigation with the United States. EPA officials maydecide to follow the guidance provided in this document, or to act at variance with theguidance, based on an analysis of specific site circumstances. The Agency alsoreserves the right to change this guidance at any time without public notice.
ii

CONTENTS
LIST OF FIGURES
LIST OF TABLES
ACRONYMS AND ABBREVIATIONS
ACKNOWLEDGMENTS
1. INTRODUCTION
1.1 GOVERNMENT (DATA USER) PROGRAM
1.2 CONTRACTOR (DATA GENERATOR) PROGRAM
2. DRAFTING A QUALITY ASSURANCE PROJECT PLAN
2.1 INTRODUCTORY MATERIAL
2.2 QUALITY ASSURANCE ORGANIZATION ANDRESPONSIBILITIES
2.2.1 Staffing for Quality Assurance2.2.2 Statements of Work
2.3 QUALITY ASSURANCE OBJECTIVES
2.3.1 Program vs. Project Objectives2.3.2 Target Detection Limits for Chemicals
2.4 STANDARD OPERATING PROCEDURES
2.5 SAMPLING STRATEGY AND PROCEDURES
2.5.1 Review of Dredging Plan2.5.2 Site Background and Existing Database2.5.3 Subdivision of Dredging Area2.5.4 Sample Location and Collection Frequency2.5.5 Sample Designation System2.5.6 Station Positioning
!2!9!?
vii
ix
xi
...X111
1
3
3
6
6
7
78
14
1415
16
36
394042424647
...///
2.5.7 Sample Collection Methods2.5.8 Sample Handling, Preservation, and Storage2.5.9 Logistical Considerations and Safety Precautions
2.6 SAMPLE CUSTODY
2.6.1 Sample Custody and Documentation2.6.2 Storage and Disposal of Samples
2.7 CALIBRATION PROCEDURES AND FREQUENCY
2.7.1 Calibration Frequency2.7.2 Number of Calibration Standards2.7.3 Calibration Acceptance Criteria
2.8 ANALYTICAL PROCEDURES
2.8.1 Physical Analysis of Sediment2.8.2 Chemical Analysis of Sediment2.8.3 Chemical Analysis of Water2.8.4 Chemical Analysis of Tissue
2.9 DATA VALIDATION, REDUCTION, AND REPORTING
2.9.1 Data Validation2.9.2 Data Reduction and Reporting
2.10 INTERNAL QUALITY CONTROL CHECKS
2.10.1 Priority and Frequency of Quality Control Checks2.10.2 Specifying Quality Control Limits2.10.3 Quality Control Considerations for Physical Analysis
of Sediments2.10.4 Quality Control Considerations for Chemical Analysis of
Sediments2.10.5 Quality Control Considerations for Chemical Analysis of
Water2.10.6 Quality Control Considerations for Chemical Analysis of
505359
60
6064
64
656869
70
70717883
87
8891
91
9396
99
99
100
Tissue 100
iv

2.11
2,12
2.13
2.14
2.15
2.16
2.17
PERFORMANCE AND SYSTEM AUDITS
2.11.1 Procedures for Pre-Award Inspections of Laboratories2.11.2 lnterlaboratory Comparisons2.11.3 Routine System Audits
FACILITIES
PREVENTIVE MAINTENANCE
CALCULATION OF DATA QUALITY INDICATORS
CORRECTIVE ACTIONS
QUALITY ASSURANCE REPORTS TO MANAGEMENT
2.16.1 Preparing Basic Quality Assurance Reports2.16.2 Preparing Detailed Quality Assurance Reports
REFERENCES
3. REFERENCES
4, GLOSSARY
APPENDIX A -
APPENDIX B -
APPENDIX C -
APPENDIX D -
APPENDIX E -
APPENDIX F -
APPENDIX G -
APPENDIX H -
101
101102104
104
105
105
107
108
108109
110
111
123
Example QA/QC Checklists, Forms, and Records
Example Statement of Work for the Laboratory
Description of Calibration, Quality Control Checks,and Widely Used Analytical Methods
Standard Operating Procedures
EPA Priority Pollutants and Additional Hazardous SubstanceList Compounds
Example Quality Assurance Reports
Analytical/Environmental Laboratory AuditStandard Operating Procedure
Format for the Sediment Testing Report
v

‘
LIST OF FIGURES
Figure 1. Guidance for data assessment and screeningfor data quality 92
vii
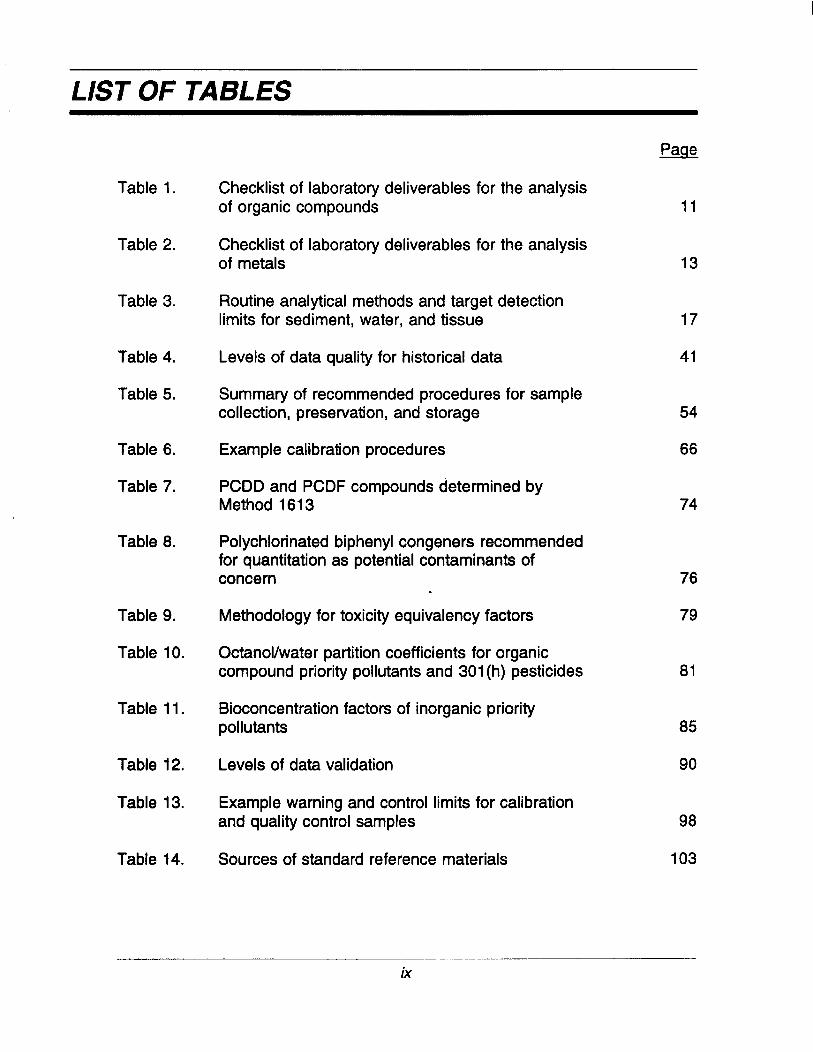
LIST OF TABLES
Table 1.
Table 2.
Table 3.
Table 4.
Table 5.
Table 6.
Table 7.
Table 8.
Table 9.
Table 10.
Table 11.
Table 12.
Table 13.
Table 14.
Checklist of laboratory deliverables for the analysisof organic compounds
Checklist of laboratory deliverables for the analysisof metals
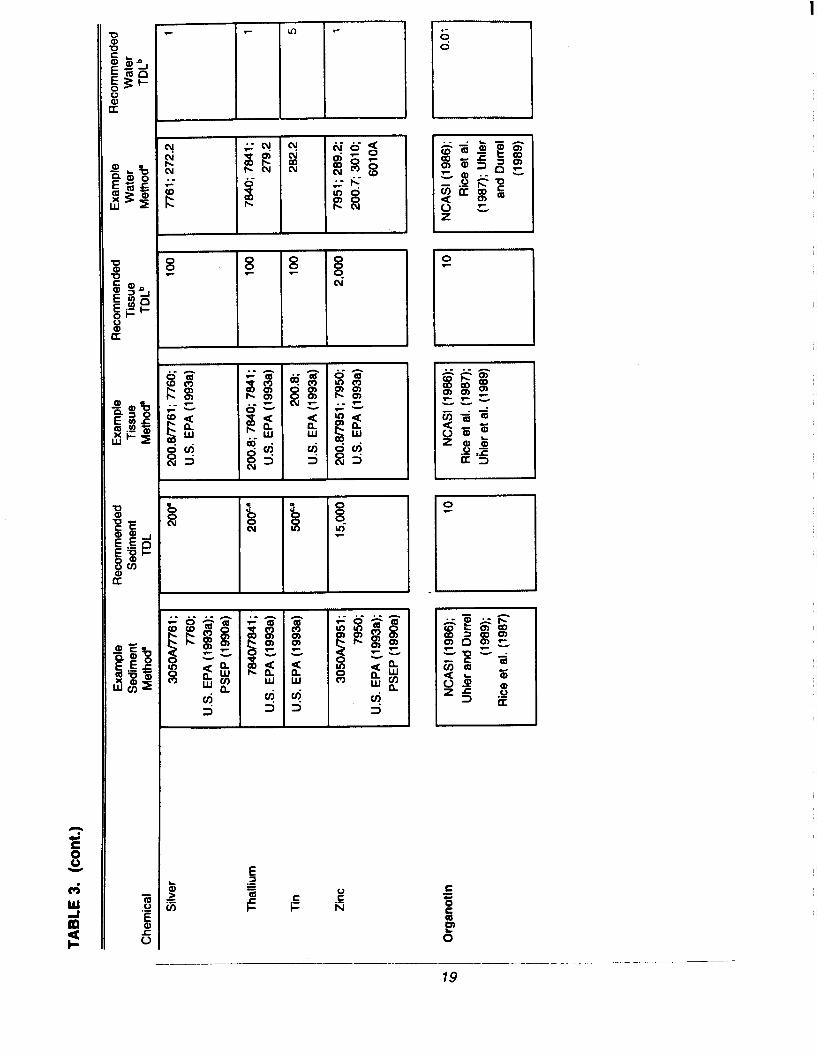
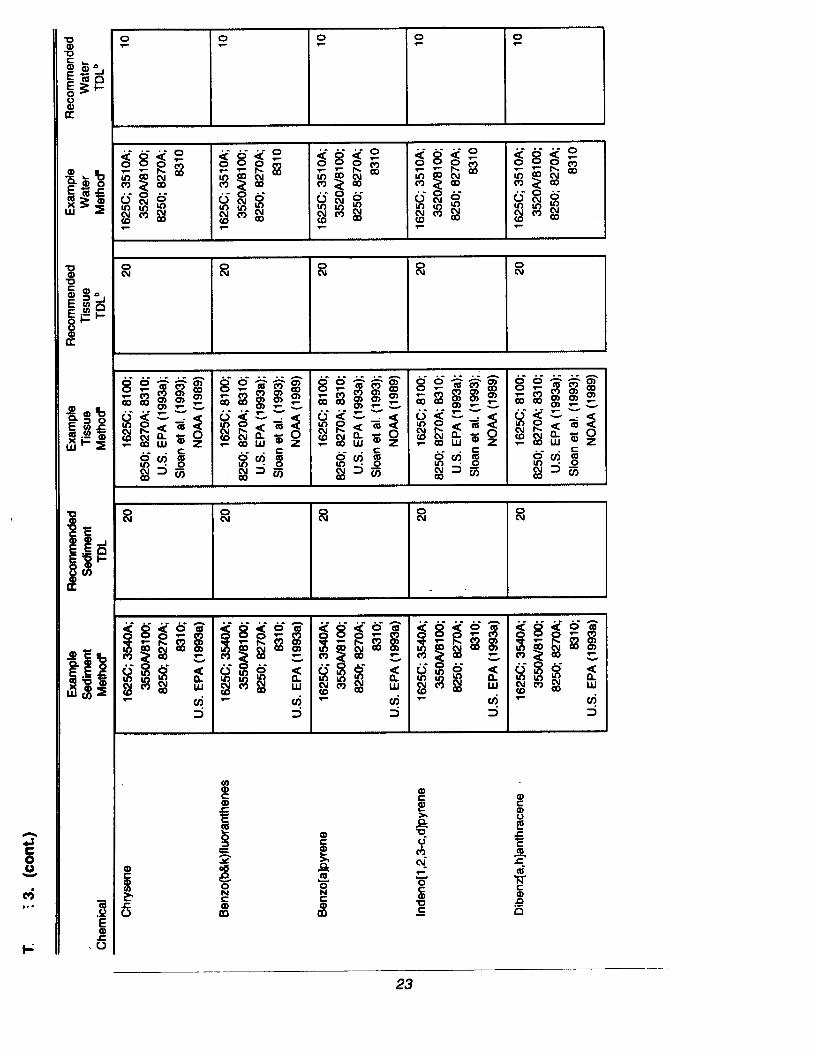
Routine analytical methods and target detectionlimits for sediment, water, and tissue
Levels of data quality for historical data
Summary of recommended procedures for samplecollection, preservation, and storage
Example calibration procedures
PCDD and PCDF compounds determined byMethod 1613
Polychlorinated biphenyl congeners recommendedfor quantitation as potential contaminants ofconcern
Methodology for toxicity equivalency factors
Octanol/water partition coefficients for organiccompound priority pollutants and 301 (h) pesticides
Bioconcentration factors of inorganic prioritypollutants
Levels of data validation
Example warning and control limits for calibrationand quality control samples
Sources of standard reference materials
11
13
17
41
54
66
74
76
79
81
85
90
98
103
ix

ACRONYMS AND ABBREVIATIONS
AVSBCFCLPCVAACWAEPAGCGCIECDGCIMSGFAAICP
MPRSAPAHPCBPCDDPCDFQAMPQAPPQ/VQCSRMTCDDTDLTEFTOCUSACE
acid volatile sulfidebioconcentration factorContract Laboratory Programcold vapor atomic absorption spectrometryClean Water ActUS. Environmental Protection Agencygas chromatographygas chromatography/electron capture detectiongas chromatography/mass spectrometrygraphite furnace atomic absorption spectrometyinductively coupled plasma-atomic emissionspectrometryMarine Pollution, Research, and Sanctuaries Actpolycyclic aromatic hydrocarbonpolychlorinated biphenylpolychlorinated dibenzo-p-dioxinpolychlorinated dibenzofuranquality assurance management planquality assurance project planquality assurance and quality controlstandard reference materialtetrachlorodibenzo-p-dioxintarget detection limittoxicity equivalency factortotal organic carbonU.S. Army Corps of Engineers
xi

ACKNOWLEDGMENTS
The contributions made by many individuals are gratefully acknowledged. Thework group was comprised of individuals from headquarters, field offices, andresearch laboratories of the U.S. Environmental Protection Agency (EPA) andthe U.S. Army Corps of Engineers (USACE) with experience related to dredgedmaterial discharge activities.
Members: Jim BarronPatricia BooneSuzy Cantor-McKinneyTom ChasePat CotterTom DixonBob EnglerRick FoxCatherine FoxBob GravesDoug JohnsonLloyd KahnLinda KirklandMike KravitzJim LazorchakAlex LechichJohn MalekWilliam MuirRich PruellNorm RubinsteinBrian SchumacherGeorge SchuppAnn StrongWilliam TelliardDave Tomey
EPWOERR (Superfund)EPA/Region 5EPWRegion 6EPA/OWOWEPA/Region 9EPA/QAMSUSACEAMESEPA/GLNPOEPAIRegion 4EPA/EMSL CincinnatiEPA/Region 4EP/VRegion 2EPA/QAMSEPA/OST (CHAIR)EPA/EMSL CincinnatiEPA/Region 2EPA/Region 10EPA/Region 3EPA/ORD-NEPIVORD-NEPA./EMSL Las VegasEPA/Region 5USACE/WESEPA/OSTEPA/Region 1
This manual also benefitted from contributions made by the followingindividuals: Robert Barrick (PTI Environmental Services), John Bourbon (EPARegion 2), Melissa Bowen (Tetra Tech), Alan Brenner (EPA Region 2), PeterChapman (EVS Consultants), James Clausner (USACE WES), John Dorkin(EPA Region 5), Robert Howard (EPA Region 4), Charlie McPherson (TetraTech), Kim Magruder (EVS Consultants), Brian Melzian (EPA ORD-N), BobRunyon (EPA Region 2), Sandra Salazar (EVS Consultants), Jane Sexton (PTIEnvironmental Services), Bruce Woods (EPA Region 10), and Tom Wright(USACE WES).
...X111

1. INTRODUCTION
This document provides programmatic and technical guidance on qualityassurance and quality control (QA/QC) issues related to dredged materialevaluations. The U.S. Army Corps of Engineers (USACE) and U.S.Environmental Protection Agency (EPA) share the Federal responsibility forregulating the discharge of dredged material under two major acts of Congress.The Clean Water Act (CWA) governs discharges of dredged material into“waters of the United States,” including all waters landward of the baseline ofthe territorial sea. The Marine Protection, Research, and Sanctuaries Act(MPRSA) governs the transportation of dredged material seaward of thebaseline (in ocean waters) for the purpose of disposal.
EPA and USACE technical guidance for evaluating the potential forcontaminant-related impacts associated with the discharge of dredged materialinto inland and ocean waters, respectively, is found in the documents“Evaluation of Dredged Material Proposed for Discharge in Waters of theU.S.—Testing Manual (Draft)” (the /n/and Testing Manua/) (U.S. EPA andUSACE 1994), and “Evaluation of Dredged Material Proposed for OceanDisposal—Testing Manual” (the Ocean Testing Manual) (U.S. EPA and USACE1991 ). Results of tests conducted using the testing manuals are the basis ofindependent evaluations made by EPA and USACE regarding the suitability ofproposed dredged material for aquatic disposal.
This Q/VQC guidance document serves ‘as a companion document to the/n/and and Ocean Testing manuals. The purpose of this document is asfollows: 1) to provide guidance on the development of quality assurance projectplans for ensuring the reliability of data gathered to evaluate dredged materialproposed for discharge under the CWA or the MPRSA, 2) to outline proceduresthat should be followed when sampling and analyzing sediments, water, andtissues, and 3) to provide recommended target detection limits (TDLs) forchemicals of concern. This document pertains largely to physical and chemicalevaluations. Though it is directed primarily toward the evaluation of dredgedmaterial for aquatic disposal, it may be useful in other areas of dredgedmaterial assessment and management as well (e.g., disposal site monitoring orevaluation of alternative disposal options).
QA/QC planning is necessary to ensure that the chemical and biological datagenerated during dredged material evaluations meet overall program andspecific project needs. Establishing QA/QC procedures is fundamental tomeeting project data quality criteria and to providing a basis for good decision-making. The EPA has developed a two-tiered quality management structure

that addresses QA concerns at both the organizational level and at thetechnical/project level. QA management plans (known as QAMPs) identify themission and customers of the organization, document specific roles andresponsibilities of top management and employees, outline the structure foreffective communications, and define how measures of effectiveness will beestablished. The quality standards, goals, performance specifications, and theQA/QC activities necessary to achieve them, are incorporated into project-specific QA project plans (known as QAPPs).
QA activities provide a formalized system for evaluating the technical adequacyof sample collection and laboratory analysis activities. These QA activitiesbegin before samples are collected and continue after laboratory analyses arecompleted, requiring ongoing coordination and oversight. The QA programsummarized in this document integrates management and technical practicesinto a single system to provide environmental data that are sufficient,appropriate, and of known and documented quality for dredged materialevaluation.
QA project plans (QAPPs) provide a detailed plan for the activities performed ateach stage of the dredged material evaluation (including appropriate samplingand analysis procedures) and outline project-specific data quality objectives thatshould be achieved for field observations and measurements, physicalanalyses, laboratory chemical analyses, and biological tests. Data qualityobjectives should be defined prior to initiating a project and adhered to for theduration of the project to guarantee acquisition of reliable data. This isaccomplished by integrating quality control (QC) into all facets of the project,including development of the study design, implementation of sample collectionand analysis, and data evaluation. QC is the routine application of proceduresfor determining bias and precision. QC procedures include activities such aspreparation of replicate samples, spiked samples, blanks; calibration andstandardization; and sample custody and recordkeeping. Audits, reviews, andcompilation of complete and thorough documentation are QA activities used toverify compliance with predefine QC procedures. Through periodic reporting,these QA activities provide a means for management to track project progressand milestones, performance of measurement systems, and data quality.
A complete QA/QC effort for a dredged material testing program has two majorcomponents: a QA program implemented by the responsible governmentalagency (the data user), and QC programs implemented by sampling andlaboratory personnel performing the tests (the data generators). QA programsare also implemented by each field contractor and each laboratory. Typically,all field and.laboratory data generators agree to adhere to the QA/QC of thedata user for the contracted project as specified in the project QAPP. USEPA(1987a) provides useful guidance and may be followed on all points that are notin conflict with the guidance in this document. The guidance provided in this
2

document also incorporates information contained in U.S. EPA (1984a, 1991d)and U.S. EPA and USACE (1991, 1994).
1.1 GOVERNMENT (DATA USER) PROGRAM
Because the data generated in a dredged material evaluation are used forregulatory purposes, it is important to have proper QA oversight. The USACE,working in conjunction with the appropriate EPA Region(s), should implement aQA program to ensure that all program elements and testing activities (includingfield and Iaboratoty operations) in the dredged material evaluation comply withthe procedures in the QA project plan or with other specified guidelines for theproduction of environmental data of known quality. This QA guidancedocument was designed with the assistance of programmatic and scientificexpertise from both EPA and USACE. Other qualified sources of QA programmanagement should be contacted as appropriate. Some specific QAconsiderations in contract laboratory selection are discussed by Sturgis (1990)and U.S. EPA (1991 d).
The guidance in this document is intended to assist EPA and USACE dredgedmaterial managers in developing QA project plans to ensure that: 1) the datasubmitted with dredged material permit applications are of high quality,sufficient, and appropriate for determining if dredging and disposal shouldoccur; and 2) the contract laboratories comply with QC specifications of theregulations and guidelines governing dredged material evaluations. Thisincludes the development of an appropriate QA management plan.
1.2 CONTRACTOR (DA TA GENERATOR) PROGRAM
Each office or laboratory participating in a dredged material evaluation isresponsible for using procedures which assure that the accuracy (precision andbias), representativeness, comparability, and completeness of its data areknown and documented. To ensure that this responsibility is met, eachparticipating organization should have a project manager and a written QAmanagement plan that describes, in specific terms, the management approachproposed to assure that each procedure under its direction complies with thecriteria accepted by EPA and USACE. This plan should describe a QA policy,address the contents and application of specific QA project plans, specifytraining requirements, and include other elements recommended by EPA qualityassurance management staff (e.g., management system reviews). All fieldmeasurements, sampling, and analytical components (physical, chemical, andbiological) of the dredged material evaluation should be discussed.
—— —...—
3 ‘--

For the completion of a dredged material testing project, the project manager ofeach participating organization should establish a well-structured QA programthat ensures the following:
Development, implementation, and administration of appropriateQA planning documents for each study
Inclusion of routine QC procedures for assessing data quality in allfield and laboratory standard operating procedures
Performance of sufficiently detailed audits at intervals frequentenough to ensure conformance with approved QA project plansand standard operating procedures
Periodic evaluation of QC procedures to improve the quality of QAproject plans and standard operating procedures
Implementation of appropriate corrective actions in a timelymanner.
The guidance provided in this document is intended to assist the data generatorwith the production of high-quality data in the field and in the laboratory (i.e.,the right type and quality of information is provided to EPA and USACE tomake a decision about the suitability of dredged material for aquatic disposalwith the specified degree of confidence).
4
2. DRAFTING A QUALITY ASSURANCEPROJECT PLAN
A formal strategy should always be developed to obtain sufficient andappropriate data of known quality for a specific dredged material testingprogram. When the sample collection and laboratory analysis effort is small,this strategy may be relatively straightforward. However, when the samplecollection and laboratory analysis effort is significant, the assurance of dataquality may require the formulation of a formal and often quite detailed QAproject plan. The QA project plan is a planning and an operational document.
The QA project plan should be developed by the applicant or contractor foreach dredged material evaluation, in accordance with this document. The QAproject plan provides an overall plan and contains specific guidelines andprocedures for the activities performed at each stage of the dredged materialtesting program, such as dredging site subdivision, sample collection,bioassessment procedures, chemical and physical analyses, data qualitystandards, data analysis, and reporting. In particular, the QA plan addressesrequired QC checks, performance and system audits, QA reports tomanagement, corrective actions, and assessment of data accuracy (precisionand bias)l, representativeness, comparability, and completeness. The planshould address the quantity of data required to allow confident and justifiableconclusions and decisions.
The following information should be included in each QA project plan fordredged material evaluation unless a more abbreviated plan can be justified(see US. EPA 1989a):
■ Introductory material, including title and signature pages, table ofcontents, and project description
■ QA organization and responsibilities (the QA organization shouldbe designed to operate with a degree of independence from thetechnical project organization to ensure appropriate oversight)
1 Historically, “accuracy” and “precision” have often been defined as separate
and distinct terms. In particular, accuracy has often been taken to be only ameasure of how different a value is from the true value (i.e., bias). However, datathat have poor precision (i.e., high variability) may only have low bias on theaverage (i.e., close agreement to the true value). Therefore, recent literature (e.g.,Kirchmer 1988) has defined accuracy as both the precision and bias of the data.This definition of accuracy is used throughout this guidance document.
‘5
QA objectives
Standard Operating Procedures
Sampling strategy and procedures
Sample custody
Calibration procedures and frequency
Analytical procedures
Data validation, reduction, and reporting
Internal QC checks
Petiormance and system audits
Facilities
Preventive maintenance
Calculation of data quality indicators
Corrective actions
QA reports to management
References.
The remaining sections of this document provide more specific information oneach of these items.
2.1 INTRODUCTORY MATERIAL
The following sections should be included at the beginning of every QA projectplan:
■ Title and signature pages
■ Table of contents
■ Project description
■ Cetiification.
The signature page should be signed and dated by those persons responsiblefor approving and implementing the QA project plan. The applicant’s projectmanager’s signature should be included even if other persons are primarilyresponsible for QA activities. The headings in the table of contents shouldmatch the headings in the QA project plan. A list of figures, list of tables, andlist of appendices should be included in the table of contents.
6

The goals and objectives of the study project should be outlined in the projectdescription. The project description should illustrate how the project will bedesigned to obtain the information needed to achieve those goals. Sufficientdetail and information should be included for regulatory agency decision-making.
The QA project plan should include the following certification statement signedby a duly authorized representative of the permittee:
I certify under penalty of law that this document and allattachments were prepared under my direction or supervision.The information submitted is, to the best of my knowledge andbelie( true, accurate, and complete. lam aware there aresignificant penalties for submitting false information, includingthe possibility of fine and imprisonment for knowing violations.
2.2 QUALITY ASSURANCE ORGANIZATION ANDRESPONSIBILITIES
A clear delineation of the QA organization and line of authority is essential forthe development, implementation, and administration of a QA program. Therelationship of the QA personnel to the overall project team and theirresponsibilities for implementing the QA program are identified in this section.In addition, guidance is provided for developing statements of work that addressthe responsibilities of contract laboratories used in the project.
2.2.1 Staffing for Quality Assurance
Organizational charts or tables should be used in the QA project plan todescribe the management structure, personnel responsibilities, and theinteraction among functional units. Each QA task should be fully described andthe responsible individual, their respective telephone number, and theassociated organization named. Names of responsible individuals should beincluded for the sampling team, the analytical laboratory, the data evaluation,QA/QC effort in the laboratory, and the data analysis effort. An example of aQA organization flow diagram is provided in Appendix A.
The project manager has overall responsibility for assuring the quality of datagenerated for a project. In most projects, actual QA activities are performedindependent of the project manager. However, the project manager doesensure the implementation of any corrective actions that are called for duringsampling, analysis, or data assessment. The writing of a QA project plan canusually be accomplished by one person with assistance as needed from
7–

technical specialists for details of methods or QC criteria. One person shouldalso have primary responsibility for coordinating the oversight of all samplingactivities, including completion of all documentation for samples sent to thelaboratory. Coordinating laboratory interactions before and during sampleanalysis is also best performed by one person to avoid confusion. Subsequentinteractions that may be necessary with the laboratory during a QA review ofthe data may involve the persons actually doing the review.
Additional QC tasks and responsibilities during sampling and analysis are oftenassigned to technicians who collect samples, record field data, and operate andmaintain sampling and analytical equipment. These technicians perform anumber of essential day-to-day activities, which include calibrating and servicingequipment, checking field measurements and laboratory results, andimplementing modifications to field or laboratory procedures. These individualsshould have training to perform these functions and follow established protocolsand guidelines for each of these tasks.
Technical staff are responsible for the validity and integrity of the dataproduced. The QA staff should be responsible for ensuring that all personnelperforming tasks related to data quality are appropriately qualified. Records ofqualifications and training of personnel should be kept current for verification byinternal QA personnel or by regulatory agency personnel.
Technical competence and experience of ail contract laboratory staff should bedemonstrated. Staff qualifications should be documented, and training shouldbe provided by the laboratory to encourage staff to attain the highest levels oftechnical competence. Staff turnover can affect the ability of a laboratory toperform a particular analysis. The experience of current staff with projects ofsimilar scope should be assessed during the laboratory selection process.Technical competence and other factors such as the laboratory setup (includingquality and capacity of the available analytical equipment), past experience(e.g., analysis of appropriate QC check samples and review of quarterlyperformance evaluation analyses), or an upfront demonstration of performancecan be used to influence the project manager’s selection. The need to conducta comprehensive evaluation of candidate laboratories will vary with the projectand the familiarity with available laboratories.
2.2.2 Statements of Work
Statements of work are prepared for both field work and laboratory analysis.Data quality requirements and analytical methods need to be clearly andconcisely communicated to either USACE personnel performing the analyses orto the laboratory selected by USACE’s or the permit applicant’s projectmanager. These specifications are best contained in a written Iaboratotycontract. The main body of the contract should consist of general terms and
8
conditions common to any legal contract. A statement of work should beappended to the contract. The statement of work should be drafted andnegotiated with the laboratory prior to the start of any analyses. The statementof work should be written in clear and concise terms, providing sufficient detailand references to approved protocols for each required procedure or method toeliminate any confusion about steps in the analysis. The statement of workshould define all requirements for acceptable analyses, an importantconsideration even when working with a familiar laboratory, and all pertinentinformation on the price, timing, and necessary documentation of the analyses.All available information on the range of concentrations expected and anyspecial characteristics of the samples to be analyzed should also be containedin the statement of work. A generic statement of work for the analysis of mostchemicals in the most commonly analyzed sample matrices is provided inAppendix B, and is based on the following outline:
A summary of analyses to be performed, including:
– A list of all variables to be analyzed for in each sample orgroup of samples
- A list of all methods and target detection limits (TDLs)(see discussion in Section 2.3.2) for physical andchemical analyses and a list of test protocols for biologicaltoxicity tests
- The total number of samples provided for analysis andthe associated laboratory QC samples, the cost of eachanalysis, and the total cost of the analytical servicerequested for each sample matrix.
Acceptable procedures for sample delivery and storage, including:
– The method of delivery, schedule of delivery, and personresponsible for notifying the laboratory of any changes inthe schedule
- Requirements for physical storage of samples, holdingtimes (consistent with those specified in the QA projectplan), chain-of-custody, and sample logbook procedures.
Methods to be followed for processing and analyzing samples.
QA/QC requirements, including the data quality objectivesspecified in the QA project plan and appropriate warning andcontrol limits.
A list of products to be delivered by the laboratory, specifying themaximum time that may elapse between the submittal of samplesto the laboratory and the delivery of data reports to the agency,
9

■
■
9
■
organization, or industry requesting the analyses. Penalties forlate delivery (and any incentives for early delivery) should bespecified, as should any special requirements for supportingdocumentation and electronic data files. A checklist of thelaboratory deliverables for analysis of organic compounds,pesticides, and polychlorinated biphenyls (PCBS) is presented inTable 1. A checklist of laboratory deliverables for analysis ofmetals is presented in Table 2.
Progress notices (usually necessary only for large projects).
Circumstances under which the laboratory should notify projectpersonnel of problems, including, for example, when control limitsor other performance criteria cannot be met, instrumentmalfunctions are suspected, or holding time limits have or willshortly expire.
Written authorization for any deviations from the sampling andanalysis plan should be obtained from EPA and USACE beforedeviation occurs.
Notice that scheduled and unannounced laboratory visits by the
the
project manager or representative may be conducted.
The following additional information should also be provided in the laboratorystatement of work:
Requirements that each laboratory submit a QA manual for reviewand approval by the agency, organization, or industry requesting orfunding the analysis. Each manual should contain a description ofthe laboratory organization and personnel, facilities and equipment,analytical methods, and procedures for sample custody, qualitycontrol, data handling, and resuits of previous laboratory audits.
Conditions for rejection or non-analysis of samples and reanalysisof samples.
Required storage time for records and samples prior to disposal.
Terms for payments to the laboratory, including a requirement thatthe quality ’of data must be acceptable (pending the outcome ofthe QA review) before payment is made.
Including these elements in the statement of work helps to assure thatresponsibilities, data requirements, and expectations for performance are clear.A copy of the statement of work should be provided to the individual performingthe data assessment to assist in the evaluation of data returned by thelaboratory.
10

TABLE 1. CHECKLIST OF LABORATORY DELIVERABLES FORTHE ANALYSIS OF ORGANIC COMPOUNDS
c1
•1
•1
El
❑
c1
o
•1
Acover letter discussing analytical problems (if any) and referencing ordescribing the procedures and instrumentation used.
Tabulated results, including final dilu~on volume of sample extracts, samplesize, wet-to-d~ ratios for solid samples (if requested), concentrations of com-pounds of interest (reported in units identified to two significant figures unlessotherwise justified), and equations used to petiorm calculations.Concentration units should be pg/kg (dry weight) for sediment, and pg/L forwater, ~g/kg (wet weight) for tissue. These results should be checked foraccuracy and the report signed by the laboratory manager or designee.
Target detection limits (see discussion in Section 2.3.2 of this document),instrument detection limits, and detection limits achieved for the samples.
Original data quantification reports for each sample.
Method blanks associated with each sample, quantifying all compounds ofinterest identified in these blanks.
A calibration data summary repotiing the calibration range used. For theanalysis of semivolatile organic compounds analyzed by mass spectrometry,this summary should include spectra and quantification reports for deca-fluorotriphenylphosphine (DFTPP) or an appropriate substitute standard. Forvolatile organic compounds analyzed by mass spectrometry, the summaryshould include spectra and quantification reports for bromofluorobenzene(BFB) or an appropriate substitute standard.
Recovery assessments and replicate sample summaries. Laboratoriesshould report all surrogate spike recovery data for each sample, and astatement of the range of recoveries should be included in reports usingthese data.
All data qualification codes assigned by the laboratory, their description, andexplanations for all departures from the analytical protocols.
—
11

TABLE 1. (cont.)
Additional Deliverables for Volatile or Semivolatile Organic Compound Analysesa
•1
•1
•1
•1
•1
Tentatively identified compounds (if requested) and methods of quantification,along with the three library spectra that best match the spectra of thecompound of interest (see Appendix C, Figure 1 for an example of a libraryspectrum).
Reconstructed ion chromatograms for gas chromatography/massspectrometry (GC/MS) analyses for each sample.
Mass spectra of detected mmpounds for each sample.
Internal standard area summary to show whether internal standard areaswere stable.
Gel permeation chromatography (GPC) chromatograms (for analyses ofsemivolatile compounds, if performed), recovery assessments, and replicatesample summaries. Laboratories should report all surrogate spike recoverydata for each sample, and a statement of the range of recoveries should beincluded in reports using these data.
Additional Deliverables for Pesticide and Polychlorinated Biphenyl Analysesa
•1 Gas chromatography/electron capture detection (GC/ECD) chromatograms forquantification column and mnfirmation columns for each sample and for allstandards analyzed.
❑ GPC chromatograms (if GPC was performed).
❑ An evaluation summary for 4,4’-DDT/endrin breakdown.
❑ A pesticide standard evaluation to summarize retention time shifts of internalstandards or surrogate spike compounds.
a Many of the terms in this table are discussed more completely in Appendix C.
12

TABLE 2. CHECKLIST OF LABORATORY DELIVERABLES FORTHE ANALYSIS OF METALS
❑ Acover letter discussing analytical problems (if any) and referencing ordescribing the digestion procedures and instrumentation used.
❑ Tabulated results for final dilution volumes of sample digestates, sample size,wet-to-dry ratios for solid samples (if requested), and concentrations ofmetals (reported in units identified to two significant figures unless otherwisejustified). Concentration units should be pg/kg (dry weight) for sediment, ~g/Lfor water, and pgkg (wet weight) for tissue.’ These results should bechecked for accuracy and the report signed by the laboratory manager ordesignee.
•1 Target detection limits (see discussion in Section 2.3.2 of this document),instrument detection limits, and detectibn limits achieved for the samples.
•1 Method blanks for each batch of samples.
❑ Results for all the quality control checks and initial and continuing calibrationcontrol checks conducted by the laboratory.
•1 All data quantification codes assigned by the laboratory, their description, andexplanations for all departures from the accepted analytical protocols.
a Most laboratories will report metals data in mg/kg for solid samples. The specification hereof ~g/kg is for consistency with organic chemical analyses, which are typically reported asvg/kg for solid samples. If different units are used, care should be taken to ensure that resultsare not confused.
13

2.3 QUALITY ASSURANCE OBJECTIVES
Data quality objectives are addressed in this section of the QA project plan.Data quality objectives define performance-based goals for accuracy (precisionand bias), representativeness, comparability, and completeness, as well as therequired sensitivity of chemical measurements (i.e., TDLs). Accuracy is definedin terms of bias (how close the measured value is to the true value) andprecision (how variable the measurements are when repeated) (see footnote atthe beginning of Section 2). Data quality objectives for the dredged materialprogram are based on the intended use of the data, technical feasibility, andconsideration of cost. Therefore, data that meet all data quality objectivesshould be acceptable for unrestricted use in the project and should enable allproject objectives to be addressed.
Numerical data quality objectives should be summarized in a table, with all datacalculated and reported in units consistent with those used by otherorganizations reporting similar data, to allow comparability among databases.All measurements should be made so that results are representative of themedium (e.g., sediments, water, or tissue) being measured. Data qualityobjectives for precision and bias established for each measurement parametershould be based on prior knowledge of the measurement system employed,method validation studies, and the requirements of the specific project.Replicate tests should be performed for all test media (e.g., sediments, water,or tissue). Precision of approximately <30-50 relative percent differencebetween measurements (the random error of measurement) and bias of50-150 percent of the true value (the systematic error of measurement) areadequate in many programs for making comparisons with regulatory limits.Precision may be calculated using three or more replicates to obtain thestandard deviation and the derived confidence interval. Bias may bedetermined with standard reference material (SRM) or by spiking analyte-freesamples.
These data quality objectives define the acceptability of laboratorymeasurements and should also include criteria for the maximum allowable timethat samples or organisms can be held prior to analysis by a laboratory. Anexample of a data quality objectives summary for laboratory measurements isprovided in Appendix A.
2.3.1 Program vs. Project Objectives
This document provides general guidance for QA activities conducted duringdredged material evaluations. However, specific project needs will affect thekinds of chemical analyses that are requested by the project manager. Specialproject needs should be identified during preparation of the QA project plan andshould be documented in this section of the plan. For example, a preliminary
14

reconnaissance of a large area may only require data from simple and quickchecks performed in the field. In contrast, a complete characterization ofcontamination in a sensitive area may require specialized laboratory methods,lower TDLS, and considerable documentation of results.
Before defining the analyses that should be performed to meet the data qualityobjectives established on a project-specific basis, a thorough review of allhistorical data associated with the site (if applicable) should be performed (seediscussions in U.S. EPA and USACE 1991, 1994). A review of the historicaldata should be conducted in response to data needs in the testing program. Acomprehensive review of all historical data should eliminate unnecessarychemical analyses and assist in focusing the collection of chemical-specific datathat are needed. A more thorough discussion of how to review and usehistorical data is provided in Section 2.5.2.
2.3.2 Target Detection Limits for Chemicals
Different analytical methods are capable of detecting different concentrations ofa chemical in a sample. In general, as the sensitivity and overall accuracy of atechnique increases, so does the cost. Recommended TDLs that are judged tobe feasible by a variety of methods, cost effective, and to meet therequirements for dredged material evaluations are summarized in Table 3 (atthe end of Section 2.4), along with example analytical methods that are capableof meeting the TDLs. However, any method that can achieve these TDLs isacceptable, provided that the appropriate documentation of the methodperformance is generated for the project.
The TDL is a performance goal set between the lowest, technically feasible,detection limit for routine analytical methods and available regulatory criteria orguidelines for evaluating dredged material (see summaries in McDonald et al.[1992]; PSEP [1 991]). The TDL is, therefore, equal to or greater than thelowest amount of a chemical that can be reliably detected based on thevariability of the blank response of routine analytical methods (seeSection 2.10.1 for discussion of method blank response). However, thereliability of a chemical measurement generally increases as the concentrationincreases. Analytical costs may also be lower at higher detection limits. Forthese reliability, feasibility, and cost reasons, the TDLs in Table 3 have been setat not less than 10 times lower than available regional or international dredgedmaterial guidelines for potential biological effects associated with sedimentchemical contamination. In many cases, lower detection limits than the TDLcan be obtained and may be desired for some regional programs (e.g., forcarefully documenting changes in conditions at a relatively pristine site).
All data generated for dredged material evaluation should meet the TDLs inTable 3 unless a regional requirement is made or sample-specific interferences
15

2.4
occur. Any sample-specific interferences should be well documented by thelaboratory. If significantly higher or lower TDLs are required to meet rigorouslydefined data quality objectives (e.g., for human health risk assessments) for aspecific project, then on a project-specific basis, modification to existinganalytical procedures may be necessaty. Such modifications should bedocumented in the QA project plan. An experienced analytical chemist shouldbe consulted so the most appropriate method modifications can be assessed,the appropriate coordination with the analytical laboratory can be implemented,and the data quality objectives can be met. A more detailed discussion ofmethod modifications is provided in Section 2.8.2.2.
STANDARD OPERATING PROCEDURES
Standard operating procedures are written descriptions of routine methods andshould be provided for as many methods used during the dredged materialevaluation as possible. A large number of field and laboratory operations canbe standardized and presented as standard operating procedures. Once theseprocedures are specified, they can be referenced or provided in an appendix ofthe QA project plan. Only modifications to standard operating procedures ornon-standard procedures need to be explained in the main body of the QAproject plan (e.g, sampling or analytical procedures summaries discussed inSections 2.5 and 2.8, respectively).
General types of procedures that benefit from standard operating proceduresinclude field measurements ancillary to sample collection (e.g., depth ofoverlying water, sampling depth, water quality measurements or mixing modelinput measurements), chain-of-custody, sample handling and shipment, androutine analytical methods for chemical anatyses. Standard operatingprocedures ensure that all persons conducting work are following the sameprocedures and that the procedures do not change over time. All personnelshould be thoroughly familiar with the standard operating procedures beforework is initiated. Deviations from standard operating procedures may affectdata quality and integrity. If it is necessary to deviate from approved standardoperating procedures, these deviations should be documented and approvedthrough an appropriate chain-of-command. Personnel responsible for ensuringthe standard operating procedures are adhered to should be identified in theQA project plan. Example standard operating procedures are provided inAppendix D.
.— --
16

TA
BL
E3.
RO
UT
INE
AN
AL
YT
ICA
LME
TH
OD
SA
ND
TA
RG
ET
DE
TE
CT
ION
LIM
ITS
FO
RS
ED
IME
NT
,WA
TE
R,A
ND
TIS
SU
E(p
arts
per
bill
ion
,un
less
oth
erw
ise
no
ted
)
Exa
mp
leR
eco
mm
end
edE
xam
ple
Rec
om
men
ded
Exa
mp
leR
eco
mm
end
edS
edim
ent
Sed
imen
tT
issu
eT
issu
eW
ater
Wat
erC
hem
ical
Met
ho
tiT
DL
Met
ho
dT
DL
bM
eth
od
aT
DL
b
Ino
rgan
icC
hem
icai
s
Alu
min
um
An
tim
on
y
40
3 1
0.2 1 1
3050
A16
01O
A;
U.S
.E
PA
(199
3a)
50,0
00=
2,50
0
200.
8;
U.S
.E
PA
(199
3a);
200.
8;
7040
/704
1;
U.S
.E
PA
(199
3a);
1,00
020
2.2;
601
0N20
0.7
7041
;20
4.2
3050
A;
7040
/704
1;
U.S
.E
PA
(199
3a);
PS
EP
(199
0a)
100
3010
;70
61;
206.
2;20
6.3;
EP
RI
(198
6)
Ars
enic
7061
;70
60A
;
3050
A;
U.S
.E
PA
(199
3a);
PS
EP
(199
0a);
EP
RI
(198
6)
5,00
020
0.8/
7061
;
7060
A;
U.S
.E
PA
(199
3a)
100
Ber
ylliu
m
Cad
miu
m
2,50
0”10
070
91;
210.
2;
6010
A/2
00.7
;
200.
8
200.
8;
7090
/709
1;
U.S
.E
PA
(199
3a)
3050
A;
601
OA
;
7131
A17
130;
U.S
.E
PA
(199
3a);
PS
EP
(199
0a)
200.
8;
7090
/709
1;
U.S
.E
PA
(199
3a)
200.
8;71
31A
;
7130
U.S
.E
PA
(199
3a)
100
213.
2;71
31A
3010
;
601
0A12
00.7
;
200.
8
300
Ch
rom
ium
3050
A/7
191
;
7190
6010
A;
U.S
.E
PA
(199
3a);
200.
8/71
91;
7190
;
U.S
.E
PA
(199
3a]
100
7191
;200
.8;
218.
2;30
10;
601
0W20
0.7
5,00
0

TA
BL
E3.
(co
nt.
)
Exa
mp
leR
eco
mm
end
edS
edim
ent
Sed
imen
tC
hem
ical
Met
ho
dT
DL
Silv
er
Th
alti
um
Tin Zin
c
3050
A17
761;
776Q
U.S
.E
PA
(199
3a);
PS
EP
(199
0a)
7840
1784
1;
U.S
.E
PA
(199
3a)
U.S
.E
PA
(199
3a)
3050
A17
951;
7950
U.S
.E
PA
(199
3a);
PS
EP
(199
0a)
Org
ano
tin
I
NC
AS
I(1
986)
;
Uh
ler
and
Du
rrel
(198
9);
Ric
eet
al.
(198
7)
200”
2(W
”
5oo
c.e
15,0
00 10
Exa
mp
leR
eco
mm
end
edT
issu
eT
k3su
eM
eth
od
’T
DL
b
200.
8/77
61;7
760;
I10
0
U.S
.E
PA
(199
3a)
a=
200.
8;78
4078
41;
100
U.S
.E
PA
(199
3a)
200.
610
0
U.S
.E
PA
(199
3a)
200.
8/79
51;7
950;
2,00
0
=
NC
AS
I(1
986)
;
Ric
eet
al.
(196
7);
Uh
ler
etal
.(1
989)
10
Exa
mp
leW
ater
Met
ho
&
7761
;272
.2
7840
;78
41;
279.
2
282.
2
7951
;28
9.2;
200.
7;30
10
601
OA
NC
AS
I(1
986)
;
Ric
eet
al.
(198
7);
Uh
ler
and
Du
rrel
(198
9)
Rec
om
men
ded
Wat
erT
DL
b9 1 1 5 i

o 0 0
0N
0Cu
001
t — I — I 1
20


TA
BL
E3.
(co
nt.
)
pJ
Ch
emic
al
2-M
eth
yln
aph
thal
ene
HP
AH
Co
mp
ou
nd
s
Flu
ora
nth
ene
Pyr
ene
Ben
z[a]
anth
race
ne
Exa
mp
leS
edim
ent
Met
ho
da
1625
C;
3540
A;
3550
A18
1OQ
8250
8270
A;
8310
;
U.S
.E
PA
(199
3a)
1625
C;
3540
A
3550
A/8
100
;
825Q
8270
A;
8310
;
U.S
.E
PA
(199
3a)
1625
C;
3540
A
3550
A/8
100;
8250
;82
70A
8310
;
U.S
.E
PA
(199
3a)
1625
C;
3540
A;
3550
A/8
100;
8250
;82
70A
;
8310
;
U.S
.E
PA
(199
3a)
Rec
om
men
ded
Sed
imen
tT
DL
20 20 20 20
Exa
mp
leT
issu
eM
eth
od
a
1625
C;
8100
;
8250
;82
70A
8310
U.S
.E
PA
(199
3a);
Slo
anet
al.
(199
3);
NO
AA
(198
9)
1625
C;
8100
;
8250
;82
70A
;
8310
U.S
.E
PA
(199
3a);
Slo
anet
al.
(199
3);
NO
AA
(198
9)
1625
C;
8100
;
8250
;82
70A
;83
10;
U.S
.E
PA
(199
3a);
Slo
anet
al.
(199
3);
NO
M(1
989)
1625
C;
8100
;
8250
8270
A;
831
O;
U.S
.E
PA
(199
3a);
Slo
anet
al.
(199
3);
NO
AA
(198
9)
Rec
om
men
ded
Tis
sue
TD
Lb
20 20 20 20
Exa
mp
leW
ater
Met
ho
ti
1625
C;
351O
A;
3520
AJ8
100;
8250
;82
70A
8310
1625
C;
351
OA
;
3520
A18
100;
8250
;82
70A
;
8310
1625
C;
351O
A;
3520
A18
100;
8250
;82
70A
;
8310
1625
C;
351
OA
3520
/4/8
100
;
8250
;82
70A
;
8310
Rec
om
men
ded
Wat
erT
DL
b
I
10 10 10 10
T,
I3.
(co
nt.
)
Exa
mp
feS
edim
ent
Met
ho
&
1625
C35
40A
3550
A/8
1w
8250
8270
A
8310
U.S
.E
PA
(198
3a)
1625
C:
354(
IA
355O
AI8
1OQ
8250
8270
A
6310
U.S
.E
PA
(199
3a)
1625
C;
3540
A
3550
A/8
10fJ
8250
8270
A
8310
U.S
.E
PA
(199
3a)
1625
C;
3540
A
3550
A/8
1O
Q
8250
8270
A
8310
U.S
.E
PA
(199
3a]
1625
C;
3540
A,
3550
A/8
1@
825Q
8270
A\
8310
U.S
.E
PA
(189
3a)
Rec
om
men
ded
sed
imen
tT
DL
Exa
mp
leT
issu
eM
eth
od
’
Rec
om
men
ded
Exa
mp
leW
ater
Met
ho
d’
Wat
erT
DL
bT
issu
eT
DL
b, C
hem
ical
10C
hry
sen
e
Ben
zo(b
&k)
fIu
ora
nth
enes
Ben
zo[a
]pyr
ene
Ind
eno
[l,2
,3-c
,d]p
yren
e
Dib
enz[
a,h
]an
thra
cen
e
1625
C;
6100
;
3250
8270
A;
8310
;
U.S
.E
PA
(199
3a);
Slo
anet
al.
(199
3);
NO
AA
(198
9)
2016
25C
;35
1OA
;
3520
A/8
100;
825Q
8270
A;
8310
1625
C;
8100
;
9250
8270
A83
10;
U.S
.E
PA
(199
3a);
Slo
anet
al.
(199
3);
NO
AA
(196
9)
2016
25C
;35
1OA
;
3520
AJ8
100;
8250
6270
A
8310
10
1625
C;
351O
A;
3520
/4/8
100;
8250
;82
70A
8310
1020
1625
C:
8100
;
B25
0;82
70A
;83
10;
U.S
.E
PA
(199
3a);
Slo
anet
al.
(199
3);
NO
AA
(198
9)
20
1625
C;
8100
;
0250
8270
A83
10
U.S
.E
PA
(199
3a);
Slo
anet
al. (1993);
NOAA(1989)
1625
C;
351O
A;
3520
A/8
1@
8250
6270
A;
831
C
1020
20 2010
2C16
25C
;81
OQ
6250
8270
A83
10;
U.S
.E
PA
(199
3a);
Slo
anet
al.
(199
3);
NO
AA
(198
9)
1625
C;
351O
A
3520
A/8
100
8250
8270
A
831C

TA
BL
E3.
(co
nt.
)
Exa
mp
leR
eco
mm
end
edE
xam
ple
Rec
om
men
ded
Exa
mp
leR
eco
mm
end
edS
edim
ent
Sed
imen
tT
issu
eT
issu
eW
ater
Wat
erC
hem
ical
Met
ho
d’
TD
LM
eth
ofl
TD
Lb
Met
ho
dT
DL
b
Ben
zo[g
,h,i]
per
ylen
e
Ch
lori
nat
edB
enze
nes
1,3-
Dic
hlo
rob
enze
ne
1,4-
Dic
hlo
rob
enze
ne
1,2-
Dic
hlo
rob
enze
ne
1,2,
4-T
rich
loro
ben
zen
e
Hex
ach
loro
ben
zen
e
1625
C;
3540
A;
3550
A16
100;
8250
;82
70A
;
6310
;U
.S.
EP
A(1
993a
)
1625
C;
3540
A;
3550
W81
00;
8240
A;
8250
;
826Q
8270
A
1625
C;
3540
A
3550
A18
100;
8240
A;
8250
;
8260
;82
70A
1625
C;
3540
A
355O
IV81
OO
;
8240
A;
825Q
8260
;82
70A
1625
C;
3540
A;
3550
AJ8
250;
8260
8270
A
1625
C;
3540
A
3550
N82
50;
8260
;62
70A
L20 20 20 20 10
’
10’
1625
C;
8100
;
8250
6270
A83
1O
;
U.S
.E
PA
(199
3a);
Slo
anet
al,
(199
3);
NO
AA
(198
9)
1625
C;
8240
A:
8250
;82
70A
;
Slo
anet
al.
(199
3)
1625
C:
8100
;
8240
~62
50;
6270
A;
Slo
anet
al.
(199
3);
NO
AA
(198
9)
1625
C;
8240
A:
8250
8270
A;
Slo
anet
al.
(199
3)
1625
C;
8250
;
8260
;62
70A
;
Slo
anet
al.(
1993
)
1625
C;
8250
;
8260
8270
A;
Slo
anet
al.(
1993
)
L20 20 20 20 20 20
1625
C;
351O
A;
352O
N81
OO
;
8250
;82
70A
6310
1625
C;
351O
A;
3520
A/8
100;
8240
A;
8250
;
8260
;82
70A
1625
C;
3510
A;
3520
A/8
100;
8240
A;
6250
;
8260
;82
70A
1625
C;
351O
A;
352O
N81
OO
;
8240
A;
8250
;
8260
;82
70A
1625
C;
351O
A;
3520
Af8
250;
8260
;82
70A
1625
C;
3510
A;
3520
A18
250;
8260
;82
70A
L10
1-
10 10 10 10 10

TA
BL
E3.
(co
nt.
)
Exa
mp
leR
eco
mm
end
edE
xam
ple
Rec
om
men
ded
Exa
mp
leR
eco
mm
end
edS
edim
ent
Sti
tmen
tT
issu
eT
issu
eC
hem
ical
Wat
erW
ater
Met
ho
tfT
DL
Met
ho
&T
DL
bM
eth
o@
TD
Lb
Ph
thal
ate
Eat
era
Dim
eth
ylp
hth
alat
e16
25C
;35
40A
;
3550
AM
60;
8100
;
8250
8270
A
5016
25C
;60
60
1100
8250
;82
70A
;
Slo
anet
al.
(199
3);
NO
AA
(198
9)
2016
25C
;35
1OA
;
3520
A18
060;
8100
;82
50;
8270
A
10
Die
thyl
ph
thal
ate
1625
C;
3540
A;
3550
Af8
060;
8100
;
8250
;62
70A
1625
C;
351
OA
;
3520
/4/8
100
8060
6250
;
8270
P
5016
25C
;80
60;
1100
;62%
8270
A;
Slo
anet
al.
(198
3);
NO
AA
(198
9)
2010
Dh
n-b
uty
lph
thal
ate
1625
C;
3540
A
3550
A/8
080;
8100
;
8250
;82
70A
5016
25C
;80
60;
3100
;82
50;
8270
A;
Slo
anet
al.
(199
3);
NO
AA
(198
9)
2016
25C
;35
1OA
;
3520
A/8
100
;
8060
;82
50;
6270
A
11
Bu
tylb
enzy
lph
thal
ate
1625
C;
3540
A;
3550
A18
060;
8100
;
8250
;82
70A
1625
C;
8060
;
9100
;825
0;62
70A
;
Slo
anet
al.
(199
3);
NO
AA
(198
9)
1625
C;
351O
A;
352O
AI8
1OO
;80
8082
50;
6270
A
1(
5020
Bis
[2-e
thyl
hex
yl]p
hth
alat
e18
25C
;35
40A
3550
/V60
60;
8100
8250
;62
701
1625
C;8
080;
0100
;62
50;
8270
A;
Slo
anet
al.
(199
3);
NO
AA
(196
9)
2016
25C
;35
1O
A;
3520
A/8
100
;80
60;
6250
;
8270
A
105C

TA
BL
E3.
(co
nt.
)
Exa
mp
leS
edim
ent
Ch
emic
alM
eth
od
Rec
om
men
ded
Exa
mp
leR
eco
mm
end
edE
xam
ple
Rec
om
men
ded
Sed
imen
tT
issu
eT
issu
eW
ater
Wat
erT
DL
Met
ho
tiT
DL
bM
eth
o&
TD
Lb
n5016
25C
;80
60;
20
8100
;82
50;
8270
A;
Slo
anet
al.
(199
3);
NO
AA
(198
9)n16
25C
;35
1OA
;
3520
N81
00;
8060
8250
;
8270
A
E10
Di-
n-o
ctyl
ph
thal
ate
1625
C;
3540
A;
3550
W80
60;
8100
;
8250
8270
A
Mis
cella
neo
us
Ext
ract
able
Co
mp
ou
nd
s
1625
C;
8250
;
8270
A
1625
C;
8250
;
8270
A
1625
C;
8100
;
8250
;82
70A
;
Sio
anet
al.
(199
3);
NO
AA
(198
9)
1625
C;
8250
;
8270
A
1625
C;
8250
;
8270
A
100
100
20 40 40
50 50 10 50 50
Ben
zyla
lco
ho
i
Ben
zoic
acid
Dib
enzo
fura
n
1625
C;
3540
A;
3550
A18
25Q
8270
A
5016
25C
;35
1OA
;
3520
A18
250
8270
A
1625
C;
3540
A;
3550
A18
250;
6270
A
100
1625
C;
351O
A;
3520
N82
50;
8270
A
1625
C;
3540
A;
3550
At8
250;
8270
A
5016
25C
;35
1OA
;
3520
N82
50;
8270
A
Hex
ach
loro
eth
ane
Hex
ach
loro
bu
tad
ien
e
1625
C;
3540
A;
3550
A18
250;
8270
A
100
1625
C;
3510
A;
3520
Af8
250;
8270
A
1625
C;
3540
A;
3550
A18
25Q
8270
A
2016
25C
;35
1O
A;
3520
1V82
50;
8270
AI

TA
BL
E3.
(co
nt.
)
Exe
mp
feS
edim
ent
Met
ho
d’
1625
C;
3540
A
3550
iV82
5Q
8270
A
1624
C;
3540
A
3550
AJ8
25iX
8240
k82
~
8270
A
Rec
om
men
ded
Sed
imen
tT
DL
Exa
mp
leT
issu
eM
eth
od
”
Exa
mp
leW
ater
Met
ho
d’
Rec
om
men
ded
Wat
erT
DL
bT
issu
eT
DL
bC
hem
ical
N-N
itro
sod
iph
enyl
amin
eI
1625
C;
8250
;20
2016
25C
;35
1OA
;
3520
A18
250;
8270
A
1624
C;
351O
A;
3520
A18
25Q
8240
A;
826Q
8270
A
50
8270
A
1624
C;
8250
;
8270
A
50M
eth
ylet
hyl
keto
ne
2020
Po
lych
lorl
nat
edD
lben
zofu
ran
s
Tet
rach
lorf
nat
edfu
ran
s
Pen
tach
lori
nat
edfu
ran
s
Hex
ach
lori
nat
edfu
ran
s
Hep
tach
lori
nat
edfu
ran
s
Oct
ach
lori
nat
edfu
ran
sE
l0.
001
0.00
25
0.00
5
0.00
5
0.01
Fl0.
001
0.00
25w
H82
90
8290
8290
8290
H1613
;82
90
1613
;82
90
1613
;82
90
I0.
0000
25I
F10.
005
0.00
5
1+1613
8290
1613
;82
90
1613
8290
I0.
01I
I16
13;
8290
II
J
Po
lych
lorl
nat
edD
iben
zo-p
dlo
xln
s
2,3,
7,8-
TC
DD
Oth
erte
trac
hlo
rin
ated
dio
xin
s
Pen
tach
lori
nat
edd
ioxi
ns
Hex
ach
lori
nat
edd
ioxi
ns
El
0.00
1
0.00
1
0.00
25
0.00
5❑
8290
8290
8290
8290
.0.
001
0.00
1
0.00
25
0.00
5
r==l
I16
13;
8290
I0.
0000
1
I16
1382
90I
1613
;82
90I
I0.
000o
1
I16
1382
80
H161%
8290
1613
8290
I0.000025
I16
1382
80I
0.00
005

TA
BL
E3.
(co
nt.
)
Exa
mp
leR
eco
mm
end
edE
xam
ple
Rec
om
men
ded
Exa
mp
leR
eco
mm
end
edS
edim
ent
Sed
imen
tT
issu
eT
issu
eW
ater
Wat
erC
hem
ical
Met
ho
dT
DL
Met
ho
d’
TD
Lb
Met
ho
@T
DL
b
El0.
005
0.01
n
1
E30.
005
0.01
1-16
13;
8290
I
H0.
0000
5
0.00
01
Hep
tach
lori
nat
edd
ioxi
ns
1613
;82
90I
I16
13;
8290
IO
ctac
hlo
rin
ated
dio
xin
s16
13;
8290
I
PC
BS
NO
AA
(198
9);
U.S
.E
PA
(199
3a)
nNO
AA
(198
9)
El0.
01P
CB
con
gen
ers
Slo
anet
al.
(199
3);
NO
M(1
989)
;
U.S
.E
PA
(199
3a)
Pes
tici
des
Ald
rin
8080
NO
AA
(198
5)
8080
NO
M(1
985)
8080
;
NO
AA
(198
5)
8080
NO
M(1
985)
8080
NO
AA
(198
5)
608;
351
ok,
3520
A/8
080
0.04
3540
A;
3550
A/8
080;
NO
AA
(198
5)
3540
A;
3550
A18
080;
NO
AA
(198
5)
3540
A;
3550
/4/6
080;
NO
AA
(198
5)
3540
A;
3550
/4/8
060;
NO
AA
(198
5)
3540
A;
3550
AJ8
080;
NO
M
(198
5)
1010
0.14
Ch
lord
ane
and
der
ivat
ives
1010
608;
3510
A;
3520
1W08
0
1010
608;
351O
A;
3520
AJ8
080
0.02
Die
ldri
n
0.1
4,4’
-DD
D10
1060
8;
3510
A;
3520
1W08
0
608;
351O
A;
3520
1V80
80
0.1
4,4-
DD
E10
10

TA
BL
E3.
(co
nt.
)
Exa
mp
leS
edim
ent
Met
ho
d’
Rec
om
men
ded
Sed
imen
tT
DL
Exa
mp
lelis
sue
Met
ho
d’
Rec
om
men
ded
Exa
mp
leW
ater
Met
ho
d’ 60
8;
351O
A;
3520
N80
80 808;
351O
A;
3520
AJ8
080
808;
3510
A;
3520
A18
080
608;
351O
A
3520
AJ8
080
608;
3510
A;
3520
A18
080
808;
351O
A;
3520
/V80
80
808;
3510
A;
3520
/$/8
080
608;
3510
A;
3520
/V80
80
Rec
om
men
ded
Wat
erT
DL
bT
issu
eT
DL
bC
hem
ical
4,4’
-DD
T35
40A
3550
A/8
080;
NO
AA
(198
5)
100.
110
8080
;
NO
AA
(198
5)
En
do
sulf
anan
dd
eriv
ativ
es35
40A
355W
V80
80;
NO
AA
(198
5)
108080
NOAA(1985)
100.
1
En
dri
nan
dd
eriv
ativ
es35
40A
;
3550
MI0
80;
NO
AA
(198
5)
5 10
8080
NOAA(1985)
100.
1
Hep
tach
lor
and
der
ivat
ives
3540
A
3550
A18
080;
NO
M
(198
5)
3540
A;
3550
A/8
080;
NO
AA
(198
5)
8080
NOAA(1985)
100.
1
y-H
exac
hlo
rocy
clo
hex
ane
(Iin
dan
e)
To
xap
hen
e
108080;
NOAA(19
85)
100.
1
3540A;
35501V8080
50
50
0.:
Met
ho
xych
lor
3540
A;
3550
A18
080
100.
510
Ch
lorb
ensi
de
0.00
235
40A
;
3550
A18
080;
NO
/%4
(198
5)
28080;
NOAA(1985)
2


TA
BL
E3.
(co
nt.
)
cd b
Exa
mp
leR
eco
mm
end
edE
xam
ple
Rec
om
men
ded
Exa
mp
leR
eco
mm
end
edS
edim
ent
Sed
imen
tT
issu
eT
issu
eC
hem
ical
Wat
erW
ater
Met
ho
da
TD
LM
eth
o@
TD
Lb
Met
ho
d’
TD
Lb
Oth
erA
nal
yses
Am
mo
nia
Cya
nid
es
To
tal
org
anic
carb
on
To
tal
pet
role
um
hyd
roca
rbo
ns
To
tal
reco
vera
ble
pet
role
um
hyd
roca
rbo
ns
To
tal
ph
eno
ls
Aci
d-v
ola
tile
sulf
ides
To
tal
sulf
ides
Gra
insi
ze
To
tal
susp
end
edso
lids
To
tal
sett
leab
leso
lids
350.
1;
350.
2;
Plu
mb
(198
1)
901O
A;9
012
PS
EP
(198
6);
U.S
.E
PA
(198
7a,
1992
b)
9070
;41
8.1
;
418.
1
8040
A
Cu
tter
and
Oat
es(1
987)
;
U.S
.E
PA
(199
1a);
DiT
oro
etal
.(1
990)
9030
;
Plu
mb
(198
1)
Plu
mb
(198
1);
AS
TM
(199
2) ..
i
100
2,00
0
0.1%
5,00
0
5,00
0
1,00
0
0.1
~mo
le/g
100
1% ..
....
901O
A;9
012
1,00
0
....
418.
110
0,00
0
....
8040
A10
,000
....
....
-...
.. ....
350.
1;35
0.2;
350.
3
r335.
2
9060
;41
5.1
;
AP
HA
531O
D
I41
8.1
420.
1;6
25;
8040
A -.
376.
2
I16
0.2;
AP
HA
251
OD
r160.
5;A
PH
A
2540
B
30
5,00
0
0.1’
%
100
500 50 --
100 --
1.0
mg
/L
0.05
ml/L

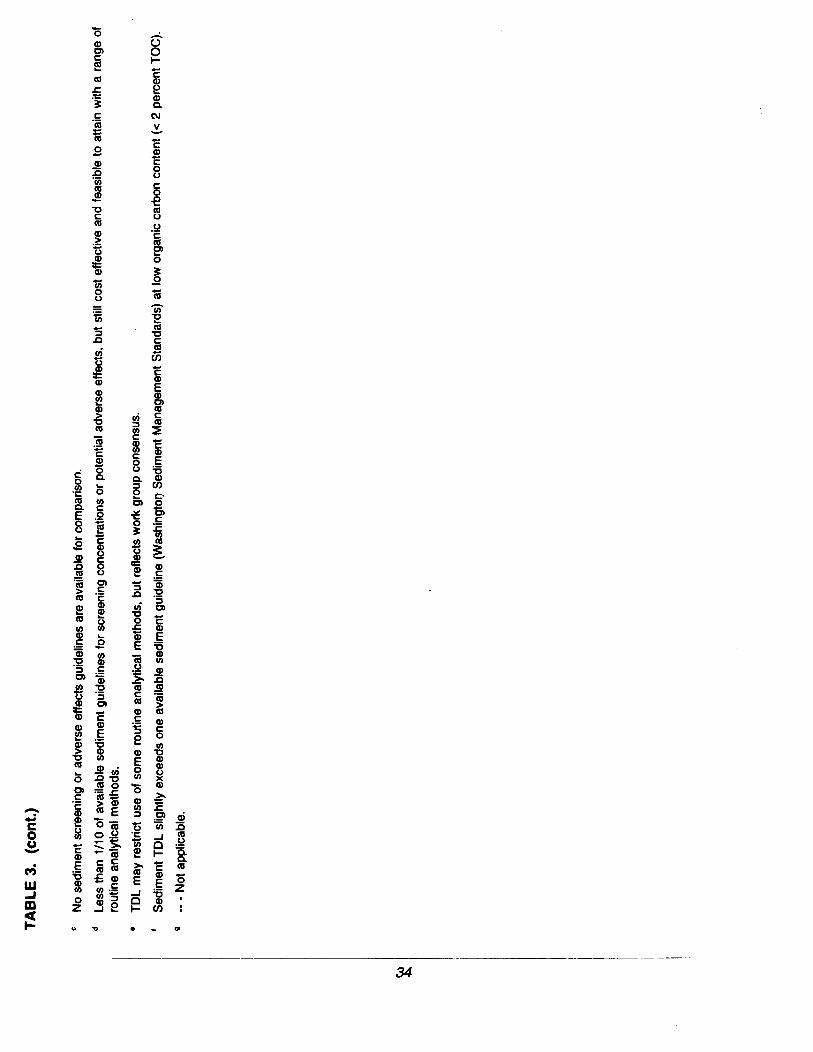
TA
BL
E3.
(co
nt.
)
\ I
cN
Ose
dim
ents
cree
nin
go
rad
vers
eef
fect
sg
uid
elin
esar
eav
aila
ble
for
com
par
iso
n.
dL
ess
than
1/10
of
avai
lab
lese
dim
ent
gu
idel
ines
for
scre
enin
gco
nce
ntr
atio
nso
rp
ote
nti
alad
vers
eef
fect
s,b
uts
till
cost
effe
ctiv
ean
dfe
asib
leto
atta
inw
ith
ara
ng
eo
fro
uti
ne
anal
ytic
alm
eth
od
s.
“T
DL
may
rest
rict
use
of
som
ero
tiin
ean
alyt
ical
met
ho
ds,
bu
tref
lect
sw
ork
gro
up
con
sen
sus.
‘S
edim
ent
TD
Lsl
igh
tly
exce
eds
on
eav
aila
ble
sed
imen
tgu
idel
ine
(Was
hin
gto
nS
edim
entM
anag
emen
tS
tan
dar
ds)
atlo
wo
rgan
icca
rbo
nco
nte
nt(
c2
per
cen
tTO
C).
9--
-N
ot
app
licab
le.
I
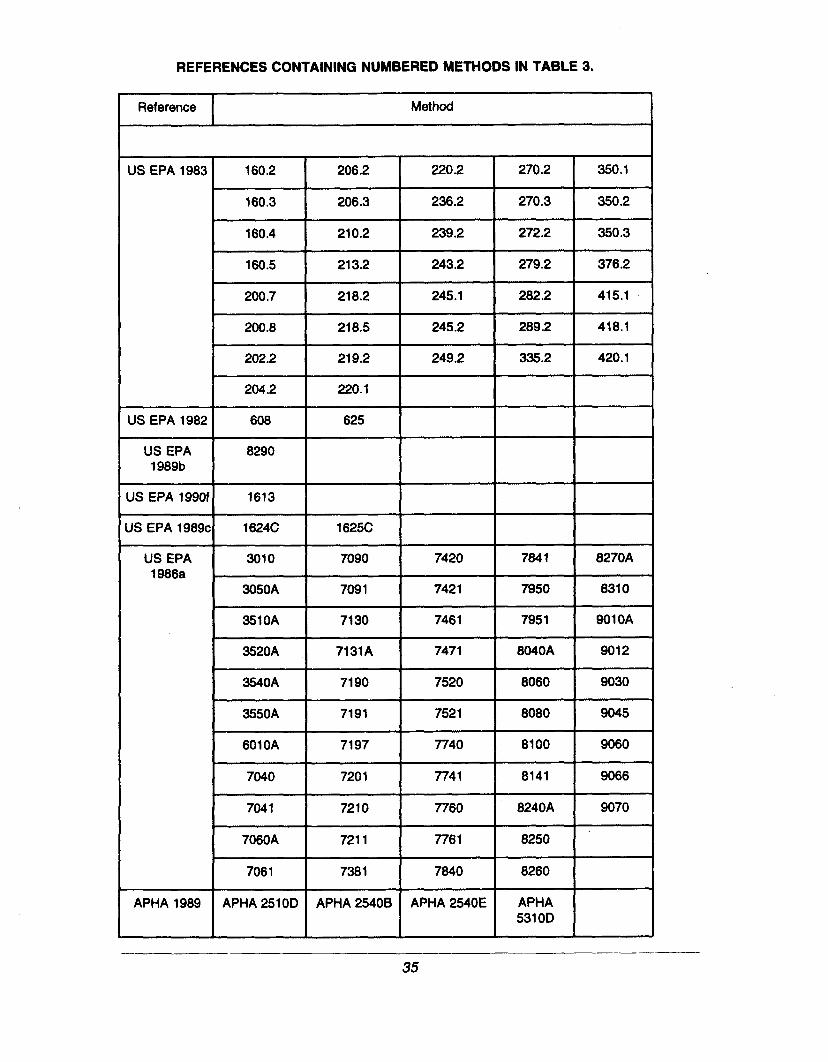
REFERENCESCONTAININGNUMBEREDMETHODSIN TABLE 3.
Reference I Method1
US EPA 1983
US EPA 1982
US EPA1989b
US EPA 1990f
K EPA 1989c
US EPA1986a
APHA 1989
160.2I 206.2 I 220.2
I270.2 I 350.1
n I 1 1
160.3 206.3 I 236.2 I 270.3I
350.2
160.4 I 210.2 I 239.2 I 272.2 I 350.3
160.5 213.2 243.2 279.2 376.21 n 1 s
200.7 I 218.2I
245.1I
282.2I
415.11 I I I
200.8 218.5 I 245.2 I 289.2 I 418.1
202.2I
219.2 I 249.2I
335.2I
420,1
204.2 I 220.1 I608 625
8290
1613I I
1624CI
1625C I3010 I 7090
I7420
I7641
I8270A
3050AI
7091I
7421I
7950I
8310
351OAI
7130I
7461I
7951I
901 OA
3520A I 7131AI
7471 I 8040A I 9012
3540A I 7190 I7520
I8060 I 9030
3550A 7191 7521 8080 9045
601OA 7197 7740 8100 9060
7040 7201 7741 8141 9066
7041 [ 7210 [ 7760 ! 8240A j 9070
7060A I 7211 I 7761 I 8250 I ‘
7061 I 7361 I 7640 I 8260 I
I IAPHA 251OD APHA 2540B APHA 2540E
1~~1
—

2.5 SAMPLING STRATEGY AND PROCEDURES
A sampling strategy should be developed to ensure that the sampling designsupports the planned data use. For example, a project that was planned tocharacterize a specific area would have different sampling design requirementsthan a project that was screening for a suspected problem chemical. Thesampling strategy will strongly affect the representativeness, comparability, andcompleteness that might be expected for field measurements. In addition, _thestrategy for collecting field QC samples (e.g., replicates) will assist in thedetermination of how well the total variability of a field measurement can bedocumented. Therefore, development of the sampling strategy should beclosely coordinated with development of QA objectives discussed in Section2.3.
Specific procedures for collecting each kind of sediment, water, tissue, orbiological sample are described in this section of the QA project plan. The levelof detail can range from a brief summary of sampling objectives, containers,special sample handling procedures (including compositing and subsamplingprocedures, if appropriate), and storage/sample preservation to a completesampling plan that provides all details necessary to implement the fieldprogram. Standard operating procedures do not require elaboration in thissection of the QA project plan (see Section 2.4).
If complete sampling details are not provided in the QA project plan, thenreference should be made to the sampling plan that does provide all details.The QA project plan may be an appendix of the sampling plan, or specificsampling details may be provided as an appendix of the QA project plan. Forsmaller projects, a single planning document may be created that combines awork plan (project rationale and schedule for each task), detailed sampling plan(how project tasks are implemented), and the QA project plan. For largerprojects, the QA project plan and the detailed sampling plan may be twoseparate documents.
This section of the document provides basic guidance for assuring samplequality from collection to delivery to the laboratory and guidance on items toconsider when designing a sampling plan. A well-designed sampling plan isessential when evaluating the potential impact of dredged material discharge onthe aquatic environment. The purpose of the sampling plan is to provide ablueprint for all fieldwork by defining in detail the appropriate sampling and datacollection methods (in accordance with the established QA objectives; seeSection 2.3). Before any sampling is initiated, the sampling plan should meetclearly defined objectives for individual dredging projects. Factors such as theavailability and content of historical data, the degree of sediment heterogeneity,the volume of sediment proposed to be dredged, the areal extent of thedredging project, the number and geographical distribution of sample collectionsites, potential contaminant sources, and the procedures for collection,
.
36

preservation, storage, and tracking of samples should be carefully consideredand are necessary for adequate Q/VQC of the data. The magnitude of thedredging project and its time and budgetary constraints should also beconsidered.
The following kinds of information should be reviewed for assistance indesigning the sampling plan:
■ Geochemical and hydrodynamic data-The grain size, specificdensity, water content, total organic carbon (TOC), andidentification of sediment horizons are helpful in makingoperational decisions. Areas of high tidal currents and high waveenergy tend to have sediments with larger grain sizes than doquiescent areas. Many contaminants have a greater affinity forclay and silt than for sand. Horizontal and vertical gradients mayexist within the sediment. If the sediments are subject to frequentmixing by wave action, currents or prop wash, the sediments arelikely to be relatively homogeneous. Local groundwater quality andmovement should be determined if groundwater is a potentialsource of contamination.
■ Quality and age of available data—Reviewing the results ofchemical analyses performed in past studies can help in selectingthe appropriate contaminants of concern and in focusing plans foradditional analyses. In particular, analytical costs can be reducedif historical results can substitute for new analyses. Collectingthese data is only the initial step, however. Assessing theirusefulness to the current project should always be performedbefore substantial effort is spent on incorporating historical resultsinto a project database. If it is determined that the historical dataare of questionable use for a specific project, then thedetermination of the most appropriate chemical analyses that willmeet the project needs, including the level of effort necessary, willneed to be assessed.
■ Spill data-Evidence of a contaminant spill within or near thedredging area may be an important consideration in identifyhglocations for sampling.
w Dredging histm—y-Knowledge of prior dredging may dramaticallyaffect sampling plans. If the area is frequently dredged (every 1-2years) or If the area is subject to frequent ship traffic, thesedimefits are likely to be relatively homogeneous. Assuming thatthere.is ng. major contaminant input, the sampling effort may beminimal. f+fowever, if there is information regarding possiblecontamination, a more extensive sampling effort may be indicated.New excavations of material unaffected by anthropogenic inputmay require less intensive sampling than maintenance dredging.
37

An acceptable sampling plan, including QAIQC requirements, should be inplace before sampling begins. Regional guidance from governmental agencies(i.e., EPA and USACE) is required for developing these project-specificsampling plans. The sampling plan should be written so that a field samplingteam unfamiliar with the site would be able to gather the necessary samplesand field information.
Addressing quality assurance in the sampling plan includes designating fieldsamples to be collected and used for assessing the quality of sampling andanalysis, and ensuring that quality assurance is included in standard operatingprocedures for field measurements. The quality of the information obtainedthrough the testing process is impacted by the following four factors:
■ Collecting representative samples
■ Collecting an appropriate number of samples
= Using appropriate sampling techniques
■ Protecting or preserving the samples until they are tested.
Ideally, the importance of each of these four factors will be fully understood andappropriately implemented; in practice, however, this is not always the case.There may be occasions when time or other resource constraints will limit theamount of information that should or can be gathered. When this is the case,the relative importance of each of these factors has to be carefully consideredin light of the specific study purposes.
An important component of any field sampling program is a preproject meetingwith all concerned personnel. As with the drafting of the QA project plan,participation by several individuals maybe necessary when developing thesampling plan. Personnel involved may include management, field personnel,laboratory personnel, data managementianalysis personnel, and representativesof regulatory agencies, the permit applicant, and the dredging company. Toassure sampling quality, at least one individual familiar with the study areashould be included in the preproject meeting. The purposes of the meetinginclude:
■ Defining the objectives of the sampling program
■ Ensuring communication among participating groups
■ Ensuring agreement on methods and contingency plans.
The more explicitly the objectives of a testing program can be stated (includingQA objectives), the easier it will be to design an appropriate sampling plan. Acomplete sampling plan will result in a level of detail such that all samplingprocedures and locations are clearly defined, sample volumes are clearlyestablished, and all logistical concerns are fully addressed.

To ensure an adequate level of confidence in the data produced and in thecomparability of the data to information collected by other sampling teams, thesampling plan should adhere to published sampling protocols and guidance.Descriptions of widely used sampling methods can be found in several EPApublications, many of which are cited in this section.
The sampling plan should include the following specific sections:
Summary of dredging plan, including the dimensions of thedredging area, the dredging depths, side-slopes, and the volume ofsediment for disposal (including overdredged material)
Site background and existing database for the area, includingidentification of 1) relevant data, 2) need for additional data, and 3)areas of potential environmental concern within the confines of thedredging project
Subdivision of dredging area into project segments, if appropriate,based on an assessment (review of historical data and pastassessment work) of the level of environmental concern within thedredging area
Sample location and sample collection frequency, includingselection of methods and equipment for positioning vessels atestablished stations
Sample designation system (i.e., a description of how eachindependently collected sample will be identified)
Sample collection methods for all test media (e.g., sediment,water, or tissue)
Procedures for sample handling (including container types andcleaning procedures), preservation, and storage, and (if applicable)field or shipboard analysis
Logistical considerations and safety precautions.
The subsections that follow discuss each of these steps and provide generalguidance for their conduct.
2.5.1 Review of Dredging Plan
A review of the plan for the dredging project provides a basis for determiningthe sampling strategy (see summary discussion in Section 2.3). The volume ofmaterial to be dredged and the method of dredging are two important factorsthat will help to determine the number of samples required. The number ofsamples required is generally a judgment that considers the cost, resolution,
.-39 ‘“
2.5.2
and the risk of an incorrect decision regarding the volume of material to bedredged. Knowledge of the depth, volume, and physical characteristics of thematerial to be dredged will help to determine the kind of sampling equipmentthat is required. The boundaries of the dredging area have to be known(including the toe and the top of all side-slopes) to ensure that the number andlocation of samples are appropriate. Sampling should generally be to below theproject depth plus any overdredging.
Site Background and Existing Database
As previously stated, reviewing the results of chemical analyses performed inpast studies can help in selecting the appropriate contaminants of concern andin focusing plans for additional analyses. The level of data quality for historicaldata will affect the selection of station locations. Examples of four levels ofdata quality that can be assigned to historical results are summarized in Table4. Labeling each set of results with a data quality level is also a simple way tosummarize the relative quality of the data set for future use. This classificationprovides a useful summary of data quality when making conclusions and writingup the results of the project. The example classification in Table 4 considersthe following factors when determining the suitability of historical results for aparticular project:
■ The analytical methods used and their associated detection lirnits—Analytical methods often improve over time. For example, as lateas the 1970s, concentrations of many organic compounds insediment samples were difficult to measure routinely, accurately,or sensitively. However, as better preparation methods and moresensitive analytical techniques have been developed, the ability todistinguish these compounds from other substances and theoverall sensitivity of analyses have substantially improved.Methods are now available that afford detection limits that are wellwithin the range of documented adverse biological effects.
■ QA/QC procedures and documentation—The usefulness of data willdepend on whether appropriate QA procedures have been usedduring analysis and if the data have been properly validated (seeSection 2.9.1 ) and documented. Because more rigorous methodsto analyze samples and document data quality have been requiredby environmental scientists over the past decade, only well-documented data that have been produced by laboratories usingacceptable data quality controls should be considered to have nolimitations. Historical data produced by even the best laboratoriesoften may lack complete documentation, or the documentationmay be difficult to obtain. However, historical data with incompletedocumentation could still be used for projects with certainobjectives (e.g., screening-level studies).
40
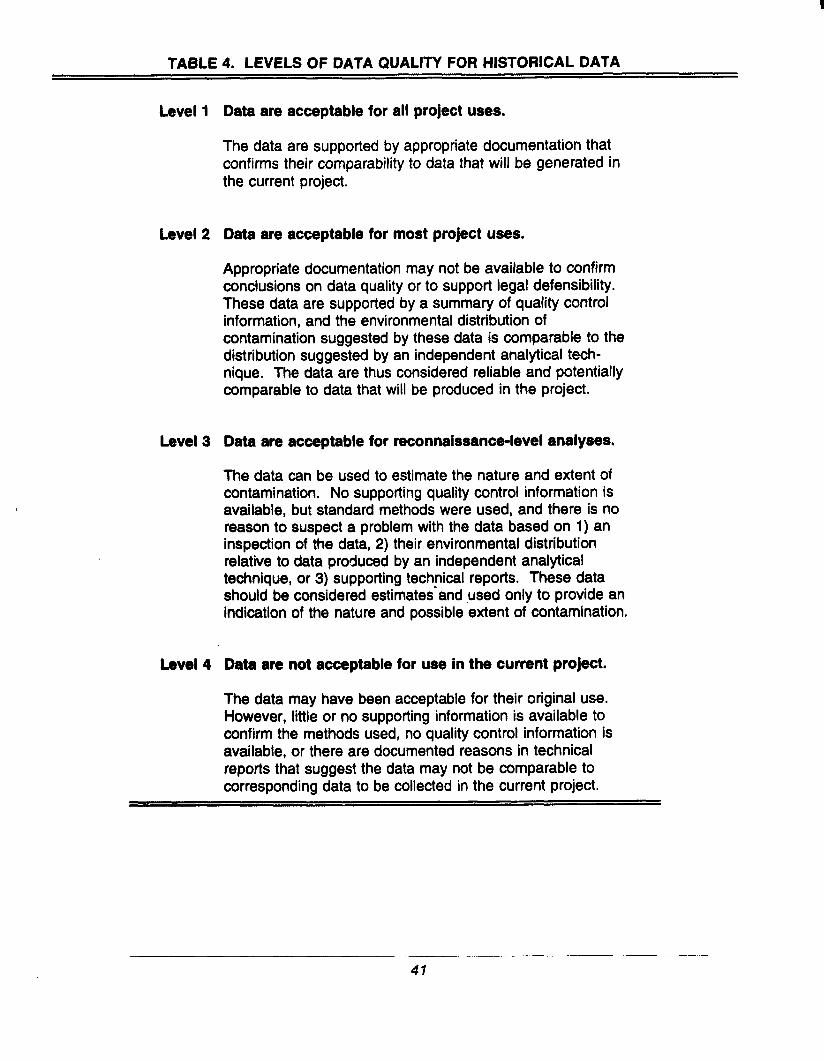
TABLE4. LEVELS OF DATA QUALITY FOR HISTORICAL DATA
Levell Data areacceptable forall project uses.
The data are supported by appropriate documentation thatconfirms their comparability to data that will be generated inthe current project.
Level 2 Data are acceptable for most project uses.
Appropriate documentation may not be available to confirmconclusions on data quality or to support legal defensibility.These data are supported by a summary of quality controlinformation, and the environmental distribution ofcontamination suggested by these data is comparable to thedistribution suggested by an independent analytical tech-nique. The data are thus considered reliable and potentiallycomparable to data that will be produced in the project.
Level 3 Data are acceptable for reconnaissance-level analyses.
The data can be used to estimate the nature and extent ofcontamination, No supporting quality control information isavailable, but standard methods were used, and there is noreason to suspect a problem with the data based on 1) aninspection of the data, 2) their environmental distributionrelative to data produced by an independent analyticaltechnique, or 3) supporting technical reports. These datashould be consideredestimatesand used only to provide anindicationof the nature and possibleextent of contamination.
Level 4 Data are not acceptable for use in the current project.
The data may have been acceptable for their original use.However, little or no supporting information is available toconfirm the methods used, no quality control information isavailable, or there are documented reasons in technicalreports that suggest the data may not be comparable tocorresponding data to be collected in the current project.
—
41

2.5.3 Subdivision of Dredging Area
Sediment characteristics may vary substantially within the limits of the area tobe dredged as a result of geographical and hydrological features. Manydredging projects can be subdivided into project segments (horizontal and/orvertical) that can be treated as separate management units. A project segmentis an area expected to have relatively consistent characteristics that differsubstantially from the characteristics of adjacent segments. Project segmentsmay be sampled with various intensities as warranted by the study objectivesand testing results.
Any established sampling program should be sufficiently flexible to allowchanges based on field observations. However, any deviations fromestablished procedures should be documented, along with the rationale for suchdeviations. An alteration checklist form is generally appropriate to implementrequired changes. An example of such a checklist is provided in Appendix A.
2.5.4 Sample Location and Collection Frequency
The method of dredging, the volume of sediment to be removed, the arealextent of the dredging project, and the horizontal and vertical heterogeneity ofthe sediment are key to determining station locations and the number ofsamples to be collected for the total dredging project. When appropriate totesting objectives, samples may be composite prior to analysis (with attentionto the discussion in Section 2.5.4.8). The appropriate number of samples andthe proper use of compositing should be determined for each operation on acase-by-case basis.
Using pertinent available information to determine station locations within thedredging area is both cost effective and technically efficient. If a review ofhistorical data (see Section 2.5.2) identifies possible sources of contamination,skewing the sampling effort toward those areas may be justified to thoroughlycharacterize those areas, but can lead to an incomplete assessment ofcontamination in the whole study area. In areas of unequally distributedcontamination, the total sampling effort should be increased to ensurerepresentative, but not necessarily equal, sampling of the entire site. Thefollowing factors should be among those considered when selecting samplingstations and patterns: objectives of the testing program, bathymetry, area ofthe dredging project, accessibility, flows (currents and tides), mixing (hydrology),sediment heterogeneity, contaminant source locations, land use activities,available personnel and facilities, and other physical characteristics of thesampling site. A discussion of locating appropriate stations, sample collection,and sample handling procedures is provided in the following sections.
— —
42

2.5.4.1 Station Locations
Station locations within the dredging area should include locations downstreamfrom major point sources and in quiescent areas, such as turning basins, sidechannels, and inside channel bends, where fine-grained sediments andassociated contaminants are most likely to settle. Information that should helpto define the representativeness of stations within a dredging area includes:
N Clearly defined distribution ofsediments to bedredged (i.e., projectdepth, overdredged depth, and side slopes)
■ Clearly defined area to be sampled
■ Correctly distributed sampling locations within each dredging area.
If sample variability is suspected within the dredging area, then multiplesamples should be collected. When sediment variability is unknown, it may benecessary to conduct a preliminary survey of the dredging area to better definethe final sampling program.
2.5.4.2 Sample Replication
Within a station, samples may be collected for replicate testing. Sedimenttesting is conducted on replicate samples, for which laboratory replicates(subsamples of a composite sample of the replicates) are generallyrecommended as opposed to field replicates (separate samples for eachreplicate). The former involves pseudo-replication but is more appropriate fordredged material evaluations where sediments will be homogenized by thedredging and discharge process. The latter involves true replication but is moreappropriate for field investigations of the extent and degree of variability ofsediment toxicity.
2.5.4,3 Depth Considerations
Sediment composition can vary vertically as well as horizontally. Samplesshould be collected over the entire dredging depth (including over-dredging),unless the sediments are known to be vertically homogeneousor there areadequate data to demonstrate that contamination does not extend throughoutthe depth to be excavated. Separate analyses of defined sediment horizons orlayers may be useful to determine the vertical distribution of contamination.
43

2.5.4.4 Sampling Bias
Ideally, the composition of an area and the composition of the samplesobtained from that area will be the same. However, in practice, there often aredifferences due to bias in the sampling program, including disproportionateintensity of sampling in different patts of the dredging area and equipmentlimitations.
In some cases, to minimize bias, it may be useful to develop a sampling grid.The horizontal dimensions may be subdivided into grid cells of equal size,which are numbered sequentially. Cells are then selected for sampling eitherrandomly or in a stratified random manner. It can be important to collect morethan the minimum number of samples required, especially in areas suspectedof having high or highly variable contamination. In some cases extra samplesmay be archived (for long time periods in the case of physical characterizationor chemical analyses and for short time periods in the case of biological tests)should reexamination of particular stations be warranted.
In other cases, a sampling grid may not be desirable. This is particularly thecase where dredging sites are not continuous open areas, but are rather aseries of separate humps, bumps, reaches, and pockets with varying depthsand surface areas. In these latter cases, sample distribution is commonlybiased with intent.
2.5.4.5 Level of Effort
In some cases, it may be advisable to consider varying the level of samplingeffort. Dredging areas suspected or known to be contaminated may betargeted for an increased level of effort so that the boundaries andcharacteristics of the contamination can be identified. A weighting approachcan be applied whereby specific areas are ranked in increasing order ofconcern, and level of concern can then be used as a factor when determiningthe number of samples within each area.
2.5.4.6 Number of Samples
In general, the number of samples that should be collected within eachdredging area is inversely proportional to the amount of known information, andis proportional to the level of confidence that is desired in the results and thesuspected level of contamination. No specific guidance can be provided, butthe following factors should be considered:
■ The greater the number of samples collected, the better the arealand vertical definition
44

■ Single measurements are inadequate to describe variability
■ Themeans ofseveral measurements ateachstation withinadredging area are generally less variable than individualmeasurements at each station.
2.5.4.7 Time and Funding Constraints
In all cases, the ultimate objective is to obtain sufficient information to evaluatethe environmental impact of a dredged material disposal operation. Therealities of time and funding constraints have to be recognized, although suchdo not justify inadequate environmental evaluation. Possible responses to costconstraints have been discussed by Higgins (1988). If the original samplingdesign does not seem to fit time or funding constraints, several options areavailable, all of which increase the risk of an incorrect decision. For example,the number of segments into which the project is divided can be reduced, butthe total number of samples remains the same. This option results in fewersegments and maintains the power of station-to-station comparisons. This may,however, provide a poor assessment of spatial variability because of reducedstratification. Another example would be to maintain (or even increase) thenumber of stations sampled, and composite multiple samples from within asegment. This option results in a lower number of analyses being performedper segment, but may provide a poor assessment of spatial variability withineach segment.
2.5.4.8 Sample Compositing
The objective of obtaining an accurate representation and definition of thedredging area has to be satisfied when compositing samples. Compositingprov~es a way to control cost while analyzing sediments from a large numberof stations. Compositing results in a less detailed description of the variabilitywithin the area sampled than would individual analysis at each station. How-ever if, for example, five analyses can be performed to characterize a projectsegment, the increased coverage afforded by collecting 15 individual samplesand combining sets of three into five composite samples for analysis may justifythe increased time and cost of collecting the extra 10 samples. Compositingcan also provide the large sample volumes required for some biological tests.Composite samples represent the “average” of the characteristics of theindividual samples making up the composite and are generally appropriate forlogistical and other reasons; however, they are not recommended where theycould serve to “dilute” a highly toxic but localized sediment “hot spot.” Further,composite samples are not recommended for stations with very different grainsize characteristics.
45

2.5.4.9 Sample Definition
2.5.5
When a sediment sample is collected, a decision has to be made as to whetherthe entire sediment volume is to be considered as the sample or whether thesediment volume represents separate samples. For instance, based onobserved stratification, the top 1 m of a core might be considered to be aseparate sample, from the remainder of the core. After the sediment to beconsidered as a sample is identified, it should be thoroughly homogenized.Samples may be split before compositing, with a portion of the originalsediment archived for possible later analysis, and the remainder combined withparts of other samples. These are then thoroughly homogenized (using cleaninstruments until color and textural homogeneity are achieved), producing thecomposite sample.
Sample Designation System
Information on the procedures used to designate the sampling location and typeof sample collected should be clearly stated in the field sampling plan. Thesampling stations should be named according to the site and the type ofstation. Each sample should be assigned an identifier that describes thestation, type of sample, and field replicate. An example sample designationformat is as follows:
The first two characters of the station name could identify the site(e.g., BH = Boston Harbor).
The third character of the station name could identify the type ofstation (e.g., S = site station, P = perimeter station, or R =reference station).
The fourth and fifth characters of the station name could consist ofa sequential number (e.g., 01, 02,, or 03) that would be assigned todistinguish between different stations of the same type.
The sixth character of the station name could describe the type ofsample (e.g., C = sediment for chemistry and bioassay analyses, B= bioaccumulation, or I = benthic infauna).
The resulting sample identifier would be: BHSOI C.
When field replicates are collected (i.e., for benthic samples), the replicatenumber should be appended to the sample identifier. All field replicates fromthe same station should have the same sample identifier. The sample identifierand replicate number should be linked by a dash to form a single identifier foruse on sample labels. The sample date should also be recorded on the samplelabel.
46
.—

2.5.6 Station Positioning
The type of positioning system used during sampleprocedures for station positioning should be clearly
collection and detailedstated in the sampling plan.
No single positioning method will be appropriate for all sampling scenarios.U.S. EPA (1987b), PSEP(l 990b), and USACE (1990) provide useful informationon positioning systems and procedures. Guidance in these publications may be
followed on all points that do not conflict with this document.
2.5.6.1 Selection of Station Positioning System
Available systems should be evaluated based on positioning requirements andproject-specific constraints to select the most appropriate station positioningmethod for the project. Specific design and location factors that may affectstation positioning include physical conditions (e.g., weather and currents) andtopography of the study site, proposed equipment and analyses, minimumstation separation, station reoccupation, and program-imposed constraints.U.S. EPA’s (1993b) locational data policy implementation guidance calls forpositioning accuracy within 25 m.
There are many methods available for navigating and positioning samplingvessels. These methods range from simple extensions of well-establishedonshore survey techniques using theodolites to highly sophisticated electronicpositioning systems. A general discussion of a few of the station positioningmethods available for dredged material evaluations is provided in the followingsections. U.S. EPA (1987b), PSEP (1990b), USACE (1990), and currentliterature from the manufacturers of station positioning systems should bethoroughly reviewed during the selection process to choose the mostappropriate project-specific positioning system.
Optical Positioning Techniques
Optical positioning requires visual sighting to determine alignment on two ormore ranges, or the distances and angles between the vessel and shoretargets.
Intersecting ranges can be used when a number of established landmarkspermit easy selection of multiple ranges that intersect at the desired samplingpoint, and accuracy is not critical. One of the more traditional opticalpositioning systems is the theodolite system. Position of the sampling vesselcan be established using theodolites by two onshore observers whosimultaneously measure the angle between a reference object or shore traverseand the vessel. Using a theodolite with an accuracy of Al 5 seconds for asingle angle measurement at an intercept angle of approximately 45° and a
47

range of 5 km, could potentially yield a positioning error of K +1 m (Ingham1975). Although the accuracy of this method is good under optimal conditions,its use in open waters has several disadvantages such as limited line-of-sight,limits on intersection of angles, requirement of two manned shore stations,simultaneous measurements, and target movement and path interferences(e.g., fog, heavy rain, or heat waves).
Electronic Positioning Techniques
Electronic positioning systems use the transmission of electromagnetic wavesfrom two or more stations and a vessel transmitter to define a vessel’s location.Under routine sampling conditions, which may disfavor optical positioning, andat their respective maximum ranges, electronic positioning methods havegreater accuracy than optical positioning methods (U.S. EPA 1987b).
LORAN-C is one type of electronic positioning system. Based on the signalproperties of received transmissions from land-based transmitters, the LORAN-C receiver can be used to locate an approximate position, with a repeatableaccuracy that varies from 15 to 90 m (U.S. EPA 1987b), depending on theweather and the geometry of the receiver within the LORAN-C station network.Although the LORAN-C system is not limited by visibility or range restrictionsand does not require additional personnel to monitor onshore stations (as thetheodolite system does), the LORAN-C system does experience interferences insome geographic areas and is more appropriately used to reposition on apreviously sampled station.
Microwave positioning systems are typically effective between 25 and 100 kmoffshore, depending on antenna heights and power outputs, and haveaccuracies of 1-3 m. Microwave systems consist of two or more slave shorestations positioned over known locations and a master receiver on the vessel.By accurately measuring the travel time of the microwaves between the twoknown shore points and the vessel receiver, the position of the vessel can beaccurately determined. The shore stations, typically tripod-mounted antennaspowered by 12-volt batteries, are very susceptible to vandalism.
The global positioning system (GPS) is another electronic system that candetermine station positions by receiving digital codes from three or moresatellite systems, computing time and distance, and then calculating an earth-based position. Two levels of positioning accuracy are achievable with the GPSsystem. The positional accuracy of standard GPS is approximately 50–100 m(U.S. EPA 1987b). The accuracy can be improved to between 0.5-5 m bydifferential GPS (U.S. EPA 1987b). In differential GPS, two receivers are used.The master receiver is placed on a known location. It’s location is computedbased on satellite data, and a correction is applied to account for the errors in
48

position from the satellites. This correction is then sent via radio link or satelliteto vessel-mounted receivers.
Hybrid Positioning Techniques
A number of hybrid positioning systems combine positional data from varioussources to obtain fixes. Such systems usually involve the intersection of avisual line-of-position with an electronic line-of-position, Of particular interest tocoastal monitoring programs are dynamic positioning systems that require onlya single shore station and that use the simultaneous measurement of anglefrom a known direction and range to the survey vessel, These range-azimuthsystems are characterized by their operating medium (optional, microwave,laser) and/or procedure (i.e. manual or automatic tracking).
2.5.6.2 Physical Conditions at the Study Site
The ability of a positioning method to achieve its highest projected accuracydepends, in part, on site-specific conditions. Weather, currents and otherphysical factors may reduce the achievable accuracy of a positioning method.For example, the relative drift of the sampling equipment away from the boatunder strong currents or winds can increase with depth. Resulting positioningerrors in sample location (as opposed to boat location) may exceed acceptablelimits for the study if effects of site location on positioning accuracy are notconsidered during design of the sampling program.
2.5.6.3 Quality Assurance Considerat~ons
Once the positioning method has been selected for the specific dredgedmaterial evaluation, the proper setup, calibration, and operational proceduresmust be followed to achieve the intended accuracy. At least one member ofthe field crew should be familiar with the selected positioning method.
Recordkeeping requirements should be established to ensure that stationlocations are accurately occupied and that adequate documentation is available.Adequate information to ensure consistent positioning and to allow reoccupationof stations for replicate sample collection or time-series monitoring should bekept in a field logbook. Entries should be initialed by the person entering thedata. Required entries into the field logbook include the following:
■ Initial Survey Description—The positioning method andequipment used, all changes or modifications to standard methods,names of persons who set up and operate the station positioningequipment, location of on-board equipment and the reference point(e.g., antennae, sighting position), the type of map used for
49
2.5.7
positioning and its identification number or scale should berecorded in the field logbook. In addition, a complete copy of thesurvey notes (if appropriate) should be included in the fieldlogbook.
Day Log Entries—The same information that is included in the
initial survey description is also recorded on a daily basis in the
day log. In addition, all problems or irregularities, any weather or
physical conditions that may affect achievable accuracy, and all
calibration data should be recorded in the day log.
Station Log Entries—Each station location should be recorded inthe coordinates or readings of the method used for positioning insufficient detail to allow reoccupation of the station in the future.The positioning information should be recorded at the time ofsample collection (versus time of equipment deployment) and forevery reoccupation of that station, even during consecutivereplicate sampling. In addition, supplemental positioninginformation that would define the station location or helpsubsequent relocation (e.g., anchored, tied to northwest corner ofpier, buoy) should be recorded. If photographs are to be used fora posteriori plotting of stations, the roll and frame numbers shouldbe recorded. Depth, time (tidal height) ship heading, and wireangle estimation should also be recorded for each occupation of astation.
Sampling reports should include the type of positioning method used duringdata collection. Any specific problems (e.g., wind, currents, waves, visibility,electronic interferences) that resulted in positioning problems and those stationsaffected should be identified in the sampling report. Estimates of the accuracyachieved for station positioning should be included. Station locations should bereported in appropriate units (e.g., latitude and longitude to the nearest second).Coordinates do not need to be reported for each replicate collected; a single setof coordinates for the station is sufficient. Depth corrected to mean lower lowwater should also be supplied for each station.
Sample Collection Methods
Detailed procedures for performing all sampling and equipment decontaminationshould be clearly stated in the sampling plan and can be included as standardoperating procedures (see Appendix D). Sample collection requires anexperienced crew, an adequate vessel equipped with navigational andsupporting equipment appropriate to the site and the study, andnoncontaminating sampling apparatus capable of obtaining relativelyundisturbed and representative samples. To assure sampling quality, at leastone individual familiar with the study area should be present during the
50
sampling activities. Sampling effort for a proposed dredging project is primarily
oriented toward collection of sediment samples for physical and chemicalcharacterization and for biological tests. Collection of water samples is alsorequired to evaluate potential water column impact. Collection of organismsnear the disposal site might be necessary if there is a need to characterizeindigenous populations or to assess concentrations of contaminants in tissues.Organisms for use in toxicity and bioaccumulation tests may also be field-collected.
In general, a hierarchy for sample collection should be established to preventcontamination from the previous sample, especially when using the samesampling apparatus to collect samples for different analyses. Where possible,the known or expected least contaminated stations should be sampled first. Ata station where water and sediment are to be collected, water samples shouldbe collected prior to sediment samples. The vessel should ideally be positioneddownwind or downcurrent of the sampling device. When lowering and retrievingsampling devices, care should be taken to avoid visible surface slicks and thevessel’s exhaust. The deck and sample handling area should be kept clean tohelp reduce the possibility of contamination.
2.5.7.1 Sediment Sample Collection
Mudroch and MacKnight (1991) provide useful reference information forsediment sampling techniques. Higgins and Lee (1987) provide a perspectiveon sediment collection as commonly practiced by USACE. ASTM (1991b) andBurton (1991) provide guidelines for collecting sediments for toxicologicaltesting. Guidance provided in these publications may be followed on all pointsthat do not conflict with this document.
Care should be taken to avoid contamination of sediment samples duringcollection and handling. A detailed procedure for handling sampling equipmentand sample containers should be clearly stated in the sampling plan associatedwith a specific project; this may be accomplished by using standard operatingprocedures. For example, samples designated for trace metal analysis shouldnot come into contact with metal surfaces (except stainless steel, unlessspecifically prohibited for a project), and samples designated for organicanalysis should not come into contact with plastic surfaces.
A coring device is recommended whenever sampling to depth is required. Thechoice of corer design depends on factors such as the objectives of thesampling program, sediment volumes required for testing, sedimentcharacteristics, water depth, sediment depth, and currents or tides. A gravitycorer may be limited to cores of 1-2 m in depth, depending on sediment grainsize, degree of sediment compaction, and velocity of the drop. For penetrationgreater than 2 m, a vibratory corer or a piston corer is generally preferable.These types of coring devices are generally limited to soft, unconsolidatedsediments. A split-spoon core may be used for more compacted sediment.The length of core that can be collected is usually limited to 10 core diametersin sand substrate and 20 core diameters in clay substrate. Longer cores can
51

be obtained, but substantial sample disturbance results from internal frictionbetween the sample and the core liner.
Gravity corers can cause compaction of the vertical structure of sedimentsamples, if they freefall into the sediment. Therefore, if the vertical stratificationin a core sample is of interest, a piston corer or vibra corer should be used.The piston corer uses both gravity and hydrostatic pressure. As the cuttingedge penetrates the sediments, an internal piston remains at the level of thesediment/water interface, preventing sediment compression and overcominginternal friction. The vibra corer is a more complex piece of equipment but iscapable of obtaining 3- to 7-m cores in a wide range of sediment types byvibrating a large diameter core barrel through the sediment column with littlecompaction. If the samples will not be sectioned prior to analysis, compactionis not a problem, and noncontaminating gravity (freefall) corers may be thesimplest alternative.
Corers are the samplers of preference in most cases because of the variation incontamination with depth that can occur in sediment deposits. Substantialvariation with depth is less likely in shallow channel areas without major directcontaminant inputs that have frequent ship traffic and from which sediments aredredged at short intervals. Generally, in these situations, bottom sediments arefrequently resuspended and mixed by ship scour and turbulence, effectivelypreventing stratification. In such cases, surface grab samples can berepresentative of the mixed sediment column, and corers should be necessaryonly if excavation of infrequently disturbed sediments below the mixed layer isplanned. Grab samplers are also appropriate for collecting surficial samples ofreference or control sediments,
Grab samplers and gravity corers can either be Teflon@-coatedor be made ofstainless steel to prevent potential contamination of trace metal samples. Thesampling device should at least be rinsed with clean water between samples,More thorough cleaning will be required for certain analyses; for instance,analyses performed for chlorinated dioxins require that all equipment andsample containers be scrupulously cleaned with pesticide-grade solvents orbetter because of the low detection limits required for these compounds, It isrecommended that a detailed standard operating procedure specifying alldecontamination procedures be included in the project sampling plan.
2.5.7.2 Water Sample Collection
If water samples are necessary, they should be collected with either anoncontaminating pump or a discrete water sampler. When sampling with apump, the potential for contamination can be minimized by using a peristaltic ora magnetically coupled impeller-design pump.barriers between the sample and the surfaces
These kinds of pumps provideof the pump (e.g., motor or fan)
52

that would cause contamination. The system should be flushed with theequivalent of 10 times the volume of the collection tubing. Also, anycomponents within several meters of the sample intake should benoncontaminating (i.e., sheathed in polypropylene or epoxy-coated or made ofTeflon@). Potential sample contamination must be avoided, including vesselemissions and other sampling apparatus.
A discrete water sampler should be of the close/open/close type so that onlythe target water sample comes into contact with internal sampler surfaces.Water samplers should be made of stainless steel or acrylic plastic. Sealsshould be Teflon@-coated whenever possible. Water sampling devices shouldbe acid-rinsed (1:1 nitric acid) prior to use for collection of trace-metal samples,and solvent-rinsed (assuming the sampler material is compatible) prior tocollection of samples for organic analyses.
2.5.7.3 Organism Collection
Collection methods for benthic organisms may be species-specific and caninclude, but are not limited to, bottom trawling, grabs, or cores. If organismsare to be maintained alive, they should be transferred immediately to containerswith clean, well-oxygenated water, and sediment, as appropriate. Care must betaken to prevent organisms from coming into contact with natural predators andpotentially contaminated areas or fuels, oils, natural rubber, trace metals, orother contaminants (U.S. EPA 1990a, 1992a).
2.5.8 Sample Handling, Preservation, and Storage
Detailed procedures for sampling handling, preservation, and storage should bepart of the project-specific protocols and standard operating proceduresspecified for each sampling operation and included in the sampling plan.Samples are subject to chemical, biological, and physical changes as soon asthey are collected. Sample handling, preservation, and storage techniqueshave to be designed to minimize any changes in composition of the sample byretarding chemical and/or biological activity and by avoiding contamination.Collection methods, volume requirements, container specifications, presewationtechniques, storage conditions, and holding times (from the time of samplecollection) for sediment, water, and tissue samples are discussed below andsummarized in Table 5. Exceedance of the holding times presented in Table 5would not necessarily result in qualification of the data during data validation.However, technical reasons justi~lng acceptance of data that exceed theholding time should be provided on a compound class basis.
53
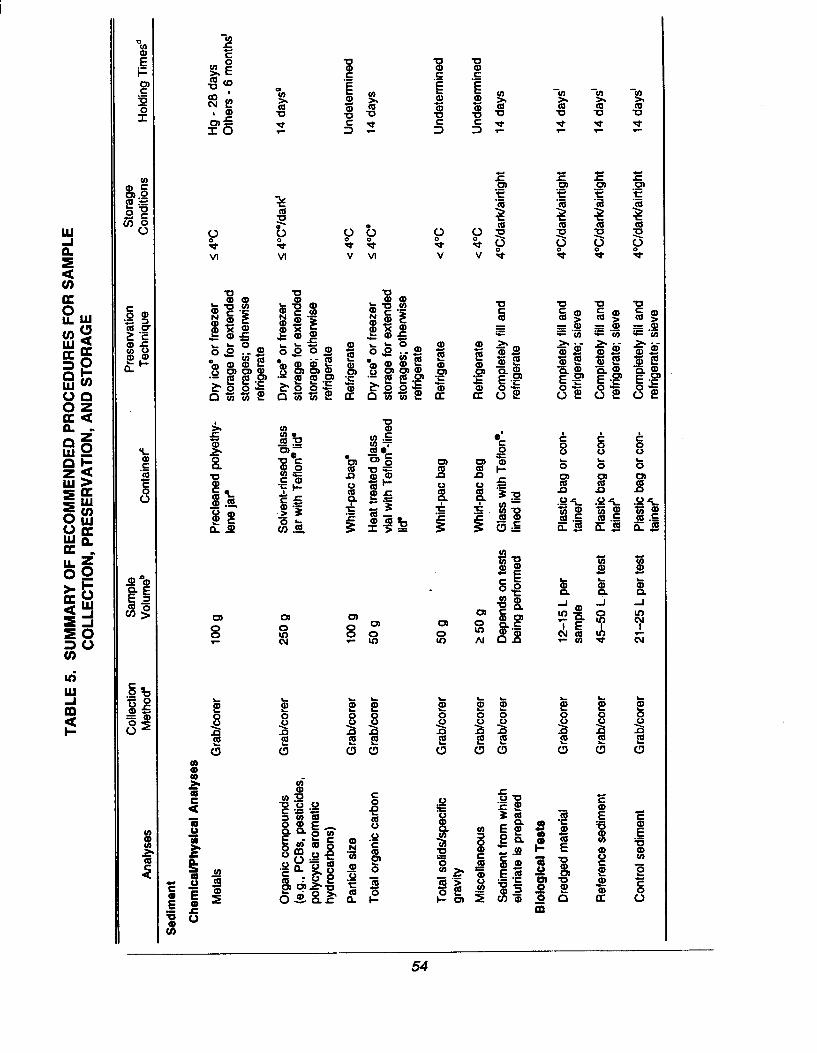
TA
BL
E5.
SU
MM
AR
YO
FR
EC
OM
ME
ND
ED
PR
OC
ED
UR
ES
FO
RS
AM
PL
EC
OL
LE
CT
ION
,P
RE
SE
RV
AT
ION
,A
ND
ST
OR
AG
E
Co
llect
ion
Sam
ple
Pre
serv
atio
nS
tora
ge
An
alys
esM
eth
orf
Vo
lum
ebC
on
tain
etT
ech
niq
ue
Co
nd
itio
ns
Ho
ldin
gT
imes
”
Sed
imen
t
Ch
emlc
af/P
hys
ical
An
alys
es
Met
als
Org
anic
com
po
un
ds
(e.g
.,P
CB
S,p
esti
cid
es,
po
lycy
clic
aro
mat
ich
ydro
carb
on
s)
Par
ticl
esi
ze
To
talo
rgan
icca
rbo
n
To
tals
ofi
dsk
pec
ific
gra
vity
Mis
cella
neo
us
Sed
imen
tfro
mw
hic
hel
utn
ate
isp
rep
ared
Blo
log
lcal
Tes
ts
Dre
dg
edm
ater
ial
Ref
eren
cese
dim
ent
Co
ntr
ols
edim
ent
Gra
b/c
ore
r
Gra
b/c
ore
r
Gra
b/c
ore
r
Gra
b/c
ore
r
Gra
b/c
ore
r
Gra
b/c
ore
r
Gra
b/c
ore
r
Gra
b/c
ore
r
Gra
b/c
ore
r
Gra
b/c
ore
r
100
g
250
g
100
g
50g
50g
250g
Pre
clea
ned
po
lyet
hy-
len
eja
f
So
lven
t-ri
nse
dgla
ssja
rw
ith
Tef
lon
”Iid
e
Wh
irl-
pat
bag
’
Hea
ttr
eate
dg
lass
vial
wit
hT
eflo
n@
-lin
edlid
*
Wh
irf-
pac
bag
Wh
irl-
pat
bag
Dep
end
so
nte
sts
Gla
ssw
ith
Tef
lon
”-b
ein
gp
erfo
rmed
lined
lid
12-1
5L
per
Pla
stic
bag
or
con
-sa
mp
leta
ine~
45-5
0L
@r
test
Pla
stic
bag
or
con
-ta
ine?
’
21-2
5L
per
test
Pla
stic
bag
or
con
-ta
ine?
Dry
ice”
or
free
zer
sto
rag
efo
rex
ten
ded
sto
rag
es;o
ther
wis
ere
frig
erat
e
Dry
ice”
or
free
zer
sto
rag
efo
rex
ten
ded
sto
rag
e;o
ther
wis
ere
frig
erat
e
Ref
rig
erat
e
Dry
ice’
or
free
zer
sto
rag
efo
rex
ten
ded
sto
rag
e%o
ther
wis
ere
frig
erat
e
Ref
rig
erat
e
Ref
rig
erat
e
Co
mp
lete
lyfi
llan
dre
frig
erat
e
Co
mp
lete
lyfi
llan
dre
frig
erat
e;si
eve
Co
mp
lete
lyfi
llan
dre
frig
erat
e;si
eve
Co
mp
lete
lyfi
llan
dre
frig
erat
e;si
eve
s4°
C
s4°
Cg
ldar
td
<40
C
<4“
c”
<4°
C
<40
C
4aC
/dar
k/aM
gh
t
4°C
/dar
tdai
rtig
ht
4°C
/dar
fdai
rtig
ht
4°C
/dar
k/ai
rtig
ht
Hg
-28
day
sO
ther
s-6
mo
nth
s’
14d
ays”
Un
det
erm
ined
14d
ays
Un
det
erm
ined
Un
det
erm
ined
14d
ays
14d
aysi
14d
ays’
14d
ays’

TA
BL
E5.
(co
nt.
)
Co
llect
ion
Sam
ple
Pre
sew
atio
nS
tora
ge
An
alys
esM
eth
od
aV
olu
meb
Co
nta
inef
Tec
hn
iqu
eC
on
dit
ion
sH
old
ing
Tim
esd
Wat
eran
dE
lutr
iate
Ch
emic
aVP
hys
icat
An
alys
es
Par
ticu
late
anal
ysis
Met
als
To
tal
Kje
ldah
lnit
rog
en
Ch
emic
alo
xyg
end
eman
d
To
tal
brg
anic
carb
on
To
tal
ino
rgan
icca
rbo
n
Ph
eno
licco
mp
ou
nd
s
So
lub
lere
acti
vep
ho
sph
ates
Ext
ract
able
org
anic
com
po
un
ds
(e.g
.,se
mi-
vola
tile
com
po
un
ds)
Vo
lati
leo
rgan
icco
mp
ou
nd
s
To
tal
ph
osp
ho
rus
Dis
cret
esa
mp
ler
or
pu
mp
Dis
cret
esa
mp
ler
or
pu
mp
Dis
cret
esa
mp
ler
or
pu
mp
Dis
cret
esa
mp
ler
or
pu
mp
Dis
cret
esa
mp
ler
or
pu
mp
Dk3
cret
esam
ple
ro
rp
um
p
Dis
cret
esa
mp
ler
or
pu
mp
Dis
cret
esa
mp
ler
or
pu
mp
Dis
cret
esa
mp
ler
or
pu
mp
Dis
cret
esa
mp
ler
or
pu
mp
Dis
cret
esa
mp
ler
or
pu
mp
500-
2,00
0m
LP
last
ico
rg
lass
ILA
cid
-rin
sed
po
lyet
hy-
len
eo
rg
lass
jai
100-
200
mL
Pla
stic
or
gla
ssk
200
mL
100
mL
100
mL
IL .- 4L 80m
L
..
Pla
stic
or
gla
ssk
Pla
stii
or
gla
ssk
Pla
stic
or
gla
ssk
Gla
ssk
Pla
stic
or
gla
ssk
Am
ber
gla
ssb
ott
l~
Gla
ssvi
aP
Pla
stic
or
gla
ssh
Lu
go
lsso
luti
on
and
refr
iger
ate
pH
z2
wit
hH
NO
~re
frig
eret
d
H2S
04to
PH
z2;
refr
iger
ate
H2S
04to
pH
c2;
refr
iger
ate
HzS
O,t
oP
Hs
2;re
frig
erat
e
Air
tig
hts
eal;
refr
iger
atek
0.1-
1.0g
CU
S04
;H
2S04
toP
H<2
;re
frig
erat
e
Filt
ecre
fng
erat
ek
pH
c2,
6NH
CI;
airt
igh
tsea
l;re
frig
erat
e
pH
c2
wit
h1:
1H
CU
refr
iger
ate
inai
rtig
ht,
com
ple
tely
fille
dco
n-
tain
e$
HzS
O,t
oP
H<2
;re
frig
erat
e
4°C
4°C
2“C
I
Qo
ck
Qo
ck
4“ck
bo
ck
bo
ck
bo
ck
40C
i
40C
i
Un
det
erm
ined
Hg
-14
day
sO
ther
s-6
mo
nth
sk
24h
k
7d
aysk
<48
ho
urs
k
6m
on
thsk
24h
ou
rsk
24h
ou
rsk
7d
ays
for
extr
ac-
tio
n;4
0d
ays
for
sam
ple
extr
act
anal
yses
i
14d
ays
for
sam
ple
anal
ysis
,ifp
re-
sew
ec#
7d
aysk
I.
.

TA
BL
E5.
(co
nt.
)
Co
llect
ion
Sam
ple
Pre
sew
atio
nS
tora
ge
An
alys
esM
eth
od
aV
olu
meb
Co
nta
ineF
Tec
hn
iqu
eC
on
dit
ion
sH
old
ing
Tim
esd
To
tals
olid
s
Vo
lati
leso
lids
Ref
rig
erat
e4o
ck
40&
4ock
7d
aysk
7d
aysk
24h
ou
rsk
Dis
cret
esa
mp
ler
or
pu
mp
Dis
cret
esa
mp
ler
or
pu
mp
Dis
cret
esa
mp
ler
or
pu
mp
Gra
b
Gra
bo
rm
akeu
p
Tra
wl/T
eflo
ne-
coat
edg
rab
Tra
wf/
Tef
lon
”-co
ated
gra
b
200
mL
Pla
stic
or
gla
ss’
200
mL
Pla
stic
or
gla
ssk
..P
last
ico
rg
lass
k
Ref
rig
erat
e
Su
lfid
es
Bio
log
ical
Tes
ts
Sit
ew
ater
Dilu
tio
nw
ater
Tis
sue M
etal
s
PC
BS
and
chlo
rin
ated
pes
tici
des
pH
>9N
aOH
(Zn
Ac)
;re
frig
erat
e
Dep
end
so
nte
sts
Pla
stic
carb
oy
bei
ng
pw
fon
ned
Dep
end
so
nte
sts
Pla
stic
carb
oy
bei
ng
peu
form
ed
Ref
rig
erat
e<
4°C
<4°
C
14d
ays
14d
ays
Ref
rig
erat
e
5-1o
gD
ou
ble
Zip
loc-
<-2
0”C
”o
rfr
eeze
rst
ora
ge
Hg
-28
day
sO
ther
s-6
mo
nth
s”
14d
aysg
Han
dle
wit
hn
on
-m
etal
licfo
rcep
s;p
last
icg
love
s;d
ryic
e”
10-2
5g
Hex
ane-
rin
sed
do
ub
leal
um
inu
mfo
ilan
dd
ou
ble
Zip
loce
Han
dle
wit
hh
exan
e-ri
nse
dst
ain
less
stee
lfo
rcep
sd
ryic
e’
<-2
0”C
0o
rfr
eeze
rst
ora
ge
Vo
lati
leo
rgan
icco
mp
ou
nd
sT
raw
l/Tef
lon
”-co
ated
gra
b
Tra
wV
Tef
lon
e-co
ated
gra
b
Co
vere
dic
ech
estf
<-2
0”C
mo
rfr
eeze
rst
ora
ge
14d
ays”
10-2
5g
Hea
t-cl
ean
edal
um
-in
um
foil
and
wat
er-
tig
htp
last
icb
ag’
Sem
ivo
lati
leo
rgan
icco
mp
ou
nd
sI
10-2
5g
Hex
ane-
rin
sed
do
ub
leal
um
inu
mfo
ilan
dd
ou
ble
Zip
loc*
Han
dle
wit
hh
exan
e-ri
nse
dst
ain
less
stee
lfo
rcep
s;d
ryic
e*
s-2
0”C
*o
rfr
eeze
rst
ora
ge
14d
aysg
I IL
ipid
sI
Tra
w~e
flo
na-
coat
edg
rab
Par
to
fo
rgan
icH
exan
e-ri
nse
dal
um
i-an
alys
esn
um
foil
14d
aysg
Han
dle
wit
hh
exan
e-ri
nae
dst
ain
less
stee
lfo
rcep
s;q
uic
kfr
eeze
5-2
0”C
or
free
zer
sto
rag
e
Th
ista
ble
con
tain
so
nly
asu
mm
ary
ofc
olle
ctio
n,p
rese
rvat
ion
,an
dst
ora
ge
pro
ced
ure
sfo
rsa
mp
les.
Th
eci
ted
refe
ren
ces
sho
uld
be
con
sult
edfo
ra
mo
red
etai
led
des
crip
tio
no
fth
ese
pro
ced
ure
s.N
ote
:

2.5.8.1 Sample Handling
Sufficient sample volume should be collected to:
Petform the necessary analyses
Partition the samples, either in the field or as soon as possibleafter sampling, for respective storage and analytical requirements(e.g., freezing for trace metal analysis or refrigeration forbioassays)
Archive portions of the sample for possible later analysis.
Provide sample for replicate or QA analyses, if specified.
handling is project- and analysis-specific, as well as beingwhat is practical and possible. Generally, samples to be analyzed
based onfor trace
metals should not come into contact with metals, and samples to be analyzedfor organic compounds should not come into contact with plastics. All samplecontainers should be scrupulously cleaned (acid-rinsed for analysis of metals,solvent-rinsed for analysis of organic compounds).
For analysis of volatile compounds, samples should completely fill the storagecontainer, leaving no airspace. These samples should be refrigerated but neverfrozen or the containers will crack. Samples for other kinds of chemicalanalysis are sometimes frozen. Only wide-mouth (“squat”) jars should be usedfor frozen samples; narrow-mouth jars are less resistant to cracking. If thesample is to be frozen, sufficient air space should be left to allow expansion totake place (i.e., the wide-mouth sample container should be filled to no morethan the shoulder of the bottle Dust below the neck of the bottle] and thecontainer should be frozen at an angle). Container labels have to withstandsoaking, drying, and freezing without becoming detached or illegible. Thelabeling system should be tested prior to use in the field.
Sediment samples for biological testing should have larger (possible predato~)animals removed from the sediment by screening or press sieving prior totesting. Other matter retained on the screen with the organisms, such as shellfragments, gravel, and debris, should be recorded and discarded. Prior to usein bioassays, individual test sediments should be thoroughly homogenized withclean instruments (until color and textural homogeneity is achieved).
2.5.8.2 Sample Preservation
Preservation steps should be taken immediately upon sediment collection.There is no universal preservation or storage technique, although storage in thedark at 4°C is generally used for all samples held for any length of time prior toprocessing, and for some samples after processing. A technique for one group
.——
58-

2.5.9
of analyses may interfere with other analyses. This problem can be overcomeby collecting sufficient sample volume to use specific preservation or storagetechniques for specific analytes or tests. Preservation, whether by refrigeration,freezing, or addition of chemicals, should be accomplished as soon as possibleafter collection, onboard the collecting vessel whenever possible. If finalpreservation techniques cannot be implemented in the field, the sample shouldbe temporarily preserved in a manner that retains its integrity.
Onboard refrigeration is easily accomplished with coolers and ice; however,samples should be segregated from melting ice and cooling water. Sedimentsamples that are to be frozen on board may be stored in an onboard freezer ormay simply be placed in a cooler with dry ice or blue ice. Sample containers tobe frozen (wide-mouth jars; see Section 2.5.7.1) should not be filled completelybecause expansion of the sample could cause the container to break.Sediment samples for biological analysis should be presewed at 4°C, neverfrozen or dried. Additional guidance on sample preservation is given in Table 5.
2.5.8.3 Sample Storage
The elapsed time between sample collection and analysis should be as short aspossible. Sample holding times for chemical evaluations are analysis-specific(Table 5). Sediments for bioassay (toxicity and/or bioaccumulation) testingshould be tested as soon as possible, preferably within 2 weeks of collection.Sediment toxicity does change with time. Studies to date suggest thatsediment storage time should never exceed 8 weeks (at 4°C, in the dark,excluding air) (Becker and Ginn 1990; Tatem et al. 1991) because toxicitychange with storage time. Sample storage. conditions (e.g., temperature,location of samples) should be documented.
Logistical Considerations and Safety Precautions
may
A number of frustrations in sample collection and handling can be minimized bycarefully thinking through the process and requirements before going to thefield. Contingency plans are essential. Well-trained, qualified, and experiencedfield crews should be used. Backup equipment and sampling gear, andappropriate repair parts, are advisable. A surplus of sampling containers andfield data sheets should be available. Sufficient ice and adequate ice chestcapacity should be provided, and the necessity of replenishing ice beforereaching the laboratory should be considered. A vessel with adequate deckspace is safer and allows for more efficient work than an overcrowded vessel.Unforeseeable circumstances (e.g., weather delays) are to be expected duringfield sampling, and time to adequately accommodate the unforeseen has to beincluded in sampling schedules.
59

2.6
2.6.1
Appropriate safety and health precautions must be obsemed during fieldsampling and sample processing activities. The EPA Standard OperatingSafety Guides (U.S. EPA 1984b) should be used as a guidance document toprepare a site-specific health and safety plan. The health and safety planshould be prepared as a separate document from the QA project plan.Requirements implementing the Occupational Safety and Health Act at 29 CFR$1910.120 (Federal Register, Vol. 54, No. 43) should be met for medicalsurveillance, personal protection, respirator fit testing (if applicable), andhazardous waste operations training (if applicable) by all personnel working incontaminated areas or working with contaminated media.
The procedures and practices established in the site-specific health and safetyplan should be observed by all individuals participating in the field activities.Safety requirements should also be met by all observers present during fieldaudits and inspections. The plan should include the following information:
■
■
■
■
9
■
■
■
■
Site location and history
Scope of work
Site control
Hazard assessment (chemical and physical hazards)
Levels of protection and required safety equipment
Field monitoring requirements
Decontamination
Training and medical monitoring requirements
Emergency planning and emergency contacts.
SAMPLE CUSTODY
Recordkeeping procedures are described in detail in this section of the QAproject plan, including specific procedures to document the physical possessionand condition of samples during their transport and storage. This section alsodescribes how excess or used samples will be disposed of at the end of theproject.
Sample Custody and Documentation
Sample custody and documentation are vital components of all dredgedmaterial evaluations, particularly if any of the data may be used in a court oflaw. It is important to record a~ events associated wi~ha sample so that thevalidity of the resulting data may be properly interpreted. Thorough
-. .-
60
documentation provides a means to track samples from the field through thelaboratory and prevent sample loss. The contents and location of alldocuments related to dredged sediment samples should be specified, andaccess to the samples should be controlled.
The possession of samples should be documented from sample collectionthrough laboratory analysis. Recording basic information during samplehandling is good scientific practice even if formal custody procedures are notrequired. Sample custody procedures, including examples of forms to be used,should be described in the QA project plan. Minimum requirements fordocumentation of sample handling and custody on simple projects shouldinclude the following information:
■ Sample location, project name, and unique sample number
■ Sample collection date (and time if more than one sample may becollected at a location in a day)
■ Any special notations on sample characteristics or problems
■ Initials of the person collecting the sample
■ Date sample sent to the laboratory
■ Conditions under which the samples were sent to the Iaboratoty.
For large or sensitive projects that may result in enforcement actions or otherlitigation, a strict system for tracking sample custody should be used to assurethat one individual has responsibility for a set of samples at all times. For theseprojects, only data that have clear documentation of custody can be acceptedwithout qualification.
A strict system of sample custody implies the following conditions:
■ The sample is possessed by an individual and secured so that noone can tamper with it
■ The location and condition of the sample is known anddocumented at all times
■ Access to the sample is restricted to authorized personnel only.
Where samples may be needed for potential litigation, chain-of-custodyprocedures should be followed. Chain-of-custody procedures are initiatedduring sample collection. Chain-of-custody forms are often used to documentthe transfer of a sample from collection to receipt by the laboratory (or betweendifferent facilities of one laboratory). Although not always required, these formsprovide an easy means of recording information that may be useful weeks ormonths after sample collection. When these forms are used, they are provided
61

to field technicians atthebeginning of a project. The completed formsaccompany the samples to the laboratory and are signed by the relinquisherand receiver every time the samples change hands. After sample analysis, theoriginal chain-of-custody form is returned by the laboratory. The form is filedand becomes part of the permanent project documentation. An example of achain-of-custody form is provided in Appendix A. Additional custodyrequirements for field and laboratory operations should be described in the QAproject plan, when appropriate.
When in doubt about the level of documentation required for sampling andanalysis, a strict system of documentation using standard forms should beused. Excess documentation can be discarded; lack of adequatedocumentation in even simple projects sometimes creates the unfortunateimpression that otherwise reasonable data are unusable or limited. Formalchain-of-custody procedures are outlined briefly in the statements of work forlaboratories conducting analyses of organic and inorganic contaminants underEPA’s Contract Laboratory Program (CLP) (U.S. EPA 1990d,e).
2.6.1.1 Field Operations
The potential for sample deterioration and/or contamination exists duringsample collection, handling, preservation, and storage. Approved protocols andstandard operating procedures should be followed to ensure all field samplingequipment is acceptably calibrated and to prevent deterioration orcontamination. Experienced personnel should be responsible for maintainingthe sample integrity from collection through analysis, and field operations shouldbe overseen by the project manager. A complete record of all field procedures,an inventory log, and a tracking log should be maintained. A field trackingreport (see example in Appendix A) should identify sample custody andconditions in the field prior to shipment.
Dates and times of collection, station locations, sampling methods, and samplehandling, preservation, and storage procedures should be documentedimmediately, legibly, and indelibly so that they are easily traceable. Anycircumstances potentially affecting sampling procedures should be documented.The data recorded should be thorough enough to allow station relocation andsample tracking. An example of a station location log is provided inAppendix A. Any field preparation of samples should also be described. Inaddition, any required calibration performed for field instruments should bedocumented in the field logbook. Samples should be identified with apreviously prepared label (see example in Appendix A) containing at least thefollowing information:
Project title
Sample identification number
62

■
■
9
9
■
m
■
2.6.1.2
Location (station number) and depth
Analysis or test to be performed
Preservation and storage method
Date and time of collection
Special remarks if appropriate
Initials of person collecting the sample
Name of company performing the work.
Laboratory Operations
Documentation is necessary in the laboratory where chemical and biologicalanalyses are performed. A strict system of sample custody for laboratoryoperations should include the following items:
■ Appointment of a sample custodian, authorized to check thecondition of and sign for incoming field samples, obtain documentsof shipment, and verify sample custody records
■ Separate custody procedures for sample handling, storage, anddisbursement for analysis in the laboratory
= A sample custody log consisting of serially numbered, standardlaboratory tracking report sheets.
A laboratory tracking report (Appendix A) should be prepared for each sample.The location of samples processed through chain-of-custody must be known atall times. Samples to be used in a court of law must be stored in a lockedfacility to prevent tampering or alteration.
A procedure should be established for the retention of all field and laboratoryrecords and samples as various tasks or phases are completed. Replicates,subsamples of analyzed samples, or extra unanalyzed samples should be keptin a stor~ bank. These samples can be used to scrutinize anomalous rqsultsor for ,@@plementalanalyses, if additional information is needed. All samplesshould be properly stored and inventoried. The retention and archivingprocedure should indicate the storage requirements, location, indexing codes,retention time, and security requirements for samples and data.
63

2.6.2
2.7
Storage and Disposal of Samples
In the statement of work, the laboratory should be instructed to retain all
remaining sample material (under appropriate temperature and light conditions)
at least until after the QA review has been completed. In addition, sampleextracts or digestates should be appropriately stored until disposal is approvedby the project manager. With proper notice, most laboratories are willing toprovide storage for a reasonable time period (usually on the order of weeks)following analysis. However, because of limited space at the laboratory, theproject manager may need to make arrangements for long-term storage atanother facility.
Samples must be properly disposed when no longer needed. Ordinary sample-disposal methods are usually acceptable, and special precautions are seldomappropriate. Under Federal law [40 CFR 261.5(a)], where highly contaminatedwastes are involved, if the waste generated is less than 100 Kg per month, thegenerator is conditionally exempt as a small-quantity generator and mayaccumulate up to 1,000 Kg of waste on the property without being subject tothe requirements of Federal hazardous waste regulations. However, State andlocal regulations may require special handling and disposal of contaminatedsamples. When samples have to be shipped, 49 CFR 100-177 should beconsulted for current Department of Transportation regulations on packing andshipping.
Over the last few years, there has been a growing awareness of the ecologicaland economic damage caused by introduced species. Because both east andwest coast species are often used in bioaccumulation tests, there is a realpotential of introducing bioaccumulation test Species or associated fauna andflora (e.g., pathogens, algae used in transporting the worms). It is theresponsibility of the persons conducting the bioaccumulation or toxicity tests toassure that no non-indigenous species are released. The general proceduresto contain non-indigenous species are to collect and then poison all water,sediment, organisms and associated packing materials (e.g., algae, sediment)before disposal. Chlorine bleach can be used as the poison. A doublecontainment system is used to keep any spillage from going down the drain.Guidance on procedures used in toxicity tests can be found in Appendix B ofDeWitt et al. (1992a). Flow-through tests can generate large quantities ofwater, and researchers should plan on having sufficient storage facilities.
CALIBRATION PROCEDURES AND FREQUENCY
Procedures for minimizing bias and properly maintaining the precision of eachpiece of equipment to be used in the field or laboratory are detailed in thissection of the QA project plan. Procedures are also described for obtaining,using, and storing chemical standards of known purity used to quantify
64

analytical results, and reference chemicals used as positive controls in toxicitytests. Instruments that require routine calibration include, for example,navigation devices, analytical balances, and water quality meters.
Calibration of analytical instruments is a high priority and is always required forany project requiring quantitative data (even if only estimated quantities arenecessary). Calibration is essential because it is the means by whichinstrument responses are properly translated into chemical concentrations.
Instrument calibration is performed before sample analysis begins and is
continued during sample analysis at intervals specified in each analyticalmethod to ensure that the data quality objectives established for a project aremet.
Because there are several analytical techniques that can be used for the sametarget analyte, each of which may provide different guidance for performinginstrument calibration, it is important to establish a minimum calibrationprocedure for any chemical analysis that will be performed. Uniform adherenceto a minimum calibration procedure will also improve the comparability of datagenerated by multiple laboratories that may be used for a specific project oramong projects. All requirements for performing instrument calibrations shouldbe clearly stated in the QA project plan and the laboratory statement of workprepared for any project.
In addition to performing instrument calibrations, the acceptability of thecalibrations pedormed should be evaluated. To provide control over thecalibration process, specific guidelines should be specified. The basic elementsof the calibration process include the calibration frequency, number ofcalibration standards and their concentrations, and the calibration acceptancecriteria. A summary of these elements is provided below.Examples of the differences in calibration procedures (specifically for theanalysis of organic compounds) for different analytical methods are provided inTable 6.
2.7.1 Calibration Frequency
The general process of verifying that an instrument is functioning acceptably isto perform initial and continuing calibrations. Initial calibration should beperformed prior to sample analysis to determine whether the response of theinstrument is linear across a range of target analyte concentrations (i.e., theworking linear range). In addition to establishing the initial calibration for aninstrument, it is critical that the stability of the instrument response be verifiedduring the course of ongoing sample analyses. The verification of instrumentstability is assessed by analyzing continuing calibration standards at regularintervals during the period that sample analyses are performed. Although each
analytical method provides guidance for the frequency at which continuing
— -.
65 ”--” -
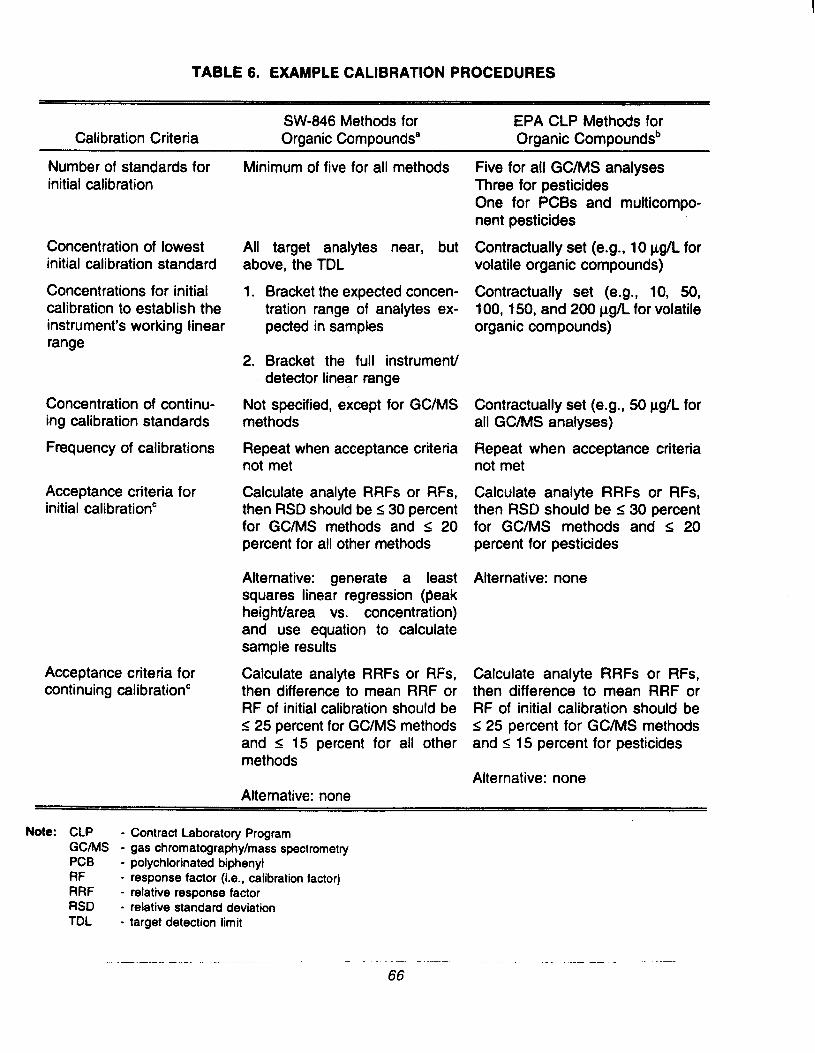
SW-646 Methods for EPA CLP Methods forCalibration Criteria Orqanic Compoundsa Organic Compoundsb
Number of standards forinitial calibration
Concentration of lowestinitial calibration standard
Concentrations for initialcalibration to establish theinstrument’s working linearrange
Concentration of continu-ing calibration standards
Frequency of calibrations
Acceptance criteria forinitial calibration’
Acceptance criteria forcontinuing calibration’
Minimum of five for all methods
All target analytes near, butabove, the TDL
1. Bracket the expected concen-tration range of analytes ex-pected in samples
2. Bracket the full instrument/detector linear range
Not specified, except for GC/MSmethods
Repeat when acceptance criterianot met
Calculate analyte RRFs or RFs,then RSD should be< 30 percentfor GC/MS methods and < 20percent for all other methods
Alternative: generate a leastsquares linear regression (peakheight/area vs. concentration)and use equation to calculatesample results
Calculate analyte RRFs or RFs,then difference to mean RRF orRF of initial calibration should be<25 percent for GC/MS methodsand < 15 percent for all othermethods
Alternative: none
Five for all GC/MS analysesThree for pesticidesOne for PCBS and multicompo-nent pesticides
Contractually set (e.g., 10 pg/L forvolatile organic compounds)
Contractually set (e.g., 10, 50,100, 150, and 200 @L for volatileorganic compounds)
Contractually set (e.g., 50 yg/L forall GC/MS analyses)
Repeat when acceptance criterianot met
Calculate analyte RRFs or RFs,then RSD should be s 30 percentfor GC/MS methodspercent for pesticides
Alternative: none
and < 20
Calculate analyte RRFs or RFs,then difference to mean RRF orRF of initial calibration should bes 25 percent for GC/MS methodsand <15 percent for pesticides
Alternative: none
Note: CLP - Contract Laboratory ProgramGC/MS - gas chromatography/mass spectrometryPCB - polychlorinated biphenylRF - response factor (i.e., calibrationfactor)RRF - relative response factorRSD - relative standard deviationTDL - target detection limit
. —— . . -—
66

TABLE 6. (cont.)
‘ U.S. EPA (1986a).
bU.S. EPA (1990b).
cThe acceptance criteria for instrumentcalibration (i.e., initialand continuingcalibration)may not be available for all organiccompoundslisted in Table 3 (e.g., resin acids and guaiacols). The determinationof acceptable instrumentcalibrationcriteriafor organic compounds not specificallystipulated in SW-846 or EPA CLP methods should be assessed using best professionaljudgment (e.g., s 50 percent RSD).
67 -

2.7.2
calibration standards should be petformed, it is recommended that at aminimum these standards be analyzed at the beginning of each analytical fortable 6 sequence, after every tenth sample, and at the end of the analyticalsequence for all organic and inorganic compound analyses performed. Theconcentration of the continuing calibration standard should be equivalent to theconcentration of the midpoint established during initial calibration of the workinglinear range of the instrument.
Number of Calibration Standards
Specific instrument calibration proceduresmethods; however, a wide variation existsstandards specified for different analyses.
are provided in most analyticalin the number of calibrationTo ensure that consistent and
reliable data are generated, a minimum number of calibration standards shouldbe required for all laboratories performing chemical analyses.
Typically, as the number of calibration standards increases, the reliability of theresults increases for concentrations detected above the TDL. The specificstandards that are selected for calibration can have a significant impact on thevalidity of the data generated. Calibration standards should be established withrespect to the range of standards required, the TDLs selected, and the linearrange of the target analytes desired. Specific requirements for establishing thenumber of calibration standards, including recommendations on theconcentrations to use, will be different for organic and inorganic analyses;however, some general recommended guidelines are provided below.
The working linear range of an instrument should be established prior toperforming sample analyses. A minimum of five calibration standards for theanalysis of organic compounds and three calibration standards for the analysisof inorganic compounds should be used when establishing the working linearrange for all target analytes of concern. Generally, the working linear range ofan instrument for a specific analysis should bracket the expected concentrationsof the target analyte in the samples to be analyzed. In some instances,however, it may not be known what analyte concentrations to expect. A 5-pointinitial calibration sequence is recommended to establish the working linearrange for organic chemical analyses.
In addition to the number of standards analyzed, the difference between theconcentration of the lowest standard and the TDL and the difference betweeneach standard used to establish the initial calibration are critical. The selectionof the lowest initial calibration standard concentration will provide moreconfidence in the documented bias of results reported as undetected at the TDLor any results reported at very low concentrations. The selection of thisstandard will also ensure that target anaiytes can be reliably detected aboveinstrument background noise and potential matrix interferences. For the
— -. .- . —.68

dredged material program, this standard should be no lower than the TDLprovided in Table 3.
The decision as to which specific concentrations (i.e., calibration range) shouldbe used for a multipoint calibration requires careful consideration. Whilemethods established by EPA CLP protocols provide stringent requirements forcalibration analyses, these requirements are not clearly specified for otheranalytical methods (e.g., SW-846 methods) (see Table 6). A 5-point initialcalibration sequence is recommended for all non-CLP methods. Theconcentrations of all standards should range from the lowest concentrationmeeting the requirements suggested above to the highest standardconcentration equivalent to the upper linear range of the instrument/detectorconfiguration. The concentrations of the remaining three standards should beevenly distributed between these concentrations. The calibration standardsused to establish the working linear range should encompass a factor of 20(i.e., 1 to 20, with the lowest concentration equal to 1 and the highestconcentration equal to 20 times the concentration of the lowest concentrationused).
2.7.3 Calibration Acceptance Criteria
Once the initial calibration has been performed, the acceptability of thecalibration should be assessed to ensure that the bias of the data generatedwill be acceptable; this assessment should be performed by all laboratoriesprior to the analysis of any sample. In addition, the acceptability of allcontinuing calibrations should be assessed.
Although each analytical method provides-guidance for determining theacceptability of instrument calibrations, there are multiple options available (e.g.,least squares linear regression, percent relative standard deviations, andpercent differences). A specific set of acceptance criteria should be determinedprior to sample analysis, and these criteria should be contractually binding toavoid unnecessary qualification or rejection of the data generated. A summaryof the most widely used calibration acceptance criteria currently in use fororganic analyses is provided in Table 6. Calibration acceptance criteria shouldbe used to assess the acceptability of the initial calibration sequence in terms ofthe relationship between the intercept of the calibration cuwe (i.e., the x-yintercept) and the predetermined TDLs and the overall reliability of the workinglinear range established.
The general criteria specified by SW-846 methods are typically more stringentfor organic analyses than the EPA CLP requirements. Acceptance criteria, assummarized in Table 6, should be clearly defined before sample analyses areperformed. All specific acceptance criteria for calibrations should be stated inthe QA project plan and the laboratory statement of work.
69

2.8
2.8.1
ANALYTICAL PROCEDURES
The methods cited in this section may be used to meet general data qualityobjectives for dredged material evaluations. However, other methods mayprovide similar results, and the final choice of analytical procedures should bebased on the needs of each evaluation. In all cases, proven, current methodsshould be used; EPA-approved methods, if available, are preferred. Sampleanalysis procedures are identified in this section by reference to established,standard methods. Any modifications to these procedures and any specialized,nonstandard procedures are also described in detail. When preparing a QAproject plan, only modifications to standard operating procedures or details ofnon-standard procedures need to be described in this section of the plan.
Any dredged material from estuarine or marine areas contains salt, which caninterfere with the results obtained from some analytical methods. Any methodsproposed for the analysis of sediment and water from estuarine or marineenvironments should explicitly address steps taken to control salt interference.
The following sections provide guidance on the selection of physical andchemical analyses to aid in evaluating dredged material proposed for disposal,and on the methods used to analyze these parameters. Information on thechemicals on the EPA priority pollutant and hazardous substance lists isprovided in Appendix E.
Physical Analysis of Sediment
Physical characteristics of the dredged mateflal must be determined to helpassess the impact of disposal on the benthic environment and the water columnand to help determine the appropriate dredging methods. This is the first stepin the overall process of sediment characterization, and also helps to identifyappropriate control and reference sediments for biological tests. In addition,physical analyses can be helpful in evaluating the results of analyses and testsconducted later in the characterization process.
The general analyses may include grain size distribution, total solids content,and specific gravity. Grain size analysis defines the frequency distribution ofthe size ranges of the particles that make up the sediment (e.g., Plumb 1981;Folk 1980). The general size classes of gravel, sand, silt, and clay are themost useful in describing the size distribution of particles in dredged materialsamples. Use of the Unified Soil Classification System (USCS) for physicalcharacterization is recommended for the purpose of consistency with USACEengineering evaluations (ASTM 1992).
Measurement of total solids is a gravimetric determinationinorganic material remaining in a sample after it has been
of the organic anddried at a specified
70

temperature. Thetotal solids values generally areused to convertconcentrations of contaminants from a wet-weight to a dry-weight basis.
The specific gravity of a sample is the ratio of the mass of a given volume ofmaterial to an equal volume of distilled water at the same temperature (Plumb1981). The specific gravity of a dredged material sample helps to predict thebehavior (i.e., dispersal and settling characteristics) of dredged material afterdisposal.
Other physical/engineering properties (e.g., Atterburg limits, settling properties)may be needed to evaluate the quality of any effluent discharged from confineddisposal facilities, QA considerations for physical analysis of sediments aresummarized in Section 2.10.3.
2.8.2 Chemical Analysis of Sediment
Chemical analysis provides information about the chemicals present in thedredged material that, if biologically available, could cause toxicity and/or bebioaccumulated. This information is valuable for exposure assessment and fordeciding which of the contaminants present in the dredged material to measurein tissue samples. This section discusses the selection of target analytes andtechniques for sediment analyses. QA considerations are summarized inSection 2.10.4.
2.8.2.1 Select/on of Target Ana/ytes
If the review of data from previous studies-suggests that sediment contaminantsmay be present (see Section 2.5,2), but fails to produce sufficient information todevelop a definitive list of potential contaminants, a list of target analytes shouldbe compiled. Target analytes should be selected from, but not necessarilylimited to, those listed in Table 3. The target analyte list should also includeother contaminants that historical information or commercial and/or agriculturalapplications suggest could be present at a specific dredging site (e.g., tributyltinnear shipyards, berthing areas, and marinas where these compounds havebeen applied). Analysis of polycyclic aromatic hydrocarbons (PAHs) in dredgedmaterial should focus on those PAH compounds listed in Table 3.
All PCB analyses should be made using congener-specific methods. The sumof the concentrations of specific congeners is an appropriate measure of totalPCBS (NOAA, 1989). Congener-specific analyses also provide data that can beused for specialized risk assessments that reflect the widely varying toxicity ofdifferent PCB congeners.
71

Sediments should be analyzed for TOC. This is particularly impottant if thereare hydrophobic organic compounds on the target analyte list. The TOCcontent of sediment is a measure of the total amount of oxidizable organicmaterial in a sample and also affects contaminant bioaccumulation by, andeffects to, organisms (e.g., DeWitt et al. 1992b; Di Toro et al. 1991).
Sediments in which metals are suspected to be contaminants of concern mayalso be analyzed for acid volatile sulfide (AVS) (Di Toro et al. 1990; U.S. EPA1991a). Although acceptable guidance on the interpretation of AVSmeasurements is not yet available, and AVS measurements are not generallyrequired at this time, such measurements can provide information on thebioavailability of metals in anoxic sediments.
2.8.2.2 Selection of Analytical Techniques
Once the list of project-specific target analytes for sediments has beenestablished, appropriate analytical methods should be determined (see Section2.3). The analytical methods selected must be able to meet the TDLsestablished to meet the requirements of the intended uses of the data. Also,the methods selected will, to some degree, dictate the amount of sedimentsample required for each analysis. Examples of methods that can be used tomeet TDLs for dredged material evaluations are provided in Table 3. Generalsample sizes are provided in Table 5, and include possible requirements formore than one analysis for each group of analytes. The amount of sampleused in an analysis affects the detection limits attainable by a particularmethod. The following overview summarizes various factors to be consideredwhen selecting analytical methods for physical, inorganic, and organic analyses.
TOC analyses should be based on high-temperature combustion rather than onchemical oxidation, because some classes of organic compounds are not fullydegraded by chemical/ultraviolet techniques. The volatile and nonvolatileorganic components make up the TOC of a sample. Because inorganic carbon(e.g., carbonates and bicarbonates) can be a significant proportion of the totalcarbon in some sediment, the sample has to be treated with acid to remove theinorganic carbon prior to TOC analysis. The method of Plumb (1981)recommends the use of hydrochloric acid. An alternative choice might besulfuric acid because it is nonvolatile, is used as the preservative, and does notadd to the chloride burden of the sample. However, some functional groups(e.g., carboxylic acids) can be oxidized when inorganic carbonates are removedusing both a non-oxidizing and an oxidizing acid. Whatever acid is used, it hasto be demonstrated on sodium chloride blanks (for all marine samples) thatthere is no interference generated from the combined action of acid and salt inthe sample. Acceptable methods for TOC analysis are provided in PSEP(1986) and U.S. EPA (1992b).
72

For many metals analyses in marine/estuarine areas, the concentration of saltmay be much greater than the concentration of the analyte of interest, and cancause unacceptable interferences in certain analytical techniques. In suchcases, the freshwater approach of acid digestion followed by inductively coupledplasma-atomic emission spectrometry (ICP) or graphite furnace atomicabsorption spectrometry (GFAA) should be coupled with appropriate techniquesfor controlling this interference. For example, the mercury method in U.S. EPA(1986a; Method 7471) maybe used for the analysis of mercury in sediment.Tributyltin maybe analyzed by the methods of Rice et al. (1987) and NCASI(1986), and selenium and arsenic by the method of EPRI (1986). Totaldigestion of metals is not necessary for dredged material evaluations, althoughthis technique is used for complete chemical characterizations in some nationalprograms (e.g., NOAA Status and Trends). The standard aqua regia extractionyields consistent and reproducible results. The recommended method foranalysis of semivolatile and volatile priority pollutants in sediments is describedin Tetra Tech (1986a), and is a modified version of established EPA analyticalmethods designed to achieve lower and more reliable detection limits. Analysisfor organic compounds should always use capillary-column gas chromatography(GC): gas chromatography/mass spectrometry (GC/MS) techniques forsemivolatile and volatile priority pollutants, and dual column gaschromatography/electron-capture detection (GC/ECD) for pesticides and PCBS(NOAA 1989). Alternatively, GC/MS using selected ion monitoring can be usedfor PCB and pesticide analysis. These analytically sound techniques yieldaccurate data on the concentrations of chemicals in the sediment matrix. Theanalytical techniques for semivolatile organic compounds generally involvesolvent extraction from the sediment matrix and subsequent analysis, aftercleanup, using GC or GC/MS. Extensive cleanup is necessitated by thelikelihood of 1) biological macromolecules, 2) sulfur from sediments with low orno oxygen, and 3) oil and/or grease in the s~diment. The analysis of volatileorganic compounds incorporates purge-and-trap techniques with analysis byeither GC or GC/MS. If dioxin (i.e., 2,3,7,8-tetrachlorodibenzo-p-dioxin ~CDD])analysis is being petiormed, the methods of Kuehl et al. (1987), Smith et al.(1984), U.S. EPA (1989b; Method 8290), or U.S. EPA (1990f; Method 1613)should be consulted. EPA Method 1613 is the recommended procedure formeasuring the tetra- through octa- polychlorinated dibenzo-p-dioxins (PCDDS)and polychlorinated dibenzofurans (PCDFS). This method has been developedfor analysis of water, soil, sediment, sludge, and tissue. Table 7 shows the 17compounds determined by Method 1613.
Techniques for analysis of chemical contaminants have some inherentlimitations for sediment samples. Intederences encountered as part of thesediment matrix, particularly in samples from heavily contaminated areas, maylimit the ability of a method to detect or quantify some analytes. The mostselective methods using GC/NIS techniques are recommended for allnonchlorinated organic compounds because such analysis can often avoid
73

TABLE 7. PCDD and PCDF Compounds Determined by Method 1613
Native Compound’ 2,3,7,8-TCDF2,3,7,8-TCDD
1,2,3,7,8-PeCDF2,3,4,7,8-PeCDF1,2,3,7,8-PeCDD
1,2,3,4,7,8-HxCDF1,2,3,6,7,8-HxCDF2,3,4,6,7,8-HxCDF1,2,3,4,7,8-HxCDD1,2,3,6,7,8-HxCDD1,2,3,7,8,9-HxCDD1,2,317,8,9-HxCDF
1,2,3,4,6,7,8-HpCDF1,2,3,4,6,7,8-HpCDD1,2,3,4,7,8,9-HpCDF
OCDDOCDF
1 Polychlorinated Dioxins and Furans
TCDD =TCDF =PeCDD =PeCDF =HxCDD =HxCDF =HpCDD =HpCDF =OCDD =OCDF =
Tetrachlorodibenzp-p-dioxinTetrachlorodibenzofu ranPentachlorodibenzo-p-dioxinPentachlorodibenzofuranHexachlorodibenzo-p-dioxinHexachlorodibenzofuranHeptachlorodibenzo-p-dioxinHeptachlorodibenzofuranOctachlorodibenzo-p-dioxinOctachlorodibenzofuran
74

problems due to matrix intederences. GC/ECD methods are recommended bythe EPA as the primary analytical tool for all PCB and pesticide analysesbecause GC/ECD analysis (e.g., NOAA 1989) will result in lower detectionlimits. The analysis and identification of PCBS by GC/ECD methods are basedupon relative retention times and peak shapes. Matrix interferences may resultin the reporting of false negatives, although the congener-specific PCB analysisreduces this concern relative to use of the historical Aroclo~-matchingprocedure.
For dredged material evaluations, the concentration of total PCBS should bedetermined by summing the concentrations of specific individual PCBcongeners identified in the sample (see Table 8). The minimum number ofPCB congeners that should be analyzed are listed in the first column of Table 7(i.e., “summation” column) (NOAA 1989). This summation is considered themost accurate representation of the PCB concentration in samples. AdditionalPCB congeners are also listed in Table 8. McFarland and Clarke (1989)recommend these PCB congeners for analysis based on environmentalabundance, persistence, and biological importance. Sample preparation forPCB congener analysis should follow the techniques described in Tetra Tech(1986a) or U.S. EPA (1986a), but with instrumental analysis and quantificationusing standard capillary GC columns on individual PCB isomers according tothe methods reported by NOAA (1989) (see also Dunn et al. 1984; Schwartz etal. 1984; Mullin et al. 1984; Stalling et al. 1987).
Although the methods mentioned above are adequate for detecting andquantifying concentrations of those PCB congeners comprising the majority oftotal PCBS in environmental samples, they are not appropriate for separatingand quantifying PCB congeners which may coelute with other congeners and/ormay be present at relatively small concentrations in the total PCB mixture.Included in this latter group of compounds, for example, are PCBS 126 and169, two of the more toxic nonortho-substituted PCB congeners (Table 8). Inorder to separate these (and other toxic nonortho-substituted conveners), it isnecessary to initially utilize an enrichment step with an activated carbon column(Smith 1981). Various types of carbon columns have been used, ranging fromsimple gravity columns (e.g., in a Pasteur pipette) to more elaborate (andefficient) columns using high-pressure liquid chromatography (HPLC) systems(see Schwartz et al. 1993). The preferred method of separation andquantitation of the enriched PCB mixture has been via high resolution GC/MSwith isotope dilution (Kuehl et al. 1991; Ankley et al. 1993; Schwartz et al.1993). However, recent studies have shown that if the carbon enrichment isdone via HPLC, the nonortho-substituted PCB congeners of concern also maybe quantifiable via more widely available GC/ECD systems (Schwartz et al.1993).
75
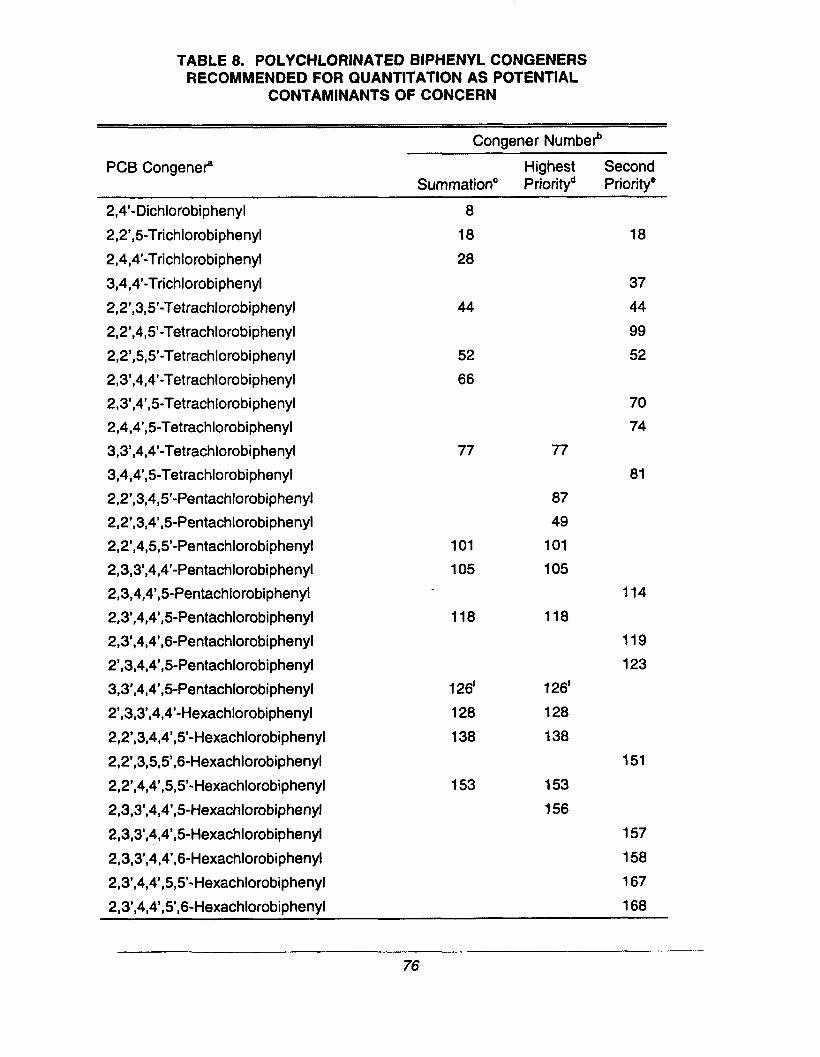
TABLE 8. POLYCHLORINATED BIPHENYL CONGENERSRECOMMENDED FOR QUANTITATION AS POTENTIAL
CONTAMINANTS OF CONCERN
Congener Numbe?
PCBCongeneP Highest SecondSummationc Priorityd Prioritye
2,4’-Dichlorobiphenyl
2,2’,5-Trichlorobiphenyl
2,4,4’-Trichlorobiphenyl
3,4,4’-Trichlorobiphenyl
2,2’,3,5’-Tetrachlorobiphenyl
2,2’,4,5’-Tetrachlorobiphenyl
2,2’,5,5’-Tetrachlorobiphenyl
2,3’,4,4’-Tetrachlorobiphenyl
2,3’,4’,5-Tetrachlorobiphenyl
2,4,4’,5-Tetrachlorobiphenyl
3,3’,4,4’-Tetrachlorobiphenyl
3,4,4’,5-Tetrachlorobiphenyl
2,2’,3,4,5’-Pentachlorobiphenyl
2,2’,3,4’,5-Pentachlorobiphenyl
2,2’,4,5,5’-Pentachlorobiphenyl
2,3,3’,4,4’-Pentachlorobiphenyl
2,3,4,4’,5-Pentachlorobiphenyl
2,3’,4,4’,5-Pentachlorobiphenyl
2,3’,4,4’,6-Pentachlorobiphenyl
2’,3,4,4’,5-Pentachlorobiphenyl
3,3’,4,4’,5-Pentachlorobiphenyl
2’,3,3’,4,4’-Hexachlorobiphenyl
2,2’,3,4,4’,5’-Hexachlorobiphenyl
2,2’,3,5,5’,6-Hexachlorobiphenyl
2,2’,4,4’,5,5’-Hexachlorobiphenyl
2,3,3’,4,4’,5-Hexachlorobiphenyl
2,3,3,4,4’,5-Hexachlorobiphenyl
2,3,3’,4,4’,6-Hexachlorobiphenyl
2,3’,4,4’,5,5’-Hexachlorobiphenyl
2,3’,4,4’,5’,6-Hexachlorobiphenyl
8
18
28
44
52
66
77
101
105
118
126’
128
138
153
77
87
49
101
105
118
126f
128
138
153
156
18
37
44
99
52
70
74
81
114
119
123
151
157
158
167
168
76

TABLE 8. (cont.)
CormenerNumbe~
PCB CongeneF Highest SecondSummationc Priority Prioritye
3,3’,4,4’,5,5’-Hexachlorobiphenyl
2,2’,3,3’,4,4’,5-Heptachlorobiphenyl
2,2’,3,4,4’,5,5’-Heptachlorobiphenyl
2,2’,3,4,4’,5’,6-Heptachlorobiphenyl
2,2’,3,4,4’,6,6’-Heptachlorobiphenyl
2,2’,3,4’,5,5’,6-Heptachlorobiphenyl
2,3,3’,4,4’,5,5’ Heptachlorobiphenyl
2,2’,3,3’,4,4’,5,6-Octachlorobiphenyl
2,2’,3,3’,4,5,5’,6’-Octachlorobiphenyl
2,2’,3,3’,4,4’,5,5’,6-Nonachlorobiphenyl
2,2’,3,3’,4,4’,5,5’,6,6’-Decachlorobiphenyl
169f 169’
170 170
180 180
183
184
187 187
189
195
201
206
209
Note: PCB-polychlorinated biphenyl
a PCB congeners recommended for quantitation, from dichlorobiphenyl through decachlorobiphenyl.
b Congeners are identified by their International Union of Pure and Applied Chemistry (lUPAC) number,as referenced in Ballschmiter and Zen (1980) and Muliin et al. (1984).
cThese congeners are summed to determine total PCB concentration using the approach inNOAA (1989).
d PCB congeners having highest priority for potential environmental importance based on potential fortoxicity, frequency of occurrence in environmental samples, and relative abundance in animal tissues(McFarland and Clarke 1989).
‘ PCB congeners having second priority for potential environmental importance based on potential fortoxicity, frequency of occurrence in environmental samples, and relative abundance in animal tissues(McFariand and Clarke 1989),
f To separate PCBS 126 and 169, it is necessary to initially utilize an enrichment step with an activatedcarbon column (Smith 1981).
—————
77

The overall toxicity of nonortho-substituted PCBS at a site can be assessedbased on a comparison with the toxicity of 2,3,7,8 -TCDD. A similar procedurecan be used for assessing the toxicity of a mixture of dioxins and furans. Inthis “toxicity equivalency factor” (TEF) approach, potency values of individualcongeners (relative to TCDD) and their respective sediment concentrations areused to derive a summed 2,3,7,8 -TCDD equivalent (U.S. EPA 1989d; Table 9).EPA and the USACE are developing guidance on the use of this approach.
To ensure that contaminants not included in the list of target analytes are notoverlooked in the chemical characterization of the dredged material, theanalytical results should also be scrutinized by trained personnel. Thepresence of persistent unknown analytes should be noted. Methods involvingGC/MS techniques for organic compounds are recommended for theidentification of any unknown analytes.
2.8.3 Chemical Analysis of Water
Analysis to determine the potential release of dissolved contaminants from thedredged material (standard elutriate) may be necessary to make determinationsof water column toxicity (see U.S. EPA and USACE 1994). Elutriate testsinvolve mixing dredged material with dredging site water and allowing themixture to settle. The portion of the dredged material that is considered to havethe potential to impact the water column is the supernatant remaining afterundisturbed settling and centrifugation. Chemical analysis of the elutriate allowsa direct comparison, after allowance for mixing, to applicable water qualitystandards. When collecting samples for elutriate testing, consideration shouldbe given to the large volumes of water and sediment required to preparereplicate samples for analysis. In some instances, when there is poor settling,the elutriate preparation has to be performed successively several times toaccumulate enough water for testing. The following sections discuss theselection of target analytes and techniques for water analyses. QAconsiderations are summarized in Section 2.10.5.
2.8.3.1 Selection of Target Ana/ytes
Historical water quality information from the dredging site should be evaluatedalong with data obtained from the chemical analysis of sediment samples toselect target analytes. Chemical evaluation of the dredged material provides aknown list of contaminants that might affect the water column. All targetanalytes identified in the sediment should initially be considered potentialtargets for water analysis, Nonpriority pollutant chemical components which arefound in measurable concentrations in the sediments should be included astarget analytes if review of the literature indicates that these analytes have the
.— -.
78

TABLE 9. Methodology for Toxicity Equivalency Factors
Because toxicity information on some dioxin and furan species is scarce, a structure-activityrelationship has been assumed. The toxicity of each cogener is expressed as a fraction of thetoxicity of 2,3,7,8 TCDD,
Compound
2,3,7,8 TCDD
other TCDD
2,3,7,8-PeCDDs
other PeCDDs
2,3,7,8-HxCDDS
other HxCDDS
2,3,7,8-HpCDDs
other HpCDDs
OCDD
2,3,7,8-TCDF
other TCDFS
1,2,3,7,8-PeCDF
2,3,4,7,8-PeCDF
other PeCDFs
2,3,7,8-HxCDFS
other HxCDFS
2,3,7,8-HpCDFs
other HpCDFs
OCDF
TEF
1
0
0.5
0
0.1
0
0.01
0
0.001
0.1
0
0.05
0.5
0
0.1
0
0.01
0
0.001
— —
79

potential to bioaccumulate in animals (i.e., have a high KW or bioconcentrationfactor [BCF]) and/or are of toxicological concern) (Table 10).
2.8.3.2 Selection of Analytical Techniques
In contrast to freshwater, there generally are no EPA-approved methods foranalysis of saline water although widely accepted methods have existed forsome time (e.g., Strickland and Parsons 1972; Grasshof et al. 1983; Parsons etal. 1984). Application of the freshwater methods to saltwater will frequentlyresult in higher detection limits than are common for freshwater unless care istaken to control the effects of salt on the analytical signal. Modifications orsubstitute methods (e.g., additional extract concentration steps, larger samplesizes, or concentration of extracts to smaller volumes) might be necessary toproperly determine analyte concentrations in saltwater or to meet the desiredTDLs. It is extremely important to ascertain a laboratory’s ability to executemethods and attain acceptable TDLs in matrices containing up to 3 percentsodium chloride.
Once the list of target analytes for water has been established, analyticalmethods should be determined. The Water volume required for specificanalytical methods may vary. A minimum of 1 L of elutriate should be preparedfor metals analysis (as little as 100 mL may be analyzed). One liter of elutriateshould be analyzed for organic compounds. Sample size should also includethe additional volume required for the matrix spike and matrix spike duplicateanalyses, required for analysis of both metals and organic compounds. Samplesize is one of the limiting factors in determining detection limits for wateranalyses, but TDLs below the water quality standard should be the goal in allcases. Participating laboratories should routinely repott detection limitsachieved for a given analyte.
Detailed methods for the analysis of organic and inorganic priority pollutants inwater are referenced in 40 CFR 136 and in U.S. EPA (1983). Additionalapproved methods include U.S. EPA (1986a,b; 1988a,b,c; 1990d,e), APHA(1989), ASTM (1991a), and Tetra Tech (1985). Analysis of the semivolatileorganic priority pollutants involves a solvent extraction of water with an optionalsample cleanup procedure and analysis using GC or GC/MS. The volatilepriority pollutants are determined by using purge-and-trap techniques and areanalyzed by either GC or GC/MS. If dioxin (i.e., 2,3,7,8, -TCDD) analysis isnecessary, Kuehl et al. (1987), Smith et al. (1984), U.S. EPA (1989b; Method8290), or U.S. EPA (1990~ Method 1613) should be consulted. EPA Method1613 is the recommended procedure for measuring the tetra- through octa-PCDDS and PCDFS.
A primary requirement for analysis of inorganic and organic priority pollutants isto obtain detection limits that will result in usable, quantitative data that can
—. -— -——...
‘-80
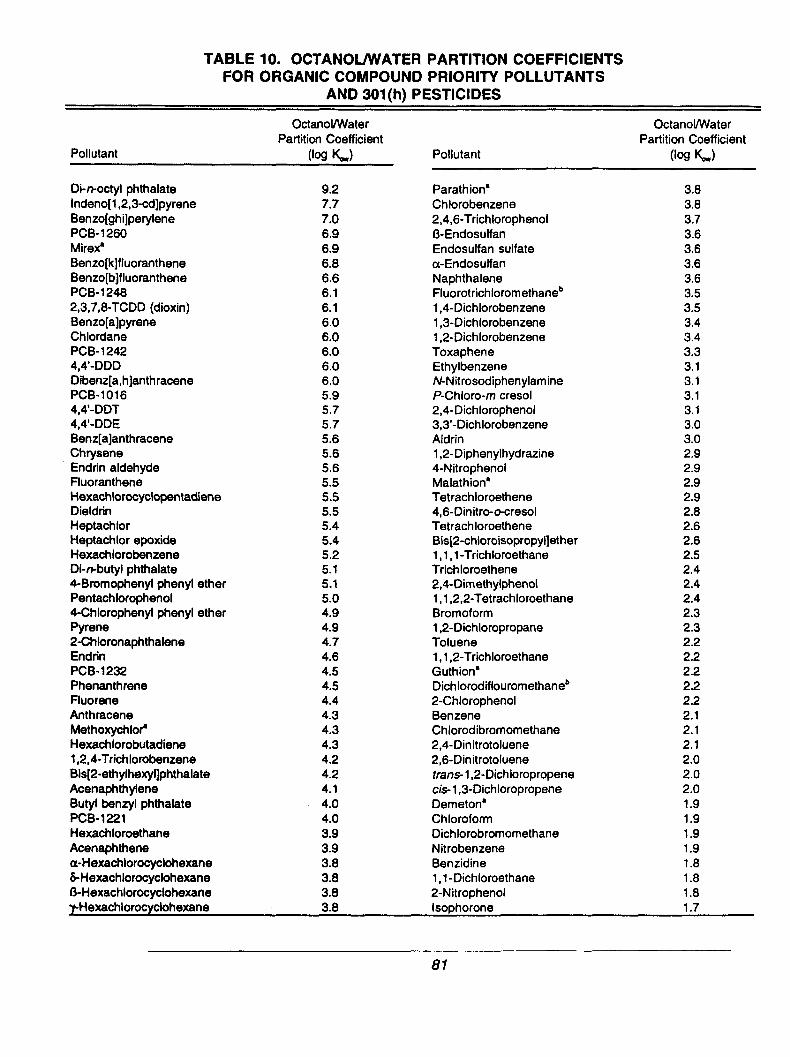
TABLE 10. OCTANOWVATER PARTITION COEFFICIENTSFOR ORGANIC COMPOUND PRIORITY POLLUTANTS
AND 301(h) PESTICIDES
OctanoUWaterPartitionCoefficient
Pollutant (log KJ
OctanolANaterParlition Coefficient
Pollutant (log IQ
Di-moctyl phthalateIndeno[l ,2,3-cd]pyreneBenzo[ghi]perylenePCB-1260Mire#Benzo[k]fluorantheneBenzo[b]fluoranthenePCB-12482,3,7,8-TCDD (dioxin)Benzo[a]pyreneChlordanePCB-12424,4’-DDDDibenz[a,h]anthracenePCB-10164,4’-DDT4,4’-DDEBenz[a]anthraceneChryseneEndrin aldehydeFluorantheneHexachlorocyciopentadieneDieldrinHeptachlorHeptachlor epoxideHexachlorobenzeneDi-n.butyl phthalate4-Bromophenyl phenyl etherPentachlorophenol4-Chlorophenyl phenyl etherPyrene2-ChloronaphthaleneEndrinPCB-1232PhenanthreneFluoreneAnthraceneMethoxychloPHexachlorobutadiene1,2,4-TrichlorobenzeneBis[2-ethylhexyl]phthalateAcenaphthyleneButyl benzyl phthalatePCB-1221HexachloroethaneAcenaphthenea-Hexachlorocyclohexane&Hexachlorocyclohexanef3-Hexachlorocyclohexane~Hexach\orocyclohexane
9.27,77,06.96.96.86.66.16.16.06.06.06.06.05.95.75.75.65.65.65.55.55.55.45.45.25.15.15.04.94.94.74.64.54.54.44.34.34.34.24.24.14.04.03.93.93.83.83.83.8
ParathionaChlorobenzene2,4,6-Trichlorophenoli3-EndosulfanEndosulfan sulfatea-EndosulfanNaphthaleneFluorotrichlorom ethaneb1,4-Dichlorobenzene1,3-Dichlorobenzene1,2-DichlorobenzeneToxapheneEthylbenzeneMNitrosodipheny lamineP-Chloro-rn cresoi2,4-Dichlorophenol3,3’-DichlorobenzeneAldrin1,2-Diphenylhydrazine4-NitrophenolMalathion’Tetrachloroethene4,6-Dinitro-ecresolTetrachloroetheneBis[2-chloroisopropyl] ether1,1,1 -TrichloroethaneTrichloroethene2,4-Dirnethylphenol1, 1,2,2-TetrachloroethaneBromoform1,2-DichloropropaneToluene1, 1,2-TrichloroethaneGuthion”Dichlorodiflouromethaneb2-ChlorophenolBenzeneChlorodibromomethane2,4-Dinitrotoluene2,6-Din itrotoluenetram- 1,2-Dichloropropeneck- 1,3-DichloropropeneDemeton’ChloroformDichlorobromomethaneNit robenzeneBenzidine1,1 -Dichloroethane2-NitrophenolIsophorone
3.83.83.73.63.63.63.63.53.53.43.43.33.13.13.13.13.03.02.92.92.92.92.82.62.62.52.42.42.42.32.32.22.22.22.22.22.12.12.12.02.02.01.91.91.91.91.81.81.81.7
81

TABLE 10. (cont.)
OctanoWater OctanoVWaterPartition Coefficient PartitionCoefficient
Pollutant (log &) Pollutant (log &)
Dimethyl phthalateChloroethane2,4-Dinitrophenol1,1-DichloroethylenePhenol1,2-DichloroethaneDiethyl phthalateN-nitrosodipropylam ineDichloromethane
1.61.51.51.51.51.41.41.31.3
2-ChloroethylvinyletherBis[2-chloroethoxy]methaneAcrylonitrileBis[2-chloroethyl]etherBromomethaneAcroleinChloromethaneVinyl chlorider%itrosodimethyiamine
1.31.31.21.11.00.90.90.60.6
Source: Tetra Tech (1985)
Note: Mixtures, such as PCB Aroclors@, cannot have discrete KW values; however, the value given is a roughestimate forthe mean. [It is recommended that all PCB analyses use congener-specificmethods. All PCB congeners have a log & >4(L. Burkhardt, EPA Duluth, pers. comm.).]
a 301 (h) pesticides not on the priority pollutant list.
b No longer on priority pollutant or 301(h) list.
82

subsequently be compared against applicable water quality standards or cri-
2.8.4
teria, as appropriate. Analys~ of saline water for metals is subject to matrixinterferences from salts, particularly sodium and chloride ions, when thesamples are concentrated prior to instrumental analysis. The goldamalgamation method using cold-vapor atomic absorption spectrometry (CVAA)analysis is recommended to eliminate saline water matrix interferences formercury analysis. Methods using solvent extraction and atomic absorptionspectrometry analysis may be required to reduce saline water matrixinterferences for other target metals. Other methods appropriate for metalsinclude: cadmium, copper, lead, iron, zinc, silver (Danielson et al. 1978);arsenic (EPRI 1986); selenium and antimony (Sturgeon et al. 1985); low levelsof mercury (Bloom et al. 1983); and tributyltin (Rice et al. 1987). GFAAtechniques after extraction are recommended for the analysis of metals, withthe exception of mercury. All PCB and pesticide analyses should be petformedusing GC/ECD methods because such analysis (e.g., NOAA 1989) will result inlower detection limits. PCBS should be quantified as specific congeners (Mullinet al. 1984; Stalling et al. 1987) and as total PCBS based on the summation ofparticular congeners (NOAA 1989).
Chemical Analysis of Tissue
This section discusses the selection of target analytes and techniques for tissueanalyses. QA considerations are summarized in Section 2.10.6.
2.8.4.1 Selection of Target Analytes
Bioaccumulation is evaluated by analyzing tissues of test organisms forcontaminants determined to be of concern for a specific dredged material.Sediment contaminant data and available information on the bioaccumulationpotential of those analytes have to be interpreted to establish target analytes.
The n-octanol/water partition coefficient (KW) is used to estimate the BCFS ofchemicals in organism/water systems (Chiou et al. 1977; Kenaga and Goring1980; Veith et al. 1980; Mackay 1982). The potential for bioaccumulationgenerally increases as KOWincreases, particularly for compounds with log &less than approximately 6. Above this value, there is less of a tendency forbioaccumulation potential to increase with increasing KW. Consequently, therelative potential for bioaccumulation of organic compounds can be estimatedfrom the KOWof the compounds. U.S. EPA (1985) recommends that compoundsfor which the log KOWis greater than 3.5 be considered for further evaluation ofbioaccumulation potential. The organic compound classes of priority pollutantswith the greatest potential to bioaccumulate are PAHs, PCBS, pesticides, andsome phthalate esters. Generally, the volatile organic, phenol, andorganonitrogen priority pollutants are not readily bioaccumuiated, but exceptions
83
include the chlorinated benzenes and the chlorinated phenols. Table 10provides data for organic priority pollutants based on ~. Specific targetanalytes for PCBS and PAHs are discussed in Section 2.8.2. The water contentand percent lipids in tissue should be routinely determined as a part of tissueanalyses for organic contaminants.
Table 11 ranks the bioaccumulation potential of the inorganic priority pollutantsbased on calculated BCFS. Dredged material contaminants with BCFS greaterthan 1,000 (log BCF > 3) should be further evaluated for bioaccumulation ~potential.
Tables 10 and 11 should be used with caution because they are based oncalculated bioconcentration from water. Sediment bioaccumulation tests, incontrast, are concerned with accumulation from a complex medium via allpossible routes of uptake. The appropriate use of the tables isselecting contaminants of concern for bioaccumulation ‘analysisgeneral indication of the relative potential for various chemicalstissues.
to help inby providing ato accumulate in
The strategy for selecting contaminants for tissue analysis should includeconsiderations:
■ The target analyte is a contaminant of concern and is present inthe sediment as determined by sediment chemical analyses
three
■ The target analyte has a high potential to accumulate and persistin tissues
■ The target analyte is of toxicological concern.
Contaminants with a lower potential to bioaccumulate, but which are present athigh concentrations in the sediments, should also be included in the target listbecause bioavailability can increase with concentration. Conversely,contaminants with a high accumulation potential and of high toxicologicalconcern should be considered as target analytes, even if they are only presentat low concentrations in the sediments. Nonpriority-pollutant contaminants thatare found in measurable concentrations in the sediments should be included astargets for tissue analysis if they have the potential to bioaccumulate andpersist in tissues, and are of toxicological concern.
2.8.4.2 Selection of Analytical Techniques
At present, formally approved standard methods for the analysis of prioritypollutants and other contaminants in tissues are not available. However,studies conducted for EPA and other agencies have developed analytical
84

TABLE 11. BIOCONCENTRATION FACTORS (BCF)OF INORGANIC PRIORITY POLLUTANTS
inorganic Pollutant Log BCF
Metals
Methylmercury
Phenylmercury
Mercuric acetate
Copper
Zinc
Arsenic
Cadmium
Lead
Chromium IV
Chromium Ill
Mercury
Nickel
Thallium
Antimony
Silver
Selenium
Beryllium
Nonmetals
Cyanide
Asbestos
4.6
4.6
3,5
3.1
2.8
2,5
2.5
2.2
2.1
2.1
2.0
1.7
1.2
ND
ND
ND
ND
ND
ND
Source: Tetra Tech (1986b)
Note: ND - no data
85

methods capable of identifyhg and quantifyhg most organic and inorganicpriority pollutants in tissues. The amount of tissue required for analysis isdependent on the analytical procedure and the tissue moisture content.General guidance, but not firm recommendations, for the amount of tissuerequired is provided in Table 5. The required amounts may vary depending onthe analytes, matrices, detection limits, and particular analytical laboratory.Tissue moisture coiltent should be determined for each sample to enable datato be converted from a wet-weight to a dty-weight basis for some data wers.
Detection limits depend on the sample size as well as the specific analyticalprocedure. Recommended TDLs for dredged material evaluations are providedin Section 2.3.2 (see Table 3). TDLs should be specified based on theintended use of the data and specific needs of each evaluation.
The recommended methods for the analysis of semivolatile organic pollutantsare described in NOAA (1989). The procedure involves serial extraction ofhomogenized tissue samples with methylene chloride, followed by alumina andgel-permeation column cleanup procedures that remove co-extracted lipids. Anautomated gel-permeation procedure described by Sloan et al. (1993) isrecommended for rapid, efficient, reproducible sample cleanup. The extract isconcentrated and analyzed for semivolatile organic pollutants using GC withcapillary fused-silica columns to achieve sufficient analyte resolution. If dioxin(i.e., 2,3,7,8-TCDD) analysis is being performed, the methods of Mehrle et al.(1988), Smith et al. (1984), Kuehl et al. (1987), U.S. EPA (1989b; Method8290), or U.S. EPA (1990f; Method 1613) should be consulted. EPA Method1613 is the recommended procedure for measuring the tetra- through octa-PCDDS and PCDFS.
Chlorinated hydrocarbons (e.g., PCBS and chlorinated pesticides) should beanalyzed by GC/ECD. PCBS should be quantified as specific congeners (Mullinet al. 1984; Stalling et al. 1987) and not by industrial formulations (e.g.,Aroclors@)because the levels of PCBS in tissues result from complexprocesses, including selective accumulation and metabolism (see the discussionof PCBS in Section 2.8.2.2). Lower detection limits and positive identification ofPCBS and pesticides can be obtained by using chemical ionization massspectrometry.
The same tissue extract is analyzed for other semivolatile pollutants (e.g.,PAHs, phthalate esters, nitrosamines, phenols) using GC/MS as describedNOAA (1989), Battelle (1985), and Tetra Tech (1986b). These GC/MS
by
methods are similar to EPA Method 8270 for solid wastes and soils (U.S. EPA1986a). Lowest detection limits are achieved by operating the mass spectro-meter in the selective ion monitoring mode. Decisions to perform analysis ofnonchlorinated hydrocarbons and resulting data interpretation should considerthat many of these analytes are readily metabolized
86
by most fish and many

invertebrates. Analytical methods for analysis of tissue samples for volatilepriority pollutants are found in Tetra Tech (1986b).
Tissue lipid content is of importance in the interpretation of bioaccumulationinformation. A lipid determination should be performed on all biota submittedfor organic analysis if 1) food chain models will be used, 2) test organismscould spawn during the test, or 3) special circumstances occur, such as thoserequiring risk assessment. Bligh and Dyer (1959) provide an acceptablemethod, and the various available methods are evaluated by Randall et al.(1991).
Analysis for priority pollutant metals involves a nitric acid or nitric acid/perchloricacid digestion of the tissue sample and subsequent analysis of the acid extractusing atomic absorption spectrometry or ICP techniques. Procedures in TetraTech (1986b) are generally recommended. NOAA (1989) methods may also beused and are recommended when low detection levels are required. Microwavetechnology may be used for tissue digestion to reduce contamination and toimprove recovery of metals (Nakashima et al. 1988). This methodology isconsistent with tissue analyses performed by NOAA (1989), except for themicrowave heating steps. Mercury analysis requires the use of CVAA methods(U.S. EPA 1991c). The matrix interferences encountered in analysis of metalsin tissue may require case-specific techniques for overcoming interferenceproblems. If tributyltin analysis is being performed, the methods of Rice et al.(1987), NCASI (1986), or Uhler et al. (1989) should be consulted.
2.9 DATA VALIDATION, REDUCTION, AND REPORTING
This section describes procedures for data-compilation and verification prior tobeing accepted for making technical conclusions. In addition, special equationsmay be required and used to make calculations, models may be used in dataanalysis, criteria may be used to validate the integrity of data that support finalconclusions, and methods may be used to identify and treat data that may notbe representative of environmental conditions.
The following specific information should be included in the QA project plan:
■ The principal criteria that will be used to validate data integrityduring collection and reporting of data (the criteria selected willdepend on the level of validation required to meet the data qualityobjectives)
■ The data reduction scheme planned for collected data, including allequations used to calculate the concentration or value of themeasured parameter and reporting units
87
2.9.1
The methods used to identify and treat outliers (i.e., data that falloutside the upper and lower limits such as *3 standard deviationsof the mean value) and nondetectable data
The data flow or reporting scheme from collection of original datathrough storage of validated concentrations (a flowchart is usuallynecessary)
Statistical formulas and sample calculations planned for collecteddata
Key individuals who will handle the data in this reporting scheme.
QC procedures designed to eliminate errors during the mathematical and/orstatistical reduction of data should also be included in the QA project plan. QCin data processing may include both manual and automated review. Input datashould be checked and verified to confirm compatibility and to flag outliers forconfirmation (i.e., verify that data are outliers and not data for highly contam-inated sediment, water, or tissue). Computerized data plots can be routinelyused as a tool for rapid identification of outliers that can then be verified usingstandard statistical procedures.
Data Validation
Once the Iaboratoty has completed the requested sample analyses, theanalytical results are compiled, printed out, and submitted as a data package,which has been signed by the Iaboratoty’s project manager. This package mayinclude computer disks, magnetic tape, or other forms of electronically storedinformation. Data packages may range in size from a few pages to severalcartons of documents, depending on the nature and extent of the analysesperformed. The cost of this documentation can vary from no charge (in caseswhere only the final results of an analysis are reported) to hundreds of dollarsover the cost of reporting only the final results of an analysis.
The data and information collected during the dredged material evaluationshould be carefully reviewed as to their relevancy, completeness, and quality.The data must be relevant to the overall objective of the project. Data qualityshould be verified by comparing reported detection limits and QC results toTDLs and QC limits, respectively, specified for the current dredged materialevaluation.
As soon as new data packages are received from the laboratory, they shouldbe checked for completeness and data usability and, ideally, dated andduplicated. Dating is important for establishing the laboratory’s adherence toschedules identified in the statement of work. Duplication assures that a cleanreference copy is always kept on file. Checking each element of the data
88
package for completeness of information, precision of analytical methods, andbias of all measurements helps to determine whether acceptable data fromeach type of analysis have been supplied by the laboratory.
Screening for data quality requires knowledge of the sample holding times andconditions, the types of analyses requested, and the form in which data were tobe delivered by the laboratory. Review of the statement of work is essential todetermine any special conditions or requests that may have been stated at theonset of the analyses. Recommended lists of Iaboratoty deliverables for dif-ferent types of chemical analyses are provided in Tables 1 and 2. This initialscreening of data can be performed by appropriate staff or the project manager.
Data validation, or the process of assessing data quality, can begin afterdetermining that the data package is complete. Analytical laboratories strive toproduce data that conform to the requested statement of work, and theytypically perform internal checks to assure that the data meet a standard levelof quality. However, data validation is an independent check on laboratoryperformance and is intended to assure that quality of reported data meets theneeds identified in the QA project plan.
Data validation involves all procedures used to acceptor reject data aftercollection and prior to use. These include screening, editing, verifying, and re-viewing through external performance evaluation audits. Data validationprocedures ensure that objectives for data precision and bias were met, thatdata were generated in accordance with the QA project plan and standardoperating procedures, and that data are traceable and defensible. All chemicaldata should be reported with their associated analytical sensitivity, precision,and bias. In addition, the quantification level achieved by the laboratory shouldbe compared to specific TDLs.
The QA project plan should also specify an appropriate level of data validationfor the intended data use. Examples of four alternative levels of validationeffort for chemical data are summarized in Table 12. These four data validationlevels range from complete, 100-percent review of the data package (Level 1)to acceptance of the data package without any evaluation (Level 4).
The QA project plan should also specify who will perform the evaluations calledfor in Levels 1, 2, or 3. The following options should be considered forchemical data:
■ Perform a brief assessment and rely on specialists to resolveoutstanding concerns. This assessment is equivalent to Level 3(Table 12).
■ Perform a complete review for Level 1 or 2 using qualified staffand technical guidelines for QA specialists (see Footnote a inTable 12).
89

TABLE 12. LEVELS OF DATA VALIDATION
Level 1
Level 2
Level 3
Level 4
100 percent of the data (including data for laboratory quality controlsamples) are independently validated using the data quality objectivesestablished for the project. Calculations and the possibility of transcriptionerrors are checked. Instrument performance and original data for theanalytical standards used to calibrate the method are evaluated to ensurethat the values reported for detection limits and data values areappropriate. The bias and precision of the data are calculated and asummary of corrections and data quality is prepared.”
20 percent of the sample data and 100 percent of the laboratory qualitycontrol samples are validated. Except for the lower level of effort inchecking data for samples, the same checks conducted in Level 1 areperformed. If transcription errors or other concerns (e.g., correctidentification of chemicals in the samples) are found in the initial check onfield samples, then data for an additional 10-20 percent of the samplesshould be reviewed. If numerous errors are found, then the entire datapackageshould be reviewed.
Only the summary results of the laboratoryanalyses are evaluated. Thedata values are assumed to be correctly reported by the Iaboratoty. Dataquality is assessed by comparing summary data reported by the laboratoryfor blanks, bias, precision, and detection limits with data quality objectives
in the QA project plan. No checks on the calibration of the method areperformed, other than comparing the laboratory’s summary of calibrationswith limits specified in the QA project plan.
No additional validation of the data is performed. The internal reviewsperformed by the laboratory are judged adequate for the project.
a Screening checks that can be easily performed by the project manager are provided in (U.S.EPA 1991 d). Step-by-step procedures used by quality assurance specialists to validate datafor analyses of organic compounds and metals can be found in EPA’s functional guidelines fordata review (U.S. EPA 1988a,b). These guidelines were developed for analyses conductedaccording to the statements of work for EPA’s Contract Laboratory Program and are updatedperiodically. Regional interpretation of these detailed procedures is also contained in DataValidation Guidance Manual for Se/ected Sediment Variab/es (PTI 1989b), a draft reportreleased by the Washington Department of Ecology’s Sediment Management Unit in June1989. A simplified version of this guidance is provided in Data Qua/ity Evacuation forProposed Dredged Matena/ Disposa/ Projects (PTI 1989a), another report released by theSediment Management Unit in June 1989.
90

■ Send the data package to an outside technical specialist forreview, specifying either Level 1, 2, or 3.
Providing instructions for conducting a thorough technical validation of chemicaldata is beyond the scope of this document. Examples of detailed technicalguidance of this nature can be found in a pair of publications, Laboratory DataValidation: Functional Guidelines for Evaluating Inorganic Analyses (U.S. EPA1988a) and Laboratory Data Validation: Functional Guidelines for EvaluatingOrganics Ana/yses (U.S. EPA 1988b). Examples of simple evaluations that canbe conducted by a project manager are also provided in U.S. EPA (1991d).The evaluation criteria in Figure 1 (abstracted from U.S. EPA [1991d]) provideseveral signs that should alert a project manager to potential problems withdata acceptability.
2.9.2 Data Reduction and Reporting
The QA project plan should summarize how validated data will be analyzed toreach conclusions, including major tools that will be used for statisticalevaluations. In this section, a flow chart is useful to show the reduction oforiginal laboratory data to final tabulated data in the project report. A summaryshould also be provided of the major kinds of data analyses that will beconducted (e.g., health risk assessments, mapping of chemical distributions).In addition, the format, content, and distribution of any data reports for theproject should be summarized.
2.10 INTERNAL QUALITY CONTROL CHECKS
The various control samples that will be used internally by the laboratory orsample collection team to assess quality are described in this section of the QAproject plan. For most environmental investigations, 10-30 percent of allsamples may be analyzed specifically for purposes of quality control. In somespecial cases (e.g., when the number of samples is small and the need toestablish the validity of analytical data is large), as many as 50 percent of allsamples are used for this purpose. These QC samples may be used to checkthe bias and precision of the overall analytical system and to evaluate theperformances of individual analytical instruments or the technicians that operatethem.
In addition to calibration procedures described in Section 2.7, this section of theguidance document (and Appendix C) summarizes the most widely used QCsamples as follows:
■ Blanks
91

AnalyticalData and Supporting
Documentation
Figurel. Guidance fordata assessment andscreening fordataquali~.
8
—
92
■ Matrix spike samples
■ Surrogate spike compounds
■ Check standards, including:
- Spiked method blanks
- Laboratory control samples
- Reference materials
■ Matrix replicates (split in the Iaboratoty from one field sample)
■ Field replicates (collected as separate field samples from onelocation).
QC procedures for sediment, water, and tissue analyses are discussed in moredetail in the following sections. Field QC results are not used to qualify data,but only to help support conclusions arrived at by the review of the entire dataset.
The government authorities for the program may require that certain samplesbe submitted on a routine basis to government laboratories for analysis, andEPA or USACE may participate in some studies. These activities provide anindependent QA check on activities being performed and on data beinggenerated and are discussed in Section 2.11 (Performance and System Audits).
2.10.1 Priority and Frequency of Quality Control Checks
Which QC samples will be used in analyses should be determined duringproject planning. The frequency of QC procedures is dependent upon the typeof analysis and the objectives of the project (as established in Section 2.3).The statements of work for EPA’s CLP (U.S. EPA 1990d,e) specify the types ofchecks to be used during sample analysis. Determining the actual numbers ofsamples and how often they must be used is also a part of this process. Thesespecifications, called QC sample frequencies, represent the minimum levels ofeffort for a project. Increasing the frequency of QC samples may be anappropriate measure when the expected concentrations of chemicals are closeto the detection limit, when data on low chemical concentrations are needed,when there is a suspected problem with the laboratory, or when existing dataindicate elevated chemical concentrations such that removal or other actionsmay be required. In such cases, the need for increased precision may justifythe cost of extra QC samples.
93

The relative importance, rationale, and relative frequency of calibration andeach kind of QC sample are discussed in Appendix C. The following priority,rationale, and frequency of use is recommended for each procedure:
1. Method blank samples are one of the highest priority checks onQC, because they provide an assessment of possible laboratorycontamination (and the means to correct results for such contam-ination), and are used to determine the detection limit. As a result,method blank analyses are always required; at least one analysisis usually performed for each group of samples that are processedby a laboratory. In contrast, the need for other kinds of blanksamples (bottle, transport, or field equipment) is usually project-specific and depends on the likelihood of contamination fromsolvents, reagents, and instruments used’ in the project; the matrixbeing analyzed; or the contaminants of concern. A bottle blankconsists of an unopened empty sampling botie that is preparedand retained in the field laboratory. A trip travel blank consists ofdeionized water and presewative (as added to the samples) that isprepared in the laboratory and transported to the sampling site. Afield or decontamination blank consists of deionized water from thesample collection device and preservative (as added to thesamples) that is prepared at the sampling site.
2. Matrix spike samples are high-priority checks on QC and shouldalways be analyzed to indicate the bias of analyticalmeasurements due to interfering substances or matrix effects.The suggested frequency is 1 matrix spike for every 20 samplesanalyzed. If more than 1 matrix type is present (e.g., samplescontaining primarily sand and samples containing primarily of siltwithin the same group), then each matrix type should be spiked atthe suggested frequency. Duplicate matrix spike samplesanalyzed at a frequency of 1 duplicate for every 20 samples canserve as an acceptable means of indicating both the bias andprecision of measurement for a particular sample. Duplicate matrixspike samples may provide the only information on precision forcontaminants that are rarely detected in samples.
3. Surrogate spike compounds are high-priority checks on QC that areused to evaluate analytical recovery (e.g., sample extractionefficiency) of organic compounds of interest from individualsamples. Surrogate spike compounds should be added to everysample, including blanks and matrix spike samples, prior toperforming sample processing, to monitor extraction efficiency on asample-by-sample basis. This kind of check is only used when theidentity of the surrogate compound can be reasonably confirmed(e.g., by mass spectroscopy). Because a surrogate compound is
94
chemically similar to the associated compound of interest and isadded to the sample in a known amount, its known recovery isindicative of that of the compound of interest.
Variations in recovery that can be seen using surrogate spikecompounds with each sample will not necessarily be reflected induplicate matrix spike analyses conducted on only a few of thesamples. The reasons for possible differences between surrogatespike analyses and matrix spike analyses relate to sampleheterogeneity and how these QC samples are prepared. Forexample, matrix spike analyses provide an indication of chemicalrecovery for the general sample matrix tested. However, thismatrix may differ among individual samples leading to a range ofrecoveries for surrogate spike compounds among samples. Inaddition, surrogate spike compounds are often added at a lowerconcentration than matrix spike compounds. This difference inspiking concentration sometimes results in reasonable. recovery ofthe higher-concentration matrix spike compounds but poorerrecovery of the lower-concentration surrogate spike compounds.Finally, matrix spike compounds are typically identical tocompounds of interest in the samples, while surrogate spikecompounds are usually selected because they are not present inenvironmental samples, but still mimic the behavior of compoundsof interest. Therefore, there can be more uncertainty in quantifyingthe recovery of matrix spike compounds (after subtracting theestimated concentration of the compounds of interest in thesample) than the recovery of surrogate spike compounds.
4. Check standards should be used whenever available as a high-priority check on laboratory performance. Check standards includeIaboratoty control samples, reference materials prepared by anindependent testing facility, and spiked method blanks prepared bythe laboratory. By comparing the results of check standards withthose of sample-specific measurements (e.g., matrix spikesamples and surrogate compound recovery), an overallassessment of bias and precision can be obtained. The laboratoryshould be contacted prior to analysis to determine what laboratorycontrol samples can be used. Catalogues from organizations suchas National Institute for Standards and Technology and theNational Research Council of Canada are available that listreference materials for different sediment, water, and tissuesamples (see Section 2.1 1.2).
Reference materials provide a standardized basis for comparisonamong laboratories or between different rounds of analysis at onelaboratory. Therefore, reference materials should always be used
95
when comparison of results with other projects is an intended datause. At least 1 analysis of a reference material for every 20samples is recommended for this purpose. Similarly, spikedmethod blanks should be used as acceptable checks on laboratoryperformance whenever a new procedure is used or whenlaboratories with no established track record for a standard ornonstandard procedure will be performing the analysis.
5. Analytical replicate samples should be included as a medium-priority check on laboratory precision. Analytical replicate samplesbetter indicate the precision of measurements on actual samplesthan do matrix spike duplicates because the contaminants havebeen incorporated into the sample by environmental processesrather than having been spiked in a laboratory setting. Thesuggested frequency is 1 replicate sample for every 20 samplesfor each matrix type analyzed. For organic analyses, analysis ofanalytical spike duplicate samples are sometimes a higher prioritythan matrix replicate samples if budgets are limited. The reasonfor this preference is because many organic compounds of interestmay not be present in samples unless they are added as spikedcompounds.
6. Field replicate samples should be included if measuring samplingvariability is a critical component of the study design. Otherwise,collection of field replicate samples is discretionary and a lowerpriority than the other QC samples. Field replicate samples shouldbe submitted to the laboratory as blind samples. When included,the suggested frequency is at least 1 field replicate for every 20samples analyzed. One of the field-replicate samples should alsobe split by the laboratory into analytical duplicates so that bothlaboratory and laboratory-plus-sampling variability can bedetermined on the same sample. By obtaining both measures onthe same sample, the influence of sampling variability can bebetter discerned. It is possible that analytical variability can masksampling variability at a location.
2.10.2 Specifying Quality Control Limits
Prior to performing a chemical analysis, recognized limits on analytical per-formance should be established. These limits are established largely throughthe analysis of QC samples. QC limits apply to all internal QC checks for fieldmeasurements, physical characterizations, bioaccumulation studies, and toxicitytests. Many laboratories have established limits that are applicable to their ownmeasurement systems. These limits should be evaluated to ensure that theyare at least as stringent as general guidelines or that the reasons for a less
96

stringent limit are acceptable. Also, ifalaboratory has consistentlydemonstrated better performance than indicated by general guidelines, limitstied to this better performance should be used to indicate when there may be aproblem at that laboratory. For example, if surrogate recoveries for benzene insediment samples have consistently been between 85 and 105 percent, arecovery of 70 percent indicates an analytical problem that should beinvestigated even if the general guideline for acceptable recovery is 50 percent.It may be useful to establish different kinds of limits when working with labor-atories. For example, the following two kinds of limits are used by PSEP(1990c) and are similar to limits used in EPA’s CLP.
Warning limits are values indicating that data from the analysis of QC samplesshould be qualified (e.g., that they represent estimated or questionable values)before they can be relied upon in a project. These limits serve to warn theproject staff that the analytical system, instrument, or method may not beperforming normally and that data should be qualified as “estimated” beforeusing the results for technical analysis. The standard value for warning limitsare H times the standard deviation (U.S. EPA 1979). Examples of warninglimits used by the Puget Sound Estuary Program are provided in Table 13.Such limits provide a means of ensuring that reported data are consistentlyqualified, an important consideration when combining data in a regionaldatabase.
If necessary to meet project goals, project managers may specify warning limitsas more stringent contractual requirements in laboratory statements of work.For example, Puget Sound Estuary Program guidelines for organic compoundanalyses state that the warning limits for the minimum recovery of surrogatespike and matrix spike compounds are 50 percent of the amount added prior tosample extraction. Data that do not meet this minimum requirement wouldnormally be qualified as estimates. However, the project manager could applymore stringent criteria and decide to reject data that do not meet warning limits,which would require reanalysis of the samples associated with thoseQC samples that do not meet these limits. These more stringent criteria aretermed control limits.
Control limits are limits placed on the acceptability of data from the analysis ofQC samples. Exceedance of control limits informs the analyst and the projectmanager that the analytical system or instrument is performing abnormally andneeds to be corrected. Control limits should be contractually binding onlaboratories, and statements of work should provide the project manager ordesignee with sole discretion in enforcing the limits. Data obtained under thesecircumstances should be corrected before they are resubmitted by thelaboratory. Data that exceed control limits are often rejected and excluded froma project database, although there may be special circumstances that warrantacceptance of the data as estimated values. The reasons for making such an
97

TABLE 13. EXAMPLE WARNING AND CONTROL LIMITS FORCALIBRATION AND QUALITY CONTROL SAMPLES
Analysis Type Recommended Warning Limit Recommended Control Limit
Ongoing calibration
Surrogate spikes
Method blanks
Reference materials
Matrix spikes
Spiked methodblanks(check standards)
Matrix replicates
Field replicates
Project manager decisionb
<50 percent recove~
Exceeds the TDL
95 percent confidence interval, ifcertified
5-150 percent recovery
50-150 percent recovery
35 percent coefficient of variation
Project manager decision
> =5 percent of the averageresponse measured in theinitial calibration
Follow EPA ContractLaboratory Program guidelines
Exceeds 5 times the
To be determined
To be determined
To be determined
TDL
> *5O percent coefficient ofvariation (or a factor of 2 forduplicates)
Proiect manaaer decision
Note: TDL - target detection limit
‘ Warning and control limits used in the Puget Sound Estuary Program for the analysis oforganic compounds (PSEP 1990c).
b See U.S. EPA (1991 d) for specific examples of project manager decisions for warning orcontrol limits,
c Except when using the isotope dilution technique.
dZero percent spike recove~ requires rejection of data.
98

exception should always be documented in a QA report for the data (seeAppendix F).
Unlike warning limits, control limits and appropriate corrective actions (such asinstrument recalibration, elimination of sources of Iaboratoty contamination, orsample reanalysis) should be clearly identified in the statement of work. Thestandard value for control limits are *3 times the standard deviation (U.S. EPA1979). Examples of regional control limits used by the Puget Sound EstuaryProgram are also provided in Table 13. In those cases that require a projectmanager’s decision to determine the appropriate control limit, it isrecommended that the associated warning limit be used as an control limit toproduce data that will have broad applicability (including use in enforcementproceedings). Control limits should be enforced with discretion because someenvironmental samples are inherently difficult to analyze. Recommendedactions under different circumstances are provided below.
2.10.3 Quality Control Considerations for Physical Analysis ofSediments
The procedures used for the physical analysis of sediments should include aQC component. QC procedures for grain size analysis and total solids/specificgravity determinations are necessary to ensure that the data meet acceptablecriteria for precision and bias. To measure precision, triplicate analyses shouldbe performed for every 20 samples analyzed. TOC is a special case, where allsamples should be analyzed in triplicate, as recommended by the analyticalmethod. In addition, 1 procedural blank per 20 samples should be run, and theresults reported for TOC analysis, Standards used for TOC determinationsshould be verified by independent check standards to confirm the bias of theresults. Quality control limits should be agreed upon for each analyticalprocedure, and should be consistent with the overall QA project plan.
2.10.4 Quality Control ConsidenOions for Chemical Analysis ofSediments
Methods for the chemical analysis of priority pollutants in sediments shouldinciude detailed QC procedures and requirements that shouid be foilowedrigorously throughout the evaluation. General procedures include the analysisof a procedural biank, a matrix dupiicate, a matrix spike along with every 10-20sampies processed, and surrogate spike compounds. Ail analytical instrumentsshould be calibrated at least daily (see Section 2.7.1). Aii calibration datashould be submitted to the laboratory project QA coordinator for review. TheQA/QC program should document the ability of the selected methods toaddress the high salt content of sediments from marine and estuarine areas.
99

Analytical precision can be measured by analyzing 1 sample in duplicate ortriplicate for every 10-20 samples analyzed. If duplicates are analyzed, therelative percent difference should be reported; however, if triplicates areanalyzed, the percent relative standard deviation should be reported.
2.10.5 Quality Control Considerations for Chemical Analysis ofWater
Methods recommended for the chemical analysis of priority pollutants in waterinclude detailed QC procedures and requirements that should be folIowedclosely throughout the evaluations. General procedures should include theanalysis of a procedural blank, a matrix duplicate, a matrix spike for every10–20 samples processed, and surrogate spike compounds (for organicanalyses only). Analytical precision can be measured by analyzing 1 sample intriplicate or duplicate for every 10-20 samples analyzed. If duplicates areanalyzed, the relative percent difference should be reported; however, iftriplicates are analyzed, the percent relative standard deviation should bereported. Analytical bias can be measured by analyzing SRM, a matrixcontaining a known amount of a pure reagent. Recoveries of surrogate spikesand matrix spikes should be used to measure for precision and bias; resultsfrom these analyses should be well documented. Special quality control isrequired for ICP and GC/MS analyses. Initial calibrations using three or fivestandards (varying in concentration) are required for analyses of inorganic andorganic compounds, respectively, before analyzing samples (see Section 2.7.2).Subsequent calibration checks should be performed for every 10–20 samplesanalyzed.
2.10.6 Quality Control Considerations for Chemical Analysis ofTissue
Methods recommended for the chemical analysis of priority pollutants in tissueinclude detailed QC procedures and requirements that should be followedclosely throughout the evaluations. General procedures should include theanalysis of a procedural blank, a matrix duplicate, a matrix spike for every10–20 samples processed, and surrogate spike compounds (for organicanalyses only). Analytical precision can be measured by analyzing 1 sample in ~triplicate or duplicate for every 10–20 samples analyzed. If duplicates areanalyzed, the relative percent difference should be reported; however, iftriplicates are analyzed, the percent relative standard deviation should bereported. Analytical bias can be measured with the appropriate SRMS.Precision and bias determinations should be performed with the samefrequency as the blanks and matrix spikes.
100

2.11 PERFORMANCE AND SYSTEM AUDITS
Procedures to determine the effectiveness of the QC program and itsimplementation are summarized in this section of the QA project plan. EachQA project plan should describe the various audits required to monitor thecapability and performance of all measurement systems. Audits include acareful evaluation of both field and laboratory QC procedures. They are anessential part of the field and laboratory QA program and consist of two basictypes: performance audits and system audits. For example, analyses ofperformance evaluation samples may simply be used for comparison with theresults of independent laboratories (a form of performance audit), orcomprehensive audits may be conducted by the government of the entire fieldor laboratory operations (a system audit).
Performance and system audits should be conducted by individuals not directlyinvolved in the measurement process. A performance auditor independentlycollects data using performance evaluation samples, field blanks, trip blanks,duplicate samples, and spiked samples. Performance audits may be conductedsoon after the measurement systems begin generating data. They may berepeated periodically as required by task needs, duration, and cost. U.S. EPA(1991e) should be reviewed for auditing the performance of laboratoriesperforming aquatic toxicity tests.
A systems audit consists of a review of the total data production process. Itincludes onsite reviews of field and laboratory operational systems. EPA and/orUSACE will develop and conduct external system audits based on the approvedproject plan. An example of a systems audit checklist is provided inAppendices A and G.
2.11.1 Procedures for Pre-A ward Inspections of Laboratories
The pre-award inspection is a kind of system audit for assessing the labor-atory’s overall capabilities. This assessment includes a determination that thelaboratory personnel are appropriately qualified and that the required equipmentis available and is adequately maintained. It establishes the groundworknecessary to ensure that tests will be conducted properly, provides the initialcontact between government and laboratory staff, and emphasizes theimportance that government places on quality work and products.
The purpose of the pre-award inspection is to ver~ the following:
■ The laboratory has an independent QA/QC program
~ Written work plans are available for each test that describe theapproach to be used in storing, handling, and analyzing samples
101
■ Technically sound, written standard operating procedures areavailable for all study activities
~ Qualifications and training of staff are appropriate and documented
9 All equipment is properly calibrated and maintained
■ Approved analytical procedures are being followed.
2.11.2 Interlaboratory Comparisons
It is important that data collected and processed at various laboratories becomparable. As part of the performance audit process, laboratories may berequired to participate in analysis of performance evaluation samples related tospecific projects. In particular, laboratory proficiency should be demonstratedbefore a laboratory negotiates a contract and yearly thereafter. Each laboratoryparticipating in a proficiency test is required to analyze samples prepared to aknown concentration. Analytes used in preparation of the samples shouldoriginate from a recognized source of SRMS such as the National Institute forStandards and Technology. Proficiency testing programs already establishedby the government may be used (e.g., EPA Environmental Monitoring andSystems Laboratory scoring system), or a program may be designedspecifically for dredged material evaluations.
In addition, the performance evaluation samples prepared by EPAEnvironmental Monitoring and Systems Laboratory (Las Vegas, Nevada) for theCLP may be used to assess interlaboratory comparability. Analytical results arecompared with predetermined criteria of acceptability (e.g., values that fallwithin the 95 percent confidence interval are considered acceptable). The QAproject plan should indicate, where applicable, scheduled participation in allintetlaboratory calibration exercises.
Reference materials are substances with well-characterized properties that areuseful for assessing the bias of an analysis and auditing analyticalperformances among laboratories.. SRMS are certified reference materialscontaining precise concentrations of chemicals, accurately determined by avariety of technically valid procedures, and are issued by the National Instituteof Standards and Technology. Currently, SRMS are not available for thephysical measurements or all pollutants in sediments; however, where possible,available SRMS or other regional reference materials that have been repeatedlytested should be analyzed with every 20 samples processed.
SRMS for most organic compounds are-not currently available for seawater, butreference materials for many inorganic chemicals may be obtained from theorganizations listed in Table 14. Seawater matrix spikes of target analytes(e.g., seawater spiked with National Institute for Standards and Technology
102

TABLE 14. SOURCESOF STANDARDREFERENCEMATERIALS
PCBS
National Research Council of Canada
PAHs
National Research Council of Canada
National Institute for Standards andTechnology
Metals
National Bureau of Standards
National Research Council of Canada
International Atomic Energy Agency
Marine sediment
Marine sediment
Sediment
Estuarinesediment
Marinesediment
Dogfishliver
Dogfkh muacte
Lobster hepatopan-creas
Marine sediment
Fish flesh
Mussel tissue
HS-1 and HS-2
HS-3, HS+, HS-5, HS-6
SRM #1647 and SRM #1597
SRM #1646
MESS-1 , BCSS-1 , PACS-1
DOLT-1
DORM-1
TORT-1
SD-N-l/2(TM)
MA-A-2(TM)
MAL-l(TM)
Standard reference materials (SRMS) maybe obtained from the following organizations
Organic Constituents
U.S. Department of CommerceNational Institute for Standards and TechnologyOffke of Standard Reference MaterialsRoom B3111 Chemiatty BuildingGaithereburg, Maryfand 20699Tetephone: (301) 975+776
Inorganic Constituents
U.S. Department of CommerceNational Institute for Standarda and TechnologyOffice of Standard Reference MaterialsRoom B3111 Chemistry BuildingGaithereburg, Maryland 20699Telephone: (301 ) 97=776
Marine Analytical Chemistry Standards ProgramNational Research Council of CanadaAtlantic Research Laboratory1411 Oxford StreetHalifax, Nova Scotia, Canada B3H 321Telephone: (902) 42H280
Marine Analytical Chemistry Standards ProgramNational Research Council of CanadaDivision of ChemistryMontreal RoadOttawa, Ontario, Canada K1A OR9Telephone: (61 3) 99>2359
—— —
103

SRM 1647 for PAH) should be used to check analytical bias. Some availableSRMS for priority pollutant metals in seawater are National Research Council ofCanada seawater CASS-1 and seawater NASS-2.
SRMS for organic priority pollutants in tissues are currently not available. TheNational Institute of Standards and Technology is presently developing SRMSfor organic analytes. Tissue matrix spikes of target analytes should be used tofulfill analytical accuracy requirements for organic analyses.
Because new SRMS appear constantly, current listings of appropriate agenciesshould be consulted frequently. SRMS that are readily available and commonlyused are included in Table 14.
2.11.3 Routine System Audits
Routine system audits during the technical evaluation ensure that laboratoriesare complying with the QA project plan. It is suggested that checklists bedeveloped for reviewing training records, equipment specifications, QCprocedures for analytical tasks, management organization, etc. The governmentshould also establish laboratory review files for quick assessment of the labor-atory’s activity on a study, and to aid in monitoring the overall quality of thework. Procedures for external system audits by the government are similar tothe internal systems audits conducted by the laboratories themselves.
2.12 FACILITIES
The QA Project Plan should provide a complete, detailed description of thephysical layout of the laboratory, define space for each test area, describetraffic-flow patterns, and document special laboratory needs. The design andlayout of laboratory facilities are important to maintain sample integrity andprevent cross-contamination. The specific areas to be used for the variousevaluations should be identified. Aspects of the dredging study that warrantseparate facilities include the following:
■ Receiving
■ Sample storage
■ Sample preparation
■ Sample testing
■ Reagent storage
■ Data reduction and analysis.
104

2.13
2.14
PREVENTIVE MAINTENANCE
Procedures for maintaining field and laboratory equipment in a ready state aredescribed in this section, including identification of critical spare parts that mustbe available to ensure that data completeness will not be jeopardized byequipment failure. Regular servicing must be implemented and documented.
The QA project plan should describe how field and Iaboratoty equipmentessential to sample collection and analysis will be maintained in proper workingorder. Preventive maintenance may be in the form of: 1) scheduledmaintenance activities to minimize costly downtime and ensure accuracy ofmeasurement systems, and 2) available spare parts, backup systems, andequipment. Equipment should be subject to regular inspection and preventivemaintenance procedures to ensure proper working order. Instruments shouldhave periodic calibration and preventive maintenance performed by qualifiedtechnical personnel, and a permanent record should be kept of calibrations,problems diagnosed, and corrective actions applied. An acceptance testingprogram for key materials used in the performance of environmentalmeasurements (chemical and biological materials) shouldtheir use.
CALCULATION OF DATA QUALIN INDICATORS
be applied prior to
Specific equations or procedures used to assess the precision, bias, andcompleteness of the data are identified in this section.
The calculations and equations used routinely in QA review (e.g., relativepercent difference of duplicates) as well as the type of samples (e.g., blanks,replicates) analyzed to assess precision, bias, and completeness of the datamust be presented in the QA project plan. Routine procedures for measuringprecision and bias include the use of replicate analyses, SRMS, and matrixspikes. The following routine procedures can be used to measure precisionand bias:
1. Replicate analysis
Precision for duplicate chemical analyses will be calculated as the relativepercent difference:
Relative percent difference =abs[D1 - Dz] ~ ,00
(Dl + D~/2
where:
D, = sample value
105

Dz = duplicate sample valueabs = absolute value.
2*
3.
4.
5.
Precision for the replicate will be calculated as the relative standarddeviation:
Percent relative standard deviation = ~ x 100x
x = mean of three or more resultsa = standard deviation of three or more results.
[1~.~(x-x)’ ‘En-1
Matrix and surrogate spikes
Bias of these measurements will be calculated as the ratio of the measuredvalue to the known spiked quantity:
Percent recovety = spiked result - unspiked result x ,0.
spike added
Method blank
Method blank results are assessed to determine the existence andmagnitude of contamination. Guidelines for evaluating blank results andspecific actions to be taken are identified in U.S. EPA (1988a,b). Sampleresults will not be corrected by subtracting a blank value.
Laboratory control sample
Bias of these measurements will be calculated as the ratio of the measuredvalue to the referenced value:
measured valuePercent recovery = referen~ value x 100
Completeness
Completeness will be measured for each set of data received by dividingthe number of valid (i.e., accepted) measurements actually obtained by thenumber of measurements that were planned:
106

Completeness = valid data points obtained ~ , ~0
total data points planned
To be considered complete, the data set should also contain all QC checkanalyses that verify the accuracy (precision and bias) of the results.
2.15 CORRECTIVE ACTIONS
Major problems that could arise during field or laboratory operations,predetermined corrective actions for these problems, and the individualresponsible for each corrective action are identified in this section.
One purpose of any QA program is to identify nonconformance as quickly aspossible. A nonconformance event is defined as any event that does not followdefined methods, procedures, or protocols, or any occurrence that may affectthe quality of the data or study. A QA program should have a corrective actionplan and should provide feedback to appropriate management authority defininghow all nonconformance events were addressed and corrected.
Corrective actions fall into two categories: 1) handling of analytical orequipment malfunctions, and 2) handling of nonconformance or noncompliancewith the QA requirements that have been established. During field andlaboratory operations, the supervisor is responsible for correcting equipmentmalfunctions. All corrective measures taken should be documented (e.g., awritten standard operating procedure for the corrective action) and, if required,an alteration checklist should be completed.
Corrective action procedures should be described for each project and includethe following elements:
■ Procedures for corrective actions when predetermined limits fordata acceptability are exceeded (see DQO discussion in Section2.3)
■ For each measurement system, the individual responsible forinitiating the corrective action and the individual responsible forapproving the corrective action.
Corrective actions for field procedures should be described in a separatesection from the corrective actions that would apply to the data or laboratoryanalysis. Corrective actions may be initiated as a result of other QA activitiesincluding performance audits, system audits, interlaboratory/interfieldcomparison studies, and QA program audits. An example of a correctiveactions checklist is provided in Appendix A.
107
2.16 QUALITY ASSURANCE REPORTS TO MANAGEMENT
The process of assuring data quality does not end with the data review. Areport summarizing the sampling event (see Appendix H) and the QA review ofthe analytical data package should be prepared, samples should be properlystored or disposed of, and laboratory data should be archived in a storage fileor database. Technical interpretation of the data begins after the QA reviewhas been completed. Once data interpretation is complete, the results of theproject should be carefully examined to determine how closely the originalproject goals and objectives were met. QA reviews are particularly useful forproviding data users with a written record of data concerns and a documentedrationale for why certain data were accepted as estimates or were rejected.
QA project plans provide a mechanism for periodic reporting to management onthe performance of measurement systems and data quality. At a minimum,these reports should include:
■ Periodic assessment of measurement data accuracy (precision andbias) and completeness
■ Results of performance and system audits
9 Significant QA problems and recommended solutions.
The individuals responsible for preparing the periodic reports should beidentified. The final repotl for each project should include a separate QAsection that summarizes data quality information contained in the periodicreports. These reports may be prepared by the project manager if a briefevaluation was conducted, or by QA specialists if a detailed review wasrequested by the project manager.
2.16.1 Preparing Basic Quality Assurance Reports
Basic QA reports should summarize all conclusions concerning dataacceptability and should note significant QA problems that were found. Thetable of contents for a basic QA report should include the following:
~ Data summary-The data summary section should discuss thenumber of samples collected, the laboratory(s) that analyzed thesamples, and a summary of the data that were qualified during theQA review.
■ Holding times-The holding time section should briefly discuss theholding time requirements and holding time exceedances.
108

Analytical methods-The analytical methods section should brieflydescribe the methods of analysis, any departures from themethods, and any calibration or instrument-specific QC criteriaexceedances.
Accuracy—The accuracy section should include a discussion ofQC criteria and exceedances for 1) analytical bias (surrogatecompound, laboratory control sample, matrix spike, and referencematerial recoveries) and 2) precision of matrix replicates (andmatrix spike duplicates for organic compounds.
Method blanks-The method blank section should include a briefdiscussion of method blank QC criteria and exceedances.
QA reviews are usually included as appendices to technical project reports. [nany case, the QA review becomes part of the documented project file, whichalso includes the original data package and any computer files used in datacompilation and analysis.
2.16.2 Preparing Detailed Quality Assurance Reports
Depending on the project objectives, a more detailed QA report may bedesired. An example of a detailed QA review for a metals data package isprovided in Appendix F. In addition to the sections outlined for the basic QAreport, the detailed QA report should also include:
Introduction-The introduction should give a brief overview of thepurpose of data collection and brief. summaries of how the sampleswere collected and processed in the field.
Sample set description-The sample set section should describethe number of samples sent to each laboratory, including thenumber of field blanks, field replicates, SRMS, and interlaboratorysplit samples.
Sample delivery group description-The sample delivery groupsection should briefly describe how the samples were sorted bythe analytical laboratories (how many sample delivery groups werereturned by the laboratory), and whether or not the QC criteriawere performed at the correct frequency for each sample deliverygroup.
Field QC summary-The field QC section should discuss theevaluation of the field blank and replicate results for the samplesurvey.
109

2.17
■ Interlaboratory comparison— The interlaboratory section, whereapplicable, should describe the evaluation of the split samples ascompared to the corresponding samples analyzed by the contractlaboratory.
■ Field results description— The field results section, whereapplicable, should present tabular summaries of all data withappropriate qualifiers.
For organic analyses, a discussion of the results of instrument tuning (ifapplicable), instrument calibration analyses, internal standard performance (ifapplicable), and summation of any factors that could effect overall data quality(e.g., system degradation) should also be included in the detailed QA report.
REFERENCES
References citedplan.
in the QA project plan should be provided at the end of the
110

3. REFERENCES
Ankley, G.T., G.J. Niemi, K.B. Lodge, H.J. Harris, D.L. Beaver, D.E. Tillitt, T.R.Schwartz, J.P. Giesy, P.D. Jones, and C. Hagley. 1993. Uptake of planarpolychlorinated biphenyls and 2,3,7,8-substituted polychlorinated dibenzofuransand dibenzo-p-dioxins by birds nesting in the lower Fox River and Green Bay,Wisconsin. Submitted to Arch. Environ. Contain. Toxicol.
APHA. 1989. Standard methods for the analysis of water and wastewater.17th ed. American Public Health Association, American Water WorksAssociation, Water Pollution Control Federation, Washington, DC.
ASTM. 1991a. Annual book of standards. Volume 11,Water. American Societyfor Testing and Materials, Philadelphia, PA.
ASTM. 1991b. Standard guide for collection, storage, characterization, andmanipulation of sediment for toxicological testing. Method El 391-90. In:Annual Book of ASTM Standards, Water, and Environmental Technology,Volume 11.04. American Society for Testing and Materials, Philadelphia, PA.
ASTM. 1992. Standard test method for classification of soils for engineeringpurposes. In: Annual Book of ASTM Standards, D 2487, Volume 04.08.American Society for Testing and Materials, Philadelphia, PA.
Ballschmiter, K., and M. Zen. 1980. Analysis of polychlorinated biphenyls(PCBS) by glass capillary gas chromatography, composition of technical Aroclor-and Clophen-PCB mixtures. Fresenius Anal. Chem. 302:20-31.
Battelle. 1985. Method for semivolatile organic priority pollutants in fish. Finalreport prepared for the U.S. Environmental Protection Agency under ContractNo. 68–03-1 760.
Becker, D.S., and T.C. Ginn. 1990. Effects of sediment holding time onsediment toxicity. Prepared for U.S. Environmental Protection Agency Region10, Seattle, WA. PTI Environmental Services, Bellevue, WA.
Bligh, E.G., and W.J. Dyer. 1959. A rapid method of total lipid extraction andpurification. Can J. Biochem. Physiol. 37:91 1–917.
Bloom, N.S., E.A. Crecelius, and S. Berman. 1983. Determination of mercuryin seawater at sub-nanogram per liter levels. Marine Chem. 14:49-59.
111
Burton, G.A. Jr. 1991. Assessing the toxicity of freshwater sediments.Environ. Toxicol. Chem. 10:1587-1627.
Chiou, C.T., V.H. Freed, D.W. Schmedding, and R.L. Kohnert. 1977. Partitioncoefficient and bioaccumulation of selected organic chemicals. Environ. Sci.Technol. 11:475-478.
Cutter, G.A., and T.J. Oates. 1987. Determination of dissolved sulfide andsedimentary sulfur speciation using gas chromatography-photoionizationdetection. Anal. Chem. 59:717-721.
Danielson, L., B. Magnussen, and S. Westerland. 1978. An improved metalextraction procedure for determination of trace metal in seawater by atomicabsorption spectrometry with electrothermal atomization. Anal. Chem. Acts98:47–55.
Dewitt, T.H., M.S. Redmond, J.E. Sewall, and R.C. Swartz. 1992a.Development of a chronic sediment toxicity test for marine benthic a~phipods.Report prepared for U.S. Environmental Protection Agency, Newport, OR.Contract No. CR-81 62999010.
DeWitt, T.H., R.J. Ozretich, R.C. Swartz, J.O. Lamberson, D.W. Schults, G.R.Ditsworth, J.K.P. Jones, L. Hoselton, and L.M. Smith. 1992b. The influence oforganic matter quality on the toxicity and partitioning of sediment-associatedfluoranthene. Environ. Toxicol. Chem. 11:197-208.
Di Toro, D. M., J.D. Mahony, D.J. Hansen, K.D. Scott, M.B. Hicks, S.M. Mayr,and M.S. Redmond. 1990. Toxicity of cadmium in sediments: role of acidvolatile sulfide. Environ. Toxicol. Chem. 9:1 487–1 502.
Di Toro, D.M., C.S. Zarba, D.J. Hansen, W.J. Berry, R.C. Swartz, C.E. Cowan,S.P. Pavlou, H.E. Allen, N.A. Thomas, and P.R. Paquin. 1991. Technical basisfor establishing sediment quality criteria for nonionic organic chemicals usingequilibrium partitioning. Environ. Toxicol. Chem. 10:15411583.
Dunn, W.J., Ill, D.L. Stallings, T.R. Schwartz, J.W. Hogan, J.D. Petty, E.Johanson, and S. Weld. 1984. Pattern recognition for classification anddetermination of polychlorinated biphenyls in environmental samples. Anal,Chem. 56:1308-1313.
Engler, R.M., L. Saunders, and T. Wright. 1991. The nature of dredgedmaterial. Environ. Profess. 13:313-316.
EPRI. 1986. Speciation of selenium and arsenic in natural waters and sed-iments. Vol. 2. Prepared by Battelle Pacific Northwest Laboratories. EPRIEA-4641. Prepared for Electrical Power Research Institute.
112

Folch, J., M. Lees, and G.A. Sloane-Stanley. 1957. A simple method for theisolation and purification of total lipids from animal tissues. J. Biol. Chem.226:497-509.
Folk, R.L. 1980. Petrology of sedimentary rocks. Hemphill Publishing Co.,Austin, TX. 182 pp.
Grasshof, K., M. Ehrhardt and K. Kremling. 1983. Methods of sea wateranalysis. 2nd, revised and extended version. Verlag Chemie, Weinheim, 419PP.
Higgins, T.R. 1988. Techniques for reducing the costs of sediment evaluation.Tech. Note EEDP–06–2. U.S. Army Corps of Engineers, WaterwaysExperiment Station, Vicksburg, MS.
Higgins, T.R., and C.R. Lee. 1987. Sediment collection and andlysis methods.Tech. Note EEDP–06-I. U.S. Army Corps of Engineers, WaterwaysExperiment Station, Vicksburg, MS.
Ingham, A.E. 1975. Sea surveying. John Wiley and Sons, New York, NY.306 pp.
Kenaga, E.E., and C.A.I. Goring. 1980. Relationship between water volubility,soil sorption, octanol-water partitioning, and concentration of chemicals in biota.pp. 78-115. In: Aquatic Toxicology. ASTM Spec. Tech. Publ. 707. J.G.Eaton, P.R. Parish, and A.C. Hendricks (eds). American Society for Testingand Materials, Philadelphia, PA.
Kirchmer, C. 1988. Estimation of detection limits for environmental analyticalprocedures: A tutorial. In: Detection of Analytical Chemistry. AmericanChemical Society. Washington, DC.
Kuehl, D.W., P.M. Cook, A.R. Batterman, D. Lothenbach, and B.C. Buttetworth.1987. Bioavailability of polychlorinated dibenzo-p-dioxins and dibenzofuransfrom contaminated Wisconsin River sediment to carp. Chemosphere16:667-679.
Kuehl, D.W., B.C. Butterworth, J. Libal, and P. Marquis. 1991. An isotopedilution high resolution gas chromatographic-high resolution mass spectrometricmethod for the determination of coplanar polychlorinated biphenyls: applicationto fish and marine mammals. Chemosphere 22:849-858.
Mackay, D. 1982. Correlation of bioconcentration factors. Environ. Sci.Technol. 5:274–278.
113
McDonald, D.D., S.L. Smith, M.P. Wong, and P. Mudroch. 1992. Thedevelopment of Canadian marine environmental quality guidelines. MarineEnvironmental Quality Series No. 1. Environment Canada, EcosystemSciences and Evaluation Directorate, Eco-Health Branch, Ottawa, Ontario.
McFarland, V.A., and J.U. Clarke. 1989. Environmental occurrence,abundance, and potential toxicity of polychlorinated biphenyl congeners:considerations for a congener-specific analysis. Environ. Health Perspect.81:225-239.
Mehrle, P.M., D.R. Buckler, E.E. Little, L.M. Smith, J.D. Petty, P.H. Peterman,D.L. Stalling, G.M. DeGraeve, J.J. Coyle, and W.J. Adams. 1988. Toxicity andbioconcentration of 2,3,7,8-tetrachlorodibenzodioxin and2,3,7,8-tetrachlorodibenzofuran in rainbow trout. Environ, Toxicol. Chem.7:47-62.
Mudroch, A., and S.D. MacKnight. 1991. Handbook of techniques for aquaticsediments sampling. CRC Press, Boca Raton, FL. 210 pp.
Mullin, M.D., C.M. Pochini, S. McCrindle, M. Romkes, S.H. Safe, and L.M. Safe.1984. High-resolution PCB analysis: synthesis and chromatographic propertiesof all 209 PCB congeners. Environ. Sci. Technol. 18:468-476.
Nakashima, S., R.E. Sturgeon, S.N. Willie, and S.S. Berman. 1988. Aciddigestion of marine sample for trace element analysis using microwave heating.Analyst Vol. 113.
NCASI. 1986. Procedures for the analysis-of resin and fatty acids in pulp milleffluents. Technical Bulletin No. 501. National Council for Air and StreamImprovement, New York, NY.
NOAA. 1985. Standard analytical procedures of the NOAA Analytical Facility,1985-1986. NOAA Tech. Memo. NMFS F/NWC-92. U.S. Department ofCommerce, National Oceanic and Atmospheric Administration, National MarineFisheries Service, National Analytical Facility, Environmental ConservationDivision, Northwest and Alaska Fisheries Center, Seattle, WA.
NOAA. 1989. Standard analytical procedures of the NOAA National AnalyticalFacility. 2nd ed. NOAA Tech. Mere. NMFS F/NWC-92, 1985–86. Contact:National Status and Trends Program, National Oceanic and AtmosphericAdministration, NOAA N/0MA32, 11400 Rockville Pike, Rockville, MD 20852.
Parsons, T.R., Y. Maita and c.M. Lalli. 1984. A manual of chemical andbiological methods for seawater analysis. Pergamon Press, N.Y., N.Y. 173 pp.
114

Plumb, R.H., Jr. 1981. Procedure for handling and chemical analysis ofsediment and water samples. Technical Report EPA/CE-81 -1. Prepared byState University College at Buffalo, Great Lakes Laboratory, Buffalo, NY. U.S.Environmental Protection Agency and U.S. Army Corps of Engineers,Waterways Experiment Station, Vicksburg, MS,
PSEP. 1986. Recommended protocols for measuring conventional sedimentvariables in Puget Sound. In: Recommended Protocols and Guidelines forMeasuring Selected Environmental Variables in Puget Sound. U.S.Environmental Protection Agency Region 10, Puget Sound Estuary Program,Seattle, WA. (Looseleaf.)
PSEP. 1990a (revised). Recommended protocols for measuring metals inPuget Sound water, sediment, and tissue samples. Prepared by PTIEnvironmental Services, Bellevue, WA. In: Recommended Protocols andGuidelines for Measuring Selected Environmental Variables in Puget Sound.U.S. Environmental Protection Agency Region 10, Puget Sound EstuaryProgram, Seattle, WA. (Looseleaf.)
PSEP. 1990b (revised). Recommended protocols for station positioning inPuget Sound. Prepared by PTI Environmental Services, Bellevue, WA. In:Recommended Protocols and Guidelines for Measuring Selected EnvironmentalVariables in Puget Sound. U.S. Environmental Protection Agency Region 10,Puget Sound Estuary Program, Seattle, WA. (Looseleaf.)
PSEP. 1990c (revised). Recommended guidelines for measuring organiccompounds in Puget Sound sediments and tissue samples. Prepared by PTIEnvironmental Services, Bellevue, WA. In:. Recommended Protocols andGuidelines for Measuring Selected Environmental Variables in Puget Sound.U.S. Environmental Protection Agency Region 10, Puget Sound EstuaryProgram, Seattle, WA. (Looseleaf.)
PSEP. 1991. Pollutants of concern in Puget Sound. EPA 910/9-91-003.Prepared for U.S. Environmental Protection Agency Region 10, Office ofCoastal Waters, Seattle, WA. Puget Sound Estuary Program. PTIEnvironmental Services, Bellevue, WA.
PTI. 1989a. Data quality evaluation for proposed dredged material disposalprojects. Prepared for Washington Department of Ecology, SedimentManagement Unit. PTI Environmental Services, Bellevue, WA.
PTI. 1989b. Data validation guidance manual for selected sediment variables.Draft Report. Prepared for Washington Department of Ecology, SedimentManagement Unit. PTI Environmental Services, Bellevue, WA,
115
Randall, R.C., H. Lee 11,and R.J. Ozretich. 1991. Evaluation of selected lipidmethods for normalizing pollutant bioaccumulation. Environ. Toxicol. Chem.10:1431-1436.
Rice, C., F. Espourteille, and R. Huggett. 1987. A method for analysis oftributyltin in estuarial sediments and oyster tissue, Crassostrea virginica. Appl.Organomet. Chem. 1:541-544,
Schwartz, T.R., R.D. Campbell, D.L. Stalling, R.L. Little, J.D. Petty, J.W. Hogan,and E.M. Kaiser. 1984. Laboratory data base for isomer-specific determinationof polychlorinated biphenyls. Anal. Chem. 56:1303-1308.
Schwartz, T.R., D.E, TiIlit, K.P. Feltz, and P.H. Peterman. 1993. Determinationof nono- and non-0,0’-chlorine substituted polychlorinated biphenyls in Aroclorsand environmental samples. Submitted to Chemosphere. 26:1443-1460.
Sloan, C.A., N.G. Adams, R.W. Pearce, D.W. Brown, and S-L. Chan. 1993.Northwest Fisheries Science Center organic analytical procedures. In: U.S.Department of Commerce, NOAA Tech. Memo. NOS ORCA 71. Sampling andAnalytical Methods of the National Status and Trends Program, NationalBenthic Suweillance and Mussel Watch Projects 1984-1992. Volume IV.Comprehensive Descriptions of Trace Organic Analytical Methods. Editors:G.G. Lauenstein and A.Y. Cantillo. p. 53-97.
Smith, L.M. 1981. Carbon dispersed on glass fibers as an adsorbent forcontaminant enrichment and fractionation. Anal. Chem. 53:2152-2154.
Smith, L.M., D.L. Stalling, and J.L. Johnson.- 1984. Determination of part-per-trillion levels of polychlorinated dibenzofurans and dioxins in environmentalsamples. AnaL Chem. 56:1830-1842.
Stalling, D.L., T.R. Schwartz, W.J. Dunn, Ill, and S. Weld. 1987. Classificationof polychlorinated biphenyl residues. Anal. Chem. 59:1853-1859,
Strickland, J.D.H. and T.R. Parsons. 1972. A practical handbook of seawateranalysis. Bull. Fish. Res. Bd. Canada. 122:1-172.
Sturgeon, R., S. Willie, and S. Berman. 1985. Preconcentration of selenium adantimony from seawater for determination of graphite furnace atomic absorptionspectrometry. Anal. Chem. 57:6-9.
Sturgis, T.C. 1990, Guidance for contracting biological and chemicalevaluations of dredged material. Tech. Rep. D-90-XX. U.S. Army Corps ofEngineers, Watetways Experiment Station, Vicksburg, MS.
116

Tatem, H. E., D.L. Brandon, C.R. Lee, A.S. Jarvis, and R.G. Rhett. 1991.Effects of storage on sediment toxicity, bioaccumulation potential and chemistry.Misc. Paper EL–91-2. U.S. Army Corps of Engineers, Waterways ExperimentStation, Vicksburg, MS. 62 pp.
Tetra Tech. 1985. Bioaccumulation monitoring guidance: 1. Estimating thepotential for bioaccumulation of priority pollutants and 301(h) pesticidesdischarged into marine and estuarine waters. Final Report. Prepared for US.Environmental Protection Agency. Tetra Tech, Inc., Bellevue, WA.
Tetra Tech. 1986a. Analytical methods for U.S. EPA priority pollutants and301(h) pesticides in estuarine and marine sediments. Final Report. Preparedfor U.S. Environmental Protection Agency. Tetra Tech, Inc., Bellevue, WA.
Tetra Tech. 1986b. Bioaccumulation monitoring guidance: 4. Analyticalmethods for U.S. EPA priority pollutants and 301(h) pesticides in tissues fromestuarine and marine organisms. Final Report. Prepared for U.S.Environmental Protection Agency. Tetra Tech, Inc., Bellevue, WA.
Uhler, A.D., and G.S. Durrel. 1989. Measurement of butyltin species insediments by n-pentyl derivation with gas chromatography/flame photometricdetection (GC/FPD). Battelle Ocean Sciences Project No. N-0519-6100,Duxbury, MA.
Uhler, A.D., T.H. Coogan, K.S. Davis, G.S. Durell, W.G. Steinhauer, S.Y.Freitas, and P.D. Boehm. 1989. Findings of tributyltin, dibutyltin, andmonobutyltin in bivalves from selected U.S. coastal waters. Environ. Toxicol.Chem. 8:971-979.
USACE. 1986. Development of a modified elutriate test for estimating thequality of effluent from confined dredged material disposal areas. Appendix A:recommended procedure for conducting modified elutriate test. U.S. ArmyCorps of Engineers, Waterways Experiment Station, Vicksburg, MS.
USACE. 1990. Engineering and design: hydrographic surveying. DraftReport. EM 1110-2-1003. U.S. Army Corps of Engineers, Washington, DC.
U.S. EPA. 1979. Handbook for analytical QA in water and wastewaterlaboratories. Chapter 6. EPA 600/4-79-019. U.S. Environmental ProtectionAgency, Washington, DC.
U.S. EPA. 1982. Test methods. Methods for organic chemical analysis ofmunicipal and industrial wastewater. EPA 600/4-82-057. U.S. EnvironmentalProtection Agency, Environmental Monitoring and Support Laboratory,Cincinnati, OH.
117
U.S. EPA. 1983. Methods for the chemical analysis of water and wastes.EPA 600/4-79-020. U.S. Environmental Protection Agency, EnvironmentalMonitoring and Support Laboratory, Cincinnati, OH. 460 pp.
US. EPA. 1984a. Guidance for the preparation of combined/work qualityassurance project plan for environmental monitoring. OWRS QA-1. U.S.Environmental Protection Agency, Office of Water’ Regulations and Standards,Washingtonj DC.
U.S. EPA. 1984b. Standard operating safety guides. U.S. EnvironmentalProtection Agency, Office of Emergency and Remedial Response, Washington,DC.
U.S. EPA. 1985. Technical support document for water quality-based toxicscontrol. EPA 440/4-85-032. U.S. Environmental Protection Agency, Office ofWater Enforcement and Permits, Washington, DC.
U.S. EPA. 1986a. Test methods for evaluating solid waste (SW-846): phys-ical/chemical methods. U.S. Environmental Protection Agency, Office of SolidWaste and Emergency Response, Washington, DC.
U.S. EPA. 1986b (revised July 1987). U.S. EPA Contract LaboratoryProgram—statement of work for organics analysis, multi-media, multi-concentration. IFB WA87K236-IFB WA87K238. U.S. Environmental ProtectionAgency, Washington, DC.
U.S. EPA. 1987a. Quality assurance/quality control (QA/QC) for 301(h) mon-itoring programs: guidance on field and laboratory methods. EPA430/9-86-004. NTIS Number PB87-221 164. Prepared by Tetra Tech, Inc.,Bellevue, WA. U.S. Environmental Protection Agency, Office of Marine andEstuarine Protection, Washington, DC.
U.S. EPA. 1987b. Evaluation of survey positioning methods for nearshoremarine and estuarine waters. EPA 430/9-86-003. U.S. EnvironmentalProtection Agency, Office of Marine and Estuarine Protection, Washington, DC.54 pp. + appendices.
U.S. EPA. 1988a. Laboratory data validation: functional guidelines forevaluating inorganic analyses, U.S. Environmental Protection Agency, Officeof Emergency and Remedial Response, Washington, DC.
U.S. EPA. 1988b. Laboratory data validation: functional guidelines forevaluating organics analyses. U.S. Environmental Protection Agency, Office ofEmergency and Remedial Response, Washington, DC.
118
U.S. EPA. 1988c. U.S. EPA Contract Laboratory Program statement of workfor organics analyses, multi-media, multi-concentration. U.S. EnvironmentalProtection Agency, Washington, DC.
U.S. EPA. 1989a. Preparing perfect project plans: a pocket guide for thepreparation of quality assurance project plans. U.S. Environmental ProtectionAgency, Risk Reduction Engineering Laboratory, Cincinnati, OH.
U.S. EPA. 1989b. Test methods for evaluating solid waste. Determination ofpolychlorinated dibenzo-p-dioxins and polychlorinated dibenzofurans by highresolution gas chromatography/high resolution mass spectrometry. EPAMethod 8290. SW-846, Revision O. U.S. Environmental Protection Agency,Washington, DC.
U.S. EPA. 1989c. Method 1624, Revision C: Volatile organic compounds byisotope dilution GCMS. Method 1625, Revision C: Semivolatile organiccompounds by isotope dilution GCMS. U.S. Environmental Protection Agency,Office of Water, Office of Water Regulations and Standards, IndustrialTechnology Division, Washington, DC.
U.S. EPA. 1989d. Interim procedures for estimating risks with exposures tomixtures of chlorinated dibenzo-p-dioxins and dibenzofurans (CDDS and CDFS)and 1989 update. EPA/625/3-89/Ol 6. U.S. Environmental Protection Agency,Risk Assessment Forum, Washington, DC.
U.S. EPA. 1990a. Macroinvertebrate field and Iaboratoty methods forevaluation of the biological integrity of surface waters. EPA 600/4-90-030. U.S.Environmental Protection Agency, Office of. Research and Development,Washington, DC.
U.S. EPA. 1990b. Methods for measuring the acute toxicity of receiving watersto freshwater and marine organisms. EPA 600/4-90-027. U.S. EnvironmentalProtection Agency, Office of Research and Development, Washington, DC. 239PP.
U.S. EPA. 1990c. Specifications and guidance for obtaining contaminant-freesampling containers. Directive #9240 .O-05, April 1990. U.S. EnvironmentalProtection Agency, Office of Solid Waste and Emergency Response,Washington, DC.
U.S. EPA. 1990d. U.S. EPA Contract Laboratory Program statement of workfor organic analyses, multi-media, multi-concentration. Document #OLMOl .8.U.S. Environmental Protection Agency, Washington, DC.
——.
119

U.S. EPA. 1990e. U.S. EPA Contract Laboratory Program statement of workfor inorganic analyses, multi-media, multi-concentration. Document #lLM02.O.U.S. Environmental Protection Agency, Washington, DC.
U.S. EPA. 1990f. Tetra- through octa- chlorinated dioxins and furans byisotope dilution HRGC/HRMS. Method 1613, Revision A. U.S. EnvironmentalProtection Agency, Office of Water, Washington, DC.
U.S. EPA. 1991a. Draft analytical method for determination of acid volatilesulfide in sediment. U.S. Environmental Protection Agency, OfFice of Scienceand Technology, Washington, DC.
U.S. EPA. 1991b. Technical support document for water quality-based toxicscontrol. EPA 505/2-90-001. U.S. Environmental Protection Agency, Office ofWater, Washington, DC.
U.S. EPA. 1991c. Methods for the determination of metals in environmentalsamples. EPW600491 -010. U.S. Environmental Protection Agency,Environmental Monitoring Systems Laboratory, Office of Research andDevelopment, Cincinnati, OH.
U.S. EPA. 1991d. A project manager’s guide to requesting and evaluatingchemical analyses. EPA 910/9–90–24. Prepared by PTI Environmental Setv-ices, Bellevue, WA. U.S. Environmental Protection Agency Region 10, PugetSound Estuary Program, Seattle, WA.
U.S. EPA. 1991e. Manual for the evaluation of laboratories performing aquatictoxicity tests. EPA/600-4-90-031. U.S. Environmental Protection Agency,Office of Research and Development, Washington, DC.
U.S. EPA. 1992a. Fish field and laboratory methods for evaluation of thebiological integrity of surface waters. EPA 600/R-92-l 11. U.S. EnvironmentalProtection Agency, Office of Research and Development, Washington, DC.
U.S. EPA. 1992b. Methods for the determination of chemical substances inmarine and estuarine environmental samples. Method 440.0. EPA 600/R-92-121. U.S. Environmental Protection Agency, Environmental Monitoring SystemsLaboratory, Cincinnati, OH.
U.S. EPA. 1993a. Recommended analytical techniques and qualityassurance/quality control guidelines for the measurement of organic andinorganic analytes in marine sediment and tissue samples. Prepared by U.S.Environmental Protection Agency, Environmental Research Laboratory,Narragansett, RI.
120

U.S. EPA. 1993b. Locational data policy implementation guidance. EPA 2180.U.S. Environmental Protection Agency, Administration and ResourcesManagement, Information Manaegment Services Division, Washington, DC.
U.S. EPA and USACE. 1991. Evaluation of dredged material proposed forocean disposal—testing manual. EPA 503/8-91 -001. U.S. EnvironmentalProtection Agency and U.S. Army Corps of Engineers, Washington, DC.
U.S. EPA and USACE. 1994. Evaluation of dredged material proposed fordischarge in waters of the U.S.—testing manual (Draft). U.S. EnvironmentalProtection Agency and U.S. Army Corps of Engineers, Washington, DC.
Veith, G.D., K.J. Macek, S.R. Petrocelli, and J. Carroll. 1980. An evaluationusing partition coefficients and water volubility to estimate bioconcentrationfactors for organic chemicals in fish. pp. 118-129. In: Aquatic Toxicology.ASTM Spec. Tech. Publ. 707. J.G. Eaton, P.R. Parish, and A.C. Hendricks(eds). American Society for Testing and Materials, Philadelphia, PA.
121

4. GLOSSARY
Accuracy
Acid Volatile Sulfide
Analyte
Bias
Bioaccumulation
Bioassay
The ability to obtain precisely a nonbiased (true)value. Accuracy as used in this document is thecombined measure of precision and bias (seefootnote at beginning of Section 2).
The sulfides removed from sediment by cold acidextraction, consisting mainly of H2S and FeS. AVSis a possible predictive tool for divalent metalsediment toxicity.
The specific component measured in a chemicalanalysis.
Deviation of the measurement from the true value.Usually expressed as the percent recovery of aknown amount of a chemical added to a sample atthe start of a chemical analysis. Bias (along withprecision) is a component of the overall accuracyof a system.
The accumulation of contaminants in the tissue oforganisms through any route, including respiration,ingestion, or direct contact with contaminatedwater, sediment, pore water, or dredged material.
A bioassay is a test using a biological system. Itinvolves exposing an organism to a test materialand determining a response. There are two majortypes of bioassays differentiated by response:toxicity tests which measure an effect (e.g., acutetoxicity, sublethal/chronic toxicity) andbioaccumulation tests which measure aphenomenon (e.g., the uptake of contaminants intotissues).
Bioconcentration Factor The degree to which an organism uptakes asubstance from water.
123

Blanks
Calibration
Chromatography
Cleanup
Comparability
Completeness
QC samples that are processed with the samplesbut contain only reagents. They are used to obtainthe response of an analysis in the absence of asample, including assessment of contaminationfrom sources external to the sample,
The systematic determination of the relationship ofthe response of the measurement system to theconcentration of the analyte of interest. Instrumentcalibration performed before any samples areanalyzed is called the initial calibration.Subsequent checks on the instrument calibrationperformed throughout the analyses of samples arecalled continuing calibration.
The process of selectively separating a mixture intoits component compounds. The compounds aremeasured and presented graphically in the form ofa chromatogram and digitally as a quantificationreport.
The process of removing certain components fromsample extracts, performed to improve instrumentsensitivity
Reflects the confidence with which one data setcan be compared with others and the expression ofresults consistent with other organizations reportingsimilar data. Comparability of analyticalprocedures also implies using analyticalmethodologies that produce results comparable interms of precision, bias, and effective range ofcalibration.
A measure of the amount of valid data obtained vs.the amount of data originally intended to becollected.
Confined Disposal A diked area, either in-water or upland, used toFacility contain dredged material.
Contaminant A chemical or biological substance in a form thatcan be incorporated into, onto, or be ingested byand that harms aquatic organisms, consumers ofaquatic organisms, or users of the aquaticenvironment, and includes but is not limited to the
124

Control Limit
Control Sediment
Data Package
substances on the 307(a)(l) list of toxic pollutantspromulgated on January 31, 1978 (43 FederalRegister4109).
A value for data from the analysis of QC checksindicating that a system or a method is notperforming normally and that an appropriatecorrective action should be taken. When controllimits are exceeded, analyses should be halted;samples analyzed since the last QC sample mayneed reanalysis.
A sediment used to confirm the biologicalacceptability of the test conditions and to helpverify the health of the organisms during the test.Control sediment is essentially free ofcontaminants and compatible with the biologicalneeds of the test organisms such that it has nodiscernible influence on the response beingmeasured in the test. Test procedures areconducted with the control sediment in the sameway as the reference sediment and dredgedmaterial. Control sediment may be the sedimentfrom which the test organisms are collected or alaboratory sediment. Excessive mortality in thecontrol sediment indicates a problem with the testconditions or organisms; and can invalidate theresults of the corresponding dredged material test.
The results of chemical analyses completed by alaboratory, compiled, printed out, and presented tothe agency or individual requesting the analyses.The data package should include chromatograms,calculations, and tuning and calibration summaries,where appropriate. Also included in the datapackage may be computer disks, magnetic tape, orother forms of electronically stored data.
Data Quality Indicators Surrogate spike recoveries, matrix spikerecoveries, analytical values obtained for blanks,standard reference material, and performanceevaluation samples for each parameter in eachmatrix.
Data Quality Objectives Qualitative and quantitative statements of the(DQOS) overall uncertainty that a decision maker is willing
to accept in results or decisions derived from

Detector
Digestion
Disposal Site
Dredged Material
Dredged MaterialDischarge
Evaluation
Extraction
environmental data. DQOS provide the frameworkfor planning environmental data operationsconsistent with the data user’s needs.
A device used in conjunction with an analyticalinstrument to determine the components of asample.
A process used prior to analysis that breaks downsamples using acids (or bases). The end productis called a digestate. Other chemicals, calledmatrix modifiers, may be added to improve thefinal digestate.
That portion of inland or ocean where specificdisposal activities are permitted. It consists of abottom surface area and any overlying volume ofwater.
Material excavated or dredged from waters of theUnited States. A general discussion of the natureof dredged material is provided by Engler et al.(1991).
Any addition of dredged material into waters of theUnited States, including: open water discharges;discharges from unconfined disposal operations(such as beach nourishment or other beneficialuses); discharges from confined disposal facilitieswhich enter waters of the United States (such aseffluent, surface runoff, or Ieachate); and overflowfrom dredge hoppers, scows, or other transportvessels.
Material prepared from the sediment dilution waterand used for chemical analyses and toxicitytesting.
The process of judging data in order to reach adecision.
A chemical or mechanical procedure to removesemivolatile organic compounds from a samplematrix. The end product of extraction is called anextract.
Interference Unwanted elements or compounds in a sample
126

Ion
Matrix
that have properties similar to those of thechemical of interest and that collectively causeunacceptable levels of bias in the results of ameasurement or in sensitive measurements.Unless removed by an appropriate cleanupprocedure, the intetferant is carried along with thechemical of interest through the analyticalprocedure.
An atom or group of atoms that carries a positiveor negative electric charge as a result of havinglost or gained one or more electrons,
The sample material (e.g., water, sediment, tissue)in which the chemicals of interest are found.Matrix refers to the physical structure of a sampleand how chemicals are bound within this structure.At a gross level, tissue is one kind of samplematrix and soil is another. At a finer level, asediment sample of silty sand containing largeamounts of calcium carbonate from the shells ofaquatic organisms represents a different samplematrix than a sediment sample of clayey siltcontaining a large amount of organic carbon fromdecaying vegetation.
Matrix effects are physical or chemical interactionsbetween the sample material and the chemical ofinterest that can bias chemical measurements ineither a nega~ve or positive direction. Becausematrix effects can vary from sample to sample andare often not well understood, they are a majorsource of variability in chemical analyses.
Matrix Spike Samples QC check samples created by adding knownamounts of chemicals of interest to actual samples,usually prior to extraction or digestion. Analysis ofmatrix spikes and matrix spike duplicates willprovide an indication of bias due to matrix effectsand an estimation of the precision of the results.
Metals A group of naturally occurring elements. Certainmetals (such as mercury, lead, nickel, zinc, andcadmium) can be of environmental concern whenthey are released to the environment in unnaturallyhigh amounts. This group usually includes themetalloid arsenic.
127

Organic Compounds Carbon-based substances commonly produced byanimals or plants. Organic chemicals arechemical compounds based on carbon chains orrings and also containing hydrogen with or withoutoxygen, nitrogen, or other elements. Organicchemicals may be produced naturally by plants andanimals or processed artificially using variouschemical reactions.
Performance Audit Audit of a laboratory’s performance by testing astandard reference material. The test results areevaluated by the auditor.
Precision The ability to replicate a value; the degree to whichobservations or measurements of the sameproperty, usually obtained under similar conditions,conform to themselves. Usually expressed asstandard deviation, variance, or range. Precision,along with bias, is a component of the overallaccuracy of a system.
Quality Assurance The total integrated program for assuring thereliability of data. A system for integrating thequality planning, quality control, qualityassessment, and quality improvement efforts tomeet user requirements and defined standards ofquality with a stated level of confidence.
Quality Assurance A detailed document specifying guidelines andManagement Plan procedures to assure data quality at the program
level (i.e., multiple projects).
Quality Assurance A detailed, project-specific document specifyingProject Plan guidelines and procedures to assure data quality
during data collection, analysis, and reporting.
Quality Control The overall system of technical activities forobtaining prescribed standards of performance inthe monitoring and measurement process to meetuser requirements.
Quality Control Blanks, replicates, and other samples used toChecks assess the overall analytical system and to
evaluate the performances of individual analyticalinstruments or the technicians that operate them.
128

Reference Materials Materials or substances with well-characterizedproperties that are useful for assessing theaccuracy of an analysis and comparing analyticalperformances among laboratories.
Reference Sediment A sediment that serves as a point of comparison toidentify potential effects of contaminants in thedredged material (see /n/and and Ocean Testingmanuals for further discussion).
Replicates One of several identical samples. When twoseparate samples are taken from the same station,or when one sample is split into two separatesamples and analyzed, these samples are calledduplicates. When three identical samples areanalyzed, these samples are called triplicates.
Representativeness The degree to which sample data depict anexisting environmental condition; a measure of thetotal variability associated with sampling andmeasuring that includes the two major errorcomponents: systematic error (bias) and randomerror. Sampling representativeness isaccomplished through proper selection of samplinglocations and sampling techniques, and collectionof sufficient number of samples.
Sediment
SemlvolatlleOrganicCompound
Spectrometry
Material, such as sand, silt, or clay, suspended inor settled on the bottom of a water body. The termdredged matetia/ refers to material which has beendredged from a water body (see definition ofdredged material), while the term sediment refersto material in a water body prior to the dredgingprocess.
An organic compound with moderate vaporpressure that can be extracted from samples usingorganic solvents and analyzed by gaschromatography.
The use of spectrographic techniques for derivingthe physical constants of materials. Four basicforms of spectrometry commonly used are atomicabsorption spectrometry (AA), inductively coupledplasma-atomic emission spectrometry (ICP) formetals, and ultraviolet spectrometry (UV) and
129

Spiked MethodBlanks
Standard OperatingProcedure
Standard ReferenceMaterial
Statement of Work
Surrogate SpikeCompounds
Target Detection Limit(TDL)
fluorescence emission or excitation spectrometryfor organic compounds.
Method blanks to which known amounts ofsurrogate compounds and analytes have beenspiked. Such samples are useful to verifyacceptable method performance prior to and duringroutine analysis of samples containing organiccompounds. Also known as check standards insome methods; independently prepared standardsused to check for bias and to estimate theprecision of measurements.
A written document which details an operation,analysis, or action whose mechanisms arethoroughly prescribed and which is commonlyaccepted as the method for performing certainroutine or repetitive tasks.
Standard reference materials are certifiedreference materials containing preciseconcentrations of chemicals, accurately determinedby a variety of technically valid procedures.
A contract addendum used as a legally bindingagreement between the individual or organizationrequesting an analysis and the individual,laboratory, or organization performing the actualtasks.
Compounds with characteristics similar to those ofcompounds of interest that are added to a sampleprior to extraction. They are used to estimate therecovery of organic compounds in a sample.
A performance goal set by consensus between thelowest, technically feasible, detection limit forroutine analytical methods and available regulatorycriteria or guidelines for evaluating dredgedmaterial. The TDL is, therefore, equal to or greaterthan the lowest amount of a chemical that can bereliably detected based on the variability of theblank response of routine analytical methods.However, the reliability of a chemical measurementgenerally increases as the concentration increases.Analytical costs may also be lower at higherdetection limits. For these reasons, a TDL is
130

Tests/Testing
Toxicity Test
Volatile OrganicCompound
Warning Limit
typically set at not less than 10 times lower thanavailable dredged material guidelines for potentialbiological effects associated with sedimentchemical contamination.
Specific procedures which generate biological,chemical, and/or physical data to be used inevaluations. The data are usually quantitative butmay be qualitative (e.g., taste, odor, organismbehavior).
A bioassay which measures an effect (e.g., acutetoxicity, sublethal/chronic toxicity). Not abioaccumulation test (see definition of bioassay).
An organic compound with a high vapor pressurethat tends to evaporate readily from a sample.
A value indicating that data from the analysis ofQC checks are subject to qualification before theycan be used in a project. When two or moresequential QC results fall outside of the warninglimits, a systematic problem is indicated.
Water Quality Standard A law or regulation that consists of the beneficialdesignated use or uses of a water body, thenumeric and narrative water quality criteria that arenecessary to protect the use or uses of thatparticular water body, and an anti-degradationstatement. -
131