q4 2020 earnings release ex991 - northern trust
TRANSCRIPT

News ReleaseInvestor Contact: Media Contact:Mark Bette Doug Holt(312) 444-2301 (312) [email protected] [email protected]
https://www.northerntrust.com
NORTHERN TRUST CORPORATION REPORTS FOURTH QUARTER NET INCOME OF $240.9 MILLION, EARNINGS PER DILUTED COMMON SHARE OF $1.12
CHICAGO, JANUARY 21, 2021 — Northern Trust Corporation today reported fourth quarter net income
per diluted common share of $1.12, compared to $1.70 in the fourth quarter of 2019 and $1.32 in the third
quarter of 2020. Net income was $240.9 million, compared to $371.1 million in the prior-year quarter and
$294.5 million in the prior quarter.
Fourth quarter 2020 results included the following:
• $55.0 million of pre-tax severance-related charges (after-tax $41.2 million) in connection with a
reduction in force
• $11.9 million of pre-tax occupancy expense (after-tax $8.9 million) related to an early lease exit
arising from a workplace real estate strategy
• $26.8 million of tax expense related to the reversal of tax benefits previously recognized through
earnings
“Northern Trust’s performance during the quarter and year demonstrated the continued strength of our
company,” said Michael O’Grady, Chairman and Chief Executive Officer. “Throughout the year, our strong
capital base and liquidity profile enabled us to continue to support the needs of our clients. Full year 2020
performance resulted in revenue consistent with the prior year. Execution on our growth strategies and
overall favorable equity markets drove fees and other noninterest income growth of 6%, while net interest
income declined by 14% in 2020 due to persistently low interest rates. During the fourth quarter we
recognized a charge of $55.0 million associated with a reduction in force, which will allow us to improve
the alignment of our operational expenses with the current economic environment. We continue to focus
on serving our clients with excellence, executing on our long-term priorities, driving operating efficiency
and investing wisely for future profitable growth to deliver long-term value to our various stakeholders.”

SUMMARY RESULTS & KEY METRICS% Change vs.
($ In Millions except per share data) Q4 2020 Q3 2020 Q4 2019 Q3 2020 Q4 2019Trust, Investment and Other Servicing Fees $ 1,026.1 $ 1,003.8 $ 992.2 2 % 3 %Other Noninterest Income 161.4 152.7 134.7 6 20 Net Interest Income (FTE*) 345.1 336.5 430.5 3 (20) Total Revenue (FTE*) 1,532.6 1,493.0 1,557.4 3 (2)
Noninterest Expense 1,151.0 1,094.7 1,072.3 5 7 Provision for Credit Losses (2.5) 0.5 (1.0) N/M N/MProvision for Income Taxes 132.5 95.4 105.3 39 26 FTE Adjustment* 10.7 7.9 9.7 36 10 Net Income $ 240.9 $ 294.5 $ 371.1 (18) % (35) %
Earnings Allocated to Common andPotential Common Shares 234.7 275.0 361.0 (15) (35)
Diluted Earnings per Common Share $ 1.12 $ 1.32 $ 1.70 (15) % (34) %Return on Average Common Equity 8.8 % 10.5 % 14.8 %Return on Average Assets 0.67 % 0.83 % 1.25 %Average Assets $ 143,262.0 $ 140,925.4 $ 118,105.3 2 % 21 %
N/M - Not meaningful
(*) Net interest income and total revenue presented on a fully taxable equivalent (FTE) basis are non-generally accepted accounting principle financial measures that facilitate the analysis of asset yields. Please refer to the Reconciliation to Fully Taxable Equivalent section for further detail.
CLIENT ASSETSAssets under custody/administration (AUC/A) and assets under management are a driver of the
Corporation’s trust, investment and other servicing fees, the largest component of noninterest income.
The following table presents the Corporation’s AUC/A, assets under custody (a component of AUC/A),
and assets under management by reporting segment.
As of % Change vs.
($ In Billions)December 31,
2020*September 30,
2020December 31,
2019September 30,
2020December 31,
2019Assets Under Custody/Administration Corporate & Institutional Services (C&IS) $ 13,653.1 $ 12,263.2 $ 11,311.6 11 % 21 % Wealth Management 879.4 814.4 738.8 8 19 Total Assets Under Custody/Administration $ 14,532.5 $ 13,077.6 $ 12,050.4 11 % 21 %Assets Under Custody Corporate & Institutional Services $ 10,387.7 $ 9,312.2 $ 8,497.8 12 % 22 % Wealth Management 875.1 810.4 735.7 8 19 Total Assets Under Custody $ 11,262.8 $ 10,122.6 $ 9,233.5 11 % 22 %Assets Under Management Corporate & Institutional Services $ 1,057.5 $ 993.2 $ 917.5 6 % 15 % Wealth Management 347.8 318.5 313.8 9 11 Total Assets Under Management $ 1,405.3 $ 1,311.7 $ 1,231.3 7 % 14 %
(*) Client assets for the current quarter are considered preliminary until the Form 10-K is filed with the Securities and Exchange Commission.
- 2 -FOURTH QUARTER 2020 RESULTS

TRUST, INVESTMENT AND OTHER SERVICING FEES % Change vs.
($ In Millions) Q4 2020 Q3 2020 Q4 2019 Q3 2020 Q4 2019
C&IS Trust, Investment and Other Servicing Fees
Custody and Fund Administration $ 419.9 $ 395.0 $ 396.9 6 % 6 %Investment Management 125.1 136.8 115.9 (9) 8 Securities Lending 17.6 19.7 22.6 (11) (22) Other 33.5 33.4 31.6 — 6
Total C&IS $ 596.1 $ 584.9 $ 567.0 2 % 5 %
Wealth Management Trust, Investment and Other Servicing Fees
Central $ 154.7 $ 151.1 $ 158.2 2 % (2) %East 115.5 110.9 110.2 4 5 West 86.0 84.7 85.0 2 1 Global Family Office 73.8 72.2 71.8 2 3
Total Wealth Management $ 430.0 $ 418.9 $ 425.2 3 % 1 %
Total Consolidated Trust, Investment and Other Servicing Fees $ 1,026.1 $ 1,003.8 $ 992.2 2 % 3 %
Q4 2020 vs. Q3 2020
C&IS and Wealth Management trust, investment and other servicing fees are impacted by both one-month and one-quarter lagged asset values.
C&IS trust, investment and other servicing fees increased compared to the prior quarter.
▪ Custody and fund administration fees increased primarily due to new business, higher transaction volumes, favorable currency translation and favorable markets.
▪ Investment management fees decreased primarily due to higher money market mutual fund waivers.
▪ Securities lending fees decreased primarily due to lower spreads.
Wealth Management trust, investment and other servicing fees increased from the prior quarter, primarily due to favorable markets, as well as certain nonrecurring service fees, partially offset by higher money market mutual fund waivers.
Q4 2020 vs. Q4 2019
C&IS and Wealth Management trust, investment and other servicing fees are impacted by both one-month and one-quarter lagged asset values.
C&IS trust, investment and other servicing fees increased compared to the prior-year quarter.
▪ Custody and fund administration fees increased primarily due to new business and favorable currency translation, partially offset by unfavorable non-U.S. markets.
▪ Investment management fees increased primarily due to new business and favorable markets, partially offset by money market mutual fund waivers.
• Securities lending fees decreased primarily due to lower spreads.
Wealth Management trust, investment and other servicing fees increased compared to the prior-year quarter, primarily due to favorable markets, partially offset by money market mutual fund waivers.
- 3 -FOURTH QUARTER 2020 RESULTS (continued)

OTHER NONINTEREST INCOME% Change vs.
($ In Millions) Q4 2020 Q3 2020 Q4 2019 Q3 2020 Q4 2019Other Noninterest Income Foreign Exchange Trading Income $ 68.6 $ 61.6 $ 64.5 11 % 6 % Treasury Management Fees 11.4 11.6 10.4 (1) 10 Security Commissions and Trading Income 32.3 26.0 27.8 24 16 Other Operating Income 49.6 53.5 32.5 (7) 52 Investment Security Gains (Losses), net (0.5) — (0.5) N/M 19 Total Other Noninterest Income $ 161.4 $ 152.7 $ 134.7 6 % 20 %
N/M - Not meaningful
Q4 2020 vs. Q3 2020
▪ Foreign exchange trading income increased primarily due to higher client volumes.
▪ Security commissions and trading income increased primarily due to higher core brokerage revenue.
▪ Other operating income decreased primarily due to lower miscellaneous income. The lower miscellaneous income was primarily associated with lower income in the supplemental compensation plans, which also resulted in a related decrease in supplemental compensation plans expense in other operating expense.
Q4 2020 vs. Q4 2019
▪ Foreign exchange trading income increased primarily due to higher client volumes and increased market volatility, partially offset by decreased foreign exchange swap activity in Treasury.
▪ Security commissions and trading income increased primarily due to higher core brokerage revenue.
▪ Other operating income increased primarily due to charges in the prior-year quarter related to the decision to sell substantially all of the lease portfolio, partially offset by higher expenses for existing swap agreements related to Visa Inc. Class B common shares.
- 4 -FOURTH QUARTER 2020 RESULTS (continued)

NET INTEREST INCOME% Change vs.
($ In Millions) Q4 2020 Q3 2020 Q4 2019 Q3 2020 Q4 2019Net Interest Income Interest Income (FTE*) $ 363.3 $ 363.3 $ 585.8 — % (38) % Interest Expense 18.2 26.8 155.3 (32) (88) Net Interest Income (FTE*) $ 345.1 $ 336.5 $ 430.5 3 % (20) %
Average Earning Assets $ 131,235 $ 129,368 $ 107,160 1 % 22 %Net Interest Margin (FTE*) 1.05 % 1.03 % 1.59 %
(*) Interest income, net interest income and net interest margin presented on an FTE basis are non-generally accepted accounting principle financial measures that facilitate the analysis of asset yields. Please refer to the Reconciliation to Fully Taxable Equivalent section for further detail.
Q4 2020 vs. Q3 2020
▪ Net interest income on an FTE basis increased primarily due to a slightly higher net interest margin and an increase in average earning assets.
▪ The net interest margin on an FTE basis increased slightly primarily due to a balance sheet mix shift and lower costs, partially offset by lower asset yields. The net interest margin also benefited from a higher FTE adjustment and recovery of interest on nonaccrual loans.
▪ Average earning assets increased primarily due to higher levels of securities, partially offset by lower levels of short-term interest-bearing deposits with banks. Funding of the balance sheet reflected higher levels of client deposits.
Q4 2020 vs. Q4 2019
▪ Net interest income on an FTE basis decreased primarily due to a lower net interest margin, partially offset by an increase in average earning assets.
▪ The net interest margin on an FTE basis decreased primarily due to lower interest rates and a balance sheet mix shift.
▪ Average earning assets increased primarily due to higher levels of short-term interest-bearing deposits with banks, securities, and loans. Funding of the balance sheet reflected higher levels of client deposits.
- 5 -FOURTH QUARTER 2020 RESULTS (continued)

PROVISION FOR CREDIT LOSSESAs of and for the three-months ended, % Change vs.
($ In Millions)December 31,
2020September 30,
2020December 31,
2019September 30,
2020December 31,
2019
Allowance for Credit LossesBeginning Allowance for Credit Losses $ 267.9 $ 267.0 $ 127.7 — % 110 %Provision for Credit Losses (2.5) 0.5 (1.0) N/M N/MNet Recoveries (Charge-Offs) (5.5) 0.4 (2.3) N/M 144
Ending Allowance for Credit Losses $ 259.9 $ 267.9 $ 124.4 (3) % 109 %
Allowance assigned to:Loans and Leases $ 190.7 $ 215.4 $ 104.5 (11) % 82 %Undrawn Loan Commitments and Standby Letters of Credit 61.1 44.9 19.9 36 N/MDebt Securities and Other Financial Assets 8.1 7.6 — 6 % N/M
Ending Allowance for Credit Losses $ 259.9 $ 267.9 $ 124.4 (3) % 109 %
N/M - Not meaningful
Q4 2020
▪ The credit provision in the current quarter was primarily due to a decrease in the reserve evaluated on a collective basis, which relates to pooled financial assets sharing similar risk characteristics, partially offset by net charge-offs in the current quarter. The decrease in the collective basis reserve was driven by improved projected economic conditions relative to the prior quarter, with decreases primarily in the private client, residential real estate, and commercial real estate portfolios, partially offset by an increase in the commercial and institutional portfolio.
Q3 2020
▪ The provision in the prior quarter was primarily due to an increase in the reserve evaluated on a collective basis. The increase in the collective basis reserve was driven by projected economic conditions resulting from the ongoing COVID-19 pandemic and related market and economic impacts, with increases in the private client, commercial real estate, and residential real estate portfolios, partially offset by a decrease in the commercial and institutional portfolio. The overall increase in the reserve on a collective basis was partially offset by a decrease in the reserve associated with loans evaluated on an individual basis.
Q4 2019
▪ The credit provision in the prior-year quarter was primarily driven by an overall decrease in the inherent allowance under the previous “incurred loss” model related to changes in credit quality, partially offset by net charge-offs.
- 6 -FOURTH QUARTER 2020 RESULTS (continued)

NONINTEREST EXPENSE% Change vs.
($ In Millions) Q4 2020 Q3 2020 Q4 2019 Q3 2020 Q4 2019Noninterest Expense
Compensation $ 525.3 $ 461.7 $ 463.5 14 % 13 %Employee Benefits 101.9 97.5 92.6 5 10 Outside Services 208.1 186.0 205.7 12 1 Equipment and Software 176.4 170.7 164.9 3 7 Occupancy 67.2 51.8 57.4 30 17 Other Operating Expense 72.1 127.0 88.2 (43) (18)
Total Noninterest Expense $ 1,151.0 $ 1,094.7 $ 1,072.3 5 % 7 %
End of Period Full-Time Equivalent Staff 20,900 20,700 19,800 1 % 6 %
Q4 2020 vs. Q3 2020
▪ Compensation expense increased primarily reflecting $52.5 million of severance-related charges, higher cash-based incentives and salary expense driven by staff growth, partially offset by lower long-term performance-based incentive expense.
▪ Employee benefits expense increased primarily reflecting higher medical costs.
▪ Outside services expense increased primarily due to higher technical services, legal services, consulting services, and third-party advisory fees. Included in outside services is $2.5 million of outplacement costs associated with the reduction in force.
▪ Equipment and software expense increased primarily reflecting higher software disposition charges and software support costs.
▪ Occupancy expense increased primarily due to an early lease exit arising from a workplace real estate strategy and higher building operating costs.
▪ Other operating expense decreased primarily due to a $43.4 million charge related to a corporate action processing error in the prior quarter, the Northern Trust-sponsored golf tournament in the prior quarter, and lower supplemental compensation plans expense. The lower supplemental compensation plans expense resulted in a related decrease in miscellaneous income reported in noninterest income.
Q4 2020 vs. Q4 2019
▪ Compensation expense increased primarily reflecting $52.5 million of severance-related charges and higher salary expense driven by staff growth and base pay adjustments, partially offset by lower long-term performance-based incentive expense and cash-based incentives.
▪ Employee benefits expense increased primarily due to higher retirement plan expenses.
▪ Outside services expense increased primarily due to $2.5 million of outplacement costs associated with the reduction in force.
▪ Equipment and software expense increased primarily reflecting higher depreciation and amortization and software support costs, partially offset by lower software disposition charges.
▪ Occupancy expense increased primarily due to an early lease exit arising from a workplace real estate strategy.
▪ Other operating expense decreased primarily due to lower business promotion expenses due to reduced business travel.
- 7 -FOURTH QUARTER 2020 RESULTS (continued)

PROVISION FOR INCOME TAX% Change vs.
($ In Millions) Q4 2020 Q3 2020 Q4 2019 Q3 2020 Q4 2019Net Income
Income before Income Taxes $ 373.4 $ 389.9 $ 476.4 (4) % (22) %Provision for Income Taxes 132.5 95.4 105.3 39 26
Net Income $ 240.9 $ 294.5 $ 371.1 (18) % (35) %
Effective Tax Rate 35.5 % 24.5 % 22.1 %
Q4 2020 vs. Q3 2020
▪ The provision for income taxes increased primarily due to $26.8 million of tax expense related to the reversal of tax benefits previously recognized through earnings and higher taxes payable on the income of the Corporation’s non-U.S. branches.
▪ Increases to the provision for income taxes as noted above were partially offset by decreased income before income taxes.
Q4 2020 vs. Q4 2019
▪ The provision for income taxes increased primarily due to $26.8 million of tax expense related to the reversal of tax benefits previously recognized through earnings, higher taxes payable on the income of the Corporation’s non-U.S. branches, and prior-year-quarter benefits related to share-based compensation.
▪ Increases to the provision for income taxes as noted above were partially offset by decreased income before income taxes.
- 8 -FOURTH QUARTER 2020 RESULTS (continued)

Average total stockholders’ equity increased $600.5 million, or 5%, to $11.5 billion from the prior-
year quarter’s average of $10.9 billion. The increase was primarily attributable to earnings and
accumulated other comprehensive income since the prior-year period, partially offset by the repurchase
of common stock pursuant to the Corporation’s share repurchase program, the net redemption of
preferred stock during the first quarter of 2020, and dividend declarations.
During the current quarter, the Corporation declared cash dividends totaling $4.7 million to
preferred stockholders and cash dividends totaling $146.8 million to common stockholders. As the
Corporation suspended its open-market share repurchase program on March 16, 2020, the only shares
repurchased during the three months ended December 31, 2020 were 13,968 shares of common stock
withheld upon the vesting of share-based compensation at a total cost of $1.3 million ($90.62 average
price per share) to satisfy tax withholding obligations. During the twelve months ended December 31,
2020, the Corporation repurchased 3,276,589 shares of common stock, including 532,713 shares
withheld related to share-based compensation, at a total cost of $299.8 million ($91.49 average price per
share).
- 9 -STOCKHOLDERS’ EQUITY

The capital ratios of Northern Trust Corporation and its principal subsidiary, The Northern Trust
Company, remained strong at December 31, 2020, exceeding the minimum requirements for
classification as “well-capitalized” under applicable U.S. regulatory requirements.
The table below provides capital ratios, as well as the required minimum capital ratios, for
Northern Trust Corporation and The Northern Trust Company determined by Basel III phased-in
requirements.
December 31, 2020* September 30, 2020 December 31, 2019
Capital Ratios - Northern Trust Corporation
Standardized Approach
Advanced Approach
Standardized Approach
Advanced Approach
Standardized Approach
Advanced Approach
Well-Capitalized
Ratios
Minimum Capital Ratios
Common Equity Tier 1 Capital 12.8 % 13.4 % 13.4 % 13.9 % 12.7 % 13.2 % N/A 4.5 %
Tier 1 Capital 13.9 14.5 14.5 15.1 14.5 15.0 6.0 6.0
Total Capital 15.6 15.9 16.5 16.7 16.3 16.8 10.0 8.0
Tier 1 Leverage 7.6 7.6 7.7 7.7 8.7 8.7 N/A 4.0
Supplementary Leverage N/A 8.6 N/A 8.8 N/A 7.6 N/A 3.0
December 31, 2020* September 30, 2020 December 31, 2019Capital Ratios - The Northern Trust Company
Standardized Approach
Advanced Approach
Standardized Approach
Advanced Approach
Standardized Approach
Advanced Approach
Well-Capitalized
Ratios
Minimum Capital Ratios
Common Equity Tier 1 Capital 13.0 % 13.8 % 13.8 % 14.6 % 12.3 % 13.0 % 6.5 % 4.5 %
Tier 1 Capital 13.0 13.8 13.8 14.6 12.3 13.0 8.0 6.0
Total Capital 14.5 15.0 15.6 16.0 14.0 14.6 10.0 8.0
Tier 1 Leverage 7.0 7.0 7.2 7.2 7.3 7.3 5.0 4.0
Supplementary Leverage N/A 7.7 N/A 8.1 N/A 6.4 3.0 3.0
(*) Capital ratios for the current quarter are considered preliminary until the Form 10-K is filed with the Securities and Exchange Commission.
- 10 -CAPITAL RATIOS

The following table presents a reconciliation of interest income, net interest income, net interest
margin, and total revenue prepared in accordance with generally accepted accounting principles to such
measures on an FTE basis, which are non-generally accepted accounting financial measures. Net
interest margin is calculated by dividing annualized net interest income by average interest-earning
assets. Management believes this presentation provides a clearer indication of these financial measures
for comparative purposes. When adjusted to an FTE basis, yields on taxable, nontaxable and partially
taxable assets are comparable; however, the adjustment to an FTE basis has no impact on net income.
FTE RECONCILIATION QUARTERS
2020 2019
($ in Millions) FOURTH THIRD SECOND FIRST FOURTH
Net Interest IncomeInterest Income - GAAP $ 352.6 $ 355.4 $ 406.3 $ 529.2 $ 576.1
Add: FTE Adjustment 10.7 7.9 7.7 8.1 9.7
Interest Income (FTE) - Non-GAAP $ 363.3 $ 363.3 $ 414.0 $ 537.3 $ 585.8
Net Interest Income - GAAP $ 334.4 $ 328.6 $ 372.1 $ 408.1 $ 420.8
Add: FTE Adjustment 10.7 7.9 7.7 8.1 9.7
Net Interest Income (FTE) - Non-GAAP $ 345.1 $ 336.5 $ 379.8 $ 416.2 $ 430.5
Net Interest Margin - GAAP 1.01 % 1.01 % 1.20 % 1.48 % 1.56 %
Net Interest Margin (FTE) - Non-GAAP 1.05 % 1.03 % 1.22 % 1.51 % 1.59 %
Total RevenueTotal Revenue - GAAP $ 1,521.9 $ 1,485.1 $ 1,506.1 $ 1,587.7 $ 1,547.7
Add: FTE Adjustment 10.7 7.9 7.7 8.1 9.7
Total Revenue (FTE) - Non-GAAP $ 1,532.6 $ 1,493.0 $ 1,513.8 $ 1,595.8 $ 1,557.4
- 11 -RECONCILIATION TO FULLY TAXABLE EQUIVALENT

This release may include statements which constitute “forward-looking statements” within the
meaning of the safe harbor provisions of the Private Securities Litigation Reform Act of 1995. Forward-
looking statements are identified typically by words or phrases such as “believe,” “expect,” “anticipate,”
“intend,” “estimate,” “project,” “likely,” “plan,” “goal,” “target,” “strategy,” and similar expressions or future
or conditional verbs such as “may,” “will,” “should,” “would,” and “could.” Forward-looking statements
include statements, other than those related to historical facts, that relate to Northern Trust’s financial
results and outlook, capital adequacy, dividend policy and share repurchase program, accounting
estimates and assumptions, credit quality including allowance levels, future pension plan contributions,
effective tax rate, anticipated expense levels, contingent liabilities, acquisitions, strategies, market and
industry trends, and expectations regarding the impact of accounting pronouncements and
legislation. Forward-looking statements also include statements, other than those related to historical
facts, that relate to the ongoing COVID-19 (coronavirus) pandemic and its impact on global economic and
market conditions and Northern Trust's business, financial condition, and results of operations. These
statements are based on Northern Trust’s current beliefs and expectations of future events or future
results, and involve risks and uncertainties that are difficult to predict and subject to change. These
statements are also based on assumptions about many important factors, including the factors discussed
in Northern Trust’s most recent annual report on Form 10-K and other filings with the U.S. Securities and
Exchange Commission, all of which are available on Northern Trust’s website. We caution you not to
place undue reliance on any forward-looking statement as actual results may differ materially from those
expressed or implied by forward-looking statements. Northern Trust assumes no obligation to update its
forward-looking statements.
- 12 -FORWARD-LOOKING STATEMENTS

Northern Trust’s fourth quarter earnings conference call will be webcast on January 21, 2021. The
live call will be conducted at 9:00 a.m. CT and is accessible on Northern Trust’s website at:
https://www.northerntrust.com/about-us/investor-relations
A recording of the live call will be available on Northern Trust’s website from 1:00 p.m. CT on
January 21, 2021, for approximately four weeks. Participants will need Windows Media or Adobe Flash
software. This earnings release can also be accessed at Northern Trust’s website.
About Northern Trust
Northern Trust Corporation (Nasdaq: NTRS) is a leading provider of wealth management, asset
servicing, asset management and banking to corporations, institutions, affluent families and individuals.
Founded in Chicago in 1889, Northern Trust has a global presence with offices in 22 U.S. states and
Washington, D.C., and across 22 locations in Canada, Europe, the Middle East and the Asia-Pacific
region. As of December 31, 2020, Northern Trust had assets under custody/administration of US $14.5
trillion, and assets under management of US $1.4 trillion. For more than 130 years, Northern Trust has
earned distinction as an industry leader for exceptional service, financial expertise, integrity and
innovation. Visit northerntrust.com or follow us on Twitter @NorthernTrust.
Northern Trust Corporation, Head Office: 50 South La Salle Street, Chicago, Illinois 60603 U.S.A.,
incorporated with limited liability in the U.S. Global legal and regulatory information can be found at
https://www.northerntrust.com/terms-and-conditions.
/ / /
- 13 -WEBCAST OF FOURTH QUARTER EARNINGS CONFERENCE CALL

STATEMENT OF INCOME DATA
($ In Millions Except Per Share Data) FOURTH QUARTER2020 2019 % Change(1)
Noninterest Income Trust, Investment and Other Servicing Fees $ 1,026.1 $ 992.2 3 % Foreign Exchange Trading Income 68.6 64.5 6 Treasury Management Fees 11.4 10.4 10 Security Commissions and Trading Income 32.3 27.8 16 Other Operating Income 49.6 32.5 52 Investment Security Gains (Losses), net (0.5) (0.5) 19 Total Noninterest Income 1,187.5 1,126.9 5
Net Interest Income Interest Income 352.6 576.1 (39) Interest Expense 18.2 155.3 (88) Net Interest Income 334.4 420.8 (21)
Total Revenue 1,521.9 1,547.7 (2)
Provision for Credit Losses (2.5) (1.0) N/M
Noninterest Expense Compensation 525.3 463.5 13 Employee Benefits 101.9 92.6 10 Outside Services 208.1 205.7 1 Equipment and Software 176.4 164.9 7 Occupancy 67.2 57.4 17 Other Operating Expense 72.1 88.2 (18) Total Noninterest Expense 1,151.0 1,072.3 7
Income before Income Taxes 373.4 476.4 (22) Provision for Income Taxes 132.5 105.3 26 NET INCOME $ 240.9 $ 371.1 (35) %
Dividends on Preferred Stock $ 4.7 $ 5.8 (20) %Earnings Allocated to Participating Securities 1.5 4.3 (65) Earnings Allocated to Common and Potential Common Shares 234.7 361.0 (35)
Per Common ShareNet Income Basic $ 1.13 $ 1.71 (34) % Diluted 1.12 1.70 (34)
Average Common Equity $ 10,648.2 $ 9,808.2 9 %Return on Average Common Equity 8.8 % 14.8 %Return on Average Assets 0.67 % 1.25 %
Cash Dividends Declared per Common Share $ 0.70 $ 0.70 — %
Average Common Shares Outstanding (000s) Basic 208,225 210,648 Diluted 208,962 211,855 Common Shares Outstanding (EOP) (000s) 208,289 209,709
(1) Percentage calculations are based on actual balances rather than the rounded amounts presented in the Supplemental Consolidated Financial Information.
N/M - Not meaningful
NORTHERN TRUST CORPORATION Page 1
(Supplemental Consolidated Financial Information)

STATEMENT OF INCOME DATA FOURTH THIRD
($ In Millions Except Per Share Data) QUARTER QUARTER2020 2020 % Change(1)
Noninterest Income Trust, Investment and Other Servicing Fees $ 1,026.1 $ 1,003.8 2 % Foreign Exchange Trading Income 68.6 61.6 11 Treasury Management Fees 11.4 11.6 (1) Security Commissions and Trading Income 32.3 26.0 24 Other Operating Income 49.6 53.5 (7) Investment Security Gains (Losses), net (0.5) — N/MTotal Noninterest Income 1,187.5 1,156.5 3
Net Interest Income Interest Income 352.6 355.4 (1) Interest Expense 18.2 26.8 (32) Net Interest Income 334.4 328.6 2
Total Revenue 1,521.9 1,485.1 2
Provision for Credit Losses (2.5) 0.5 N/M
Noninterest Expense Compensation 525.3 461.7 14 Employee Benefits 101.9 97.5 5 Outside Services 208.1 186.0 12 Equipment and Software 176.4 170.7 3 Occupancy 67.2 51.8 30 Other Operating Expense 72.1 127.0 (43) Total Noninterest Expense 1,151.0 1,094.7 5
Income before Income Taxes 373.4 389.9 (4) Provision for Income Taxes 132.5 95.4 39 NET INCOME $ 240.9 $ 294.5 (18) %
Dividends on Preferred Stock $ 4.7 $ 16.2 (71) Earnings Allocated to Participating Securities 1.5 3.3 (53) Earnings Allocated to Common and Potential Common Shares 234.7 275.0 (15)
Per Common ShareNet Income Basic $ 1.13 $ 1.32 (15) % Diluted 1.12 1.32 (15)
Average Common Equity $ 10,648.2 $ 10,518.0 1 %Return on Average Common Equity 8.8 % 10.5 %Return on Average Assets 0.67 % 0.83 %
Cash Dividends Declared per Common Share $ 0.70 $ 0.70 — %
Average Common Shares Outstanding (000s) Basic 208,225 208,106 Diluted 208,962 208,688 Common Shares Outstanding (EOP) (000s) 208,289 208,121
(1) Percentage calculations are based on actual balances rather than the rounded amounts presented in the Supplemental Consolidated Financial Information.
N/M - Not meaningful
NORTHERN TRUST CORPORATION Page 2
(Supplemental Consolidated Financial Information)

STATEMENT OF INCOME DATA
($ In Millions Except Per Share Data) TWELVE MONTHS2020 2019 % Change(1)
Noninterest Income Trust, Investment and Other Servicing Fees $ 3,995.0 $ 3,852.1 4 % Foreign Exchange Trading Income 290.4 250.9 16 Treasury Management Fees 45.4 44.5 2 Security Commissions and Trading Income 133.2 103.6 29 Other Operating Income 194.0 145.5 33 Investment Security Gains (Losses), net (0.4) (1.4) (70) Total Noninterest Income 4,657.6 4,395.2 6
Net Interest Income Interest Income 1,643.5 2,499.9 (34) Interest Expense 200.3 822.0 (76) Net Interest Income 1,443.2 1,677.9 (14)
Total Revenue 6,100.8 6,073.1 —
Provision for Credit Losses 125.0 (14.5) N/M
Noninterest Expense Compensation 1,947.1 1,859.0 5 Employee Benefits 387.7 355.2 9 Outside Services 763.1 774.5 (1) Equipment and Software 673.5 612.1 10 Occupancy 230.1 212.9 8 Other Operating Expense 346.7 329.8 5 Total Noninterest Expense 4,348.2 4,143.5 5
Income before Income Taxes 1,627.6 1,944.1 (16) Provision for Income Taxes 418.3 451.9 (7) NET INCOME $ 1,209.3 $ 1,492.2 (19) %
Dividends on Preferred Stock(2) $ 56.2 $ 46.4 21 %Earnings Allocated to Participating Securities 12.1 16.9 (29) Earnings Allocated to Common and Potential Common Shares 1,141.0 1,428.9 (20)
Per Common ShareNet Income Basic $ 5.48 $ 6.66 (18) % Diluted 5.46 6.63 (18)
Average Common Equity $ 10,306.7 $ 9,705.2 6 Return on Average Common Equity 11.2 % 14.9 %Return on Average Assets 0.88 % 1.27 %
Cash Dividends Declared per Common Share $ 2.80 $ 2.60 8 %
Average Common Shares Outstanding (000s) Basic 208,319 214,526 Diluted 209,008 215,603 Common Shares Outstanding (EOP) (000s) 208,289 209,709
(1) Percentage calculations are based on actual balances rather than the rounded amounts presented in the Supplemental Consolidated Financial Information.
(2) Dividends on Preferred Stock in 2020 includes $11.5 million related to the difference between the redemption amount of the Corporation's Series C Non-Cumulative Perpetual Preferred Stock, which was redeemed in the first quarter of 2020, and its carrying value.
N/M - Not meaningful
NORTHERN TRUST CORPORATION Page 3
(Supplemental Consolidated Financial Information)
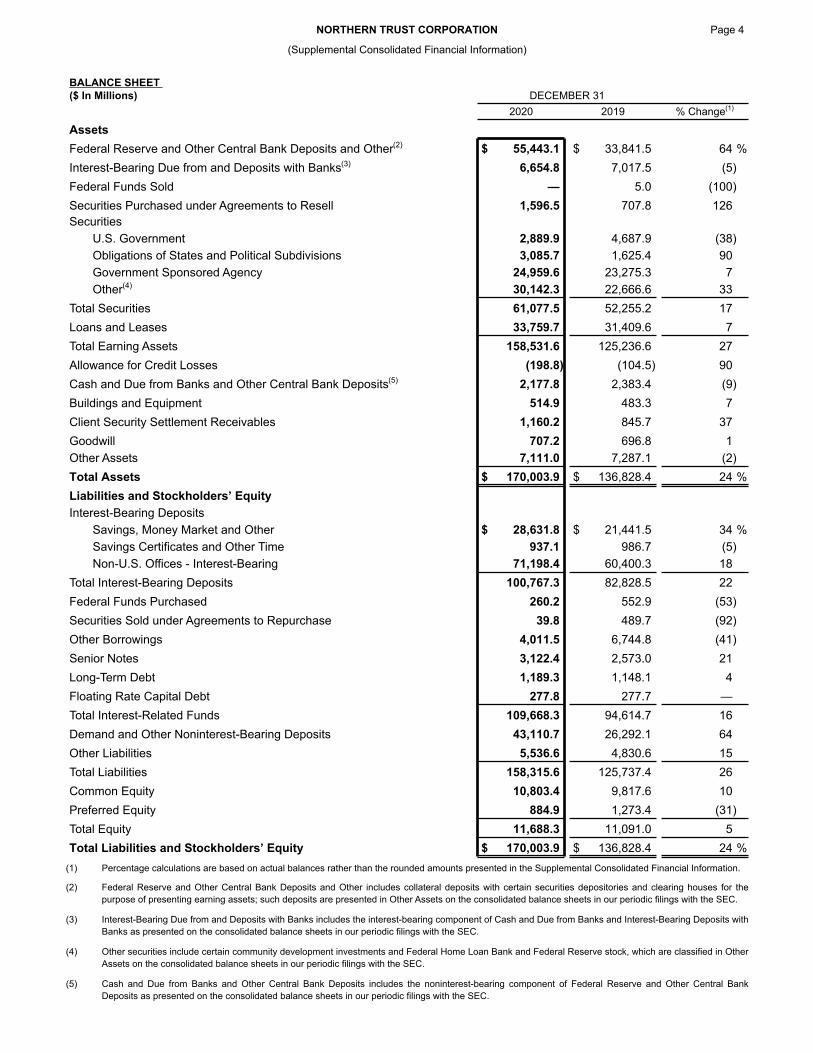
BALANCE SHEET ($ In Millions) DECEMBER 31
2020 2019 % Change(1)
AssetsFederal Reserve and Other Central Bank Deposits and Other(2) $ 55,443.1 $ 33,841.5 64 %Interest-Bearing Due from and Deposits with Banks(3) 6,654.8 7,017.5 (5) Federal Funds Sold — 5.0 (100) Securities Purchased under Agreements to Resell 1,596.5 707.8 126 Securities U.S. Government 2,889.9 4,687.9 (38) Obligations of States and Political Subdivisions 3,085.7 1,625.4 90 Government Sponsored Agency 24,959.6 23,275.3 7 Other(4) 30,142.3 22,666.6 33 Total Securities 61,077.5 52,255.2 17 Loans and Leases 33,759.7 31,409.6 7 Total Earning Assets 158,531.6 125,236.6 27 Allowance for Credit Losses (198.8) (104.5) 90 Cash and Due from Banks and Other Central Bank Deposits(5) 2,177.8 2,383.4 (9) Buildings and Equipment 514.9 483.3 7 Client Security Settlement Receivables 1,160.2 845.7 37 Goodwill 707.2 696.8 1 Other Assets 7,111.0 7,287.1 (2) Total Assets $ 170,003.9 $ 136,828.4 24 %Liabilities and Stockholders’ EquityInterest-Bearing Deposits Savings, Money Market and Other $ 28,631.8 $ 21,441.5 34 % Savings Certificates and Other Time 937.1 986.7 (5) Non-U.S. Offices - Interest-Bearing 71,198.4 60,400.3 18 Total Interest-Bearing Deposits 100,767.3 82,828.5 22 Federal Funds Purchased 260.2 552.9 (53) Securities Sold under Agreements to Repurchase 39.8 489.7 (92) Other Borrowings 4,011.5 6,744.8 (41) Senior Notes 3,122.4 2,573.0 21 Long-Term Debt 1,189.3 1,148.1 4 Floating Rate Capital Debt 277.8 277.7 — Total Interest-Related Funds 109,668.3 94,614.7 16 Demand and Other Noninterest-Bearing Deposits 43,110.7 26,292.1 64 Other Liabilities 5,536.6 4,830.6 15 Total Liabilities 158,315.6 125,737.4 26 Common Equity 10,803.4 9,817.6 10 Preferred Equity 884.9 1,273.4 (31) Total Equity 11,688.3 11,091.0 5 Total Liabilities and Stockholders’ Equity $ 170,003.9 $ 136,828.4 24 %
(1) Percentage calculations are based on actual balances rather than the rounded amounts presented in the Supplemental Consolidated Financial Information.
(2) Federal Reserve and Other Central Bank Deposits and Other includes collateral deposits with certain securities depositories and clearing houses for the purpose of presenting earning assets; such deposits are presented in Other Assets on the consolidated balance sheets in our periodic filings with the SEC.
(3) Interest-Bearing Due from and Deposits with Banks includes the interest-bearing component of Cash and Due from Banks and Interest-Bearing Deposits with Banks as presented on the consolidated balance sheets in our periodic filings with the SEC.
(4) Other securities include certain community development investments and Federal Home Loan Bank and Federal Reserve stock, which are classified in Other Assets on the consolidated balance sheets in our periodic filings with the SEC.
(5) Cash and Due from Banks and Other Central Bank Deposits includes the noninterest-bearing component of Federal Reserve and Other Central Bank Deposits as presented on the consolidated balance sheets in our periodic filings with the SEC.
NORTHERN TRUST CORPORATION Page 4
(Supplemental Consolidated Financial Information)

BALANCE SHEET ($ In Millions) DECEMBER 31 SEPTEMBER 30
2020 2020 % Change(1)
AssetsFederal Reserve and Other Central Bank Deposits and Other(2) $ 55,443.1 $ 39,205.9 41 %Interest-Bearing Due from and Deposits with Banks(3) 6,654.8 4,850.6 37 Securities Purchased under Agreements to Resell 1,596.5 1,533.4 4 Securities U.S. Government 2,889.9 4,264.2 (32) Obligations of States and Political Subdivisions 3,085.7 2,603.1 19 Government Sponsored Agency 24,959.6 24,572.1 2 Other(4) 30,142.3 29,157.1 3 Total Securities 61,077.5 60,596.5 1 Loans and Leases 33,759.7 32,766.3 3 Total Earning Assets 158,531.6 138,952.7 14 Allowance for Credit Losses (198.8) (223.0) (11) Cash and Due from Banks and Other Central Bank Deposits(5) 2,177.8 2,690.1 (19) Buildings and Equipment 514.9 510.0 1 Client Security Settlement Receivables 1,160.2 2,296.8 (49) Goodwill 707.2 698.0 1 Other Assets 7,111.0 7,157.4 (1) Total Assets $ 170,003.9 $ 152,082.0 12 %Liabilities and Stockholders’ EquityInterest-Bearing Deposits Savings, Money Market and Other $ 28,631.8 $ 25,379.1 13 % Savings Certificates and Other Time 937.1 1,486.7 (37) Non-U.S. Offices - Interest-Bearing 71,198.4 61,345.6 16 Total Interest-Bearing Deposits 100,767.3 88,211.4 14 Federal Funds Purchased 260.2 2,203.7 (88) Securities Sold under Agreements to Repurchase 39.8 269.8 (85) Other Borrowings 4,011.5 5,771.7 (30) Senior Notes 3,122.4 3,655.6 (15) Long-Term Debt 1,189.3 1,196.0 (1) Floating Rate Capital Debt 277.8 277.7 — Total Interest-Related Funds 109,668.3 101,585.9 8 Demand and Other Noninterest-Bearing Deposits 43,110.7 34,377.7 25 Other Liabilities 5,536.6 4,539.3 22 Total Liabilities 158,315.6 140,502.9 13 Common Equity 10,803.4 10,694.2 1 Preferred Equity 884.9 884.9 — Total Equity 11,688.3 11,579.1 1 Total Liabilities and Stockholders’ Equity $ 170,003.9 $ 152,082.0 12 %
(1) Percentage calculations are based on actual balances rather than the rounded amounts presented in the Supplemental Consolidated Financial Information.
(2) Federal Reserve and Other Central Bank Deposits and Other includes collateral deposits with certain securities depositories and clearing houses for the purpose of presenting earning assets; such deposits are presented in Other Assets on the consolidated balance sheets in our periodic filings with the SEC.
(3) Interest-Bearing Due from and Deposits with Banks includes the interest-bearing component of Cash and Due from Banks and Interest-Bearing Deposits with Banks as presented on the consolidated balance sheets in our periodic filings with the SEC.
(4) Other securities include certain community development investments and Federal Home Loan Bank and Federal Reserve stock, which are classified in Other Assets on the consolidated balance sheets in our periodic filings with the SEC.
(5) Cash and Due from Banks and Other Central Bank Deposits includes the noninterest-bearing component of Federal Reserve and Other Central Bank Deposits as presented on the consolidated balance sheets in our periodic filings with the SEC.
NORTHERN TRUST CORPORATION Page 5
(Supplemental Consolidated Financial Information)

AVERAGE BALANCE SHEET($ In Millions) FOURTH QUARTER
2020 2019 % Change(1)
AssetsFederal Reserve and Other Central Bank Deposits and Other(2) $ 29,896.2 $ 17,230.0 74 %Interest-Bearing Due from and Deposits with Banks(3) 5,449.0 6,073.9 (10) Federal Funds Sold 0.6 3.8 (84) Securities Purchased under Agreements to Resell 1,565.8 942.1 66 Securities U.S. Government 3,630.8 5,287.7 (31) Obligations of States and Political Subdivisions 2,890.6 1,467.6 97 Government Sponsored Agency 25,076.9 23,199.3 8 Other(4) 29,629.1 21,964.4 35 Total Securities 61,227.4 51,919.0 18 Loans and Leases 33,096.1 30,990.8 7 Total Earning Assets 131,235.1 107,159.6 22 Allowance for Credit Losses (222.7) (105.5) 111 Cash and Due from Banks and Other Central Bank Deposits(5) 2,434.5 2,292.6 6 Buildings and Equipment 516.5 453.5 14 Client Security Settlement Receivables 1,447.6 1,163.4 24 Goodwill 701.6 692.5 1 Other Assets 7,149.4 6,449.2 11 Total Assets $ 143,262.0 $ 118,105.3 21 %Liabilities and Stockholders’ EquityInterest-Bearing Deposits Savings, Money Market and Other $ 24,984.3 $ 18,130.2 38 % Savings Certificates and Other Time 1,198.3 919.0 30 Non-U.S. Offices - Interest-Bearing 61,943.6 52,925.8 17 Total Interest-Bearing Deposits 88,126.2 71,975.0 22 Federal Funds Purchased 562.7 856.6 (34) Securities Sold under Agreements to Repurchase 183.6 281.0 (35) Other Borrowings 5,984.4 7,632.9 (22) Senior Notes 3,315.4 2,584.6 28 Long-Term Debt 1,190.9 1,154.0 3 Floating Rate Capital Debt 277.8 277.7 — Total Interest-Related Funds 99,641.0 84,761.8 18 Demand and Other Noninterest-Bearing Deposits 26,997.5 17,462.9 55 Other Liabilities 5,090.4 4,948.0 3 Total Liabilities 131,728.9 107,172.7 23 Common Equity 10,648.2 9,808.2 9 Preferred Equity 884.9 1,124.4 (21) Total Equity 11,533.1 10,932.6 5 Total Liabilities and Stockholders’ Equity $ 143,262.0 $ 118,105.3 21 %
(1) Percentage calculations are based on actual balances rather than the rounded amounts presented in the Supplemental Consolidated Financial Information.
(2) Federal Reserve and Other Central Bank Deposits and Other includes collateral deposits with certain securities depositories and clearing houses for the purpose of presenting earning assets; such deposits are presented in Other Assets on the consolidated balance sheets in our periodic filings with the SEC.
(3) Interest-Bearing Due from and Deposits with Banks includes the interest-bearing component of Cash and Due from Banks and Interest-Bearing Deposits with Banks as presented on the consolidated balance sheets in our periodic filings with the SEC.
(4) Other securities include certain community development investments and Federal Home Loan Bank and Federal Reserve stock, which are classified in Other Assets on the consolidated balance sheets in our periodic filings with the SEC.
(5) Cash and Due from Banks and Other Central Bank Deposits includes the noninterest-bearing component of Federal Reserve and Other Central Bank Deposits as presented on the consolidated balance sheets in our periodic filings with the SEC.
NORTHERN TRUST CORPORATION Page 6
(Supplemental Consolidated Financial Information)

AVERAGE BALANCE SHEET FOURTH THIRD($ In Millions) QUARTER QUARTER
2020 2020 % Change(1)
AssetsFederal Reserve and Other Central Bank Deposits and Other(2) $ 29,896.2 $ 31,602.3 (5) %Interest-Bearing Due from and Deposits with Banks(3) 5,449.0 4,816.1 13 Federal Funds Sold 0.6 2.5 (77) Securities Purchased under Agreements to Resell 1,565.8 1,789.8 (13) Securities U.S. Government 3,630.8 4,290.9 (15) Obligations of States and Political Subdivisions 2,890.6 2,319.3 25 Government Sponsored Agency 25,076.9 24,027.6 4 Other(4) 29,629.1 27,434.3 8 Total Securities 61,227.4 58,072.1 5 Loans and Leases 33,096.1 33,085.2 — Total Earning Assets 131,235.1 129,368.0 1 Allowance for Credit Losses (222.7) (218.4) 2 Cash and Due from Banks and Other Central Bank Deposits(5) 2,434.5 2,293.3 6 Buildings and Equipment 516.5 512.2 1 Client Security Settlement Receivables 1,447.6 1,155.0 25 Goodwill 701.6 697.8 1 Other Assets 7,149.4 7,117.5 — Total Assets $ 143,262.0 $ 140,925.4 2 %Liabilities and Stockholders’ EquityInterest-Bearing Deposits Savings, Money Market and Other $ 24,984.3 $ 24,305.4 3 % Savings Certificates and Other Time 1,198.3 1,502.1 (20) Non-U.S. Offices - Interest-Bearing 61,943.6 61,834.9 — Total Interest-Bearing Deposits 88,126.2 87,642.4 1 Federal Funds Purchased 562.7 275.6 104 Securities Sold under Agreements to Repurchase 183.6 185.3 (1) Other Borrowings 5,984.4 6,167.8 (3) Senior Notes 3,315.4 3,666.3 (10) Long-Term Debt 1,190.9 1,199.0 (1) Floating Rate Capital Debt 277.8 277.7 — Total Interest-Related Funds 99,641.0 99,414.1 — Demand and Other Noninterest-Bearing Deposits 26,997.5 25,202.3 7 Other Liabilities 5,090.4 4,906.1 4 Total Liabilities 131,728.9 129,522.5 2 Common Equity 10,648.2 10,518.0 1 Preferred Equity 884.9 884.9 — Total Equity 11,533.1 11,402.9 1 Total Liabilities and Stockholders’ Equity $ 143,262.0 $ 140,925.4 2 %
(1) Percentage calculations are based on actual balances rather than the rounded amounts presented in the Supplemental Consolidated Financial Information.
(2) Federal Reserve and Other Central Bank Deposits and Other includes collateral deposits with certain securities depositories and clearing houses for the purpose of presenting earning assets; such deposits are presented in Other Assets on the consolidated balance sheets in our periodic filings with the SEC.
(3) Interest-Bearing Due from and Deposits with Banks includes the interest-bearing component of Cash and Due from Banks and Interest-Bearing Deposits with Banks as presented on the consolidated balance sheets in our periodic filings with the SEC.
(4) Other securities include certain community development investments and Federal Home Loan Bank and Federal Reserve stock, which are classified in Other Assets on the consolidated balance sheets in our periodic filings with the SEC.
(5) Cash and Due from Banks and Other Central Bank Deposits includes the noninterest-bearing component of Federal Reserve and Other Central Bank Deposits as presented on the consolidated balance sheets in our periodic filings with the SEC.
NORTHERN TRUST CORPORATION Page 7
(Supplemental Consolidated Financial Information)

QUARTERLY TREND DATA 2020 2019($ In Millions Except Per Share Data) QUARTERS QUARTER
FOURTH THIRD SECOND FIRST FOURTH
Net Income Summary Trust, Investment and Other Servicing Fees $ 1,026.1 $ 1,003.8 $ 961.5 $ 1,003.6 $ 992.2
Other Noninterest Income 161.4 152.7 172.5 176.0 134.7
Net Interest Income 334.4 328.6 372.1 408.1 420.8
Total Revenue 1,521.9 1,485.1 1,506.1 1,587.7 1,547.7
Provision for Credit Losses (2.5) 0.5 66.0 61.0 (1.0)
Noninterest Expense 1,151.0 1,094.7 1,036.9 1,065.6 1,072.3
Income before Income Taxes 373.4 389.9 403.2 461.1 476.4
Provision for Income Taxes 132.5 95.4 89.9 100.5 105.3
Net Income $ 240.9 $ 294.5 $ 313.3 $ 360.6 $ 371.1
Per Common Share Net Income - Basic $ 1.13 $ 1.32 $ 1.47 $ 1.56 $ 1.71
- Diluted 1.12 1.32 1.46 1.55 1.70
Cash Dividends Declared per Common Share 0.70 0.70 0.70 0.70 0.70
Book Value (EOP) 51.87 51.38 50.45 48.04 46.82
Market Value (EOP) 93.14 77.97 79.34 75.46 106.24
Financial Ratios Return on Average Common Equity 8.8 % 10.5 % 12.2 % 13.4 % 14.8 %
Return on Average Assets 0.67 0.83 0.91 1.17 1.25
Net Interest Margin (GAAP) 1.01 1.01 1.20 1.48 1.56
Net Interest Margin (FTE*) 1.05 1.03 1.22 1.51 1.59
Assets Under Custody / Administration ($ in Billions) - EOP Corporate & Institutional Services $ 13,653.1 $ 12,263.2 $ 11,347.1 $ 10,236.5 $ 11,311.6
Wealth Management 879.4 814.4 751.2 640.1 738.8
Total Assets Under Custody / Administration $ 14,532.5 $ 13,077.6 $ 12,098.3 $ 10,876.6 $ 12,050.4
Assets Under Custody ($ In Billions) - EOP Corporate & Institutional Services $ 10,387.7 $ 9,312.2 $ 8,542.7 $ 7,620.8 $ 8,497.8
Wealth Management 875.1 810.4 747.9 633.9 735.7
Total Assets Under Custody $ 11,262.8 $ 10,122.6 $ 9,290.6 $ 8,254.7 $ 9,233.5
Assets Under Management ($ In Billions) - EOP Corporate & Institutional Services $ 1,057.5 $ 993.2 $ 954.0 $ 842.6 $ 917.5
Wealth Management 347.8 318.5 303.8 276.7 313.8
Total Assets Under Management $ 1,405.3 $ 1,311.7 $ 1,257.8 $ 1,119.3 $ 1,231.3
Asset Quality ($ In Millions) - EOP Nonaccrual Loans and Leases $ 131.7 $ 98.0 $ 98.5 $ 103.9 $ 83.6
Other Real Estate Owned (OREO) 0.7 0.9 0.9 1.6 3.2
Total Nonaccrual Assets $ 132.4 $ 98.9 $ 99.4 $ 105.5 $ 86.8
Nonaccrual Assets / Loans and Leases and OREO 0.39 % 0.30 % 0.29 % 0.28 % 0.28 %
Gross Charge-offs $ (6.7) $ (0.8) $ (0.4) $ (1.8) $ (3.8)
Gross Recoveries 1.2 1.2 3.0 1.1 1.5
Net Recoveries (Charge-offs) $ (5.5) $ 0.4 $ 2.6 $ (0.7) $ (2.3)
Annualized Net Recoveries (Charge-offs) to Avg Loans and Leases (0.07) % — % 0.03 % (0.01) % (0.03) %
Allowance for Credit Losses Assigned to:
Loans and Leases $ 190.7 $ 215.4 $ 210.2 $ 147.2 $ 104.5
Undrawn Loan Commitments and Standby Letters of Credit 61.1 44.9 49.0 40.4 19.9
Debt Securities and Other Financial Assets 8.1 7.6 7.8 10.8 —
Loans and Leases Allowance / Nonaccrual Loans and Leases 1.4x 2.2x 2.1x 1.4x 1.3x
(*) Net interest margin presented on an FTE basis is a non-generally accepted accounting principle financial measure that facilitates the analysis of asset yields. Please refer to the Reconciliation to Fully Taxable Equivalent section for further detail.
NORTHERN TRUST CORPORATION Page 8
(Supplemental Consolidated Financial Information)