q4 2017 interim report 13th february 2018, ceo robin reed€¦ · q4 2015 q1 2016 q2 2016 q3 2016...
TRANSCRIPT

Q4 2017 Interim Report13th February 2018, CEO Robin Reed

Founder & CEO
Robin Reed
Group CFO
ToreFormo
“Opening up iGaming,to make it fair & fun for all”
Todays Presenters
GiG overviewTechnology companyprovidingproductsandservicesthroughout theentirevaluechainintheiGaming industry
Founded in2012HQinMalta,withofficesinDenmark,Norway,SpainandGibraltar650GIGsters looking todisrupt theiGaming industry

• Major breakthrough for GiG Platform Services, entering regulated US market through partnership with Hard Rock International
• Successful launch of Highroller.com
• Developed management structure to enable continued, rapid growth and efficiency
• New headquarters and campus in Malta
Highlights Q4 2017

Q4 2017 EBITDA
€120.4m
2017 revenues
€12.5M
2017 EBITDA
Financial highlights
Q4 and FY 2017
€39.9M
Q4 2017 revenues+ 125% Y/Y + 29% Q/Q+ 115% Y/Y + 159% Q/Q
€7.9M
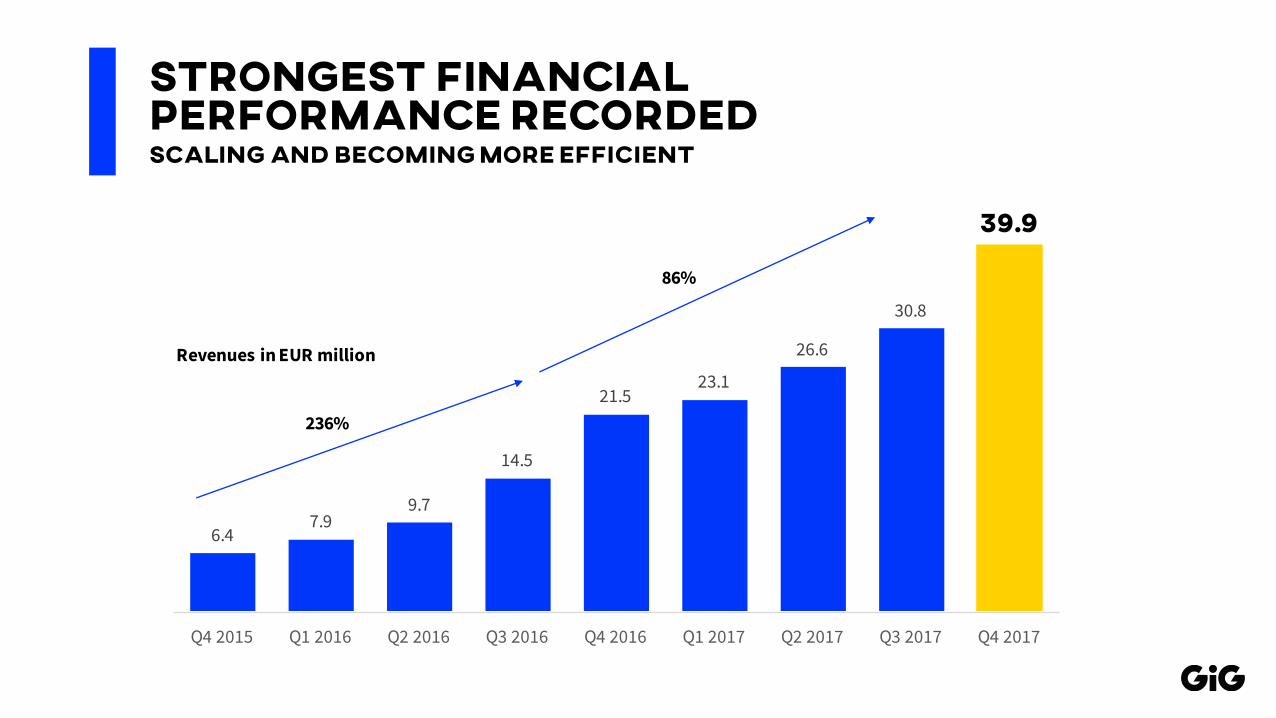
6.47.9
9.7
14.5
21.523.1
26.6
30.8
39.9
Q4 2015 Q1 2016 Q2 2016 Q3 2016 Q4 2016 Q1 2017 Q2 2017 Q3 2017 Q4 2017
Strongest financial performance recorded Scaling and becoming more efficient
Revenues in EUR million
236%
86%

CEORobin Reed
CFO Finance
Justin Psaila
COOOperations
Mikael Angman
CTOTechnology
Edgars Peics
CMOMarketing
Tomas Backman
CCOCommercial
Ben Clemes
CDODigital
Richard Brown
Poised for the next stepDeveloped vision and management structure
CEO’s office advisory team
Head of Business Development
Group Chief Financial Officer
Head of Investor Relations
Head of Design Head of Communications
Head of Legal/ Regulatory Compliance
& Deputy DPO
Morten Hillestad Tore Formo *Starting in Q2 2018 Clayton Tonna Natasha Gowans Claudio Caruana
“OpeningupiGaming,tomakeitfairandfunforall”
C-Level Management Team

GIG Media GIG Core GIG Sports & Games GIG Gaming
Digital marketing
services
Platform services
Sports & Games services
Operators
Finding and referring leads to operators
Offering cloud based platform services to
operators
Odds for sportsbooks and games for casino operators
Seven consumer facing brands
Connecting end-users, operators & suppliers
The GIG eco-system Disrupting the value chain in iGaming
Revenue share & fixed fees Bets - WinsRevenue share & fixed fees Revenue share & fixed fees
B2B B2B B2B B2C

Business update

GiG Sports & Games
GiG Media
GiG Gaming
Digital marketing and lead generation
GIG Media• 35,200 FTD’s referred in Q4 17,
up from 29,050 in Q3 17
• ~ 10,000 FTD’s referred to operators in GIG’s eco-system
• 74% of revenues from revenue share agreements
• Digital media buy company, Rebel Penguin acquired in September- Acquisition price of EUR 13
million- Q4 17 revenue contribution of
EUR 1.5m and Q4 17 EBITDA contribution of EUR 0.3m
2.83.2
4.4
6.3
8.5
1.82.2
3.0
4.55.2
Q4 16 Q1 17 Q2 17 Q3 17 Q4 17
Revenue EBITDA
+ 34% Revenue growth versus Q3 17
EUR million
GiGPlatform Services

GIG Sports & Games
GIG Media
GIG Platform Services
GIG Gaming
B2B offering for platform vertical
GIG Core• iGamingCloud renamed GIG Core
• EUR 2 million one-off settlement claimed in Q4
• Major breakthrough, partnership with Hard Rock International- Entering regulated US market: New
Jersey- GIG to provide Hard Rock with
platform and state of the art consumer portal
- Revenue share model – potential to be the largest platform agreement signed by GIG
2.42.8
3.5
5.1
9.6
0.90.3
1.12.0
6.6
Q4 16 Q1 17 Q2 17 Q3 17 Q4 17
Revenue EBITDA
+ 87% Revenue growth versus Q3 17
EUR million

GIG Sports & Games
GIG Media
GIG Gaming
Sports and games servicesGIG Sports & Games
-0.1
0.30.7
0.2
-0.1-0.2 -0.2 -0.2
-1.2 -1.6
Q4 16 Q1 17 Q2 17 Q3 17 Q4 17
Revenue EBITDA
EUR million GIG Platform Services
• Developing games services for sports betting and casino- Odds for sportsbook - Games for casino operators
• Games services are licensed, and certified odds or casino games
• Can be plugged directly into the consumer portal of any operator
• 100+ staff dedicated to Sports and Games projects

GIG Sports & Games
GIG Media
GIG Gaming
B2B offering for the sportsbetting verticalGIG Sports (previously labelled Betting Cloud)
Scaled up sports development ahead of 2018 FIFA World Cup
3 new B2B products for sports to be launched in H1 2018
GIG Sports Connect
In-House and aggregated odds & data
GIG Trader
Full suit of trading and risk management tools
GIG Goal
Mobile first Sports Front End
GIG Platform Services

GIG Sports & Games
GIG Media
GIG Gaming
GIG Casino ServicesB2B offering Casino vertical
GIG Platform Services
GIG Casino Connect & GIG Games to be launched in Q3.
GIG Casino Connect
All games in one feed
GIG Games
Proprietary Games
GIG Magic
Mobile first Casino Front End
GIG Magic sold to 3 clients

GIG Sports & Games
GIG Media
GIG Gaming
B2C operator offering Casino, Sportsbetting & Poker through 7 brands and websites
GIG Gaming
• GiG Gaming marketing expense of EUR 13.5 million- Front-loaded marketing of EUR 8.9m- Revenue share expense of EUR 4.6m
- Total marketing 53% of B2C revenues, down from 57% in Q3 17
• 182,565 active real money players in Q4 17, up from 169,791 in Q3 17
• 96% of revenues generated from core markets in Q4 17- Nordics largest market (76%), followed by UK
& Ireland (11%) and Central Europe (9%)
EUR million
17.9 18.5 20.2 21.925.4
1.3
-2.7 -1.9 -2.3 -2.1 Q4 16 Q1 17 Q2 17 Q3 17 Q4 17
Revenue EBITDA
+ 42% Revenue growth versus Q4 16
GIG Platform Services

Successful Casino launch
Highroller.com
• Seeking to disrupt the casino vertical by offering a personalized, interactive and gamified experience
• Returned the best acquisition launch KPIs of a gaming product by GIG
• Tracking ahead of budget with January 2018 revenues of EUR 800,000 - Success to be determined by retention

Payment service directive 2Has come into effect and in order to stay compliant, GIG has removed all fees incurred customers on transactions (as of January, 13)
GIG is exploring a range of additional licenses and markets –long term aim to operate in most regulated markets
NorwayOpposition parties intend to introduce a restrictive bill
SwedenBetting license to be applicable in Sweden from January 2019
HollandNew legislation in 2019
DenmarkWork paused due to New Jersey license
Regulatory update
United KingdomSignificantly sharpened standards for all operators

Developing organization Attracting and retaining senior staff for increased structure and efficiency
26% 26% 25% 22% 25% 24% 25% 21%
0.05.0
10.015.020.025.030.035.040.045.0
Q1 Q2 Q3 Q4 Q1 Q2 Q3 Q4
Revenue Personell cost as % of revenue
EUR millionOSLOKRISTIANSAND
COPENHAGEN
Marbella
GibraltarMALTA Headquarter
MALTA Headquarter
2016 2017

Financial update

12 months rolling revenues EUR million
1823
29
38
54
69
86
102
120
Q4 2015 Q1 2016 Q2 2016 Q3 2016 Q4 2016 Q1 2017 Q2 2017 Q3 2017 Q4 2017-1.9 -1.8
-0.9
0.2
5.85.5
6.5
8.4
12.5
Q4 2015 Q1 2016 Q2 2016 Q3 2016 Q4 2016 Q1 2017 Q2 2017 Q3 2017 Q4 2017
12 months rolling EBITDA EUR million
Strong top-lineand earnings growth

Healthy financials despite significant investments
26
12
2
1
Cash and cash equivalents at 30 September 2017
Cash flow from operating activities
Cash flow from investment activities
Cash flow from financing activities
Translation gain and fair value movements
Cash and cash equivalents at 31 December 2017
(16) (1)
EUR million

• Seek to be a frontrunner in improving the user experience, regulatory standing and social impact of the industry
• New sportsbook and games offering to have strong impact on both B2B and B2C
• Aiming for New Jersey license in H1 2018
• Exploring several acquisition opportunities
• Sustain strong and governed growth whilst increasing operational efficiency
OUTLOOK

Q/A

Appendix

Largest ShareholdersShareholder # shares %
Bryggen Holding AS 118 178 394 13.2 %
Optimizer Invest Ltd. 103 373 297 11.5 %
Swedbank Robur Ny Teknik 80 275 000 9.0 %
Super Innovative Limited (Robin Reed) 64 464 272 7.2 %
Hans Michael Hansen 50 104 461 5.6 %
Frode Fagerli 38 752 671 4.3 %
Avanza Bank AB nom. 20 721 408 2.3 %
Skandinaviska Enskilda Banken nom. 19 483 418 2.2 %
Ben Clemes 18 821 468 2.1 %
CMM Invest AS 18 024 671 2.0 %
Anders Berntsen 17 150 713 1.9 %
Digeelva Invest AS 16 140 292 1.8 %
Fondita Nordic Micro Cap 14 100 000 1.6 %
Svenska Handelsbanken nom. 12 387 599 1.4 %
Prioritet Capital AB 11 956 957 1.3 %
Carnegie Investment nom. 11 818 263 1.3 %
Nordnet Bank AB nom. 11 799 952 1.3 %
G.F. Invest AS 11 716 054 1.3 %
Saxo Bank A/S nom. 11 400 975 1.3 %
Nordea Bank AB 9 515 197 1.1 %
Other 235 471 204 26.3 %
Total issued shares 895 656 266 100.0 %

Income statementCondensed Statements of Operations in EUR 1 000 (Unaudited) Q4 2017 Q4 2016 2017 2016
Revenues 39 929 21 495 120 423 53 605
Cost of sales 6 516 4 052 20 521 9 285
Gross profit 33 413 17 443 99 902 44 320
Gross profit margin 84 % 81 % 83 % 83 %
Marketing expenses 13 102 7 007 47 093 19 094 Other operating expenses 12 418 6 574 40 288 19 411 Total operating expenses 25 520 13 581 87 381 38 505
EBITDA 7 893 3 862 12 521 5 815 Depreciation & amortization 4 334 1 067 10 912 3 046
EBIT 3 559 2 795 1 609 2 769
Other income (expenses) 119 -568 -1 054 -1 349Unrealized (loss) gain on derivative asset 0 0 0 1 338Result before income taxes 3 678 2 227 555 2 757Income tax refund (expense) -891 -251 -973 -364Net result 2 787 1 976 -418 2 394
Marketing in % of revenue: 33 % 33 % 39 % 36 %Other operating in % of revenue: 31 % 31 % 33 % 36 %EBITDA in % of revenue: 20 % 18 % 10 % 11 %

Cash flow
In EUR 1 000 Q4 2017 Q4 2016 2017 2016
Cash flow from operating activities 1 994 -476 13 413 2 221
Cash flow from investment activities -15 820 -1 065 -66 714 -5 061
Cash flow from financing activities 1 016 -314 60 635 7 052
Translation loss -846 -218 -2 571 -200
Fair value movements -12 -195 1 281 -70
Net change in cash and cash equivalents -13 668 -2 268 6 044 3 943
Cash and cash equivalents at start of period 25 747 8 303 6 035 2 092
Cash and cash equivalents at end of period 12 079 6 035 12 079 6 035

Balance sheet
Condensed Balance Sheet in EUR 1 000 (Unaudited) 2017 2016
AssetsGoodwill 69 444 63 955
Intangibles and other non-current assets 99 176 43 638
Total non-current assets 168 620 107 593
Other current assets 24 963 12 680
Cash and cash equivalents 12 079 6 035
Total current assets 37 042 18 715
Total assets 205 662 126 308
Liabilities and shareholders' equityTotal shareholders' equity 108 784 105 175
Short term loans 0 3 407
Other current liabilities 28 568 15 066
Total current liabilities 28 568 18 473
Bond payable 66 466 0
Other long term liabilities 1 844 2 661
Total liabilities 96 878 21 134
Total liabilities and shareholders' equity 205 662 126 308