q4 2015 new vehicle leasing: facts, figures and future ...€¦ · q4 2015 new vehicle leasing:...
TRANSCRIPT

Q4 2015
New Vehicle Leasing: Facts, Figures and Future ConsiderationsAT A GLANCE■■ A history of new vehicle leasing
■■ Leasing’s role in the recovery of new vehicle sales post–Great Recession
■■ Lease origination and maturity trends
■■ Used vehicle price implications
NADA Used Car Guide and its logo are registered trademarks of National Automobile Dealers Association, used under license by J.D. Power and Associates.
New Vehicle Leasing: Facts, Figures and Future Considerations
866.976.6232 | nada.com/b2b | 2
IntroductionFor decades, vehicle leasing has provided an appealing alternative to car buying, whereby monthly payments are made over a fixed term in exchange for use of an automobile. The consumer, or lessee, benefits because, in most cases, lease payments are lower than loan payments, as the amount owed on a lease is largely based on the difference between the manufacturer’s suggested retail price (MSRP) and forecasted residual value. The lessor benefits by earning income on the asset over the initial lease term and can realize additional revenue when the vehicle is returned and sold as used down the road.
But despite its positives, leasing has had a somewhat turbulent history in the United States. After years serving as a niche alternative to an outright purchase, new vehicle leasing grew rapidly in the mid-1990s when automakers and lenders promoted it to accelerate retail deliveries and push revenue growth. Eventually, inflated residual values and lower used vehicle prices — dictated in part by a surge in off-lease volume — led to monumental
losses for manufacturers, captive finance companies and banks alike, and the ensuing fallout sharply curtailed lease business in the years that followed.
Fast-forward more than a decade, and leasing has once again taken off. J.D. Power and Associates estimates that the total number of new vehicles leased by consumers reached an all-time high of nearly 3.5 million units in 2014, and lease volume is poised to reach a new high again this year.
To better understand how the current lease environment compares with the past, this report provides a historical review of new vehicle leasing, an examination of current lease trends and an assessment of how the rise in off-lease volume could impact used vehicle prices in the future.
Figure 1
Lease Share of New Retail Deliveries: 1992–2000
CALENDAR YEARLease Share of New Retail Deliveries: 1992–2000 | Source: IHS Automotive
1992 1993 1994 1995 1997 1998 1999 20000%
5%
10%
15%
20%
25%
30%
1996
8.6%
11.7%
17.6%
20.1%
23.8%
27.4%25.6% 25.6%
22.3%

New Vehicle Leasing: Facts, Figures and Future Considerations
866.976.6232 | nada.com/b2b | 3
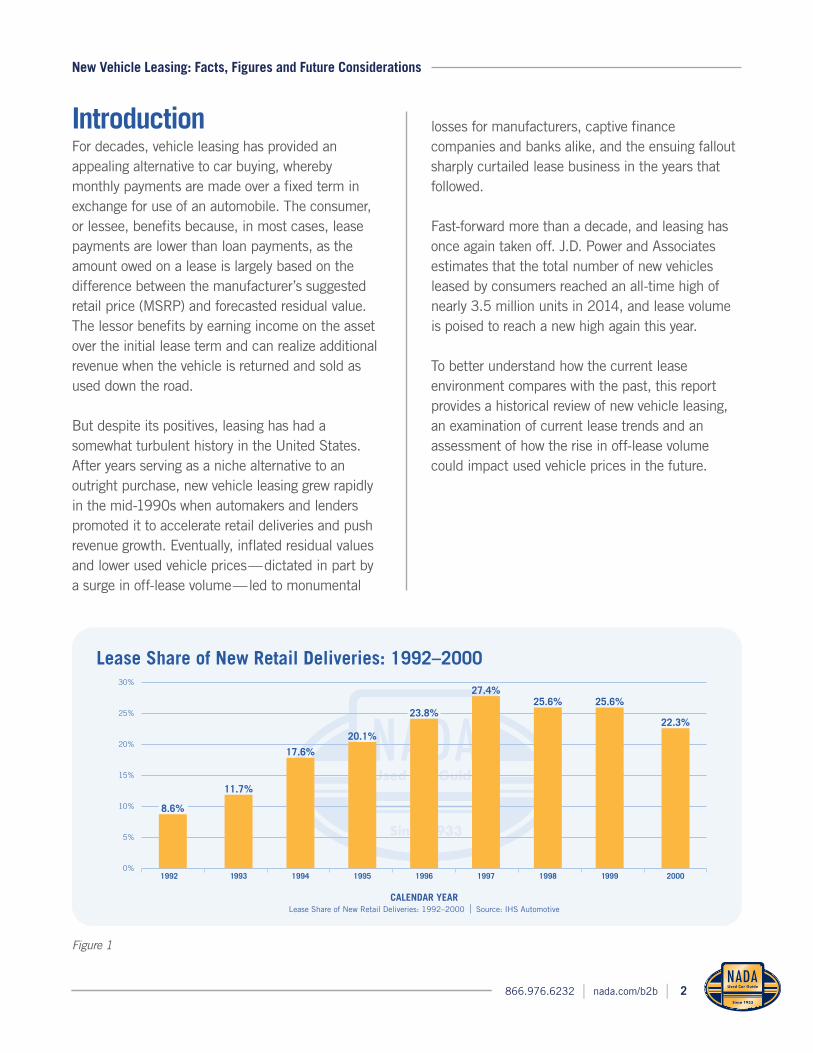
Historical Review of LeasingHistorically, leasing has been concentrated most heavily among luxury segments — particularly up until the early 1990s, when leasing was utilized sparingly for non-premium models. But the industry saw a rise in overall penetration rates throughout the 1990s as lease share of new retail deliveries more than tripled, rising from an average of 8.6% in 1992 to more than 27% in 1997 (figure 1, page 2).1 The volume of originated leases climbed by more than 67% over the period, rising from 1.96 million in 1994 to a then-record of 3.29 million in 1997.
Even comparatively inexpensive compact and midsize passenger cars exhibited growth in leasing during this time, but the most notable shifts occurred among sport utilities and, to a
lesser extent, large pickups, as the popularity of larger, more versatile models increased. In 1992, the combined lease penetration of the 6 aforementioned segments was just 7.1%, which was less than the 8.6% average for the industry that year. However, 5 years later, their collective penetration rate jumped to 28%, passing the 27.4% rate for the industry overall.
Looking to capitalize on skyrocketing consumer demand for utilities and pickups, automakers and finance companies increasingly turned to leasing as a means of lowering monthly payments on these relatively expensive vehicles. As a result, roughly 40% of new utility deliveries and 20% of large pickups were leased in 1997 (figure 2).
Lease Share of New Retail Deliveries: 1994 vs.1997
Lease Share of New Retail Deliveries: 1994 vs. 1997 | Source: IHS Automotive
0% 10% 20% 30% 40% 50%
43%25%
9%
Large Pickup
Midsize Pickup
Compact Car
Compact Utility
Midsize Van
Midsize Car
Large Utility
Midsize Utility
29%
25%14%
23%5%
22%14%
21%9%
20%10%
22%
38%
19971994
Figure 2
1 Lease penetration and volume figures up to 2000 were sourced from IHS Automotive. Figures cited after 2000 were sourced from J.D. Power.

New Vehicle Leasing: Facts, Figures and Future Considerations
866.976.6232 | nada.com/b2b | 4
Between 1994 and 1997, new retail deliveries improved by 1.4%. However, the rise was driven by a 58% increase in lease volume, as retail purchases declined by 11% over the period (figure 3).
During that period, automakers and captive finance companies began to inflate residual values and offer consumers even lower monthly payments. The logic was that they could incorporate marketing expenses into the sales prices of lease vehicles and turn a profit by making money off finance and insurance products, parts, accessories, service and so on. In order to remain competitive, banks responded by artificially raising residuals instead of following values published by industry guidebooks.
The lack of foresight throughout the industry and an affinity for 24-month leases greatly increased risk, but it wasn’t until large quantities of off-lease vehicles hit the used market in the late 1990s that finance companies began to feel the pain caused by adjusting residual values.
Coinciding with rapidly rising new vehicle incentives, the influx of used supply spearheaded a steep decline in used vehicle prices. Making matters worse, lease turn-ins increased between 1998 and 1999, as consumers were increasingly unwilling to purchase their off-lease cars for more than market value. Bowing to the pressure, used vehicle prices fell by an average of 3.4% per year from 2000 to 2003. By the end of the period, prices were about 13% lower than in 1999 (figure 4, page 5).
With value retention well below the residual values set when the cars were new, bank and captive finance companies were left with portfolios full of used vehicles worth substantially less than expected based on forecasted residuals. All told, CNW Marketing Research estimated the overall hit to lenders at $11 billion in 2000 and an additional $13 billion in 2001.
Figure 3
NEW
VEH
ICLE
RET
AIL
DELI
VERI
ES (I
N M
ILLI
ONS)
New Vehicle Retail Deliveries: 1992–2000
CALENDAR YEARNew Vehicle Retail Deliveries: 1992–2000 | Source: IHS Automotive
1992 1993 1994 1995 1997 1998 1999 20000
2
4
6
8
10
12
14
1996
8.30 8.91 9.22 8.83 8.51 8.24 8.169.56 10.36
0.781.18
1.96 2.22 2.66 3.11 2.81
3.292.97
LeasePurchase

New Vehicle Leasing: Facts, Figures and Future Considerations
866.976.6232 | nada.com/b2b | 5
While automakers were able to help absorb some of the blow taken by captive finance companies, banks had no such protection. By the early 2000s, numerous banks such as First Union and Wachovia had either exited the leasing game altogether or had seriously curtailed the number of leases originated. Even though major captives such as GMAC and Ford Credit were able to share risk with other divisions within their respective companies, losses were so significant they began to focus more on financing the selling of cars as opposed to leasing.
By 2003, lease penetration had fallen to 15% of total new retail deliveries. Leasing recovered somewhat in the mid-2000s, reaching nearly 20% of new retail deliveries by 2007, but it took more than 15 years for leasing to approach the previous high set back in the late 1990s.
Leasing ResurgenceLeasing has surged over the past few years, due in large part to an exceptional rise in used vehicle prices and retained value that has reduced risk for lenders as well as monthly payments for consumers.
A drastically reduced supply of used vehicles — due to stronger demand combined with a recession-based drop in new sales — helped boost used vehicle prices by more than 18% from 2007 to 2014, placing prices among the highest levels ever reached.
Retained value also improved markedly over the period. In 2007, averaged retained value for 3-year-old units stood at approximately 45% of equipped new vehicle prices. In 2014, 3-year-old retention hit 54.4% — a substantial 9 percentage point increase across the previous 7 years (figure 5, page 6).
Figure 4
NADA Used Car Guide Used Vehicle Price IndexVehicles up to 8 years in age (1995 = 100).
CALENDAR YEARNADA Used Car Guide Used Vehicle Price Index | Source: NADA Used Car Guide
1996 1997 1998 2000 2001 2002 20031995 20041999
1999: Volume peak, new leases
Used price decline: -3.4% per year; -13% overall
50
60
70
80
90
100
110

New Vehicle Leasing: Facts, Figures and Future Considerations
866.976.6232 | nada.com/b2b | 6
Hypothetically, the improvement in retained value that occurred between the two periods would have reduced the amount of principle required to be paid on a 3-year lease of a $25,000 vehicle by $2,376 — a reduction of 18%.
Lease Share of New DeliveriesAn analysis of J.D. Power Power Information Network® (PIN) data reveals that leasing quickly regained lost ground following the end of the Great Recession, improving from 13.5% in 2009 to an average of 19.1% in 2010.2 Averaging just over 20%, lease penetration was relatively flat from 2011 to 2012 before jumping by more than 3 percentage points in 2013 to 24% of all retail deliveries. Lease penetration grew to 25.7% in 2014 and has climbed by nearly 2 percentage points more so far this year to 27.8%, on pace to top 1997’s all-time high of 27.4% (figure 6, page 7).
In volume terms, J.D. Power estimates the number of new retail leases originating in 2010 reached 1.75 million units; by 2014, retail leases had risen to 3.48 million — effectively doubling the level reached 4 years earlier and easily surpassing 1999’s previous high of nearly 3.3 million. Retail lease volume through September of this year stood at 2.95 million, up almost 13% over the first 9 months of last year. Barring an unexpected pullback in activity in Q4, the total number of retail leases originated this year should once again set a record.
Perhaps no statistic better encapsulates the importance of leasing to the recovery of the new vehicle market than its contribution to total retail sales growth. It’s estimated that new vehicle retail deliveries grew by approximately 714,000 units from 2013 to 2014, while lease volume grew by just over 396,000. This means leasing was responsible for a net 55% of retail sales growth over the period. Leasing has assumed an even larger share of new retail sales growth this year, as the additional
Figure 5
3-Year-Old Used Vehicle Retained ValueAverage trade-in value divided by MSRP (typically equipped).
CALENDAR YEAR3-Year-Old Used Vehicle Retained Value | Source: NADA Used Car Guide
2007 2008 2009 2011 2012 2013 201420102006 2015*
*Data reported for January–September 2015.
30%
35%
40%
45%
50%
55%
60%
47.6%
44.9% 44.4%
38.8%
47.5%
51.3%52.9%
54.3% 54.4%53.2%
2 The J.D. Power Power Information Network (PIN) provides real-time automotive information and decision-support tools based on the collection and analysis of daily
new and used vehicle retail transaction data from thousands of automotive franchises.

New Vehicle Leasing: Facts, Figures and Future Considerations
866.976.6232 | nada.com/b2b | 7
335,000 units leased through September compose 76% of the 440,000-unit rise in total retail deliveries (table 1).
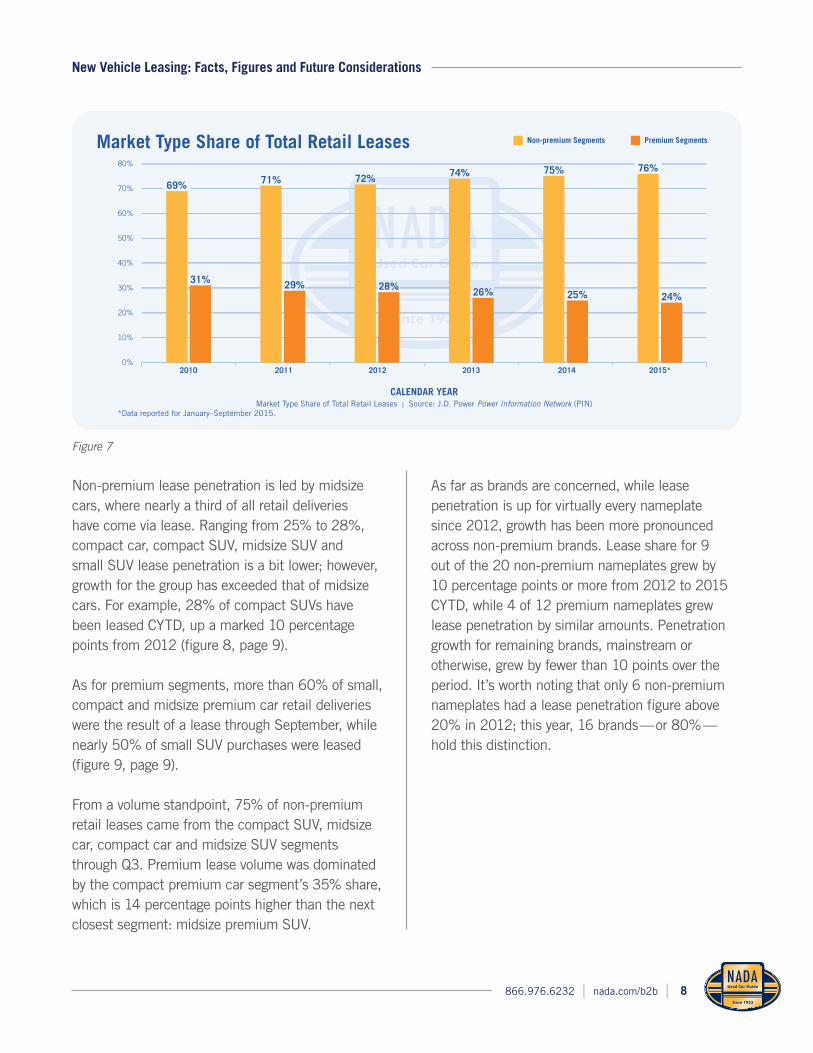
Leasing by Market Type, Segment and BrandLeasing within non-premium and premium segments has risen by similar amounts over the past 3 years, as the average lease share within both groups increased by 7 percentage points from 2012
through 2015 CYTD to respective averages of 24% and 52%.
But while lease growth has been similar within each group, non-premium segments have assumed a larger share of the overall lease total. Non-premium segments were responsible for 76% of all leases originated through Q3, up from 75% over all of 2014. Conversely, premium segments lost a point of share, dropping to 24% from 25% last year (figure 7, page 8).
Lease Share of New Retail Deliveries
CALENDAR YEARLease Share of New Retail Deliveries | Source: J.D. Power Power Information Network (PIN)
0%
5%
10%
15%
20%
25%
30%
2001 2002 2003 2004 2005 2006 2007 2008 2009 2010 2011 2012 2013 2014 2015*
19.9%
17.2%14.9% 15.2%
17.6%19.5% 19.7%
17.7%
13.5%
19.1%20.2% 20.7%
24.0%25.7%
27.8%
*Data reported for January–September 2015.
Figure 6
Table 1
Annual Change in New Vehicle Retail Sales | Source: J.D. Power Power Information Network (PIN)
*Data reported for CYTD 2014 vs. 2015, through September.
Calendar Year Total Retail Growth Total Lease Growth Lease Share of Total Retail Growth
2011 1,140,170 324,062 28%
2012 1,405,379 353,619 25%
2013 1,119,085 656,753 59%
2014 713,941 396,165 55%
2015* 440,090 335,512 76%
Annual Change in New Vehicle Retail Sales
New Vehicle Leasing: Facts, Figures and Future Considerations
866.976.6232 | nada.com/b2b | 8
Non-premium lease penetration is led by midsize cars, where nearly a third of all retail deliveries have come via lease. Ranging from 25% to 28%, compact car, compact SUV, midsize SUV and small SUV lease penetration is a bit lower; however, growth for the group has exceeded that of midsize cars. For example, 28% of compact SUVs have been leased CYTD, up a marked 10 percentage points from 2012 (figure 8, page 9).
As for premium segments, more than 60% of small, compact and midsize premium car retail deliveries were the result of a lease through September, while nearly 50% of small SUV purchases were leased (figure 9, page 9).
From a volume standpoint, 75% of non-premium retail leases came from the compact SUV, midsize car, compact car and midsize SUV segments through Q3. Premium lease volume was dominated by the compact premium car segment’s 35% share, which is 14 percentage points higher than the next closest segment: midsize premium SUV.
As far as brands are concerned, while lease penetration is up for virtually every nameplate since 2012, growth has been more pronounced across non-premium brands. Lease share for 9 out of the 20 non-premium nameplates grew by 10 percentage points or more from 2012 to 2015 CYTD, while 4 of 12 premium nameplates grew lease penetration by similar amounts. Penetration growth for remaining brands, mainstream or otherwise, grew by fewer than 10 points over the period. It’s worth noting that only 6 non-premium nameplates had a lease penetration figure above 20% in 2012; this year, 16 brands — or 80% — hold this distinction.
Market Type Share of Total Retail Leases
CALENDAR YEARMarket Type Share of Total Retail Leases | Source: J.D. Power Power Information Network (PIN)
2010 2011 2012 2013 2014 2015*
Premium SegmentsNon-premium Segments
69%
31%
71%
29%
72%
28%
74%
26%
75% 76%
24%25%
*Data reported for January–September 2015.
0%
20%
10%
30%
40%
50%
60%
70%
80%
Figure 7

New Vehicle Leasing: Facts, Figures and Future Considerations
866.976.6232 | nada.com/b2b | 9
Lease Share of Retail Deliveries: Non-premium Segments
CALENDAR YEARLease Share of Retail Deliveries: Non-premium Segments | Source: J.D. Power Power Information Network (PIN)
2015*2012
MidsizeCar
CompactCar
CompactSUV
MidsizeSUV
SmallSUV
MidsizeVan
LargeCar
LargeSUV
LargePickup
MidsizePickup
SmallCar
26%
32%
20%
28%
18%
28%
21%
27%
15%
25%
17%
24%
16%
23%
7%
15%
4%
13%
6%
11%
7%
11%
*Data reported for January–September 2015.
0%
5%
10%
15%
20%
25%
30%
35%
Figure 8
Lease Share of Retail Deliveries: Premium Segments
CALENDAR YEARLease Share of Retail Deliveries: Premium Segments | Source: J.D. Power Power Information Network (PIN)
2015*2012
Compact Premium Car
SmallPremium Car
MidsizePremium Car
LargePremium Car
SmallPremium SUV
MidsizePremium SUV
CompactPremium SUV
LargePremium SUV
55%
65%62%
52%
36%
61%
55%58%
24%
49%
36%
45%
30%
41%
36%
30%
*Data reported for January–September 2015.
0%
10%
20%
30%
40%
50%
60%
70%
Figure 9

New Vehicle Leasing: Facts, Figures and Future Considerations
866.976.6232 | nada.com/b2b | 10
Lease PricingSimilar to volume, new lease prices have also grown over the years. Excluding cash rebates, consumers paid an average of $34,316 on leased vehicles so far this year, up 4% (or nearly $1,500) from 2012’s full-year average of $32,843 (figure 10).3 When viewed across segments, we see that price growth has been nonexistent for compact cars, and much more significant for large pickups and SUVs (figure 11, page 11).
While lease prices are up, they haven’t grown quite as much as purchase prices, which are currently 8% higher than in 2012 (from $30,402 to $32,849 CYTD).
In aggregate, new lease prices are higher than purchase prices for the simple fact that luxury models compose a quarter of all leases and a lesser
8% to 9% of retail purchases. However, by aligning lease and purchases of the same model (e.g., 2015 Jeep Grand Cherokee), we see that lease prices tend to be somewhat lower than purchase prices (figure 12, page 11). When measured in this manner, a review of nearly 240 heavily leased vehicles from the 2015 model year reveals that lease prices were lower than purchase prices 65% of the time, with an average discount of $474.
One of the benefits of leasing instead of purchasing is lower monthly payments. CYTD, monthly lease payments are, on average, $77 less than purchase payments. In some of the most heavily leased segments, the difference in monthly payment exceeds $100.
Average New Retail Lease Prices
CALENDAR YEARAverage New Retail Lease Prices | Source: J.D. Power Power Information Network (PIN)
2012 2013 2014 2015*$20,000
$30,000
$28,000
$26,000
$22,000
$24,000
$32,000
$34,000
$36,000
$32,843$33,377 $33,831
$34,316
Prices do not include customer cash rebates.
*Data reported for January–October 2015.
Figure 10
3 Vehicle prices referenced are the price the customer pays for the vehicle and for factory- and dealer-installed accessories and options contracted at the time of sale
and adjusted by the trade-in allowance, but not adjusted for the customer cash rebate amount, if any. This price is not the MSRP.

New Vehicle Leasing: Facts, Figures and Future Considerations
866.976.6232 | nada.com/b2b | 11
Change in New Retail Lease Prices: 2012 vs. 2015*
CALENDAR YEARChange in New Retail Lease Prices: 2012 vs. 2015 | Source: J.D. Power Power Information Network (PIN)
0%
8%
6%
4%
2%
10%
12%
14%
16%
18%
0.1%
2.8%3.8% 4.1% 4.5% 4.5% 4.7% 4.8%
6.8%7.5%
12.3%
16.6%
MidsizeCar
CompactCar
CompactSUV
CompactPremium
SUV
CompactPremium
Car
LargePremium
Car
MidsizePremium
SUV
AllNameplates
MidsizePremium
Car
MidsizeSUV
LargeSUV
LargePickup
*Data reported for January–October 2015.
Figure 11
RETA
IL P
RICE
DIF
FERE
NCE
(LEA
SE M
INUS
PUR
CHAS
E PR
ICE)
New Vehicle Retail Price Comparison: Lease vs. PurchaseThe difference between new consumer lease and purchase prices in CY2015 for model year 2015 vehicles. Prices do not include customer cash rebates.
MODEL COUNTNew Vehicle Retail Price Comparison: Lease vs. Purchase | Source: J.D. Power Power Information Network (PIN)
2500 50 100 150 200
Lease price below purchase price
Lease price above purchase price
$0
-$6,000
-$4,000
-$2,000
$2,000
$4,000
$6,000
Figure 12

New Vehicle Leasing: Facts, Figures and Future Considerations
866.976.6232 | nada.com/b2b | 12
While lease prices have grown moderately over the past few years, monthly payments have changed little. At a market level, monthly lease payments are averaging $6 less so far this year than in 2012. Changing mix has something to do with this; however, results are generally similar when payments are viewed across segments (the large SUV segment being an exception) (figure 13).
So why have lease payments stayed flat, even though prices have grown? The retained value improvements discussed earlier help control monthly payments; however, their influence on payments should have gradually waned over the past few years. This is because vehicles leased from 2013 to 2015 are due to hit the market in large quantities in 2016 and beyond, when many, including NADA Used Car Guide, project a decline in retained value.
The more likely cause of flat lease payments is higher incentives. Total lease subvention rose by 7% in 2014 to an average of $5,773 per unit, and has increased by an additional 9% to an average of $6,281 CYTD. While incentives have largely been centered on residual and interest rate subvention — residual and APR subvention stand at $2,787 and $2,399 CYTD, up 9% and 4%, respectively versus 2014 — cash discounts have progressively taken on a more prominent role. Lease cash offers have jumped by 39% so far this year to an average of $1,874 per unit (up $521) (figure 14, page 13).
The increase in lease cash incentives is probably partially responsible for the rise in lease down payments observed this year. After remaining flat the previous 3 years, the amount of money consumers are putting down on new leases has grown from $2,979 in 2014 to $3,220 CYTD (up 8%).4
Average Monthly Retail Lease Payments2015*201420132012
CALENDAR YEARAverage Monthly Retail Lease Payments | Source: J.D. Power Power Information Network (PIN)
*Data reported for January–October 2015.
$0
$200
$100
$300
$400
$500
$700
$600
$800
$900
CompactCar
CompactSUV
CompactPremium
Car
CompactPremium
SUV
MidsizeCar
MidsizeSUV
MidsizePremium
Car
MidsizePremium
SUV
LargeSUV
AllNameplates
Figure 13
4 Total down is the total amount of cash and equity applied as a down payment on the vehicle. For lease transactions, total down is the total initial payment
(also known as “drive-off") that the customer must make at the time of vehicle delivery. Total down includes cash down payment, trade-in equity and
customer cash rebates.

New Vehicle Leasing: Facts, Figures and Future Considerations
866.976.6232 | nada.com/b2b | 13
Lease terms and interest rates have also played a part in managing lease payments, but arguably a smaller one compared to incentives. Most retail leases CYTD, 80%, fall within a 36- to 41.9-month term, which is somewhat higher than the 74.5% share recorded in 2012 (figure 15, page 14). As for interest rates, Experian Automotive data shows that auto loan rates on new vehicles rose modestly over the first half of the year, increasing from an average of 4.56% in Q4 2014 to 4.81% in Q2 2015. Interest rates for prime and super-prime borrowers hardly changed, while rates for nonprime borrowers and below increased from 24 to 122 basis points.
Leasing’s Effect on the Used MarketThe considerable rise in new vehicle leasing will have a material effect on used vehicle supply and thus used vehicle prices. In turn, the degree to which used prices and retained value change will play an important role in dictating new lease activity moving forward.
Compared to 2014, J.D. Power estimates that lease maturities will grow by 4% this year — or nearly 95,000 units — to 2.3 million. But 2015’s off-lease estimate pales in comparison to 2016’s, when maturities are expected to rise by almost 800,000 units (up 33%). Off-lease volume is scheduled to grow by an additional 285,000 units in 2017 to 3.4 million (figure 16, page 14). Given the number of new leases originated so far this year, total off-lease volume will rise substantially yet again in 2018.
Mirroring new lease trends, off-lease volume will be greatest across non-luxury compact car, midsize car, compact SUV and midsize SUV segments over the next two years (figure 17, page 15). In growth terms, it’s estimated there will be 116% more compact SUV lease maturities hitting the market in 2017 than this year. Midsize SUV and compact off-lease supplies are scheduled to grow by 57% and 44%, respectively, and midsize car supply by 23%. The number of non-premium vehicles hitting the market is expected to rise by 58% over the period, while premium volume should be up a much smaller 16%.
INCE
NTIV
E-TY
PE S
UBVE
NTIO
N
New Vehicle Lease Incentives
CALENDAR YEARNew Vehicle Lease Incentives | Source: J.D. Power Power Information Network (PIN)
$0
$500
$1,000
$1,500
$2,000
$2,500
$3,500
$3,000
$0
$1,000
$2,000
$3,000
$4,000
$5,000
$7,000
$6,000
APR SubventionResidual SubventionCashTotal Lease Subvention
TOTA
L SU
PPOR
TED
LEAS
E SU
BVEN
TION
201520142013201220112010
Data reported for January–September, each calendar year.
Figure 14

New Vehicle Leasing: Facts, Figures and Future Considerations
866.976.6232 | nada.com/b2b | 14
Retail Lease Term DistributionTerm share of total leases.
LEASE TERM (IN MONTHS)Retail Lease Term Distribution | Source: J.D. Power Power Information Network (PIN)
0–23.9 24–29.9 30–35.9 36–41.9 42–47.9 48+
0.3% 0.1%
12.3% 10.1%
1.9% 0.9%
74.5%80.0%
3.5% 1.8%7.4% 7.1%
2015*2012
*Data reported for January–October 2015.
0%
20%
10%
30%
40%
50%
60%
70%
90%
80%
Figure 15
PROJ
ECTE
D IN
DUST
RY L
EASE
MAT
URIT
IES
(IN M
ILLI
ONS)
Estimated Lease Maturities
CALENDAR YEAREstimated Lease Maturities | Source: J.D. Power Power Information Network (PIN)
0
1.5
1.0
0.5
2.0
2.5
3.0
3.5
4.0
2.4
1.9
1.3
1.7
2.2
3.1
2.3
3.4
2010 2011 2012 2013 2015 2016 20172014
+800K
Figure 16

New Vehicle Leasing: Facts, Figures and Future Considerations
866.976.6232 | nada.com/b2b | 15
Estimated Lease Maturities, by Segment201720162015
Estimated Lease Maturities, by Segment | Source: J.D. Power Power Information Network (PIN)
PROJ
ECTE
D IN
DUST
RY L
EASE
MAT
URI
TIES
0
200,000
100,000
300,000
400,000
500,000
600,000
CompactCar
CompactSUV
CompactPremium
Car
SmallPremium
Car
LargePremium
Car
LargePremium
SUV
MidsizeCar
MidsizeSUV
MidsizePremium
Car
MidsizePremium
SUV
LargePickup
LargeSUV
MidsizePickup
SmallSUV
MidsizeVan
LargeCar
CompactPremium
SUV
SmallCar
SmallPremium
SUV
Figure 17
The expanding pool of used vehicle supply, spearheaded by off-lease growth, will gradually compress used vehicle prices as time passes. The supply effect on used prices will be most pronounced on subcompact cars, compact cars, compact utilities and midsize utilities — both non-luxury and luxury. Utility and truck prices will be cushioned somewhat from supply’s blow by low gas prices and stronger consumer demand, while car segments will enjoy no such buffer.
Should used vehicle prices fall by an average of 2.5% per year over the next three years — which is a conservative estimate given the expected rise in supply — prices would end 2018 7.3% below 2015 levels. Under this assumption, prices would be at their lowest point since 2010.
ConclusionArguably, leasing is more appropriate today than ever before. Leasing is not only a viable alternative for consumers who prefer a shorter ownership cycle, but it also helps keep new vehicle sales on a more predictable cadence at a time when purchasers are holding onto their vehicles longer because of extended loan terms and better dependability.
Unlike in the 1990s and early 2000s, off-lease vehicles have a variety of remarketing conduits to pass through, which helps preserve value as supply makes its way from the grounding dealer, to an online sales platform, and ultimately a physical auction. Furthermore, off-lease supply helps feed growing franchised dealer demand for used vehicles in general, and consumer demand for manufacturer-backed Certified Pre-Owned vehicles.

New Vehicle Leasing: Facts, Figures and Future Considerations
866.976.6232 | nada.com/b2b | 16
Despite these positives, however, leasing still has risks.
The outlook for lower used prices means that retained value will also move lower and, by extension, so too should residual values. Complicating matters, an accelerated rate of depreciation, combined with loan terms that have increased from an average of 63 months in 2010 to more than 67 months CYTD, will increase the time it takes for consumers to accrue positive equity. This will affect a consumer’s ability to meet down payment requirements on both new vehicle loans and leases. A gradual increase in negative equity is already evident in J.D. Power PIN data. The percentage of new vehicle transactions with a trade-in where the trade payoff exceeds the trade-in actual cash value has grown to 29% CYTD from 27% in 2014 (negative equity share stood at 24% in 2012).
Considering these points, important decisions must be made regarding lease penetration, subvention and residual value planning moving forward. The choices ultimately made will play a critical role in determining if leasing will continue to grow while remaining a profitable business endeavor.
NADA Used Car GuideSince 1933, NADA Used Car Guide has earned its reputation as the leading provider of
vehicle valuation products, services and information to businesses throughout the United
States. Its team collects and analyzes over 1 million combined automotive and truck
wholesale and retail transactions per month, and delivers a range of guidebooks, auction
data, analysis and data solutions. NADA Used Car Guide, a division of J.D. Power, provides
a seamless view of timely, reliable new and used vehicle price information that helps
automotive / truck, finance, insurance and government professionals make better business
decisions. Visit nada.com/b2b to learn more.
NADA Used Car Guide's Lender Advantage Getting ahead is going to get harder, but Lender Advantage is here to help. Our team of
experts provides a full suite of vehicle analysis services that put you in the fast lane so you
can keep up with marketplace changes. From vehicle risk assessments to portfolio analysis,
remarketing planning and stress testing, we’ll give you the data and insight you need to make
the best business decisions. Depend on Lender Advantage for better outcomes. Visit
nada.com/advantage to see how we can help your business.
About NADA Used Car Guide
For more information on this white paper or about Lender Advantage, contact:JONATHAN BANKSVP, Vehicle Analysis & Analytics
LARRY DIXONSenior Manager, Market Intelligence
STEVE STAFFORDAccount Executive, Financial Industry, Accounting, Legal, OEM Captive

Used Car & Truck BlogKeep up with industry activity, get insight
into what lies ahead in the marketplace
and discover what’s influencing the
used vehicle valuation market with
NADA Used Car Guide’s comprehensive
market overviews and data-focused blogs.
Join the conversation at nada.com/usedcar
Commercial Truck BlogUpdated twice per week by Senior Analyst
Chris Visser, the Commercial Truck Blog
provides real-time analysis of incoming
sales data from the industry’s leading used
truck sales database. Join the conversation
at nada.com/commercialtruck
Additional ResourcesNADA GuidelinesUpdated monthly with a robust data set
from various industry sources and NADA
Used Car Guide’s own proprietary analytical
tool, NADA Guidelines provides the insight
needed to make decisions in today’s market.
Sign up to receive NADA Guidelines monthly
at nada.com/guidelines
NADA PerspectiveLeveraging data from various industry
sources and NADA Used Car Guide’s
analysts, NADA Perspective takes a deep
dive into a range of industry trends to
determine why they are happening and
what to expect in the future. Sign up to
receive NADA Perspective monthly at
nada.com/perspective
White PapersNADA Used Car Guide’s white papers and
special reports aim to inform industry
stakeholders on current and expected
used vehicle price movement to better
maximize today’s opportunities and manage
tomorrow’s risk. Sign up to receive white
papers quarterly at nada.com/whitepapers
Q3 2015
Lasting Longer: How Better Quality Is Affecting Used Vehicle DemandAT A GLANCE■■ Improvements in vehicle
dependability and durability
■■ Shifting consumer preferences for new and used vehicles
■■ The growing role of used vehicles at franchised dealerships
■■ Trends in vehicle pricing and depreciation
Read our blogsnada.com/usedcarnada.com/commercialtruck
Find us on Facebookfacebook.com/NADAUsedCarGuide
Follow us on Twitter@NADAUsedCarGde
Watch us on YouTubeyoutube.com/NADAUsedCarGuide
© 2015 J. D. Power and Associates