q4 2011 report
DESCRIPTION
We look closely at the fourth quarter of 2011. We reflect that anxiety over recent market developments is completely understandable, and it is quite human to feel concerned about events in Europe. But amid all the bad news, it is also clear that the world is changing in positive ways that provide plenty of cause for hope and, at the very least, gratitude for what we already have.TRANSCRIPT
Quarterly Market ReviewFourth Quarter 2011
Q4

Quarterly Market ReviewFourth Quarter 2011
This report features world capital market
performance in the last quarter. It begins
with a global overview, then features the
returns of stock and bond asset classes
in the US and international markets.
The report also illustrates the
performance of globally diversified
portfolios and features a topic
of the quarter.
Overview:
Market Summary
World Asset Classes
US Stocks
International Developed Stocks
Emerging Markets Stocks
Select Country Performance
Real Estate Investment Trusts (REITs)
Fixed Income
Global Diversification
Quarterly Topic: The Good Old Days

Market segment (index representation) as follows: US Stock Market (Russell 3000 Index); International Developed Stocks (MSCI World ex USA Index [net div.]), Emerging Markets (MSCI Emerging Markets Index [net div.]), Global Real Estate (S&P Global REIT Index), US Bond Market (Barclays Capital US Aggregate Bond Index), and Global Bond Market (Barclays Capital Global Aggregate Bond Index [Hedged to USD]). The S&P data are provided by Standard & Poor's Index Services Group. Russell data copyright © Russell Investment Group 1995–2011, all rights reserved. MSCI data copyright MSCI 2011, all rights reserved. Barclays Capital data provided by Barclays Bank PLC. US long-term bonds, bills, and inflation data © Stocks, Bonds, Bills, and Inflation Yearbook™, Ibbotson Associates, Chicago (annually updated work by Roger G. Ibbotson and Rex A. Sinquefield). Index performance does not reflect the expenses associated with the management of an actual portfolio. Past performance is not a guarantee of future results.
US StockMarket
GlobalReal Estate
International Developed Stocks
US Bond Market
GlobalBondMarket
+12.12% +3.51% +9.26% +1.12% +0.87%
Emerging MarketsStocks
BONDSSTOCKS
+4.42%
Market SummaryFourth Quarter 2011 Index Returns

World Asset ClassesFourth Quarter 2011 Index Returns
Market segment (index representation) as follows: US Large Cap (S&P 500 Index), US Small Cap (Russell 2000 Index), US Value (Russell 1000 Value Index), US Real Estate (Dow Jones US Select REIT Index), Global Real Estate (S&P Global ex US REIT Index), International Developed Large, Small, and Value (MSCI World ex USA, ex USA Small, and ex USA Value Indexes [net div.]), Emerging Markets Large, Small, and Value (MSCI Emerging Markets, Emerging Markets Small, and Emerging Markets Value Indexes), US Bond Market (Barclays Capital US Aggregate Bond Index), and Treasury (One-Month US Treasury Bills). The S&P data are provided by Standard & Poor's Index Services Group. Russell data copyright © Russell Investment Group 1995–2011, all rights reserved. MSCI data copyright MSCI 2011, all rights reserved. Dow Jones data (formerly Dow Jones Wilshire) provided by Dow Jones Indexes. Barclays Capital data provided by Barclays Bank PLC. US long-term bonds, bills, and inflation data © Stocks, Bonds, Bills, and Inflation Yearbook™, Ibbotson Associates, Chicago (annually updated work by Roger G. Ibbotson and Rex A. Sinquefield). Index performance does not reflect the expenses associated with the management of an actual portfolio. Past performance is not a guarantee of future results.
Led by the excellent performance of US stocks, global equity markets posted strong returns in the quarter. Those returns, however, were
not sufficient to overcome a dismal third quarter, and most markets had negative returns for the year.
Emerging Markets Small Cap Stocks

Asset Class 1 Year 3 Years* 5 Years* 10 Years*
Marketwide 1.03 14.88 -0.01 3.51
Large Cap 2.11 14.11 -0.25 2.92
Large Cap Value 0.39 11.55 -2.64 3.89
Large Cap Growth 2.64 18.02 2.50 2.60
Small Cap -4.18 15.63 0.15 5.62
Small Cap Value -5.50 12.36 -1.87 6.40
Small Cap Growth -2.91 19.00 2.09 4.48
US StocksFourth Quarter 2011 Index Returns
Quarterly returns for the broad US market,
as measured by the Russell 3000 Index, were
12.1%. Asset class returns ranged from 16.0%
for small cap value stocks to 10.6% for large cap
growth stocks.
The strongest sectors in the quarter were energy
and industrials, while the weakest one was
telecommunications services. For 2011, the
strongest sectors were utilities and consumer
staples, while the weakest ones were financials
and materials. Value outperformed growth in the
quarter, but not in 2011.
Indices are not available for direct investment. Index performance does not reflect the expenses associated with the management of an actual portfolio. Market segment (index representation) as follows: Marketwide (Russell 3000 Index), Large Cap (S&P 500 Index), Large Cap Value (Russell 1000 Value Index), Large Cap Growth (Russell 1000 Growth Index), Small Cap (Russell 2000 Index), Small Cap Value (Russell 2000 Value Index), and Small Cap Growth (Russell 2000 Growth Index). World Market Cap: Russell 3000 Index is used as the proxy for the US market. Russell data copyright © Russell Investment Group 1995–2011, all rights reserved. The S&P data are provided by Standard & Poor's Index Services Group. Past performance is not a guarantee of future results.
Period Returns (%)
Ranked Returns for the Quarter (%)
* Annualized
Small Cap Value
Small Cap
Small Cap Growth
Large Cap Value
Marketwide
Large Cap
Large Cap Growth
World Market Capitalization—US
36%US Market$15.1 Trillion

Growth
Asset Class 1 Year 3 Years* 5 Years* 10 Years*
Large Cap -12.21 8.53 -4.09 5.14
Small Cap -15.81 16.50 -3.23 9.41
Value -11.69 8.17 -5.48 5.49
Growth -12.71 8.84 -2.76 4.70
Period Returns (%)
* Annualized
International Developed StocksFourth Quarter 2011 Index Returns
In US dollar terms, the average quarterly returns for
developed non-US markets were over 3%, above the
historical average but far behind the US. For 2011,
however, developed markets as a whole lost over
12%. As in most of the past few quarters, there was
much dispersion in performance at the individual
country level. Greece, which remains at the center of
Europe’s sovereign-debt woes, was by far the worst
performer in the quarter and the year. At the other
end of the spectrum, Ireland, the Scandinavian
countries, and Australia were the top performers
for the quarter.
Indices are not available for direct investment. Index performance does not reflect the expenses associated with the management of an actual portfolio. Market segment (index representation) as follows: Marketwide (MSCI All Country World ex USA Index), Large Cap (MSCI World ex USA Index), Small Cap (MSCI World ex USA Small Cap Index), Value (MSCI World ex USA Value Index), and Growth (MSCI World ex USA Growth). All index returns are net of withholding tax on dividends. World Market Cap: Non-US developed market proxies are the respective developed country portions of the MSCI All Country World IMI ex USA Index. Proxies for the UK, Canada, and Australia are the relevant subsets of the developed market proxy. MSCI data copyright MSCI 2011, all rights reserved. Past performance is not a guarantee of future results.
Ranked Returns for the Quarter (%)
World Market Capitalization—International Developed
40%International Developed Markets$16.8 Trillion
Local CurrencyUS Currency
Large Cap
Value
Small Cap
Asset Class 1 Year 3 Years* 5 Years* 10 Years*
Large Cap -18.42 20.07 2.40 13.86
Small Cap -27.18 25.57 3.30 14.77
Value -17.86 20.32 4.26 15.90
Growth -18.97 19.82 0.54 11.81
Period Returns (%)
* Annualized
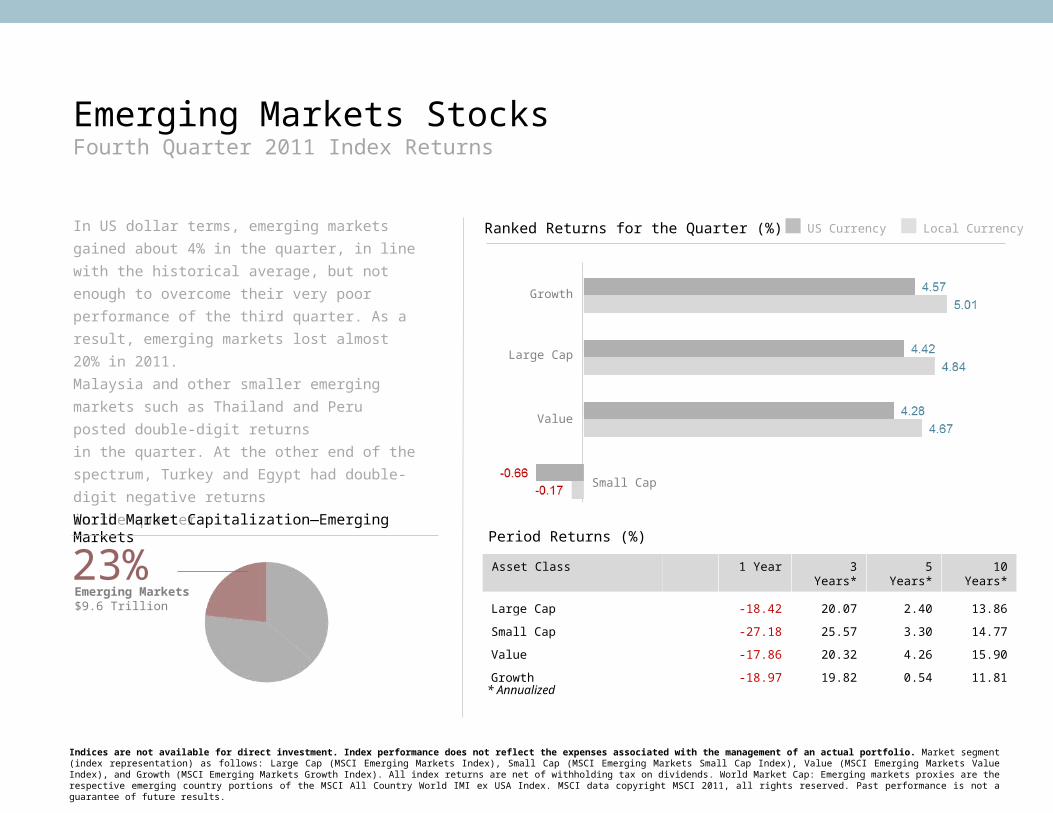
Emerging Markets StocksFourth Quarter 2011 Index Returns
In US dollar terms, emerging markets gained about
4% in the quarter, in line with the historical average,
but not enough to overcome their very poor
performance of the third quarter. As a result,
emerging markets lost almost 20% in 2011.
Malaysia and other smaller emerging markets such
as Thailand and Peru posted double-digit returns
in the quarter. At the other end of the spectrum,
Turkey and Egypt had double-digit negative returns
in the quarter.
Indices are not available for direct investment. Index performance does not reflect the expenses associated with the management of an actual portfolio. Market segment (index representation) as follows: Large Cap (MSCI Emerging Markets Index), Small Cap (MSCI Emerging Markets Small Cap Index), Value (MSCI Emerging Markets Value Index), and Growth (MSCI Emerging Markets Growth Index). All index returns are net of withholding tax on dividends. World Market Cap: Emerging markets proxies are the respective emerging country portions of the MSCI All Country World IMI ex USA Index. MSCI data copyright MSCI 2011, all rights reserved. Past performance is not a guarantee of future results.
World Market Capitalization—Emerging Markets
23%Emerging Markets$9.6 Trillion
Ranked Returns for the Quarter (%) Local CurrencyUS Currency
Growth
Large Cap
Value
Small Cap
Emerging Markets (% Returns)Developed Markets (% Returns)
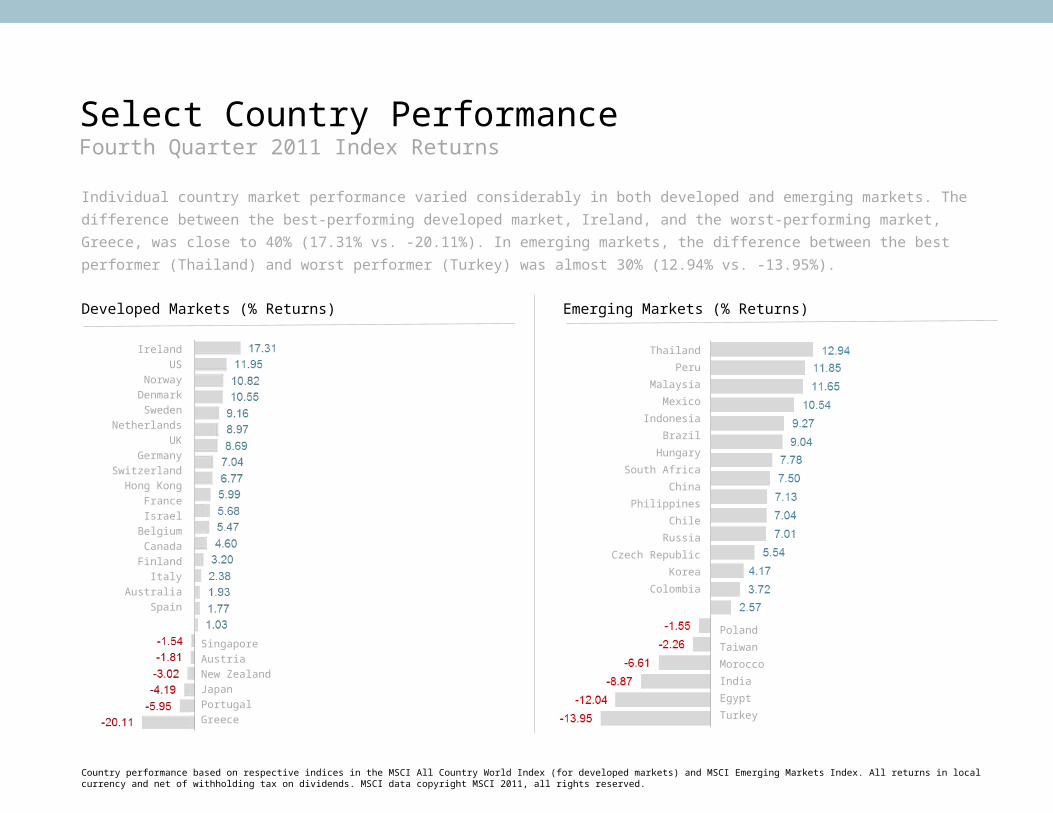
Individual country market performance varied considerably in both developed and emerging markets. The difference between the best-
performing developed market, Ireland, and the worst-performing market, Greece, was close to 40% (17.31% vs. -20.11%). In emerging
markets, the difference between the best performer (Thailand) and worst performer (Turkey) was almost 30% (12.94% vs. -13.95%).
Select Country PerformanceFourth Quarter 2011 Index Returns
Country performance based on respective indices in the MSCI All Country World Index (for developed markets) and MSCI Emerging Markets Index. All returns in local currency and net of withholding tax on dividends. MSCI data copyright MSCI 2011, all rights reserved.
Ireland
US
Norway
Denmark
Sweden
Netherlands
UK
Germany
Switzerland
Hong Kong
France
Israel
Belgium
Canada
Finland
Italy
Australia
Spain
Thailand
Peru
Malaysia
Mexico
Indonesia
Brazil
Hungary
South Africa
China
Philippines
Chile
Russia
Czech Republic
Korea
Colombia
Singapore
Austria
New Zealand
Japan
Portugal
Greece
Poland
Taiwan
Morocco
India
Egypt
Turkey

Real Estate Investment Trusts (REITs) Fourth Quarter 2011 Index Returns
Real estate securities had positive returns in the
quarter but mixed performance relative to other
asset classes. In the US, they were among the
top performers, while in other developed markets,
they trailed most other asset classes.
Indices are not available for direct investment. Index performance does not reflect the expenses associated with the management of an actual portfolio. Number of REIT stocks and total value based on the two indices. All index returns are net of withholding tax on dividends. Dow Jones US Select REIT Index data provided by Dow Jones ©. S&P Global ex US REIT Index data provided by Standard and Poor’s © 2011. Past performance is not a guarantee of future results.
Total Value of REIT Stocks
Ranked Returns for the Quarter (%)
55%US $354 Billion,79 REITs45%
World ex US $289 Billion,163 REITs (18 other countries)
Asset Class 1 Year 3 Years* 5 Years* 10 Years*
US REITs 9.37 21.63 -2.04 10.12
Global REITs (ex US) -8.61 13.86 -7.66 9.75
Period Returns (%)
* Annualized
US REITs
Global REITs (ex US)

Bond Yields across Different IssuersUS Treasury Yield Curve
12/31/10
09/30/11
12/31/11
Period Returns (%)
Fixed IncomeFourth Quarter 2011 Index Returns
The Federal Open Market Committee
maintained its target range for the federal
funds rate between zero and 0.25% in the
fourth quarter and reaffirmed its goal to
maintain that target at very low levels until
at least mid-2013.
With the exception of inflation-protected
securities, which had another outstanding
quarter, fixed income securities produced
mixed returns. Over 2011, however, fixed
income securities largely benefitted from a
sustained flight to quality and a flattening
yield curve, particularly intermediate to
long term US government securities.
Indices are not available for direct investment. Index performance does not reflect the expenses associated with the management of an actual portfolio. Yield curve data from Federal Reserve. State and local bonds are from the Bond Buyer Index, general obligation, 20 years to maturity, mixed quality. AAA-AA Corporates represent the Bank of America Merrill Lynch US Corporates, AA-AAA rated. A-BBB Corporates represent the Bank of America Merrill Lynch US Corporates, BBB-A rated. Barclays Capital data, formerly Lehman Brothers, provided by Barclays Bank PLC. US long-term bonds, bills, inflation, and fixed income factor data © Stocks, Bonds, Bills, and Inflation (SBBI) Yearbook™, Ibbotson Associates, Chicago (annually updated work by Roger G. Ibbotson and Rex A. Sinquefield). Citigroup bond indices copyright 2011 by Citigroup. The Merrill Lynch Indices are used with permission; copyright 2011 Merrill Lynch, Pierce, Fenner & Smith Incorporated; all rights reserved. Past performance is not a guarantee of future results.
Asset Class 1 Year 3 Years* 5 Years* 10 Years*
One-Month US Treasury Bills (SBBI) 0.04 0.08 1.31 1.81
Bank of America Merrill Lynch Three-Month T-Bills 0.10 0.14 1.48 1.95
Bank of America Merrill Lynch One-Year US Treasury Note 0.57 0.73 2.55 2.51
Citigroup World Government Bond 1-5 Years (hedged) 2.31 2.20 3.88 3.62
US Long-Term Government Bonds (SBBI) 28.23 6.32 10.69 8.92
Barclays Capital Corporate High Yield 4.98 24.12 7.54 8.86
Barclays Capital Municipal Bonds 10.70 8.57 5.22 5.38
Barclays Capital US TIPS Index 13.56 10.38 7.95 7.58
* Annualized

Global DiversificationFourth Quarter 2011 Index Returns
These portfolios illustrate performance of different
global stock-bond mixes. Those with larger
allocations to stocks are considered riskier but
also have higher expected returns over time.
Hypothetical allocations are for illustrative purposes only. Asset allocations and the hypothetical index portfolio returns are for illustrative purposes only and do not represent actual performance. Indices are not available for direct investment. Index performance does not reflect expenses associated with the management an actual portfolio. Global Stocks represented by MSCI All Country World Index (gross div.) and Treasury Bills represented by US One-Month Treasury Bills. Globally diversified portfolios rebalanced monthly. Data copyright MSCI 2011, all rights reserved. © Stocks, Bonds, Bills, and Inflation Yearbook™, Ibbotson Associates, Chicago (annually updated work by Roger G. Ibbotson and Rex A. Sinquefield). Indices are not available for direct investment. Index performance does not reflect the expenses associated with the management of an actual portfolio. Past performance is not a guarantee of future results.
Growth of Wealth: The Relationship between Risk and Return
Stock/Bond Mix
100% Stocks
75/25
50/50
25/75
100% Treasury
Bills
Ranked Returns for the Quarter (%)
Asset Class 1 Year 3 Years* 5 Years* 10 Years*
100% Stocks -6.86 12.60 -1.41 4.76
75/25 -4.91 9.77 -0.30 4.32
50/50 -3.10 6.73 0.52 3.68
25/75 -1.45 3.49 1.05 2.84
100% Treasury Bills 0.04 0.08 1.31 1.81
Period Returns (%)
* Annualized
Jun-
11

The Good Old DaysFourth Quarter 2011
As the year winds down, financial markets are gripped by uncertainty over developments in the Eurozone crisis. While not seeking to downplay the anxiety generated by these events, particularly in relation to their effects on investment portfolios, it's worth reflecting critically on the 20 th century, and putting current events in perspective:
•Nearly 100 years ago, Europe was engulfed by World War I. The economic effects were significant, with widespread rationing, labor shortages, and massive government borrowing.
•A little over a decade later, the Great Depression cut a swath through the global economy. In the meantime, resentment was growing in Germany over its Great War reparations to the Allied powers. Berlin resorted to printing money to pay its debts, which in turn led to hyperinflation.
•More than 50 million died in the Second World War. In economic terms, the war's impact was profound. Most of Europe's infrastructure was destroyed, millions of people were left homeless, labor shortages were rife, and rationing was prevalent.
•In the mid-1970s, the depreciation of the US dollar, the breakdown of the monetary system, and war in the Middle East encouraged major oil producers to quadruple oil prices. Stock markets collapsed and stagflation—a combination of rising inflation alongside rising unemployment—gripped many countries.
•In the past decade, there have been the tragedies of 9/11; the 2004 Asian tsunami; the 2011 Japanese earthquake, tsunami, and nuclear crisis; and now, the financial crisis sparked by irresponsible lending, complex derivatives, and excessive leverage.
Today, while the US and Europe are gripped by tough economic times, much of the developing world is thriving. Rising levels of education, health, and workforce participation also mean that foundations are being built for a healthier and more peaceful global economy .
Anxiety over recent market developments is completely understandable, and it is quite human to feel concerned about events in Europe. But amid all the bad news, it is also clear that the world is changing in positive ways that provide plenty of cause for hope and, at the very least, gratitude for what we already have.
Adapted from “The Good Old Days” by Jim Parker, Outside the Flags column on Dimensional’s website, December 2011. This information is provided for educational purposes only and should not be considered investment advice or a solicitation to buy or sell securities. Dimensional Fund Advisors LP is an investment advisor registered with the Securities and Exchange Commission.