q3 fy14 analyst presentation february 14, 2014 · finance charges 633 1834 1726 depreciation,...
TRANSCRIPT
1
Q3 FY14 Analyst Presentation
February 14, 2014

2
SAFE HARBOUR
This presentation contains certain forward looking statements concerning DLF’s future business prospects and business profitability, which are subject to a number of risks and uncertainties and the actual results could materially differ from those in such forward looking statements. The risks and uncertainties relating to these statements include, but not limited to, risks and uncertainties, regarding fluctuations in earnings, our ability to manage growth, competition , economic growth in India, ability to attract and retain highly skilled professionals, time and cost over runs on contracts, government policies and actions with respect to investments, fiscal deficits, regulation etc., interest and other fiscal cost generally prevailing in the economy. The company does not undertake to make any announcement in case any of these forward looking statements become materially incorrect in future or update any forward looking statements made from time to time on behalf of the company.

3
Performance Scorecard Sl. No. Target Achieved
9MFY14Details
I. Sales Volume"DLF 5" 1.5 msf/ yr 1.27 msfNew Gurgaon 2.5 msf/yr 0.35 msfDelhi/Mumbai/ROI 3.5 msf/yr 1.70 msf
II. LeasingOffice 1.11 msf Malls 1.8 msf 1.8 msf Mall of India Noida Leasing finalised
III. Non-CoreWind Energy CompletedIPP CompletedInsurance CompletedAman Completed
IV Net Debt 17500 crs 19,926 crs( by 31 Mar-14) (31st Dec-13 ) *
~ 17,400 crs as on date* Excludes Aman and DDA Transactions closed during Q4 FY.14
1-1.5 msf

4
Within Q3
Closed the sale of 74% equity stake in the insurance JV with Prudential Insurance of US.
Since Jan 1, 2014
Closed the divestiture of Silverlink Resorts Ltd. (Aman), ex-Lodhi property, for Enterprise Value of USD358m. Moneys received.
Settled the dispute with DDA on the Dwarka Convention Center at Rs. 676 crore
At the end of Q3 the net debt is Rs. 19,926 crore vs Rs 19,508 crore at the end of Q2. Current net debt is at Rs. 17,400 crore (approx). We maintain the FY14 guidance of net debt of Rs. 17,500 - 18,000 crore.
Worsening economic conditions during last 2 quarters and continued high interest rates has led to muted sales and profits. Current forecast is that these adverse economic conditions shall continue through Q2FY15.
Business Update till date …
5
Given the current economic outlook, general demand including that for real estate product shall continue to be soft in the near term
In the best case scenario, we can expect slow tapering of interest rates
The targeted milestones will shift by at-least 2 to 4 quarters, given the slow pace of sales due to adverse economic conditions and high interest regime. And this is despite meeting all other performance parameters like leasing and divestments
Medium Term Plan: Committed to deliver value without sacrificing the margins
Comfortable debt levels achieved; quality of debt continues to improve
Operational cash flow break-even; Capex to be met primarily through divestments
Debt levels expected to remain in the current range
No compromise on execution run rate and value creation for the customer
Outlook…
6
Be prepared for the growth, hence continue with the capex of the rent yielding projects already started and land consolidation, improving the value of ongoing projects through requisite approvals and infrastructure upgradation.
Despite slower than anticipated sales, the Company shall continue its construction run rate thereby creating more mature stock for sale when the cycle turns.
The future potential of total launched inventory (under construction) is worth more than 14,000 crore.
Approvals are in place for all of ongoing projects, reduced the regulatory risk.
In the near term, divestments will continue to meet any cash flow mismatches resulting from capex, land improvements or land charges
Operating Cash Flow Break-even
Capex to be met primarily through disposals of assets
Met the net debt forecast for the year. Net Debt expected to remain range bound at the current levels
As annuity incomes continue to grow, the quality and tenure of debt continues to improve
Medium Term Strategy…
7
Business Segment Performance.…

8
DevCo: 0.60 msf gross sales of Rs 600 crore booked in Q3FY14 vs 0.90 msf & Rs 730 crore in Q2FY14
DLF 5 Gurgaon – 0.10 msf (Rs 320 crore)
– Camellias: sold 0.10 msf
Gurgaon – 0.07 msf ( Rs 64 crore )
Delhi / Rest of India – 0.42 msf ( Rs 216 crore )
Total 9 month Sale booking of Rs 3,760 crore vs Rs. 2,575 crore for 9MFY13; Total Sales booking for FY13 was Rs 3,815 crore
RentCo:
1.80 msf of pre-leasing of Mall of India, NOIDA finalized
1.11 msf Net leasing in Offices during 9MFY14 vs 0.98 msf for 9MFY13; Total leasing in FY13 was 1.14 msf Annuity Income ( ex-Wind ) of Rs 475 crore
Project under Construction : 60 msf
NON CORE : Received Rs. 250 crore on account of Pramerica, Star Alubuild & Wind transaction
Business Segment Performance – Q3FY 2014

9
Summary: Operating Performance
Sales ( in msf) Avg Rate ( Rs psf ) Sales ( in msf) Avg Rate ( Rs psf )
Sales BookingGurgaon
DLF 5 0.11 29450 1.27 20141Garden City 0.07 8744 0.35 9194
Delhi/Mumbai/ROILuxury 0.01 43738 0.01 43738Premium 0.42 4616 1.69 5088
Leasing ( in msf ) Avg Rate ( Rs psf/pm ) Leasing ( in msf ) Avg Rate ( Rs psf/pm )
LeasingOffice 0.35 57 1.11 53Retail Malls - - 0.24 139
Q3FY14
Q3FY14
YTD FY14
YTD FY14
10
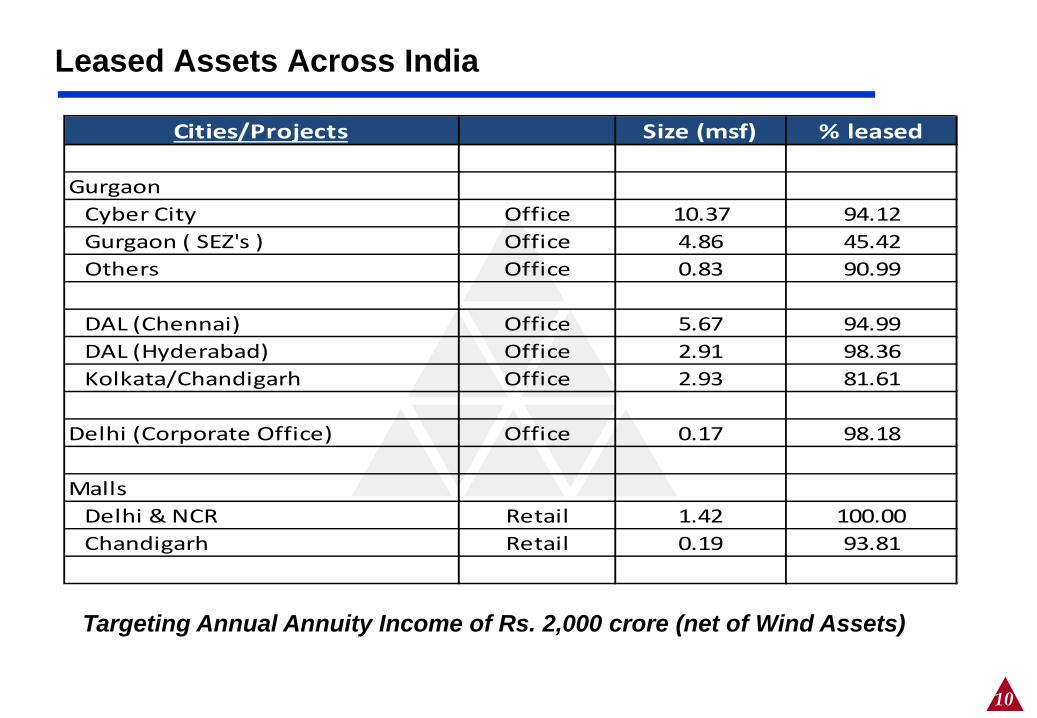
Leased Assets Across India
Targeting Annual Annuity Income of Rs. 2,000 crore (net of Wind Assets)
Cities/Projects Size (msf) % leased
GurgaonCyber City Office 10.37 94.12Gurgaon ( SEZ's ) Office 4.86 45.42Others Office 0.83 90.99
DAL (Chennai) Office 5.67 94.99DAL (Hyderabad) Office 2.91 98.36Kolkata/Chandigarh Office 2.93 81.61
Delhi (Corporate Office) Office 0.17 98.18
MallsDelhi & NCR Retail 1.42 100.00Chandigarh Retail 0.19 93.81

11
Live Projects Across India
Projects Size (msf) ** Sold till Q3 (msf)
Under Execution
New Town Heights * & Express Greens 4.10 4.09 yesAlameda* 2.46 1.99 yesGarden City-91-92 3.56 3.37 yesCorporate Greens 2.70 1.64 yesCapital Greens 5.20 5.20 YesOkhla 0.63 0.52 YesGK Kings Court * 0.23 0.13 YesIndore* 2.46 1.12 YesNTH-Kolkata* 1.68 1.65 Yes
Chennai * 3.80 3.35 Yes Kochi 2.58 2.30 Yes Banglore 5.18 4.58 Yes Hyderabad 3.44 2.80 Yes Lucknow 3.10 3.00 Yes Panchkula 4.03 3.60 Yes Mullanpur 3.89 3.78 Yes Shimla 0.07 0.06 Yes Kasauli 0.57 0.23 Yes* Partly Handedover
SkyCourt 1.25 1.15 yesUltima 2.17 0.62 YesRegal Garden 1.03 0.85 yesPrimus 1.24 1.22 yesCrest 2.61 0.84 yesCamillias 3.55 0.44 yesHorizon Centre 1.19 0.52 YesBhubneshwar 0.55 0.33 Yes
Old Projects
New Projects
** Total size of the Project
12
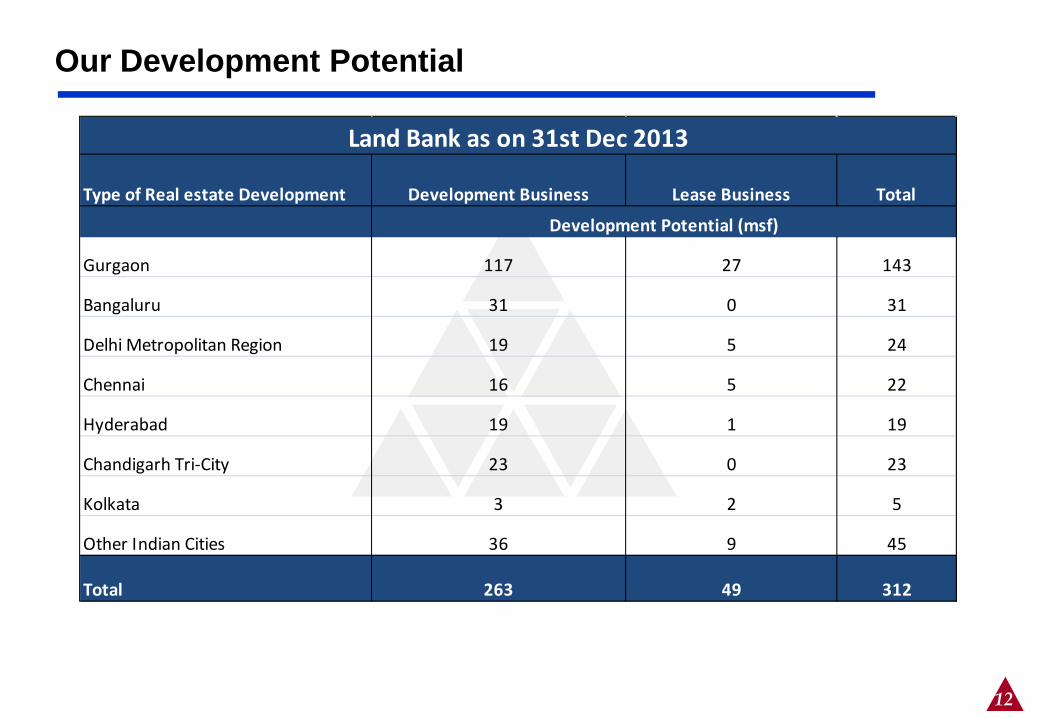
Our Development Potential
Type of Real estate Development Development Business Lease Business Total
Gurgaon 117 27 143
Bangaluru 31 0 31
Delhi Metropolitan Region 19 5 24
Chennai 16 5 22
Hyderabad 19 1 19
Chandigarh Tri-City 23 0 23
Kolkata 3 2 5
Other Indian Cities 36 9 45
Total 263 49 312
Development Potential (msf)
Land Bank as on 31st Dec 2013
13
Summary Financials.…
14
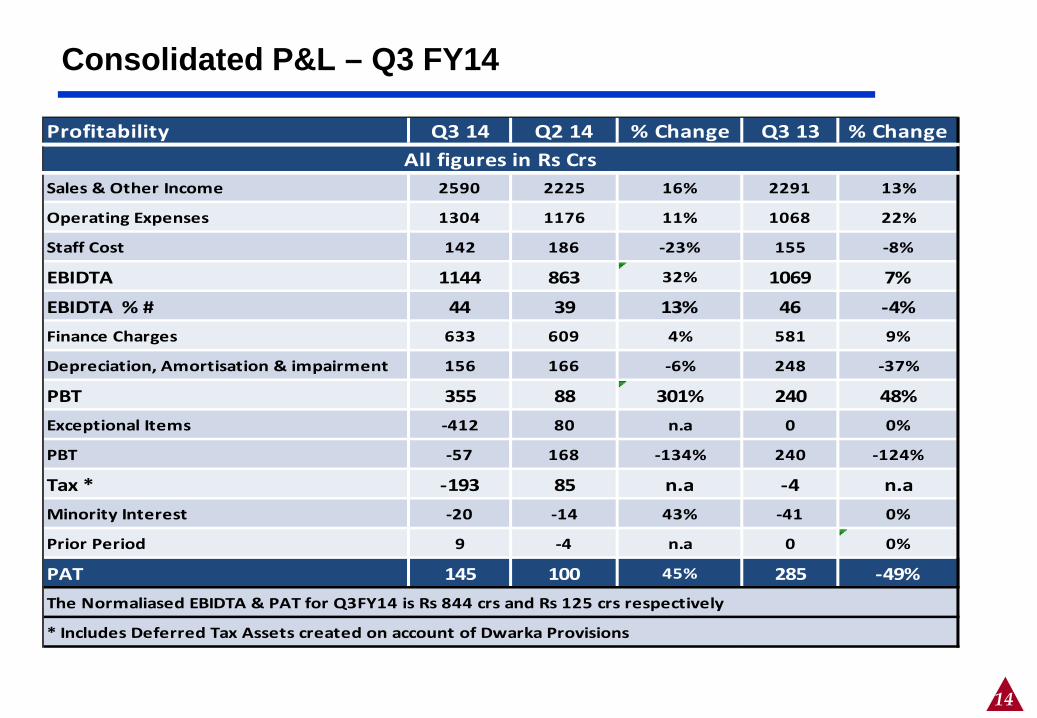
Consolidated P&L – Q3 FY14
Profitability Q3 14 Q2 14 % Change Q3 13 % Change
Sales & Other Income 2590 2225 16% 2291 13%
Operating Expenses 1304 1176 11% 1068 22%
Staff Cost 142 186 -23% 155 -8%
EBIDTA 1144 863 32% 1069 7%
EBIDTA % # 44 39 13% 46 -4%Finance Charges 633 609 4% 581 9%
Depreciation, Amortisation & impairment 156 166 -6% 248 -37%
PBT 355 88 301% 240 48%Exceptional Items -412 80 n.a 0 0%
PBT -57 168 -134% 240 -124%
Tax * -193 85 n.a -4 n.aMinority Interest -20 -14 43% -41 0%
Prior Period 9 -4 n.a 0 0%
PAT 145 100 45% 285 -49%The Normaliased EBIDTA & PAT for Q3FY14 is Rs 844 crs and Rs 125 crs respectively
* Includes Deferred Tax Assets created on account of Dwarka Provisions
All figures in Rs Crs
15
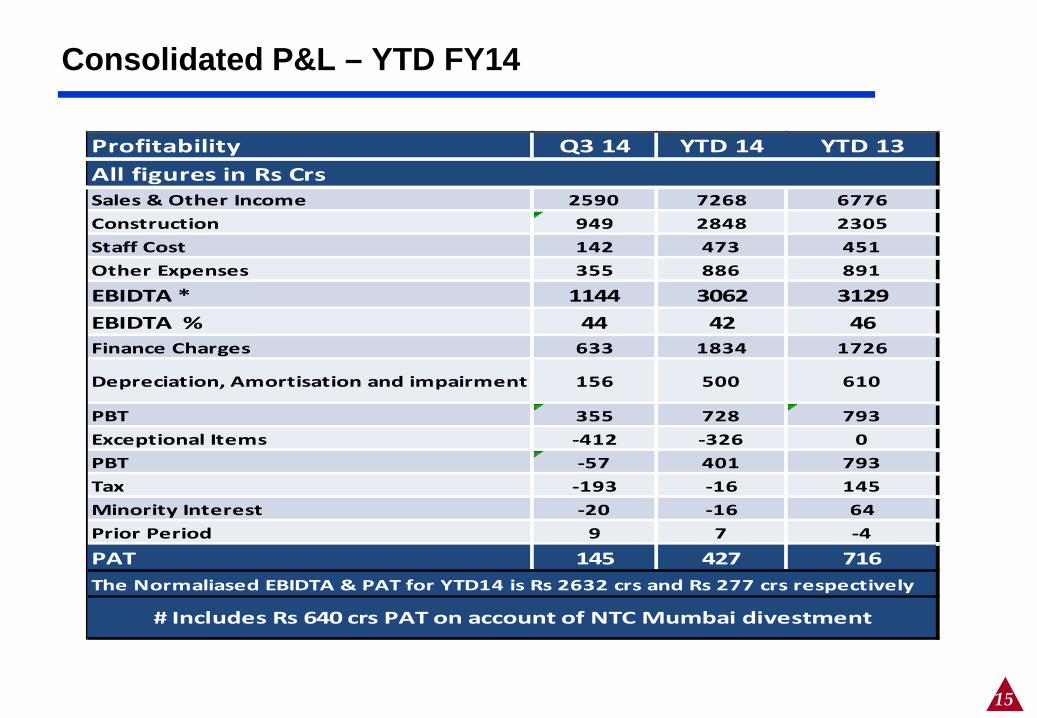
Consolidated P&L – YTD FY14
Profitability Q3 14 YTD 14 YTD 13All figures in Rs CrsSales & Other Income 2590 7268 6776Construction 949 2848 2305Staff Cost 142 473 451Other Expenses 355 886 891
EBIDTA * 1144 3062 3129EBIDTA % 44 42 46Finance Charges 633 1834 1726
Depreciation, Amortisation and impairment 156 500 610
PBT 355 728 793Exceptional Items -412 -326 0PBT -57 401 793Tax -193 -16 145Minority Interest -20 -16 64Prior Period 9 7 -4
PAT 145 427 716The Normaliased EBIDTA & PAT for YTD14 is Rs 2632 crs and Rs 277 crs respectively
# Includes Rs 640 crs PAT on account of NTC Mumbai divestment
16
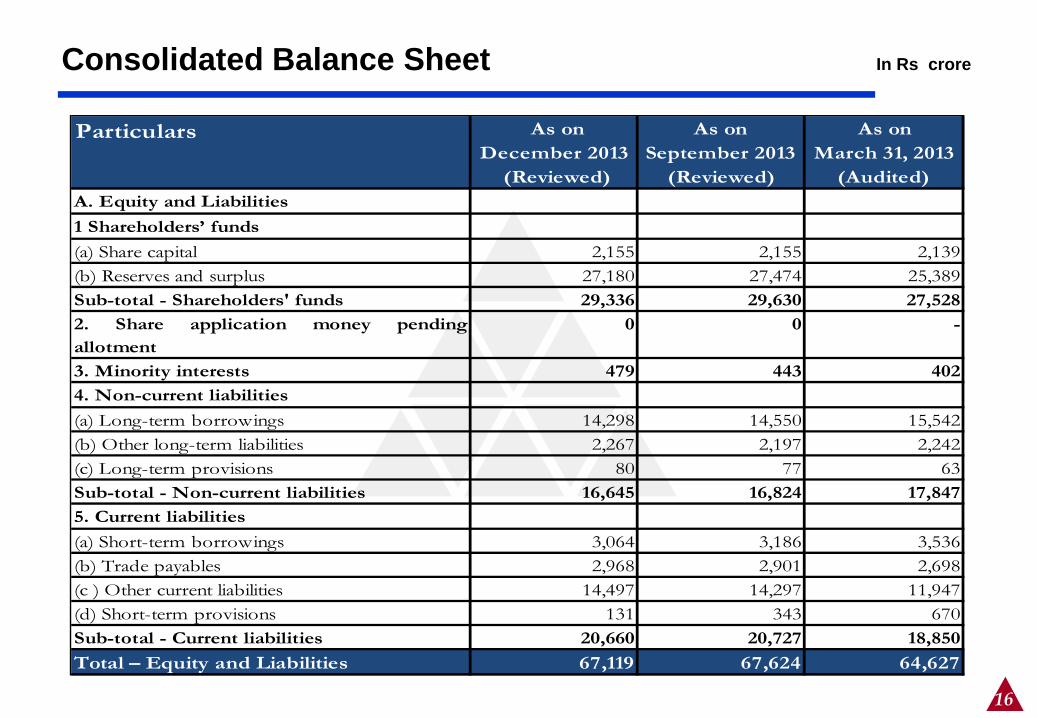
Consolidated Balance Sheet
As on December 2013
As on September 2013
As on March 31, 2013
(Reviewed) (Reviewed) (Audited)A. Equity and Liabilities1 Shareholders’ funds(a) Share capital 2,155 2,155 2,139 (b) Reserves and surplus 27,180 27,474 25,389 Sub-total - Shareholders' funds 29,336 29,630 27,528 2. Share application money pendingallotment
0 0 -
3. Minority interests 479 443 402 4. Non-current liabilities(a) Long-term borrowings 14,298 14,550 15,542 (b) Other long-term liabilities 2,267 2,197 2,242 (c) Long-term provisions 80 77 63 Sub-total - Non-current liabilities 16,645 16,824 17,847 5. Current liabilities(a) Short-term borrowings 3,064 3,186 3,536 (b) Trade payables 2,968 2,901 2,698 (c ) Other current liabilities 14,497 14,297 11,947 (d) Short-term provisions 131 343 670 Sub-total - Current liabilities 20,660 20,727 18,850 Total – Equity and Liabilities 67,119 67,624 64,627
Particulars
In Rs crore
17
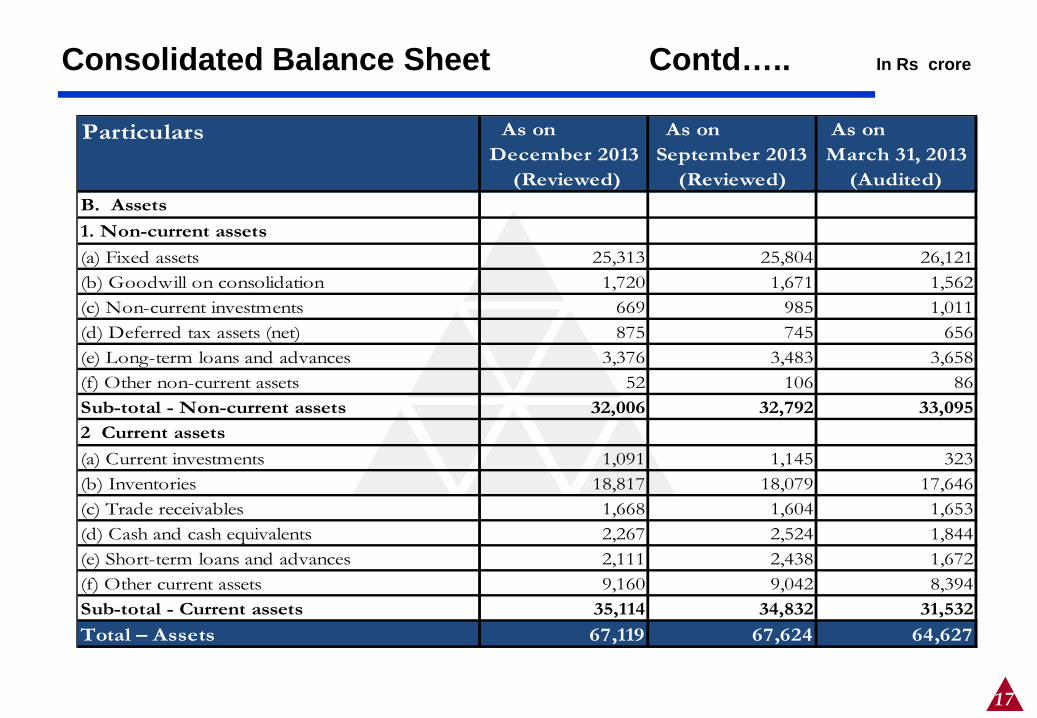
Consolidated Balance Sheet Contd…..
As on December 2013
As on September 2013
As on March 31, 2013
(Reviewed) (Reviewed) (Audited)B. Assets1. Non-current assets(a) Fixed assets 25,313 25,804 26,121 (b) Goodwill on consolidation 1,720 1,671 1,562 (c) Non-current investments 669 985 1,011 (d) Deferred tax assets (net) 875 745 656 (e) Long-term loans and advances 3,376 3,483 3,658 (f) Other non-current assets 52 106 86 Sub-total - Non-current assets 32,006 32,792 33,095 2 Current assets(a) Current investments 1,091 1,145 323 (b) Inventories 18,817 18,079 17,646 (c) Trade receivables 1,668 1,604 1,653 (d) Cash and cash equivalents 2,267 2,524 1,844 (e) Short-term loans and advances 2,111 2,438 1,672 (f) Other current assets 9,160 9,042 8,394 Sub-total - Current assets 35,114 34,832 31,532 Total – Assets 67,119 67,624 64,627
Particulars
In Rs crore
18
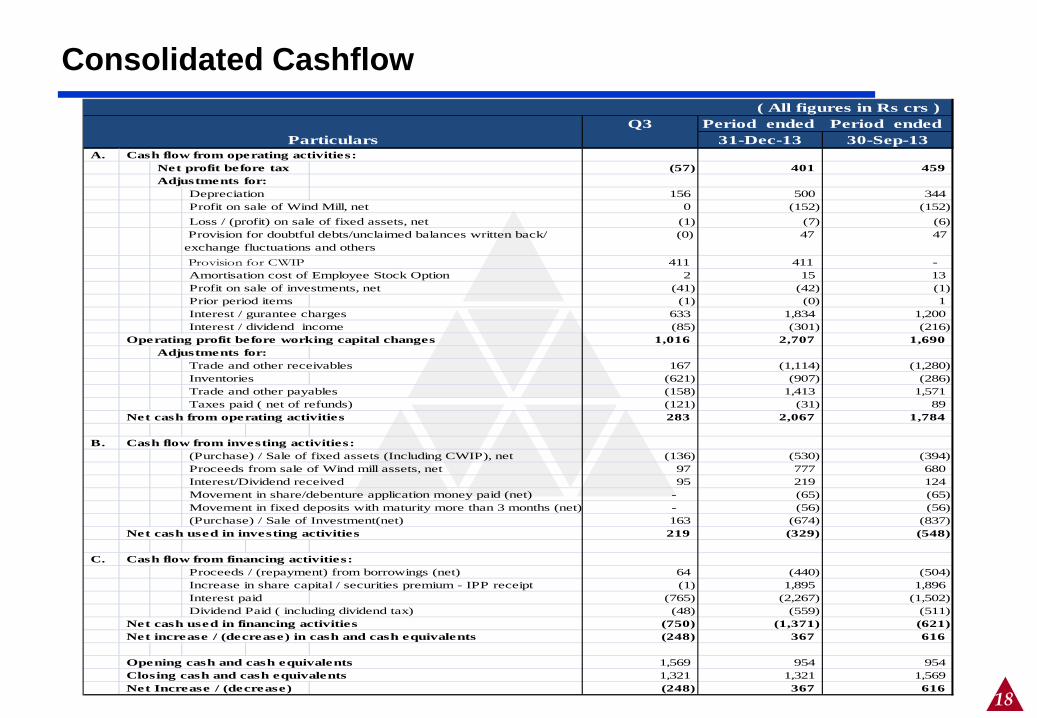
Consolidated Cashflow ( All figures in Rs crs )
Q3 Period ended Period ended 31-Dec-13 30-Sep-13
A. Cash flow from operating activities:Net profit before tax (57) 401 459 Adjustments for:
Depreciation 156 500 344 Profit on sale of Wind Mill, net 0 (152) (152) Loss / (profit) on sale of fixed assets, net (1) (7) (6)
(0) 47 47
411 411 - Amortisation cost of Employee Stock Option 2 15 13 Profit on sale of investments, net (41) (42) (1) Prior period items (1) (0) 1 Interest / gurantee charges 633 1,834 1,200 Interest / dividend income (85) (301) (216)
Operating profit before working capital changes 1,016 2,707 1,690 Adjustments for:
Trade and other receivables 167 (1,114) (1,280) Inventories (621) (907) (286) Trade and other payables (158) 1,413 1,571 Taxes paid ( net of refunds) (121) (31) 89
Net cash from operating activities 283 2,067 1,784
B. Cash flow from investing activities:(Purchase) / Sale of fixed assets (Including CWIP), net (136) (530) (394) Proceeds from sale of Wind mill assets, net 97 777 680 Interest/Dividend received 95 219 124 Movement in share/debenture application money paid (net) - (65) (65) Movement in fixed deposits with maturity more than 3 months (net) - (56) (56) (Purchase) / Sale of Investment(net) 163 (674) (837)
Net cash used in investing activities 219 (329) (548)
C. Cash flow from financing activities:Proceeds / (repayment) from borrowings (net) 64 (440) (504) Increase in share capital / securities premium - IPP receipt (1) 1,895 1,896 Interest paid (765) (2,267) (1,502) Dividend Paid ( including dividend tax) (48) (559) (511)
Net cash used in financing activities (750) (1,371) (621) Net increase / (decrease) in cash and cash equivalents (248) 367 616
Opening cash and cash equivalents 1,569 954 954 Closing cash and cash equivalents 1,321 1,321 1,569 Net Increase / (decrease) (248) 367 616
Particulars
Provision for doubtful debts/unclaimed balances written back/ exchange fluctuations and others Provision for CWIP

19
Liquidity Outlook
Net Debt Position Q2 14 Q3 14 Net ChangeRs Crs Rs Crs Rs Crs
Gross Debt as per Balance Sheet 24298 24361Less : Equity shown as Debt / JV Co Debt 1038 1061Gross Debt ( Net of Equity shown as Debt / JV Co Debt ) 23260 23300Pref. Shares 202 202Gross Debt Position ( Net of Equity shown as Debt / JV Co Debt ) 23462 23502
Less : Cash in hand ( 31st Dec-2013 ) -3573 -3257Less : Increase due to Exchange fluctuation -381 -319Net Debt Position ** 19508 19926 418** Excludes A - Non Core realisation of Rs 2275 crs from Aman Transaction & Rs 676 crs of DDA B - Rs 19,926 crs includes approx. Rs 12,500 crs of Loan taken against / backed by Annuity Assets Net Debt as on date ~ Rs 17400 crs
20
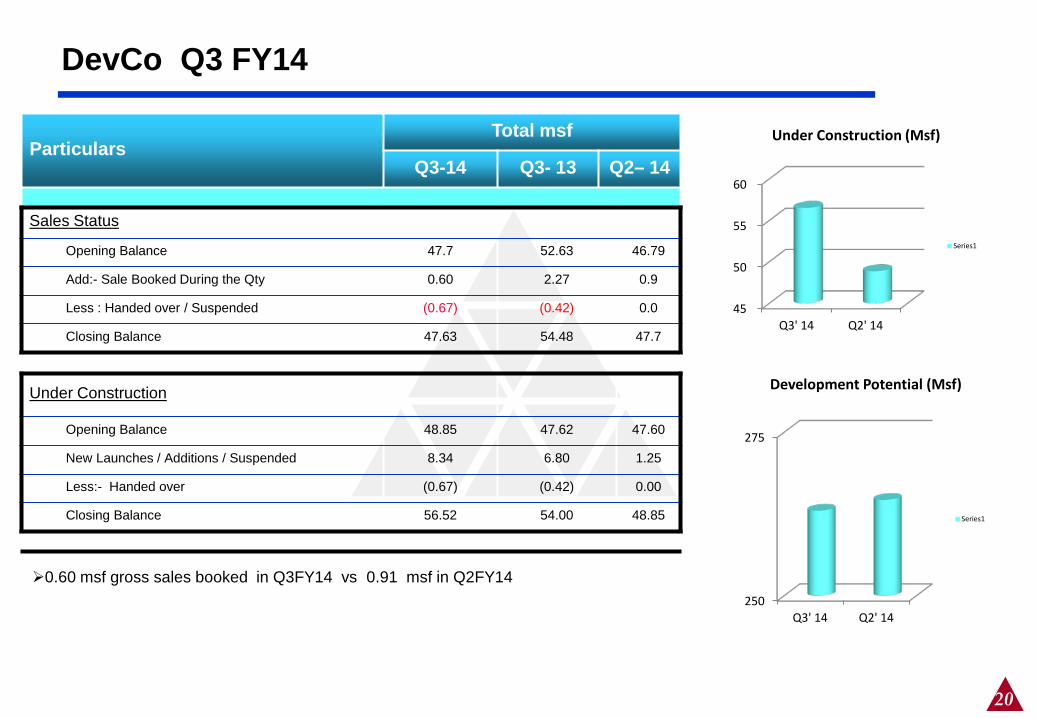
DevCo Q3 FY14
Particulars Total msf
Q3-14 Q3- 13 Q2– 14
Sales Status
Opening Balance 47.7 52.63 46.79
Add:- Sale Booked During the Qty 0.60 2.27 0.9
Less : Handed over / Suspended (0.67) (0.42) 0.0
Closing Balance 47.63 54.48 47.7
Under Construction
Opening Balance 48.85 47.62 47.60
New Launches / Additions / Suspended 8.34 6.80 1.25
Less:- Handed over (0.67) (0.42) 0.00
Closing Balance 56.52 54.00 48.85
0.60 msf gross sales booked in Q3FY14 vs 0.91 msf in Q2FY14
45
50
55
60
Q3' 14 Q2' 14
Under Construction (Msf)
Series1
250
275
Q3' 14 Q2' 14
Development Potential (Msf)
Series1
21
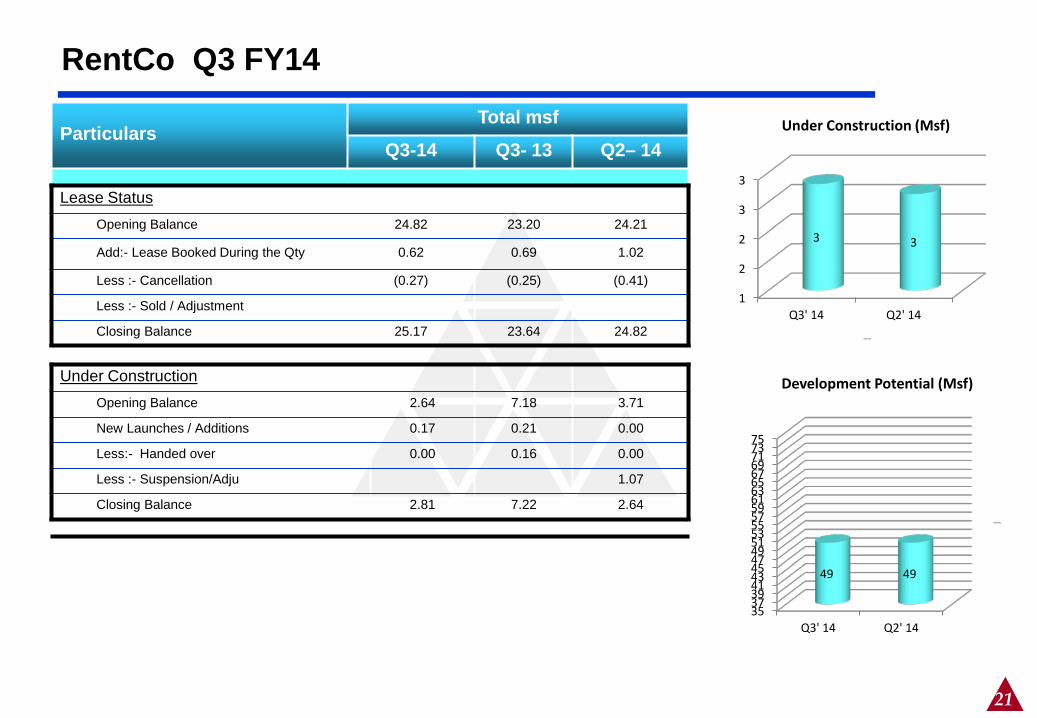
Particulars Total msf
Q3-14 Q3- 13 Q2– 14
Lease Status Opening Balance 24.82 23.20 24.21
Add:- Lease Booked During the Qty 0.62 0.69 1.02
Less :- Cancellation (0.27) (0.25) (0.41)
Less :- Sold / Adjustment
Closing Balance 25.17 23.64 24.82
Under Construction Opening Balance 2.64 7.18 3.71
New Launches / Additions 0.17 0.21 0.00
Less:- Handed over 0.00 0.16 0.00
Less :- Suspension/Adju 1.07
Closing Balance 2.81 7.22 2.64
RentCo Q3 FY14
1
2
2
3
3
Q3' 14 Q2' 14
3 3
Under Construction (Msf)
Series1
35 37 39 41 43 45 47 49 51 53 55 57 59 61 63 65 67 69 71 73 75
Q3' 14 Q2' 14
49 49
Development Potential (Msf)
Series1

22
Thank You