q3 2020 earnings presentation - renesola ltd
TRANSCRIPT

December 1, 2020
Q3 2020 Earnings Presentation
SOL
LISTED
NYSE
SOLNYSE LISTED
Safe Harbor Statement
This presentation may contain forward-looking statements and management may make additional forward-looking statements in response to your questions. These statements are made under the ''safe harbor'' provisions of the U.S. Private Securities Litigation Reform Act of 1995. These forward-looking statements can be identified by terminology such as “will,” “expects,” “anticipates,” “future,” “intends,” “plans,” “believes,” “estimates,” “confident” and similar statements. Statements that are not historical facts, including statements concerning our beliefs, forecasts, estimates and expectations, are forward-looking statements. Forward-looking statements involve inherent risks and uncertainties that could cause actual results to differ materially from those projected or anticipated, including risks related to: the risk that our results of operations may fluctuate from period to period; the risk of PRC governmental policy changes; the risk that we face intense competition from other solar companies; the risk that PRC economic, political and social conditions as well as government policies can affect our business and other risks outlined in our public filings with the Securities and Exchange Commission, including our annual report on Form 20-F.
The forward-looking statements made in this presentation relate only to events or information as of the date on which the statements are made in this presentation. Except as required by law, we undertake no obligation to update or revise publicly any forward-looking statements, whether as a result of new information, future events or otherwise, after the date on which the statements are made or to reflect the occurrence of unanticipated events.
2
SOLNYSE LISTED
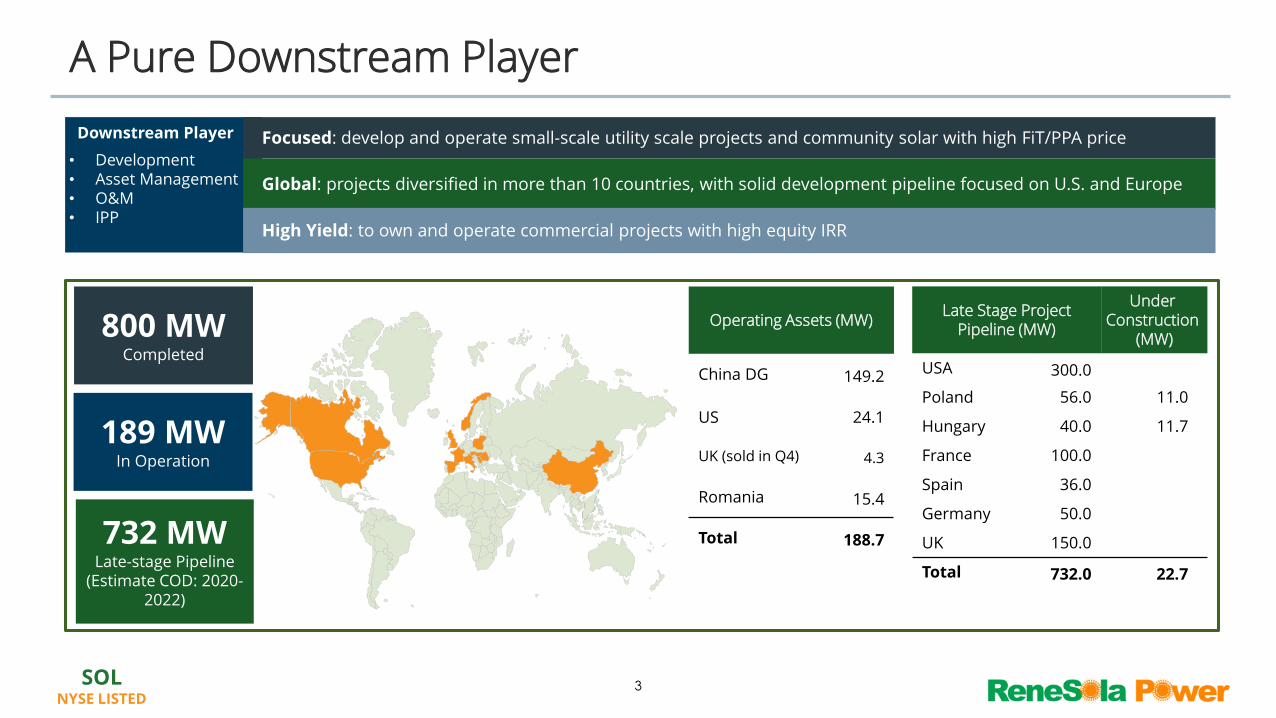
A Pure Downstream Player
Downstream Player
• Development• Asset Management• O&M• IPP
Focused: develop and operate small-scale utility scale projects and community solar with high FiT/PPA price
Global: projects diversified in more than 10 countries, with solid development pipeline focused on U.S. and Europe
High Yield: to own and operate commercial projects with high equity IRR
800 MWCompleted
189 MWIn Operation
732 MWLate-stage Pipeline
(Estimate COD: 2020-2022)
3
Late Stage Project Pipeline (MW)
Under Construction
(MW)
USA 300.0
Poland 56.0 11.0
Hungary 40.0 11.7
France 100.0
Spain 36.0
Germany 50.0
UK 150.0
Total 732.0 22.7
Operating Assets (MW)
China DG 149.2
US 24.1
UK (sold in Q4) 4.3
Romania 15.4
Total 188.7
SOLNYSE LISTED
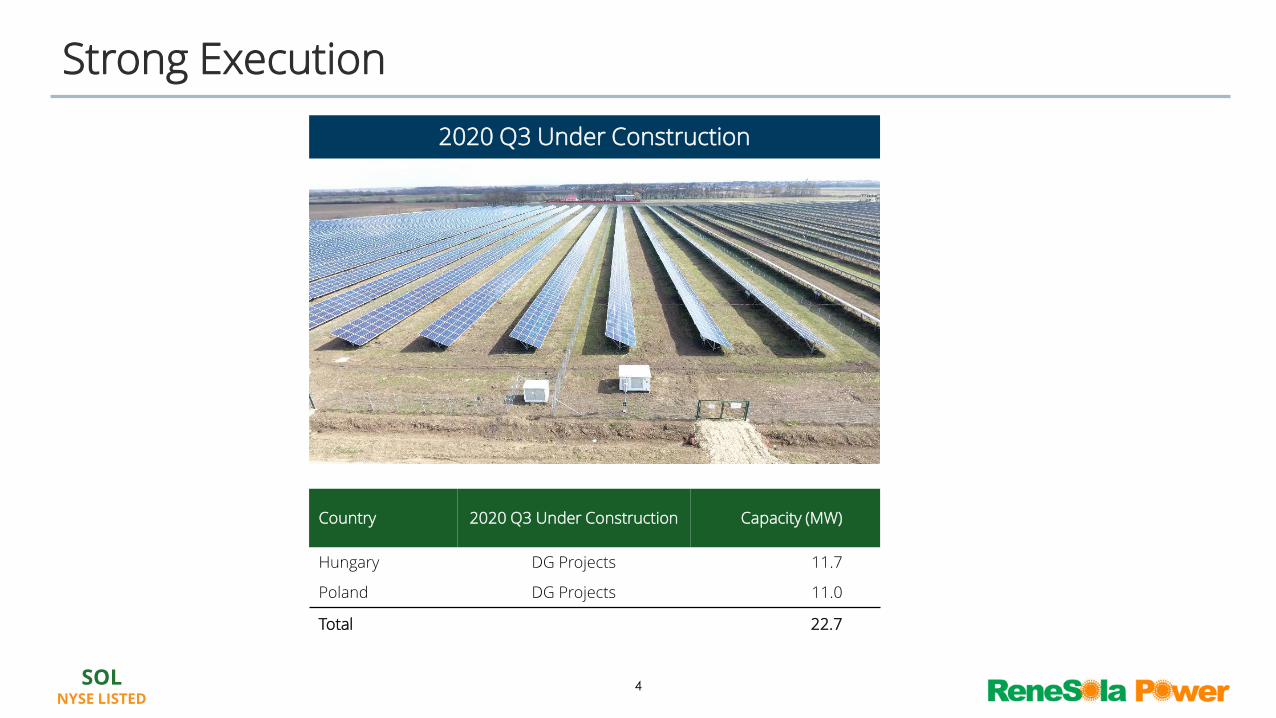
Strong Execution
4
2020 Q3 Under Construction
HungaryHungary
Country 2020 Q3 Under Construction Capacity (MW)
Hungary DG Projects 11.7
Poland DG Projects 11.0
Total 22.7
SOLNYSE LISTED
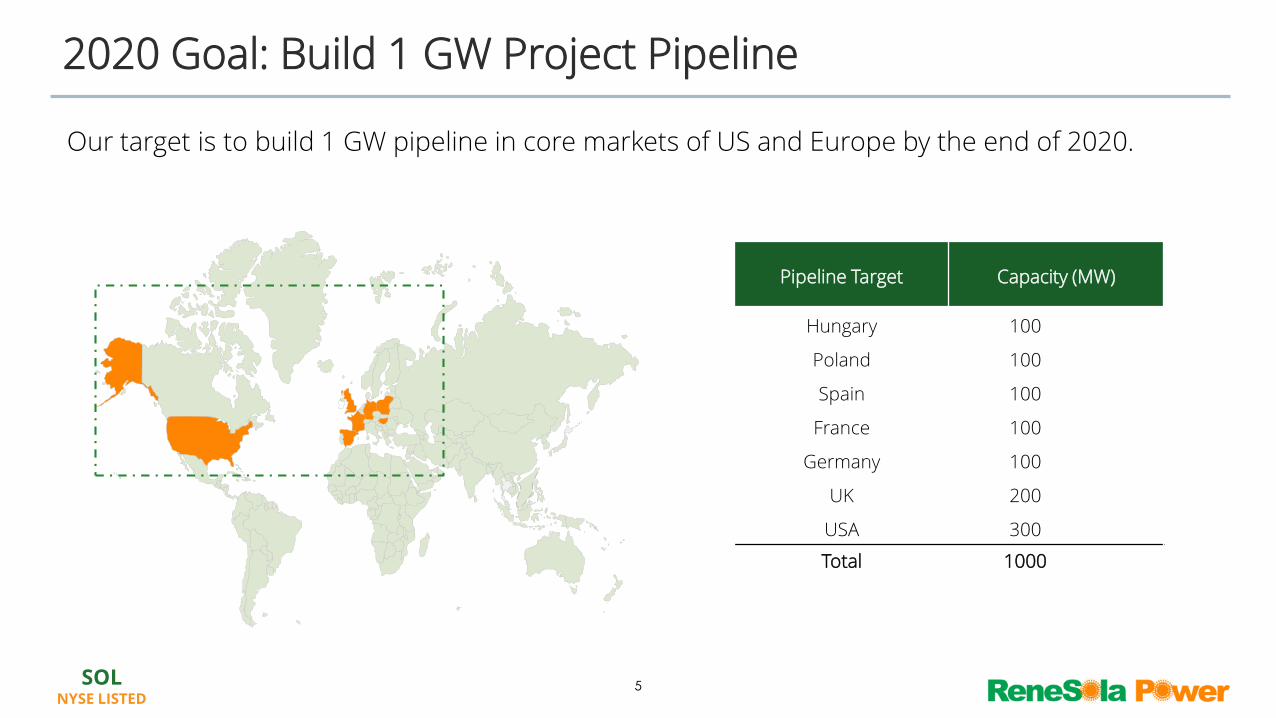
2020 Goal: Build 1 GW Project Pipeline
Our target is to build 1 GW pipeline in core markets of US and Europe by the end of 2020.
5
Pipeline Target Capacity (MW)
Hungary 100
Poland 100
Spain 100
France 100
Germany 100
UK 200
USA 300
Total 1000
Global Project Development Pipeline(As of November 30, 2020)
SOLNYSE LISTED
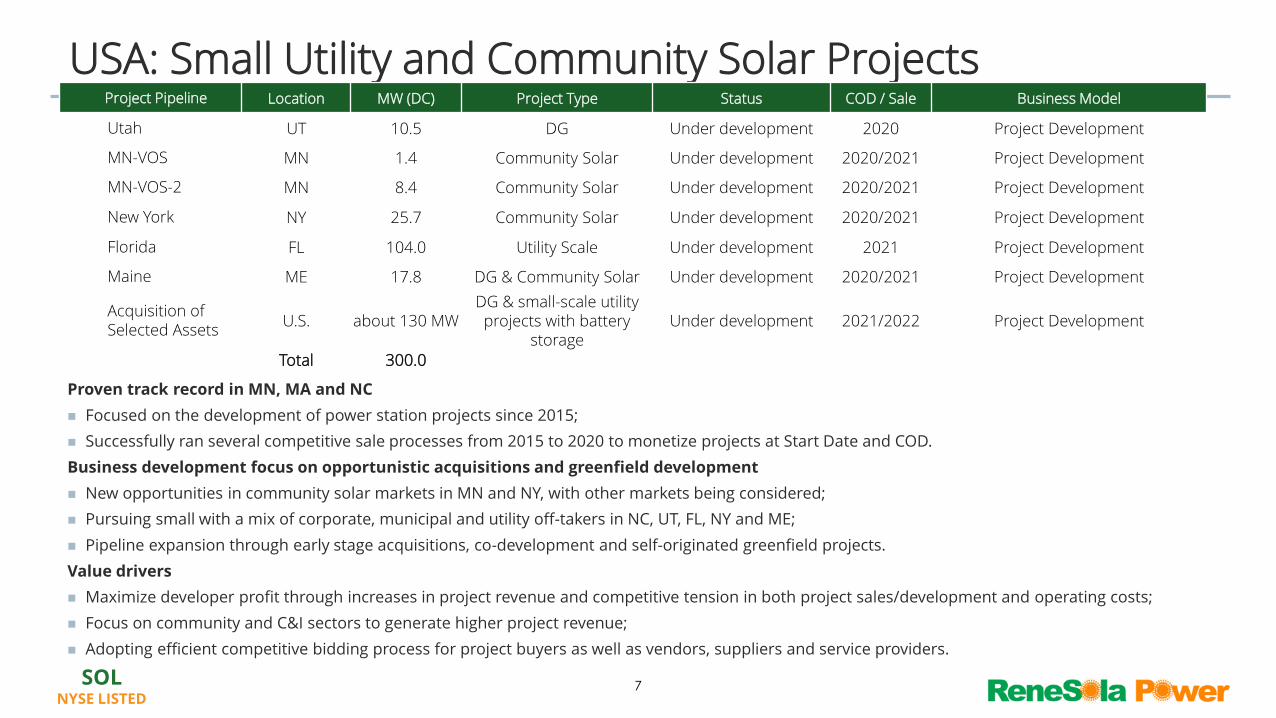
USA: Small Utility and Community Solar Projects
7
Proven track record in MN, MA and NC
Focused on the development of power station projects since 2015;
Successfully ran several competitive sale processes from 2015 to 2020 to monetize projects at Start Date and COD.
Business development focus on opportunistic acquisitions and greenfield development
New opportunities in community solar markets in MN and NY, with other markets being considered;
Pursuing small with a mix of corporate, municipal and utility off-takers in NC, UT, FL, NY and ME;
Pipeline expansion through early stage acquisitions, co-development and self-originated greenfield projects.
Value drivers
Maximize developer profit through increases in project revenue and competitive tension in both project sales/development and operating costs;
Focus on community and C&I sectors to generate higher project revenue;
Adopting efficient competitive bidding process for project buyers as well as vendors, suppliers and service providers.
Project Pipeline Location MW (DC) Project Type Status COD / Sale Business Model
Utah UT 10.5 DG Under development 2020 Project Development
MN-VOS MN 1.4 Community Solar Under development 2020/2021 Project Development
MN-VOS-2 MN 8.4 Community Solar Under development 2020/2021 Project Development
New York NY 25.7 Community Solar Under development 2020/2021 Project Development
Florida FL 104.0 Utility Scale Under development 2021 Project Development
Maine ME 17.8 DG & Community Solar Under development 2020/2021 Project Development
Acquisition of Selected Assets
U.S. about 130 MWDG & small-scale utility projects with battery
storageUnder development 2021/2022 Project Development
Total 300.0
SOLNYSE LISTED
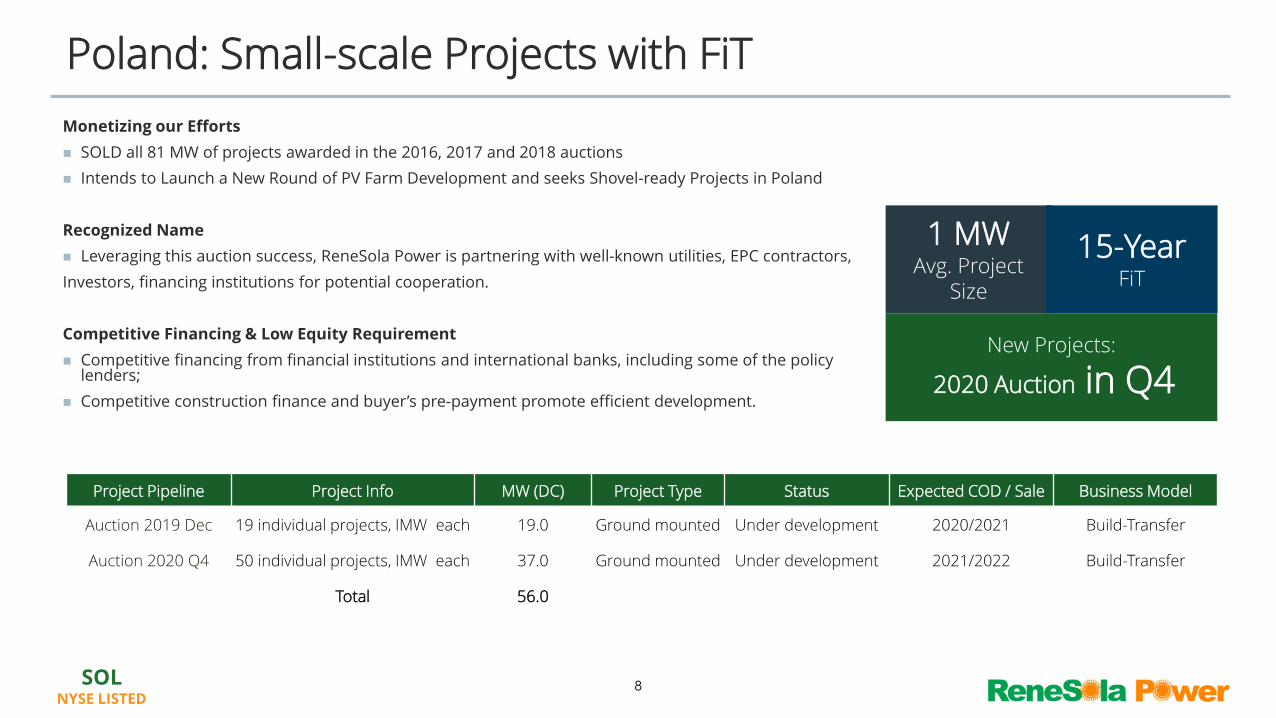
Poland: Small-scale Projects with FiT
Project Pipeline Project Info MW (DC) Project Type Status Expected COD / Sale Business Model
Auction 2019 Dec 19 individual projects, IMW each 19.0 Ground mounted Under development 2020/2021 Build-Transfer
Auction 2020 Q4 50 individual projects, IMW each 37.0 Ground mounted Under development 2021/2022 Build-Transfer
Total 56.0
Monetizing our Efforts
SOLD all 81 MW of projects awarded in the 2016, 2017 and 2018 auctions
Intends to Launch a New Round of PV Farm Development and seeks Shovel-ready Projects in Poland
Recognized Name
Leveraging this auction success, ReneSola Power is partnering with well-known utilities, EPC contractors,
Investors, financing institutions for potential cooperation.
Competitive Financing & Low Equity Requirement
Competitive financing from financial institutions and international banks, including some of the policy lenders;
Competitive construction finance and buyer’s pre-payment promote efficient development.
8
1 MWAvg. Project
Size
15-YearFiT
New Projects:
2020 Auction in Q4
SOLNYSE LISTED
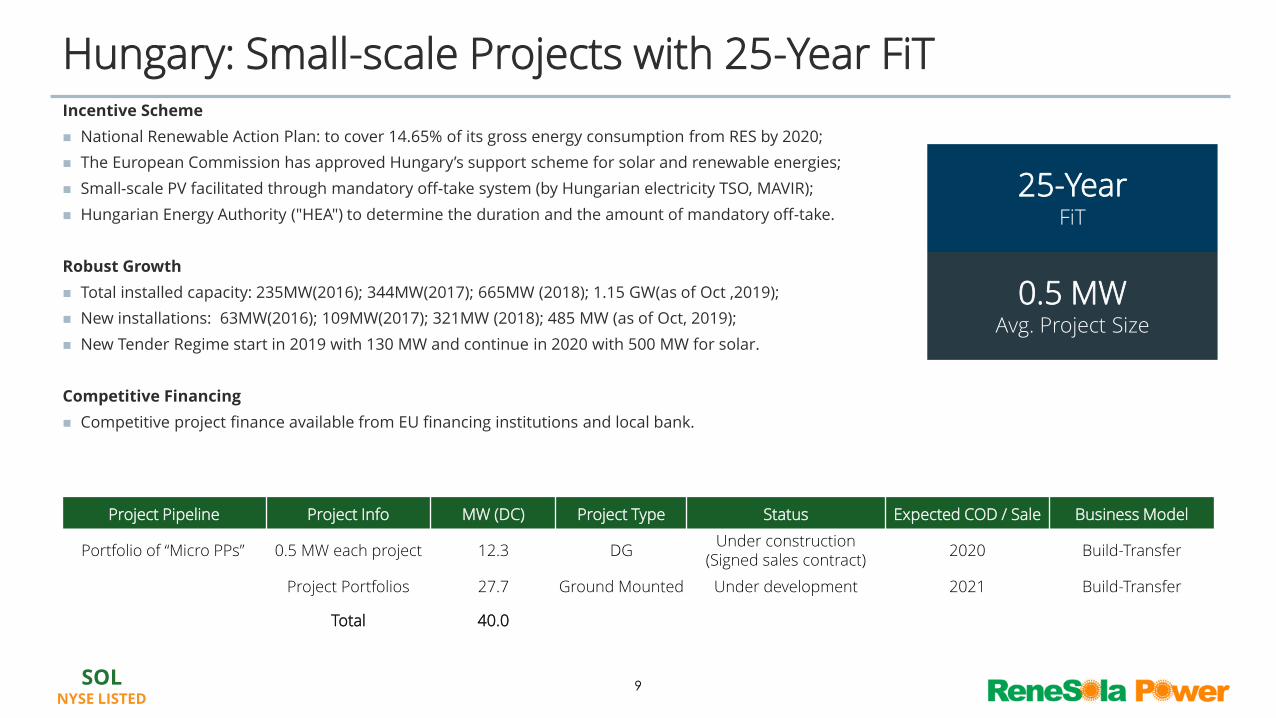
Hungary: Small-scale Projects with 25-Year FiT
Project Pipeline Project Info MW (DC) Project Type Status Expected COD / Sale Business Model
Portfolio of “Micro PPs” 0.5 MW each project 12.3 DGUnder construction
(Signed sales contract)2020 Build-Transfer
Project Portfolios 27.7 Ground Mounted Under development 2021 Build-Transfer
Total 40.0
Incentive Scheme
National Renewable Action Plan: to cover 14.65% of its gross energy consumption from RES by 2020;
The European Commission has approved Hungary’s support scheme for solar and renewable energies;
Small-scale PV facilitated through mandatory off-take system (by Hungarian electricity TSO, MAVIR);
Hungarian Energy Authority ("HEA") to determine the duration and the amount of mandatory off-take.
Robust Growth
Total installed capacity: 235MW(2016); 344MW(2017); 665MW (2018); 1.15 GW(as of Oct ,2019);
New installations: 63MW(2016); 109MW(2017); 321MW (2018); 485 MW (as of Oct, 2019);
New Tender Regime start in 2019 with 130 MW and continue in 2020 with 500 MW for solar.
Competitive Financing
Competitive project finance available from EU financing institutions and local bank.
0.5 MWAvg. Project Size
25-YearFiT
9
SOLNYSE LISTED
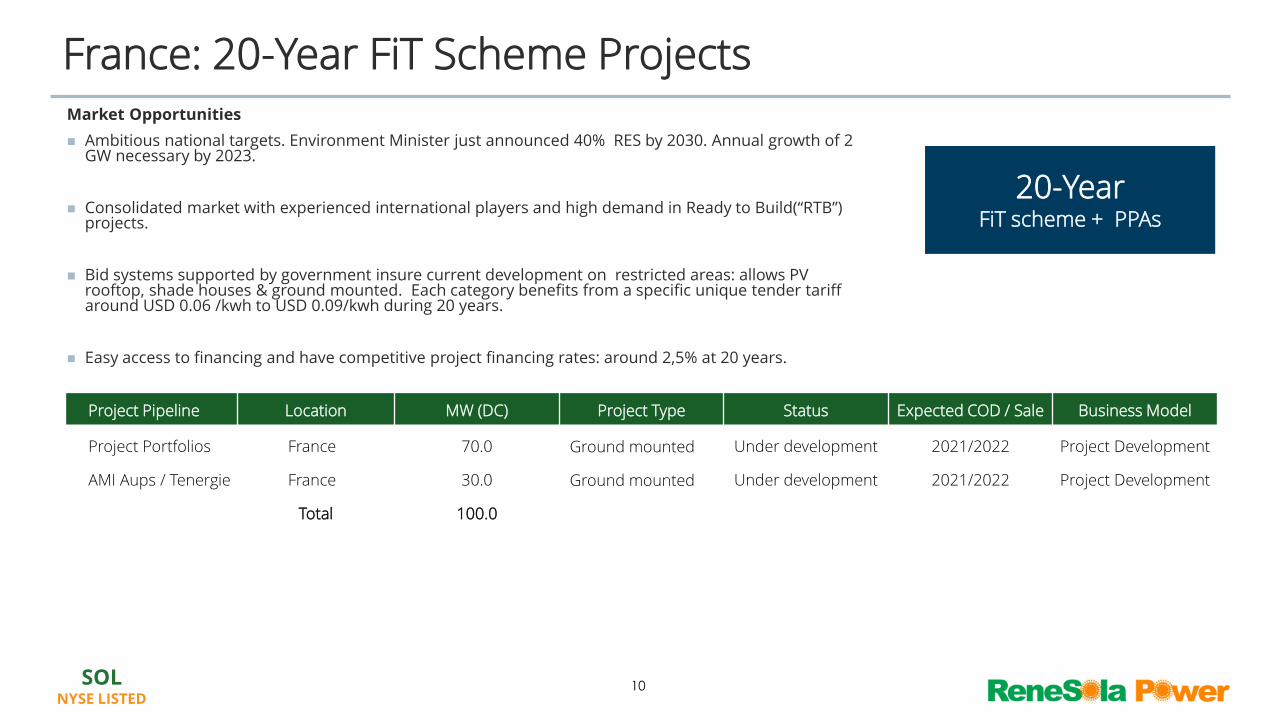
France: 20-Year FiT Scheme ProjectsMarket Opportunities
Ambitious national targets. Environment Minister just announced 40% RES by 2030. Annual growth of 2 GW necessary by 2023.
Consolidated market with experienced international players and high demand in Ready to Build(“RTB”) projects.
Bid systems supported by government insure current development on restricted areas: allows PV rooftop, shade houses & ground mounted. Each category benefits from a specific unique tender tariff around USD 0.06 /kwh to USD 0.09/kwh during 20 years.
Easy access to financing and have competitive project financing rates: around 2,5% at 20 years.
20-YearFiT scheme + PPAs
10
Project Pipeline Location MW (DC) Project Type Status Expected COD / Sale Business Model
Project Portfolios France 70.0 Ground mounted Under development 2021/2022 Project Development
AMI Aups / Tenergie France 30.0 Ground mounted Under development 2021/2022 Project Development
Total 100.0
SOLNYSE LISTED
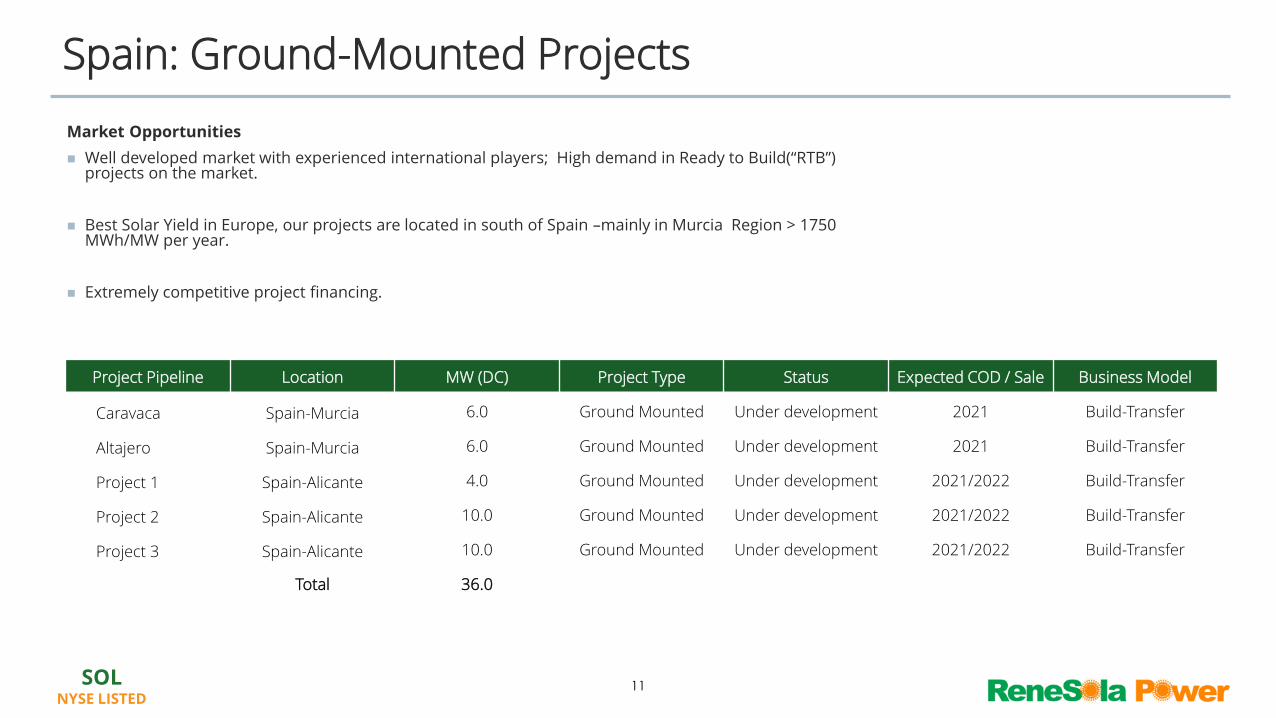
Spain: Ground-Mounted Projects
Project Pipeline Location MW (DC) Project Type Status Expected COD / Sale Business Model
Caravaca Spain-Murcia 6.0 Ground Mounted Under development 2021 Build-Transfer
Altajero Spain-Murcia 6.0 Ground Mounted Under development 2021 Build-Transfer
Project 1 Spain-Alicante 4.0 Ground Mounted Under development 2021/2022 Build-Transfer
Project 2 Spain-Alicante 10.0 Ground Mounted Under development 2021/2022 Build-Transfer
Project 3 Spain-Alicante 10.0 Ground Mounted Under development 2021/2022 Build-Transfer
Total 36.0
Market Opportunities
Well developed market with experienced international players; High demand in Ready to Build(“RTB”) projects on the market.
Best Solar Yield in Europe, our projects are located in south of Spain –mainly in Murcia Region > 1750 MWh/MW per year.
Extremely competitive project financing.
11
SOLNYSE LISTED
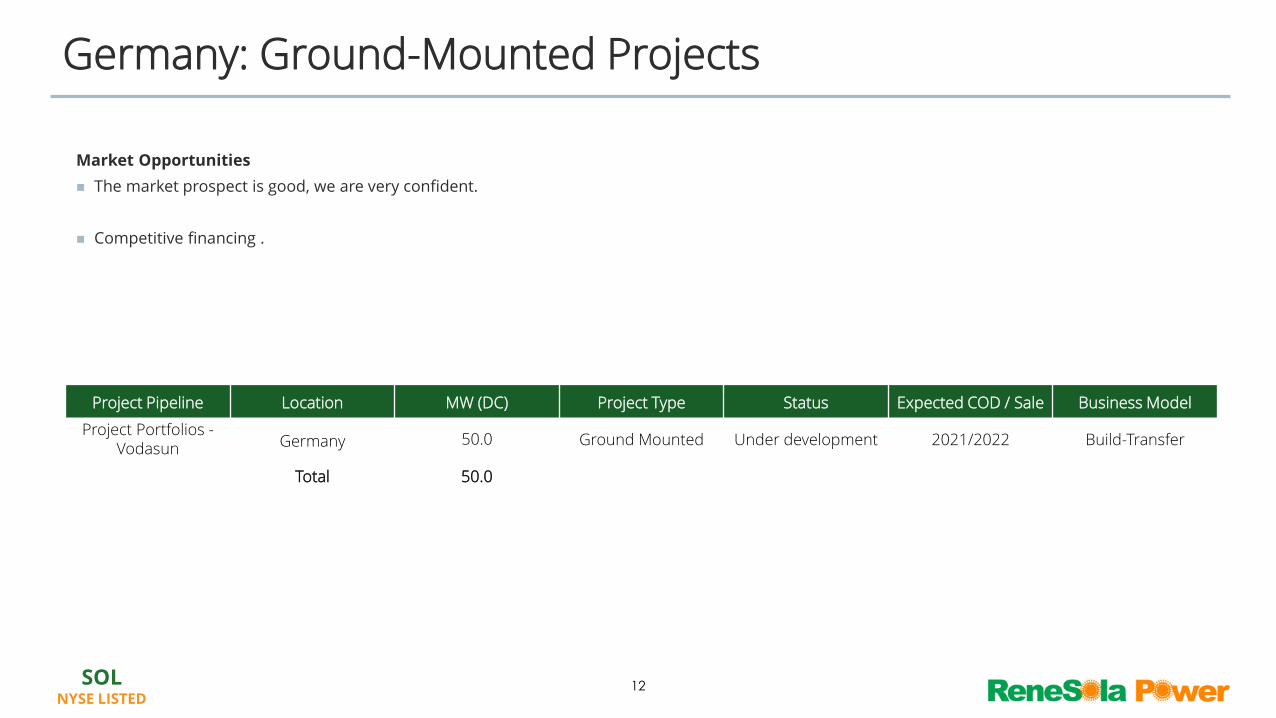
Germany: Ground-Mounted Projects
Project Pipeline Location MW (DC) Project Type Status Expected COD / Sale Business Model
Project Portfolios -Vodasun Germany 50.0 Ground Mounted Under development 2021/2022 Build-Transfer
Total 50.0
Market Opportunities
The market prospect is good, we are very confident.
Competitive financing .
12
SOLNYSE LISTED
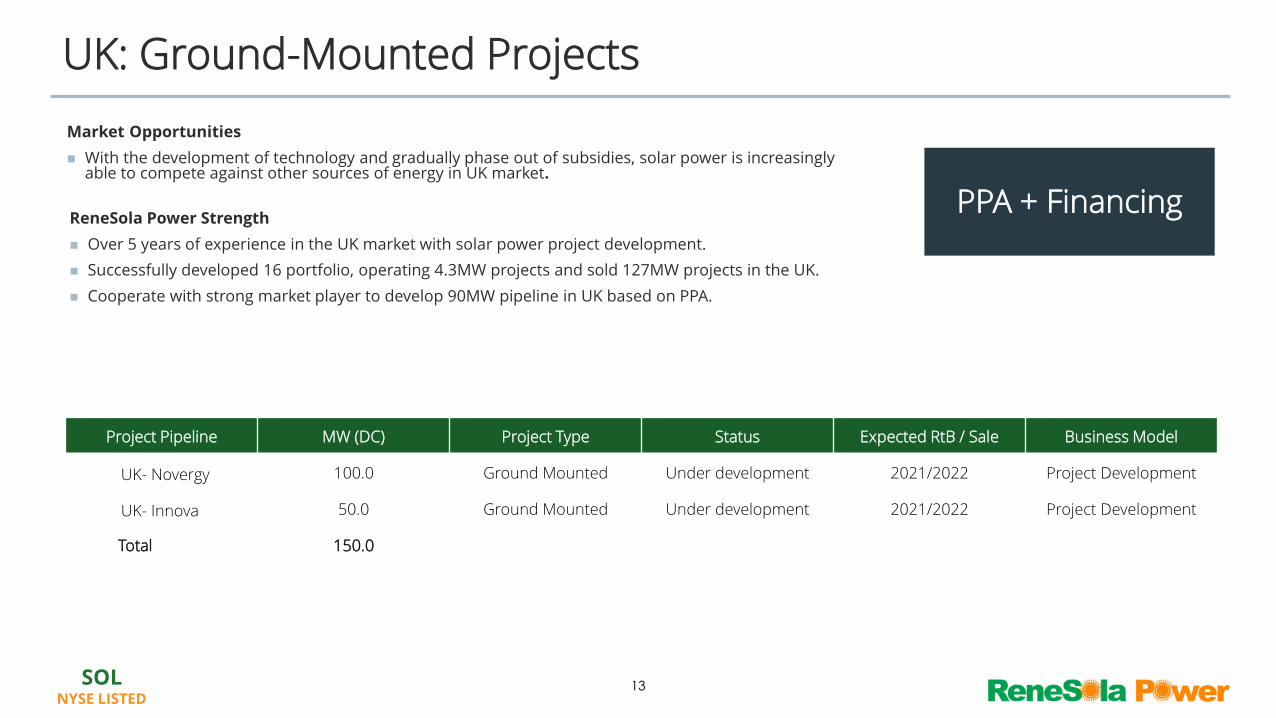
UK: Ground-Mounted Projects
Project Pipeline MW (DC) Project Type Status Expected RtB / Sale Business Model
UK- Novergy 100.0 Ground Mounted Under development 2021/2022 Project Development
UK- Innova 50.0 Ground Mounted Under development 2021/2022 Project Development
Total 150.0
Market Opportunities
With the development of technology and gradually phase out of subsidies, solar power is increasingly able to compete against other sources of energy in UK market.
PPA + Financing
13
ReneSola Power Strength
Over 5 years of experience in the UK market with solar power project development.
Successfully developed 16 portfolio, operating 4.3MW projects and sold 127MW projects in the UK.
Cooperate with strong market player to develop 90MW pipeline in UK based on PPA.

Operating Assets(As of November 30, 2020)
SOLNYSE LISTED
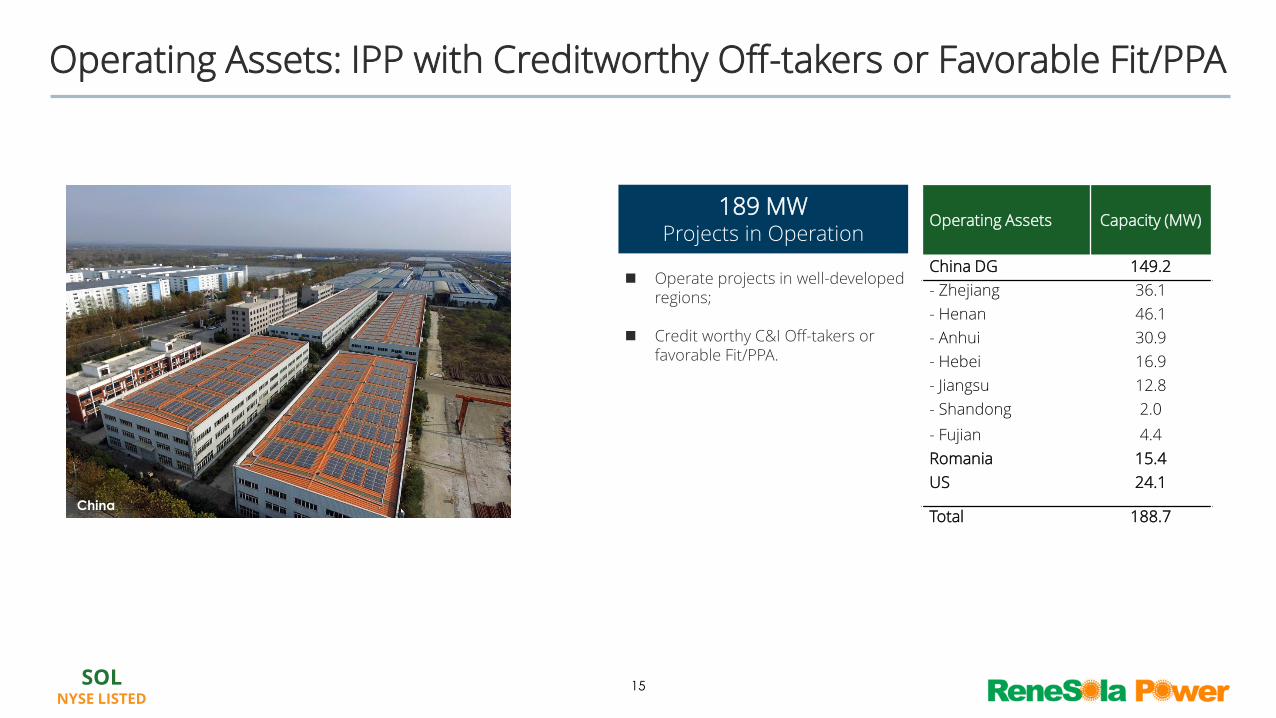
Operate projects in well-developed regions;
Credit worthy C&I Off-takers or favorable Fit/PPA.
Operating Assets: IPP with Creditworthy Off-takers or Favorable Fit/PPA
15
189 MWProjects in Operation
Operating Assets Capacity (MW)
China DG 149.2
- Zhejiang 36.1
- Henan 46.1
- Anhui 30.9
- Hebei 16.9
- Jiangsu 12.8
- Shandong 2.0
- Fujian 4.4
Romania 15.4
US 24.1
Total 188.7China
Financial Results
SOLNYSE LISTED
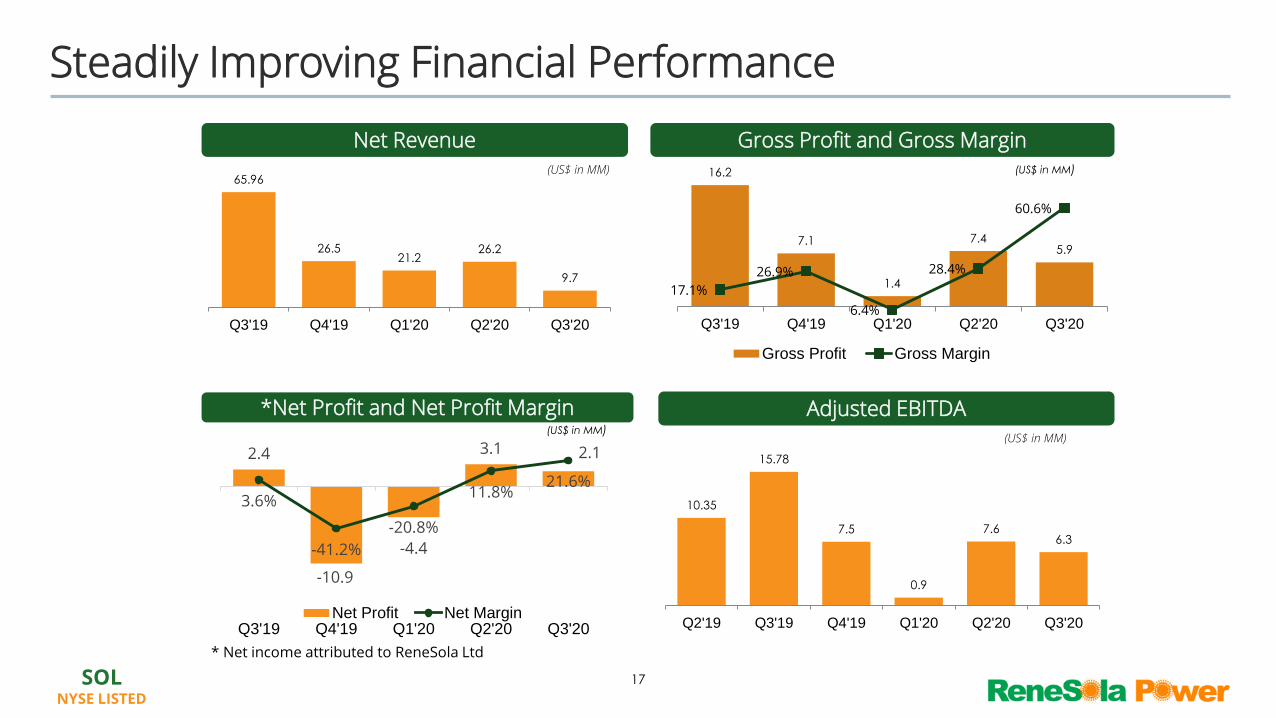
Steadily Improving Financial Performance
Net Revenue Gross Profit and Gross Margin
*Net Profit and Net Profit Margin
65.96
26.521.2
26.2
9.7
Q3'19 Q4'19 Q1'20 Q2'20 Q3'20
(US$ in MM) 16.2
7.1
1.4
7.45.9
17.1%
26.9%
6.4%
28.4%
60.6%
-2.0
3.0
8.0
13.0
18.0
Q3'19 Q4'19 Q1'20 Q2'20 Q3'20
Gross Profit Gross Margin
(US$ in MM)
2.4
-10.9
-4.4
3.1 2.1
3.6%
-41.2%
-20.8%
11.8%21.6%
-100.0%
-80.0%
-60.0%
-40.0%
-20.0%
0.0%
20.0%
40.0%
Q3'19 Q4'19 Q1'20 Q2'20 Q3'20Net Profit Net Margin
(US$ in MM)
Adjusted EBITDA
10.35
15.78
7.5
0.9
7.66.3
Q2'19 Q3'19 Q4'19 Q1'20 Q2'20 Q3'20
(US$ in MM)
17
* Net income attributed to ReneSola Ltd
SOLNYSE LISTED
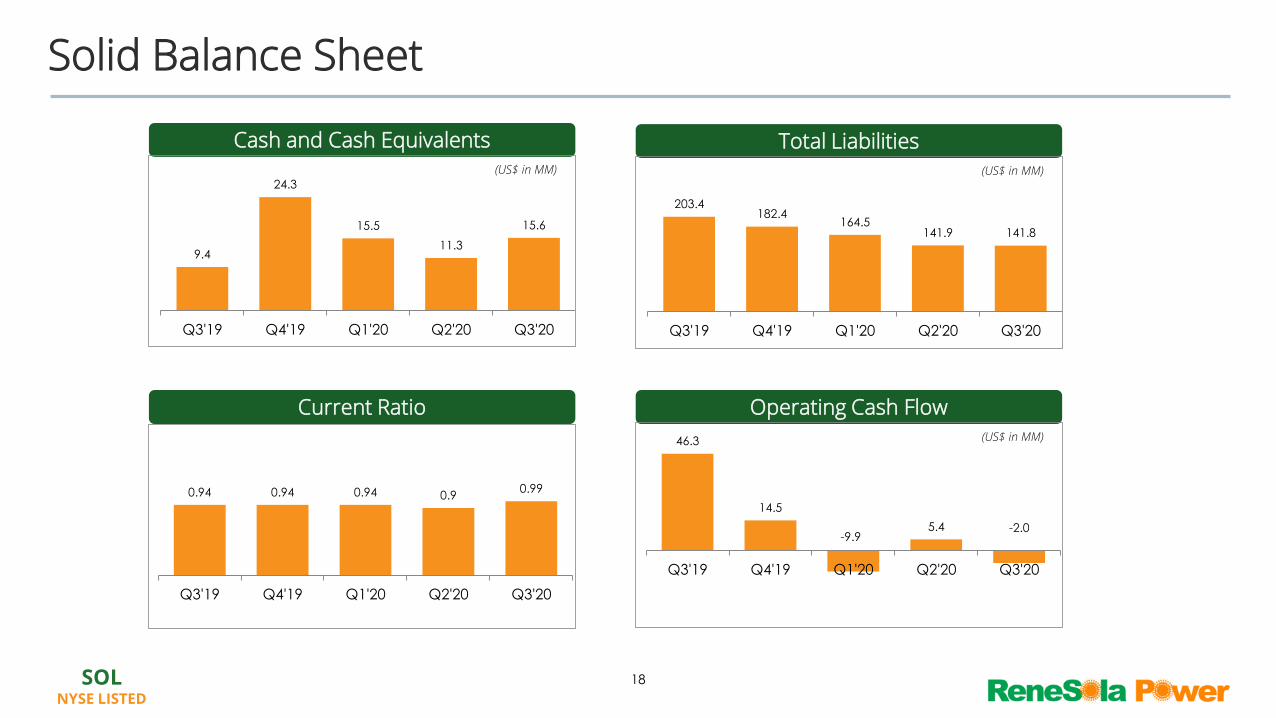
Solid Balance Sheet
Cash and Cash Equivalents
9.4
24.3
15.5
11.3
15.6
Q3'19 Q4'19 Q1'20 Q2'20 Q3'20
(US$ in MM)
Total Liabilities
203.4182.4
164.5141.9 141.8
Q3'19 Q4'19 Q1'20 Q2'20 Q3'20
(US$ in MM)
Current Ratio Operating Cash Flow(US$ in MM)
0.94 0.94 0.94 0.90.99
Q3'19 Q4'19 Q1'20 Q2'20 Q3'20
46.3
14.5
-9.95.4 -2.0
Q3'19 Q4'19 Q1'20 Q2'20 Q3'20
18
SOLNYSE LISTED
19
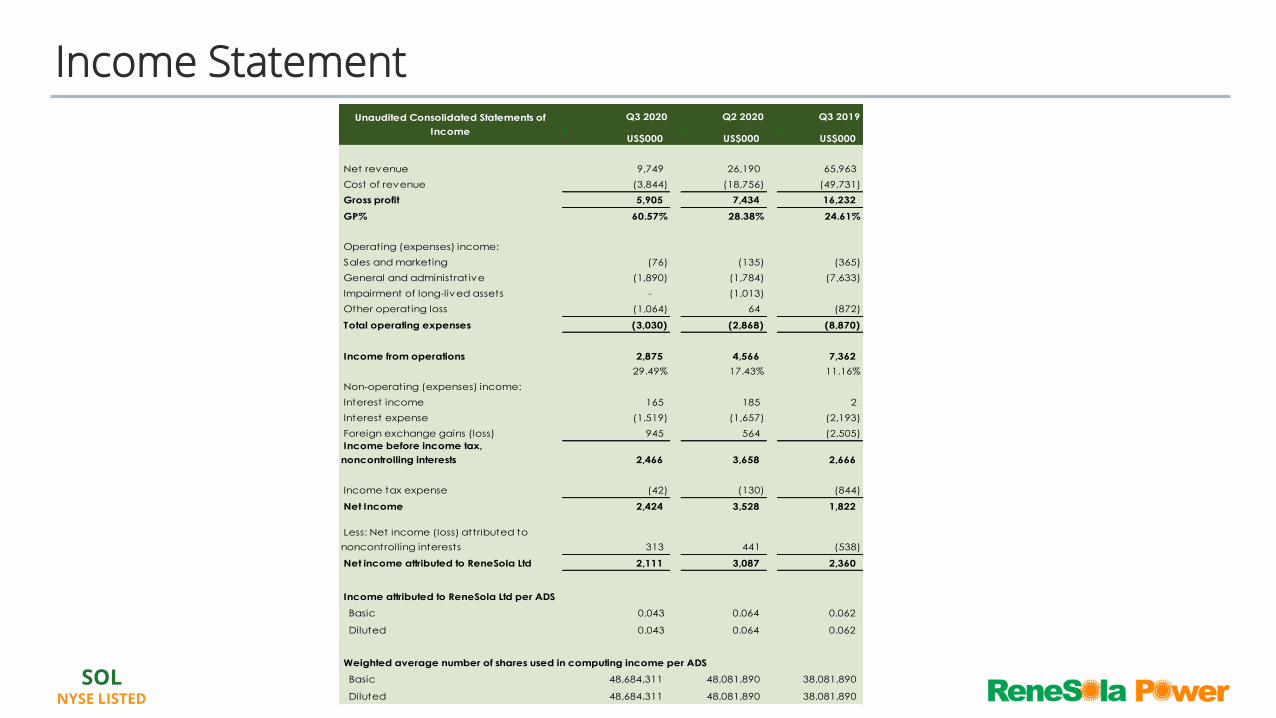
Income StatementQ3 2020 Q2 2020 Q3 2019
US$000 US$000 US$000
Net revenue 9,749 26,190 65,963
Cost of revenue (3,844) (18,756) (49,731)
Gross profit 5,905 7,434 16,232
GP% 60.57% 28.38% 24.61%
Operating (expenses) income:
Sales and marketing (76) (135) (365)
General and administrative (1,890) (1,784) (7,633)
Impairment of long-lived assets - (1,013)
Other operating loss (1,064) 64 (872)
Total operating expenses (3,030) (2,868) (8,870)
Income from operations 2,875 4,566 7,362
29.49% 17.43% 11.16%
Non-operating (expenses) income:
Interest income 165 185 2
Interest expense (1,519) (1,657) (2,193)
Foreign exchange gains (loss) 945 564 (2,505)
Income before income tax,
noncontrolling interests 2,466 3,658 2,666
Income tax expense (42) (130) (844)
Net Income 2,424 3,528 1,822
Less: Net income (loss) attributed to
noncontrolling interests 313 441 (538)
Net income attributed to ReneSola Ltd 2,111 3,087 2,360
Income attributed to ReneSola Ltd per ADS
Basic 0.043 0.064 0.062
Diluted 0.043 0.064 0.062
Weighted average number of shares used in computing income per ADS
Basic 48,684,311 48,081,890 38,081,890
Diluted 48,684,311 48,081,890 38,081,890
Unaudited Consolidated Statements of
Income
SOLNYSE LISTED
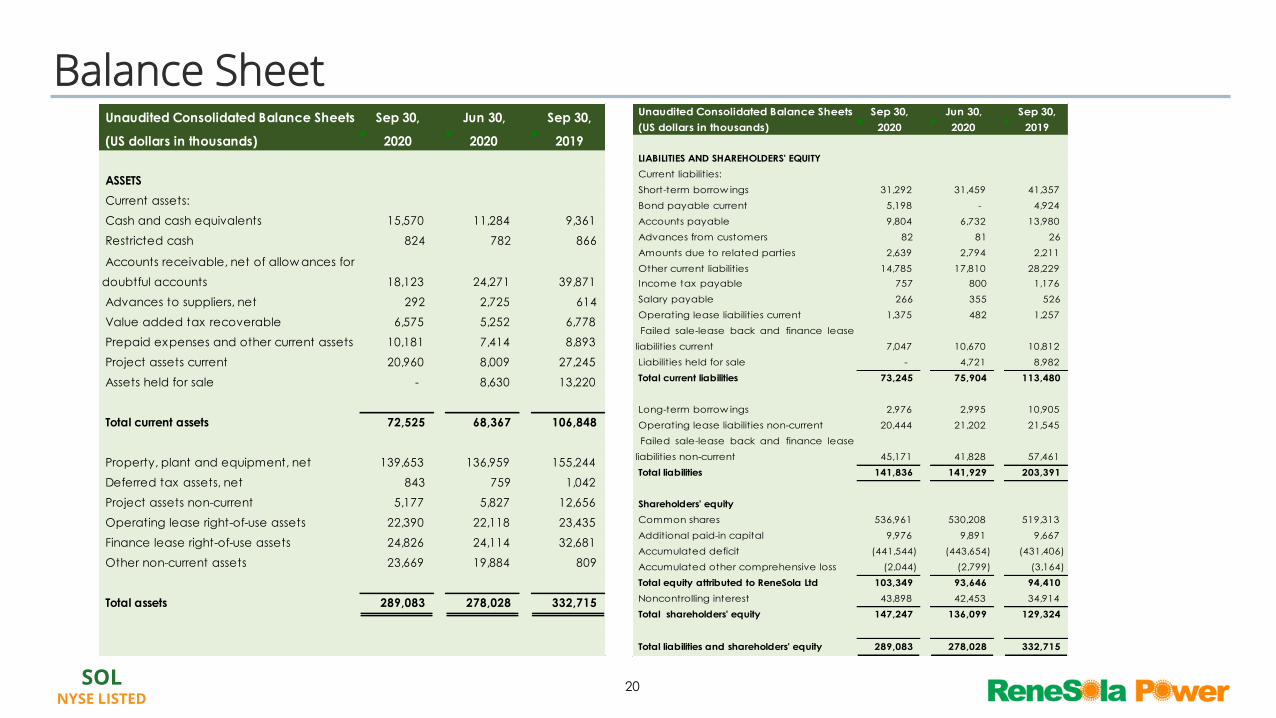
Balance Sheet Unaudited Consolidated Balance Sheets Sep 30, Jun 30, Sep 30,
(US dollars in thousands) 2020 2020 2019
ASSETS
Current assets:
Cash and cash equivalents 15,570 11,284 9,361
Restricted cash 824 782 866
Accounts receivable, net of allow ances for
doubtful accounts 18,123 24,271 39,871
Advances to suppliers, net 292 2,725 614
Value added tax recoverable 6,575 5,252 6,778
Prepaid expenses and other current assets 10,181 7,414 8,893
Project assets current 20,960 8,009 27,245
Assets held for sale - 8,630 13,220
Total current assets 72,525 68,367 106,848
Property, plant and equipment, net 139,653 136,959 155,244
Deferred tax assets, net 843 759 1,042
Project assets non-current 5,177 5,827 12,656
Operating lease right-of-use assets 22,390 22,118 23,435
Finance lease right-of-use assets 24,826 24,114 32,681
Other non-current assets 23,669 19,884 809
Total assets 289,083 278,028 332,715
Unaudited Consolidated Balance Sheets Sep 30, Jun 30, Sep 30,
(US dollars in thousands) 2020 2020 2019
LIABILITIES AND SHAREHOLDERS' EQUITY
Current liabilities:
Short-term borrow ings 31,292 31,459 41,357
Bond payable current 5,198 - 4,924
Accounts payable 9,804 6,732 13,980
Advances from customers 82 81 26
Amounts due to related parties 2,639 2,794 2,211
Other current liabilities 14,785 17,810 28,229
Income tax payable 757 800 1,176
Salary payable 266 355 526
Operating lease liabilities current 1,375 482 1,257
Failed sale-lease back and finance lease
liabilities current 7,047 10,670 10,812
Liabilities held for sale - 4,721 8,982
Total current liabilities 73,245 75,904 113,480
Long-term borrow ings 2,976 2,995 10,905
Operating lease liabilities non-current 20,444 21,202 21,545
Failed sale-lease back and finance lease
liabilities non-current 45,171 41,828 57,461
Total liabilities 141,836 141,929 203,391
Shareholders' equity
Common shares 536,961 530,208 519,313
Additional paid-in capital 9,976 9,891 9,667
Accumulated deficit (441,544) (443,654) (431,406)
Accumulated other comprehensive loss (2,044) (2,799) (3,164)
Total equity attributed to ReneSola Ltd 103,349 93,646 94,410
Noncontrolling interest 43,898 42,453 34,914
Total shareholders' equity 147,247 136,099 129,324
Total liabilities and shareholders' equity 289,083 278,028 332,715
20
SOLNYSE LISTED
21
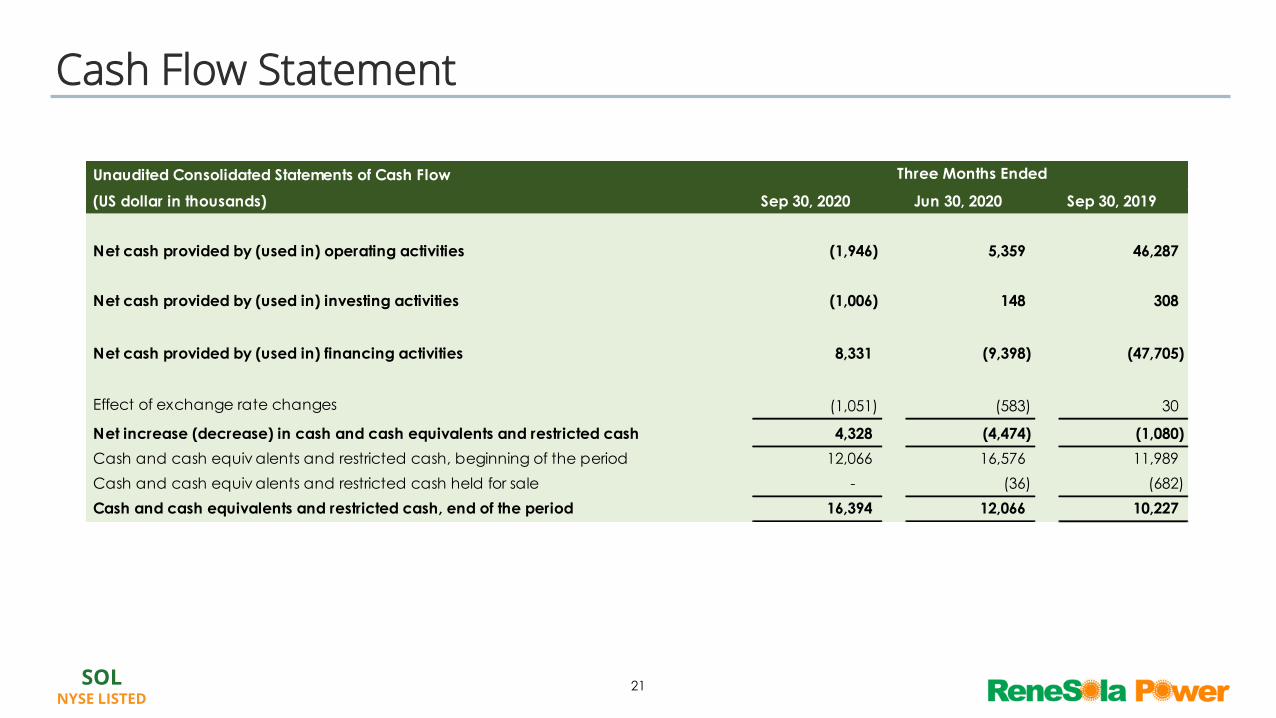
Cash Flow Statement
Unaudited Consolidated Statements of Cash Flow
(US dollar in thousands) Sep 30, 2020 Jun 30, 2020 Sep 30, 2019
Net cash provided by (used in) operating activities (1,946) 5,359 46,287
Net cash provided by (used in) investing activities (1,006) 148 308
Net cash provided by (used in) financing activities 8,331 (9,398) (47,705)
Effect of exchange rate changes (1,051) (583) 30
Net increase (decrease) in cash and cash equivalents and restricted cash 4,328 (4,474) (1,080)
Cash and cash equiv alents and restricted cash, beginning of the period 12,066 16,576 11,989
Cash and cash equiv alents and restricted cash held for sale - (36) (682)
Cash and cash equivalents and restricted cash, end of the period 16,394 12,066 10,227
Three Months Ended
SOLNYSE LISTED
22
Use of Non-GAAP Financial MeasuresTo supplement ReneSola Ltd’s financial statements presented on a GAAP basis, ReneSola Ltd provides Adjusted EBITDA as supplemental measures of itsperformance.
To provide investors with additional insight and allow for a more comprehensive understanding of the information used by management in its financial and decision-making surrounding pro-forma operations, we supplement our consolidated financial statements presented on a basis consistent with U.S. generally accepted accounting principles, or GAAP, with EBITDA, Adjusted EBITDA, non-GAAP net income/ (loss) attributed to ReneSola Ltd and non-GAAP EPS as non-GAAP financial measures of earnings.
• EBITDA represents net income before income tax expense (benefit), interest expense, depreciation and amortization.
• Adjusted EBITDA represents EBITDA plus discount of electricity subsidy in China, plus share-based compensation, plus bad debt provision, plus impairment of long-lived assets, plus one-time penalty of postponed payables, plus loss on one-time settlement of disputed Turkish receivables, plus loss/(gain) on disposal of assets, plus foreign exchange loss/(gain).
•Non-GAAP net income/ (loss) attributed to ReneSola Ltd represents GAAP net income/(loss) attributed to ReneSola Ltd plus discount of electricity subsidy in China, plus share-based compensation, plus bad debt provision, plus impairment of long-lived assets, plus one-time penalty of postponed payables, plus loss on one-time settlement of disputed Turkish receivables, plus loss/(gain) on disposal of assets, plus foreign exchange loss/(gain).
• Non-GAAP EPS represents Non-GAAP net income/ (loss) attributed to ReneSola Ltd divided by the number of fully diluted shares outstanding.
Our management uses EBITDA, Adjusted EBITDA, non-GAAP net income/ (loss) attributed to ReneSola Ltd and non-GAAP EPS as financial measures to evaluate the profitability and efficiency of our business model. We use these non-GAAP financial measures to access the strength of the underlying operations of our business. These adjustments, and the non-GAAP financial measures that are derived from them, provide supplemental information to analyze our operations between periods and over time.
We find these measures especially useful when reviewing pro-forma results of operations, which include large non-cash impairment of long-lived assets and loss on disposal of assets. Investors should consider our non-GAAP financial measures in addition to, and not as a substitute for ,financial measures prepared in accordance with GAAP.
SOLNYSE LISTED
23
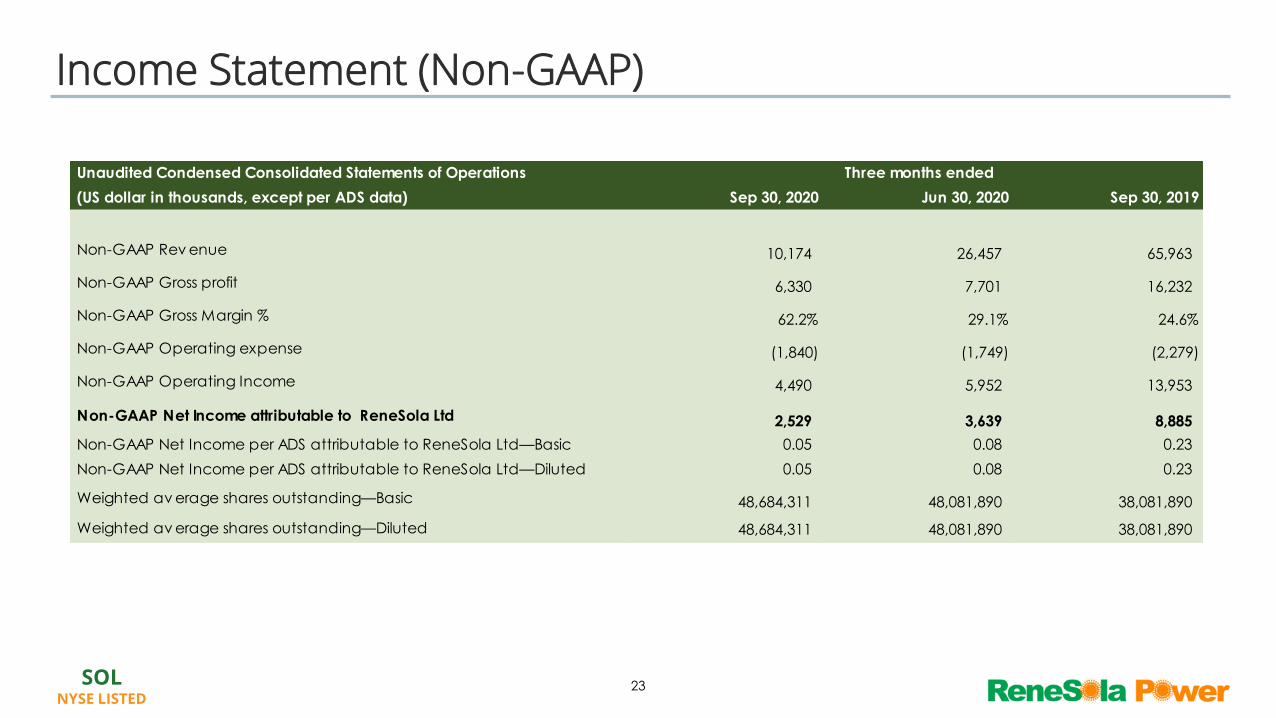
Income Statement (Non-GAAP)
Unaudited Condensed Consolidated Statements of Operations
(US dollar in thousands, except per ADS data) Sep 30, 2020 Jun 30, 2020 Sep 30, 2019
Non-GAAP Rev enue 10,174 26,457 65,963
Non-GAAP Gross profit 6,330 7,701 16,232
Non-GAAP Gross Margin % 62.2% 29.1% 24.6%
Non-GAAP Operating expense (1,840) (1,749) (2,279)
Non-GAAP Operating Income 4,490 5,952 13,953
Non-GAAP Net Income attributable to ReneSola Ltd 2,529 3,639 8,885
Non-GAAP Net Income per ADS attributable to ReneSola Ltd—Basic 0.05 0.08 0.23
Non-GAAP Net Income per ADS attributable to ReneSola Ltd—Diluted 0.05 0.08 0.23
Weighted av erage shares outstanding—Basic 48,684,311 48,081,890 38,081,890
Weighted av erage shares outstanding—Diluted 48,684,311 48,081,890 38,081,890
Three months ended

SOLNYSE LISTED
24
Adjusted EBITDA
Adjusted EBITDA
(US dollar in thousands) Sep 30, 2020 Jun 30, 2020 Sep 30, 2019
Net Income 2,424 3,528 1,822
Income tax expenses 42 130 844
Interest expenses,net off interest income 1,354 1,472 2,191
Depreciation & Amortization 1,907 1,793 1,824
EBITDA 5,727 6,923 6,681
Discount of electricity subsidy in China 425 267 -
Share based compensation 85 85 71
Bad debt prov ision of receiv ables 362 - 20
Impairment of long-liv ed assets - 1,013 5,532
Loss on disposal of project assets 755 - -
Loss on disposal of property, plant and equipment 234 22 968
Gains on disposal of property, plant and equipment (246) - -
Interest income of discounted electricity subsidy in China (144) (190) -
Foreign exchange loss/(gain) (945) (564) 2,505
Adjusted EBITDA 6,253 7,556 15,777
Three months ended
SOLNYSE LISTED
25
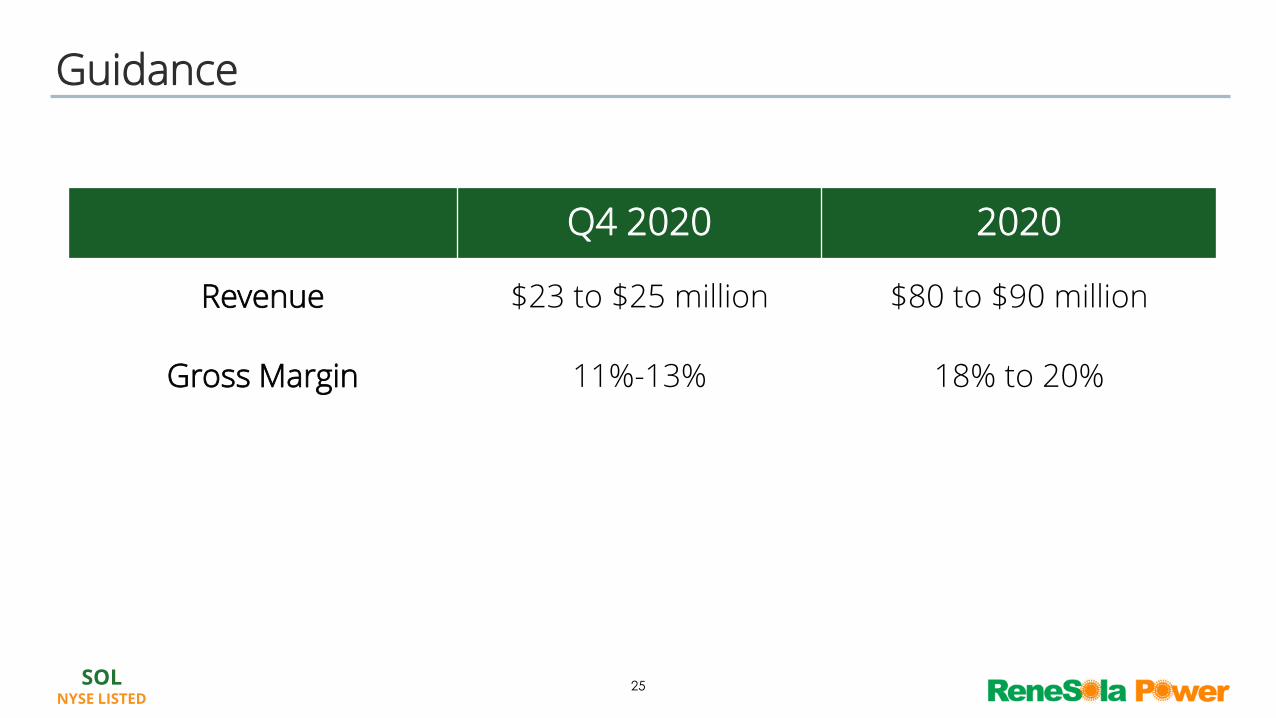
Guidance
Q4 2020 2020
Revenue $23 to $25 million $80 to $90 million
Gross Margin 11%-13% 18% to 20%
Recent Announcements

SOLNYSE LISTED
Recent Announcements
1. $5.0 Million Registered Direct Offering
Date: Q4 of 2020
Strategic Value: The Company intends to use the net proceeds for expanding new solar project pipeline and general working capital need.
27
SOLNYSE LISTED
Recent Announcements
2. Form Joint Venture with Vodasun to Develop Ground-mounted projects in Germany
Date: Q3 of 2020
Strategic Value: With a starting project portfolio of 50 to 100 MW, the JV intends to develop these projects, as well as develop an additional 50 to 100 MW of new projects per year.
28
SOLNYSE LISTED
Recent Announcements
3. Set up Joint Venture with Novergy to Develop Utility-scale Projects in the U.K.
Date: Q4 of 2020
Strategic Value: The JV expects to develop the existing pipeline of 100 MW, and intends to develop at least another 100 MW of utility-scale projects in the next couple of years.
29
SOLNYSE LISTED
Recent Announcements
4. Establish Joint Venture with Innova to Develop Utility-scale Projects in the U.K.
Date: Q4 of 2020
Strategic Value: The JV expects to continue the development of the existing pipeline of 50 MW, and intends to develop at least another 50+ MW of utility-scale projects in the next few years.
30
SOLNYSE LISTED
Recent Announcements
5. Complete Sale of 4.3 MW Solar Projects in the U.K.
Date: Q4 of 2020
Buyer: Atmosclear Investments (European cleantech PE firm)
Scope of Transaction: The portfolio comprises 1,509 residential rooftop projects located in Scotland, with a combined capacity of 4.3 MW.
Strategic Value: The Company continues to optimize its solar assets through strategic sales, which enables it to generate cash flow, realize profits and further strengthen balance sheet.
31
SOLNYSE LISTED
Recent Announcements
6. Close Acquisition of Selected Assets of Nova Development
Date: Q4 of 2020
Financial Terms: Cash Transaction of $3.8 million
Scope of Transaction: Acquired assets include DG and solar-plus-storage projects
Strategic Value:
o Immediately increases Renesola Power's development pipeline by approximately 200 MW;
o Add an experienced solar project development team;
o New team brings expertise in the development of U.S. DG and small-scale utility projects with battery storage.
32