q3 2018 - nyrstar/media/files/n/nyrstar-ir... · person is under any obligation to update or keep...
TRANSCRIPT
30 OCTOBER 2018
Q3 2018 Interim Management Statement

This presentation has been prepared by the management of Nyrstar NV (the "Company"). It does not constitute or form part of, and should not be construed as, an offer, solicitation or invitation to subscribe for, underwrite or otherwise acquire, any securities of the Company or any member of its group nor should it or any part of it form the basis of, or be relied on in connection with, any contract to purchase or subscribe for any securities of the Company or any member of its group, nor shall it or any part of it form the basis of or be relied on in connection with any contract or commitment whatsoever
The information included in this presentation has been provided to you solely for your information and background and is subject to updating, completion, revision and amendment and such information may change materially. Unless required by applicable law or regulation, no person is under any obligation to update or keep current the information contained in this presentation and any opinions expressed in relation thereto are subject to change without notice. No representation or warranty, express or implied, is made as to the fairness, accuracy, reasonableness or completeness of the information contained herein. Neither the Company nor any other person accepts any liability for any loss howsoever arising, directly or indirectly, from this presentation or its contents
This presentation includes forward-looking statements that reflect the Company's intentions, beliefs or current expectations concerning, among other things, the Company’s results of operations, financial condition, liquidity, performance, prospects, growth, strategies and the industry in which the Company operates. These forward-looking statements are subject to risks, uncertainties and assumptions and other factors that could cause the Company's actual results of operations, financial condition, liquidity, performance, prospects, growth or opportunities, as well as those of the markets it serves or intends to serve, to differ materially from those expressed in, or suggested by, these forward-looking statements. The Company cautions you that forward-looking statements are not guarantees of future performance and that its actual results of operations, financial condition and liquidity and the development of the industry in which the Company operates may differ materially from those made in or suggested by the forward-looking statements contained in this presentation. In addition, even if the Company's results of operations, financial condition, liquidity and growth and the development of the industry in which the Company operates are consistent with the forward-looking statements contained in this presentation, those results or developments may not be indicative of results or developments in future periods. The Company and each of its directors, officers and employees expressly disclaim any obligation or undertaking to review, update or release any update of or revisions to any forward-looking statements in this presentation or any change in the Company's expectations or any change in events, conditions or circumstances on which these forward-looking statements are based, except as required by applicable law or regulation
This document and any materials distributed in connection with this document are not directed to, or intended for distribution to or use by, any person or entity that is a citizen or resident or located in any locality, state, country or other jurisdiction where such distribution, publication, availability or use would be contrary to law or regulation or which would require any registration or licensing within such jurisdiction
The distribution of this document in certain jurisdictions may be restricted by law and persons into whose possession this document comes should inform themselves about, and observe any such restrictions. The Company’s shares have not been and will not be registered under the US Securities Act of 1933 (the “Securities Act”) and may not be offered or sold in the United States absent registration under the Securities Act or exemption from the registration requirement thereof
2
Important Notice

3
Hilmar Rode Chief Executive Officer

Overview of September YTD 2018
4
• Group Underlying EBITDA1 of EUR 134m down 17% on the first 9 months of 2017, primarily due to a 15% decrease in the zinc benchmark treatment charge, a weakening of the US dollar versus the Euro, increased energy prices in Europe and higher direct operating costs at the mining operations, partially offset by a higher average zinc price and increased zinc metal and zinc in concentrate production
• Balance sheet remains robust
− Committed liquidity as of 30 September 2018 of EUR 631m
− Net debt of EUR 1,137m2 at 30 September 2018
• Free Cash Flow Positive in first nine months of 2018, an improvement of EUR 496 million on FY 2017
• Port Pirie Redevelopment continues to ramp-up in-line with management’s expectations
− Continuous quarterly operational improvements with records achieved in Q3 2018 for volume of material treated and proportion of high margin residue in feed
− Earnings uplift is reaffirmed at current macros with at least EUR 40m in 2018, EUR 100m in 2019 and EUR 130m in 2020
• Myra Falls restart is progressing well with zinc production having commenced in September 2018 and first shipment of zinc concentrate expected to take place in Q4 2018
• Bought back and cancelled EUR 10m of 2019 senior notes at a discount to par
− Actively reviewing various options to refinance upcoming 2019 maturities

Delivering clear progress on Free Cash Flow and core business pillars
5
(€472m)
FY 2016 FY 2017 9m 2018 (€514m)
€24m
Free Cash Flow at the end of Sep’18
Q1’18
37% 48kt
Q4’17 Q3’18 Q2’18
54% 60%
1kt
21kt
75kt
Residue in feed (%) TSL feed (kt)
Port Pirie continues to ramp-up on schedule
Zinc metal production increasing in-line with guidance
797
FY 2016 FY 2017
(forecast)
FY 2018
1,015kt 1,019kt 1,070kt – 1,090kt
+6%
Zinc in concentrate production ramping-up below guidance
140kt – 150kt
123kt
FY 2018 FY 2016 FY 2017
107
96kt
(forecast) +18%
9m’18 actual
production of 797kt
9m’18 actual
production of 107kt
* TSL = Top Submerged Lance furnace
Zinc market had some weakness in Q3’18; fundamentals remain solid
6
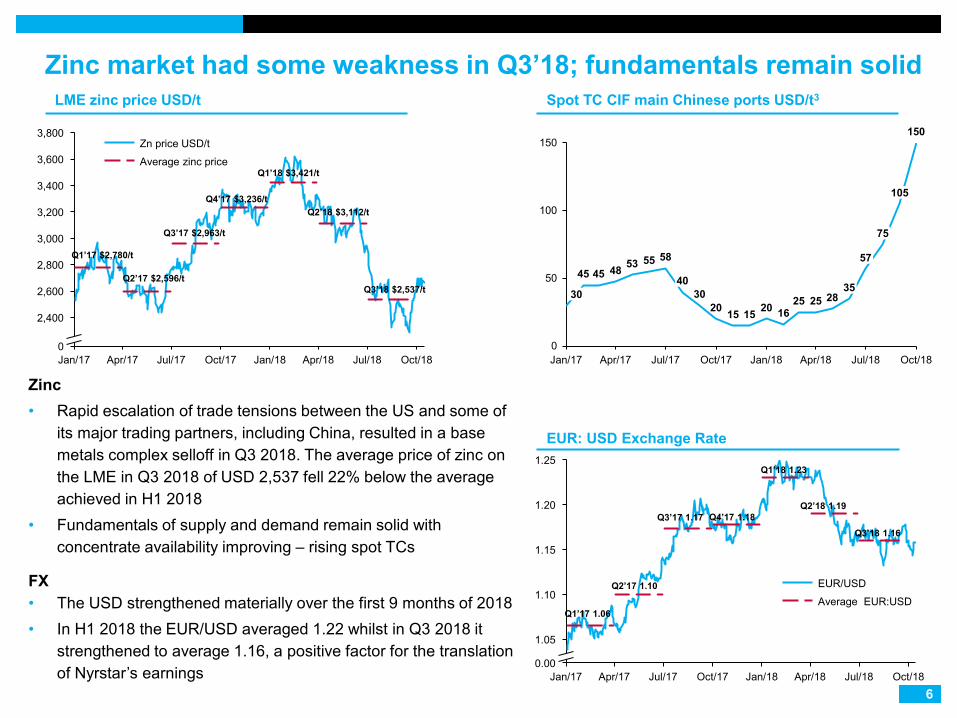
Zinc • Rapid escalation of trade tensions between the US and some of
its major trading partners, including China, resulted in a base metals complex selloff in Q3 2018. The average price of zinc on the LME in Q3 2018 of USD 2,537 fell 22% below the average achieved in H1 2018
• Fundamentals of supply and demand remain solid with concentrate availability improving – rising spot TCs
FX • The USD strengthened materially over the first 9 months of 2018 • In H1 2018 the EUR/USD averaged 1.22 whilst in Q3 2018 it
strengthened to average 1.16, a positive factor for the translation of Nyrstar’s earnings
Spot TC CIF main Chinese ports USD/t3
Jan/17 Jul/17 Apr/17
1.20
Oct/17 Jan/18 Apr/18 Jul/18 Oct/18 0.00
1.05
1.10
1.15
1.25
EUR/USD
Average EUR:USD
EUR: USD Exchange Rate
Q2’17 1.10
Q3’17 1.17 Q4’17 1.18
Q1’18 1.23
Q1’17 1.06
Q2’18 1.19
Q3’18 1.16
Jul/18
3,800
Jan/17 Jul/17 0
Apr/17
3,400
2,400
2,800
2,600
Oct/17
3,000
3,200
Jan/18 Apr/18
3,600
Oct/18
Zn price USD/t
Average zinc price
LME zinc price USD/t
Q2’17 $2,596/t
Q3’17 $2,963/t
Q4’17 $3,236/t
Q1’18 $3,421/t
Q1’17 $2,780/t
Q2’18 $3,112/t
Q3’18 $2,537/t 45 45 48 53 55 58
30 20 15 15 20 16
25 25 28
150
0
50
100
150
Apr/18 Jan/17 Jul/17 Jan/18 Oct/17 Jul/18 Oct/18 Apr/17
30 40
75
35
105
57
7
Stable safety performance, improved zinc metal and mine production Safety, Health & Environment
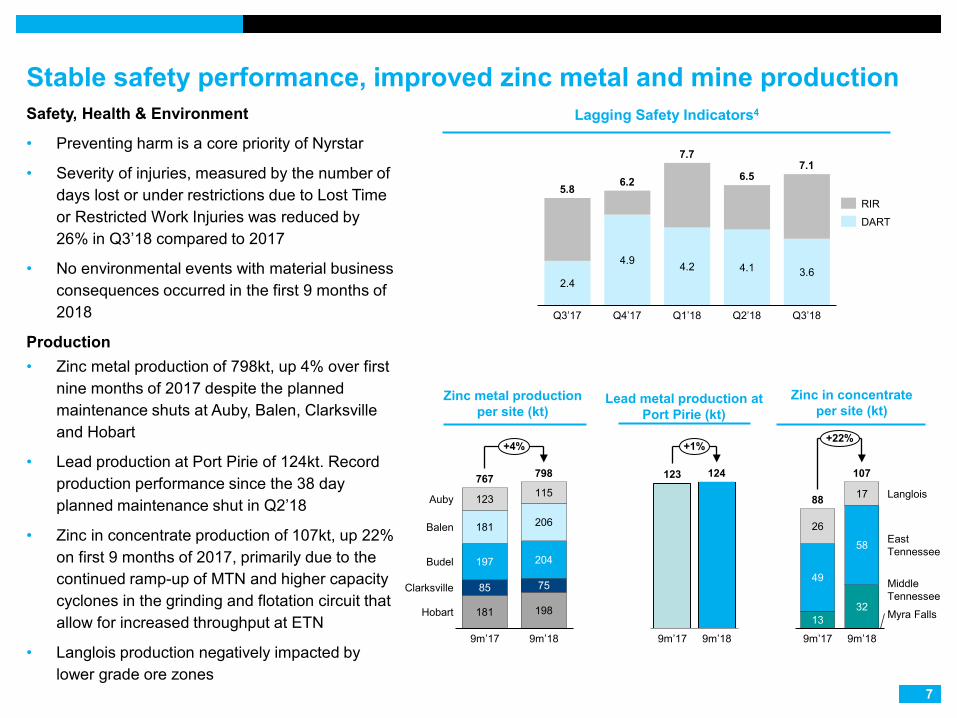
• Preventing harm is a core priority of Nyrstar
• Severity of injuries, measured by the number of days lost or under restrictions due to Lost Time or Restricted Work Injuries was reduced by 26% in Q3’18 compared to 2017
• No environmental events with material business consequences occurred in the first 9 months of 2018
Production • Zinc metal production of 798kt, up 4% over first
nine months of 2017 despite the planned maintenance shuts at Auby, Balen, Clarksville and Hobart
• Lead production at Port Pirie of 124kt. Record production performance since the 38 day planned maintenance shut in Q2’18
• Zinc in concentrate production of 107kt, up 22% on first 9 months of 2017, primarily due to the continued ramp-up of MTN and higher capacity cyclones in the grinding and flotation circuit that allow for increased throughput at ETN
• Langlois production negatively impacted by lower grade ore zones
Lagging Safety Indicators4
Zinc metal production per site (kt)
181 198
85 75
197 204
181 206
123 115
9m’17
Hobart
Clarksville
Auby
9m’18
Balen
767
Budel
798
+4%
Zinc in concentrate per site (kt)
13 32
49
58
26
17
Middle Tennessee
9m’18 9m’17
Langlois
East Tennessee
Myra Falls
88
107
+22%
123 124
9m’18 9m’17
+1%
Lead metal production at Port Pirie (kt)
2.4
4.9 4.2 4.1 3.6
Q3’18 Q3’17 Q1’18 Q4’17
7.7
5.8
Q2’18
6.2 6.5 7.1
RIR
DART

8
Michel Abaza Chief Financial Officer
9
28 22
24
35
28
46
1
Mining 1
Q1’184 Q2’184 Q3’18
Other
Metals Processing
52
82
50
Financial summary Underlying EBITDA (€’m)
Net Debt (€’m)
Capex (€’m)
16 12 27
59 59
(11) (15) (11) Other
Q2’18 Q3’18
(2)
Q1’18
Metals Processing
Mining1
64 56
13
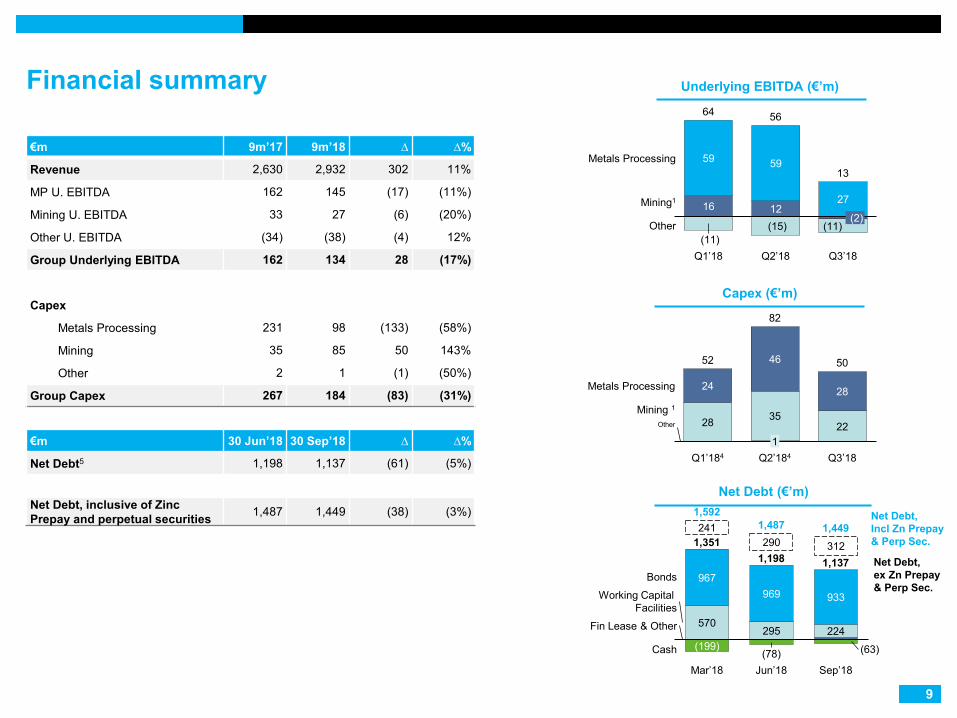
€m 9m’17 9m’18 ∆ ∆%
Revenue 2,630 2,932 302 11%
MP U. EBITDA 162 145 (17) (11%)
Mining U. EBITDA 33 27 (6) (20%)
Other U. EBITDA (34) (38) (4) 12%
Group Underlying EBITDA 162 134 28 (17%)
Capex
Metals Processing 231 98 (133) (58%)
Mining 35 85 50 143%
Other 2 1 (1) (50%)
Group Capex 267 184 (83) (31%)
€m 30 Jun’18 30 Sep’18 ∆ ∆%
Net Debt5 1,198 1,137 (61) (5%)
Net Debt, inclusive of Zinc Prepay and perpetual securities 1,487 1,449 (38) (3%)
570 295 224
967 969 933
241 290 312
(199) (78) (63)
Mar’18 Jun’18
Cash
1,198 1,137
1,351
Sep’18
Fin Lease & Other
Bonds
Working Capital Facilities
1,592 1,487 1,449
Net Debt, Incl Zn Prepay & Perp Sec.
Net Debt, ex Zn Prepay & Perp Sec.

Group underlying EBITDA – Q3’18 on Q2’18 (€m)
10
MP -€10m
Macro -€32m
Mining -€4m
12
59
15
(15)
(2) FX
TC rate/ Other
macro5
6 Zn
3
(7)
(10)
Metals Processing
FX
(4)
Q2’18 EBITDA
Mining
(10) Other
Other
Other & Eliminations
(13)
Q3’18 EBITDA
MP
Mining
Strategic hedges
Metal prices
(35) Zinc
(45)
Group €56m
4
Q2’18 Q3’18 ∆ Zinc price (USD/t) 3,112 2,537 (18%)
B/M Zn TC (USD/dmt) 147 147 -
FX (EUR/USD) 1.19 1.16 (3%)
FX (EUR/AUD) 1.57 1.59 1%
Zinc metal (kt) 275 270 (2%)
Zinc in concentrate (kt) 37 37 -
27
(2) (12)
Group €13m
Other Mining
MP

Group underlying EBITDA – 9M’18 on 9M’17 (€m)
11
MP €46m
Macro -€43m
Mining -€26m
33
162
46
(34)
Strategic hedges
(17)
Metals Processing
(55)
TC rate/ Other
macro5
(26)
Mining
(5)
Other & Eliminations
9M’18
EBITDA
Mining
Other
(8) FX
18
2 Other
9M’17 EBITDA
MP
FX Metal prices
15 Zinc
20 Zn Group €162m
12
27
145
(38)
MP
Mining
Other
Group €134m
9m’17 9m’18 ∆ Zinc price (USD/t) 2,783 3,020 9%
B/M Zn TC (USD/dmt) 172 147 (15%)
FX (EUR/USD) 1.11 1.19 7%
FX (EUR/AUD) 1.45 1.58 9%
Zinc metal (kt) 766 797 4%
Zinc in concentrate (kt) 88 107 22%
1406
177
1137
(13)
(1198)
(48) 13
20
Other Net Debt Jun’18
Group EBITDA
Capex6
(12)
Interest & Tax
0
(56)
Working Capital
Net Debt inclusive Zn Prepay and Perp Notes
Sep’18
Change Prepays
(290)
Net Debt exclusive Zn Prepay and Perp Notes
Sep’18
Change in Zn prepay
Change in Perp Notes
€m
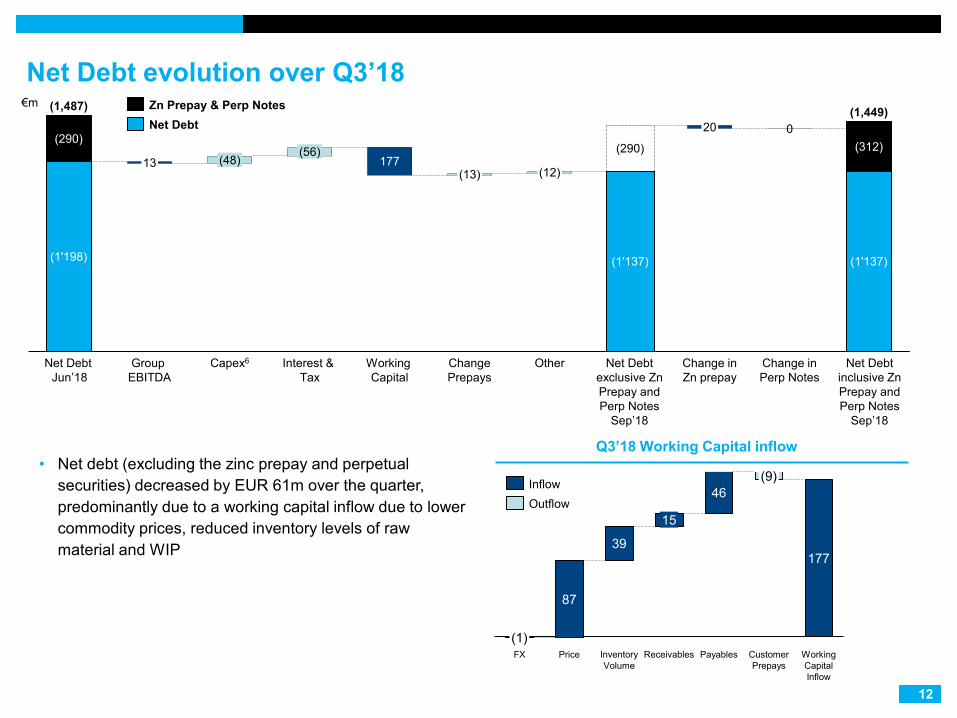
Net Debt evolution over Q3’18
12
(1'198)
(290)
(1,487)
(1'137)
(312)
(1,449)
(1'137)
(290)
Zn Prepay & Perp Notes Net Debt
Q3’18 Working Capital inflow • Net debt (excluding the zinc prepay and perpetual
securities) decreased by EUR 61m over the quarter, predominantly due to a working capital inflow due to lower commodity prices, reduced inventory levels of raw material and WIP 177
39
46
Inventory Volume
(1) Receivables FX
87
Price Payables
(9)
Customer Prepays
Working Capital Inflow
15
Inflow Outflow
13
Hilmar Rode Chief Executive Officer
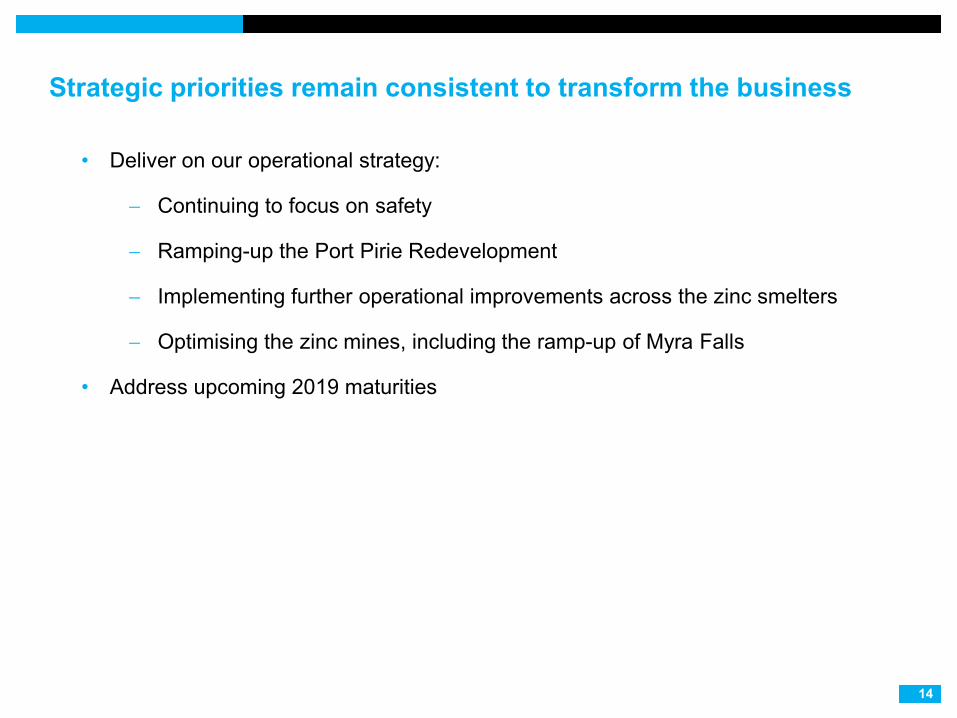
Strategic priorities remain consistent to transform the business
• Deliver on our operational strategy:
− Continuing to focus on safety
− Ramping-up the Port Pirie Redevelopment
− Implementing further operational improvements across the zinc smelters
− Optimising the zinc mines, including the ramp-up of Myra Falls
• Address upcoming 2019 maturities
14

Questions

16
Debt, working capital facilities, prepays, perpetual securities overview
Outstanding balances at 30 Sept 2018 (€m) Outstanding maturity / anticipated amortisation profile1
Drawing €m
Capacity €m Maturity
Structural Debt
2019 High Yield Bond 340 340 Sept 2019 2022 Convertible Bond 115 115 July 2022 2024 High Yield Bond 500 500 Mar 2024 Structural Debt 955 955
Working Capital Facilities
SCTF 229 600 Dec 2021 Loan from Related Party (Trafigura) 0 216 Dec 2019 KBC 32 50 July 2019 Working capital facilities 261 866
Prepays in Other Financial Liabilities / Deferred Income
Zinc Prepay (May-18) – 12 month grace 130 May 2021 Silver Prepay PPR 27 Aug 2019 Silver Prepay (Apr-18) – 6 month grace 43 Apr 2019 Silver Prepay (Dec-17) – 10 month grace 52 July 2019 Silver Prepay (Dec-17) – 12 month grace 9 Dec 2018 Copper Prepay (Dec-17) – 12 month grace 26 Dec 2021 Prepays 287
Perpetual Securities1
Perpetual Securities 181 1 Anticipated amortisation profile for the Perpetual Securities
€46m
€340m
€600m
€115m
€36m
€500m
€36m
€36m
€36m
€216m
€36m
€50m
2020
€131m
€36m
2018
€18m
2019
€73m
2021 2022 2023 2024
Perpetaul Securities
SCTF All Prepays
KBC Trafigura facility
HY Bonds Convertible bonds
Metals Processing
17
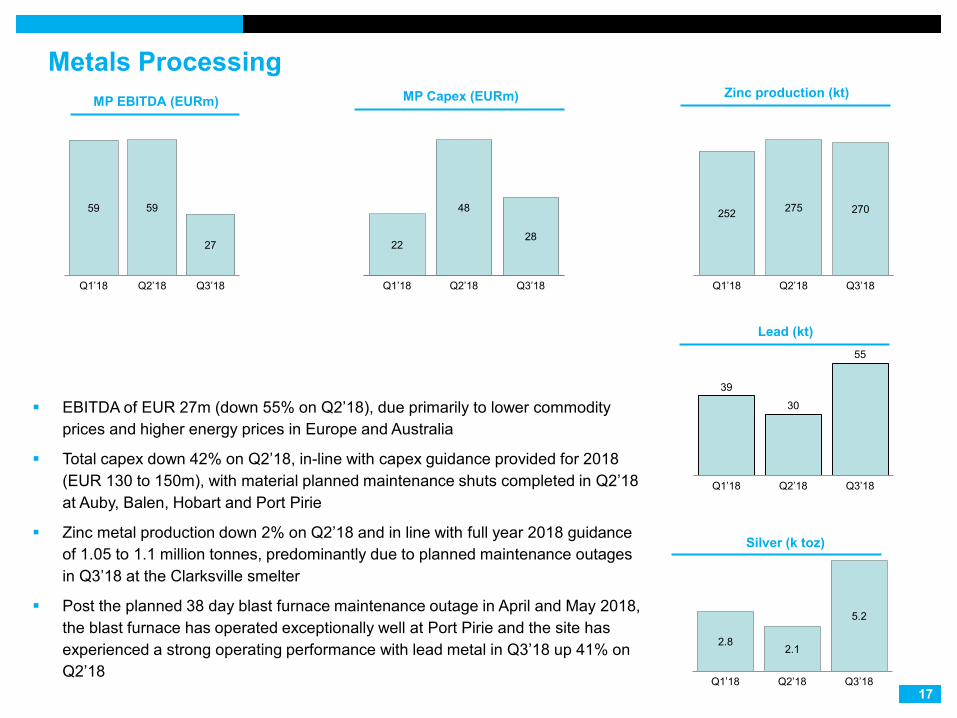
EBITDA of EUR 27m (down 55% on Q2’18), due primarily to lower commodity prices and higher energy prices in Europe and Australia
Total capex down 42% on Q2’18, in-line with capex guidance provided for 2018 (EUR 130 to 150m), with material planned maintenance shuts completed in Q2’18 at Auby, Balen, Hobart and Port Pirie
Zinc metal production down 2% on Q2’18 and in line with full year 2018 guidance of 1.05 to 1.1 million tonnes, predominantly due to planned maintenance outages in Q3’18 at the Clarksville smelter
Post the planned 38 day blast furnace maintenance outage in April and May 2018, the blast furnace has operated exceptionally well at Port Pirie and the site has experienced a strong operating performance with lead metal in Q3’18 up 41% on Q2’18
MP EBITDA (EURm) Zinc production (kt)
252 275 270
Q3’18 Q1’18 Q2’18
Lead (kt)
Silver (k toz)
39
30
55
Q2’18 Q1’18 Q3’18
2.8 2.1
5.2
Q1’18 Q2’18 Q3’18
22
48
28
Q1’18 Q2’18 Q3’18
MP Capex (EURm)
59 59
27
Q1’18 Q2’18 Q3’18

Mining
18
EBITDA of EUR (2m) in Q3’18, down EUR 14m on Q2’18, due to an 18% reduction in the zinc price, the negative EBITDA from the restart of the Myra Falls mine and elevated operating costs at the Middle Tennessee and Langlois mines
Myra Falls restart has contributed negative EBITDA of EUR 17 million in the first 9 months of 2018
Capex in Q3’18 was EUR 22m, down EUR 13m on Q2’18, primarily due to the Myra Falls mine commencing production during Q3’18 and the capital spend for the restart being more concentrated in H1’18
• Zinc in concentrate production in Q3’18 of 37kt was flat on Q2’18 due with strong performance at the East Tennessee Mines offset by weaker production performance at Langlois and Middle Tennessee
• Langlois production impacted by reduced volume of ore milled and lower head grade
Zinc in concentrate production (kt) Capex (EURm) Mining EBITDA (EURm)
17
12
-2
Q1’18 Q2’18 Q3’18
28 35
22
Q1’18 Q2’18 Q3’18
33 37 37
Q3’18 Q2’18 Q1’18
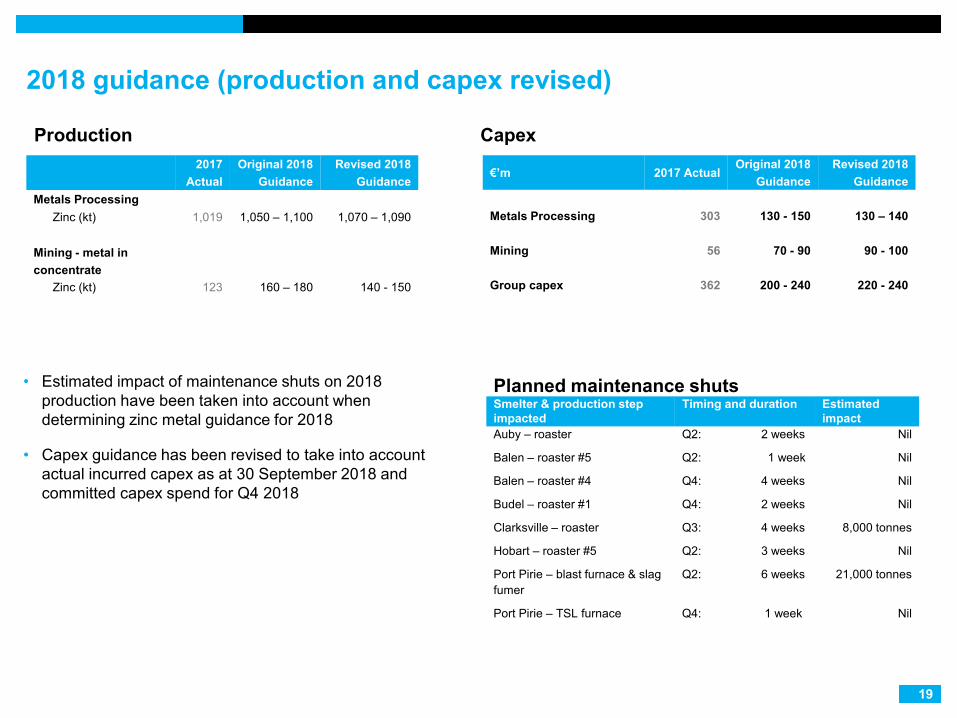
€’m 2017 Actual Original 2018
Guidance Revised 2018
Guidance
Metals Processing 303 130 - 150 130 – 140
Mining 56 70 - 90 90 - 100
Group capex 362 200 - 240 220 - 240
Production
Planned maintenance shuts Smelter & production step impacted
Timing and duration Estimated impact
Auby – roaster Q2: 2 weeks Nil
Balen – roaster #5 Q2: 1 week Nil
Balen – roaster #4 Q4: 4 weeks Nil
Budel – roaster #1 Q4: 2 weeks Nil
Clarksville – roaster Q3: 4 weeks 8,000 tonnes
Hobart – roaster #5 Q2: 3 weeks Nil
Port Pirie – blast furnace & slag fumer
Q2: 6 weeks 21,000 tonnes
Port Pirie – TSL furnace Q4: 1 week Nil
2017
Actual Original 2018
Guidance Revised 2018
Guidance
Metals Processing Zinc (kt) 1,019 1,050 – 1,100 1,070 – 1,090
Mining - metal in concentrate
Zinc (kt) 123 160 – 180 140 - 150
Capex
• Estimated impact of maintenance shuts on 2018 production have been taken into account when determining zinc metal guidance for 2018
• Capex guidance has been revised to take into account actual incurred capex as at 30 September 2018 and committed capex spend for Q4 2018
2018 guidance (production and capex revised)
19

Endnotes
20
1. All references to EBITDA in the presentation are Underlying EBITDA. Underlying EBITDA is a non-IFRS measure of earnings, which is used by management to assess the underlying performance of Nyrstar’s operations and is reported by Nyrstar to provide additional understanding of the underlying business performance of its operations. Nyrstar defines “Underlying EBITDA” as profit or loss for the period adjusted to exclude loss from discontinued operations (net of income tax), income tax (expense)/benefit, share of loss of equity-accounted investees, gain on the disposal of equity-accounted investees, net finance expense, impairment losses and reversals, restructuring expense, M&A related transaction expenses, depreciation, depletion and amortization, income or expenses arising from embedded derivatives recognised under IAS 39 “Financial Instruments: Recognition and Measurement” and other items arising from events or transactions clearly distinct from the ordinary activities of Nyrstar. For a definition of other terms used in this presentation, please see Nyrstar’s glossary of key terms available at: http://www.nyrstar.com/investors/en/Pages/investorsmaterials.aspx
2. Net debt excluding zinc metal prepay and perpetual securities. The net debt at 30 September 2018 including zinc metal prepay and perpetual securities was EUR 1.449 billion 3. Source: CRU, Lead and Zinc Concentrate Monitor, October 2018 4. Lost Time Injury Rate (LTIR) and Recordable Injury Rate (RIR) are 12 month rolling averages of the number of lost time injuries and recordable injuries (respectively) per million
hours worked, and include all employees and contractors directly and non directly supervised by Nyrstar at all current operations. Prior period data can change to account for the reclassification of incidents following the period end date and the disposal of operations
5. Net Debt is short term and long term liabilities, exclusive of Zinc Prepay (€130m) and perpetual securities (€181m), minus cash 6. Capex is shown on cash outflow basis rather than incurred