q3 2017 results presentation | november 7, 2017...
TRANSCRIPT

1 P R I V I L E G E D A N D C O N F I D E N T I A L
\\intranet.barcapint.com\dfs-amer\group\Nyk\area\ibd\Industrial\Companies\Jeld-Wen\2015.07 Project Jamaica Dual Track\2015.10 IPO Execution\Presentation\Roadshow Presentation\Project Falcon_Roadshow Presentation_(1.13.17)_vNear Final_v10pm
Q3 2017 Results Presentation | November 7, 2017

2
Disclosures
Forward-Looking Statements
This presentation contains certain "forward-looking statements" regarding business strategies, market potential, future financial performance, the potential of our categories and brands, our outlook for 2017, and our expectations, beliefs, plans, objectives, prospects, assumptions, or other future events. Forward-looking statements are generally identified by our use of forward-looking terminology such as “anticipate”, “believe”, “continue”, “could”, “estimate”, “expect”, “intend”, “may”, “might”, “plan”, “potential”, “predict”, “seek”, or “should”, or the negative thereof or other variations thereon or comparable terminology. Where, in any forward-looking statement, we express an expectation or belief as to future results or events, such expectation or belief is based on the current plans, expectations, assumptions, estimates, and projections of our management. Although we believe that these statements are based on reasonable expectations, assumptions, estimates and projections, they are only predictions and involve known and unknown risks, many of which are beyond our control that could cause actual outcomes and results to be materially different from those indicated in such statements.
Our actual results could differ materially from the results contemplated by these forward-looking statements due to a number of factors, including the factors discussed in our Annual Report on Form 10-K for the year ended December 31, 2016, and our Quarterly Reports on Form 10-Q, both filed with the Securities and Exchange Commission.
The assumptions underlying the guidance provided for 2017 include the achievement of anticipated improvements in end markets, competitive position, and product portfolio; stable macroeconomic factors; no changes in foreign currency exchange and tax rates; and favorable interest expense due to the recent debt reduction. The forward-looking statements included in this presentation are made as of the date hereof, and except as required by law, we undertake no obligation to update, amend or clarify any forward-looking statements to reflect events, new information or circumstances occurring after the date of this presentation.
Non-GAAP Financial MeasuresThis presentation presents certain “non-GAAP” financial measures. The components of these non-GAAP measures are computed by using amounts that are determined in accordance with accounting principles generally accepted in the United States of America (“GAAP”). A reconciliation of non-GAAP financial measures used in this presentation to their nearest comparable GAAP financial measures is included at the end of this presentation. The Company provides certain guidance on a non-GAAP basis because the Company cannot predict certain elements that are included in certain reported GAAP results, including the variables and individual adjustments necessary for a reconciliation to GAAP.
We use Adjusted EBITDA, Adjusted EBITDA margin, Adjusted net income, and Adjusted EPS because we believe they assist investors and analysts in comparing our operating performance across reporting periods on a consistent basis by excluding items that we do not believe are indicative of our core operating performance. Management believes Adjusted EBITDA and Adjusted EBITDA margin are helpful in highlighting trends because they exclude the results of decisions that are outside the control of management, while other measures can differ significantly depending on long-term strategic decisions regarding capital structure, the tax jurisdictions in which we operate, and capital investments. We use Adjusted EBITDA and Adjusted EBITDA margin to measure our financial performance and also to report our results to our board of directors. Further, our executive incentive compensation is based in part on Adjusted EBITDA. In addition, we use Adjusted EBITDA as calculated herein for purposes of calculating compliance with our debt covenants in certain of our debt facilities. Adjusted EBITDA should not be considered as an alternative to net income as a measure of financial performance or to cash flows from operations as a liquidity measure.
We define Adjusted EBITDA as net income, eliminating the impact of the following items: loss from discontinued operations, net of tax; gain (loss) on sale of discontinued operations, net of tax; equity (earnings) loss of non-consolidated entities; income tax; depreciation and amortization; interest expense, net; impairment and restructuring charges; gain on sale of property and equipment; share-based compensation expense; non-cash foreign exchange transaction/translation income (loss); other non-cash items; other items; and costs related to debt restructuring, debt refinancing, and the Onex investment. Adjusted EBITDA margin is defined as Adjusted EBITDA divided by net revenues.
We present free cash flow because we believe it assists investors and analysts in determining the quality of our earnings. We also use free cash flow to measure our financial performance and to report to our board of directors. In addition, our executive incentive compensation is based in part on free cash flow. We define free cash flow as cash flow from operations less capital expenditures (including purchases of intangible assets). Free cash flow should not be considered as an alternative to cash flows from operations as a liquidity measure.
Adjusted net income represents net income adjusted for the after-tax impact of i) non-cash foreign currency (gains) losses, ii) impairment and restructuring charges, and iii) other non-recurring expenses associated with certain matters such as our initial public offering, secondary offering, mergers, and litigation. Adjusted EPS represents net income per diluted share adjusted to exclude the estimated per share impact of the same specifically identified items used to calculate adjusted net income as described above. All such items are tax-effected at our estimated annual effective tax rate.
Other companies may compute these measures differently. No non-GAAP metric should be considered as an alternative to any other measure derived in accordance with GAAP.
Due to rounding, numbers presented throughout this document may not sum precisely to the totals provided and percentages may not precisely reflect the absolute figures.

3
IntroductionMark Beck, President and CEO

4
0.0%
2.0%
4.0%
6.0%
8.0%
10.0%
12.0%
14.0%
16.0%
18.0%
20.0%
FY 2013 LTM Q3 2017 Target*
An Extraordinary Transformation Underway
PROVEN TEAM DRIVING EARNINGS GROWTH AND FREE CASH FLOW
Adjusted EBITDA Margin %
Business Highlights Early Stages of Multi-Year Turnaround
4.4%
11.6%
15-20%
*Note: This presentation includes long-term targets, which are for illustrative purposes only. These long-term targets should not be read as a guarantee of future performance or results, and will not necessarily be accurate indications of the times at, or by which, if at all, such performance or results will be achieved.
Global market leader in windows and doors A unique platform with scale, iconic brands and
leading market positions A team of accomplished leaders executing a
proven operating model Ten strategic acquisitions since 2015 – all on
track to deliver strong ROI Growth-oriented financial results
– Steady profitable core growth: price, innovation, share-gain
– Consistent margin improvement: quality, productivity, sourcing
– Attractive free cash flow generation and conversion profile

5
Proven Operating Model
Target Identification
Target Cultivation
Stage Gate Process
Integration Playbook
Performance Tracking
Strategic M&AOperational Excellence
Talent Management, JELD-WEN Excellence Model (JEM), and Enabling Technology
WORLD-CLASS PERFORMANCE AND RETURNS
New Products and Innovation
Brand Strategy
Channel Management
Sales Force Effectiveness
Pricing Optimization
Profitable Organic Growth
Safety and Compliance
Quality System
Customer Experience
Productivity
Sourcing

6
Location JEM Tools Applied Results
Ringtown, PA
Value stream mapping, basic problem solving, line balancing, principal/flow production, initiated model cell
Increased window production line output by 44%
Grinnell, IA
Value stream mapping, basic problem solving, visual management, principal/flow production, standard work, initiated model cell
Increased window production line output by 31%
Toronto, CA Basic problem solving, training, visual management
Since 2015: Safety incident rate went from 4 to 0, warranty percentage cut in half, and revenues increased by 19% while free floorspace increased by 26%
PROOF POINTS OF JEM TOOLS DELIVERING RESULTS WITH EXCELLENT ROI
JEM Recent Operational Excellence Success Stories

7
Strategic M&AMMI Door Acquisition
CAPTURE VALUE ADD THROUGH FULL DOOR SYSTEM SOLUTIONS
Leading provider of comprehensive door systems and related value-added services in the Midwest U.S. supporting distributors, dealers, and home centers
Rationale: Complements our North America door business, expands service offerings, and improves lead times to our channel partners
Closed August 25, 2017
Primary products include:• Interior doors - molded / stile & rail• Exterior doors - steel / fiberglass• Patio and storm doors• Commercial doors
Three U.S. manufacturing sites:• Sterling Heights, Michigan• Cincinnati, Ohio• Sidman, Pennsylvania
Hardware(Bore, lockset, kickplate, mail slot)
GlassPre-Hanging
Finishing(Paint, Stain, Faux)
(Jambs, Sills, Casing, Molding)
(Decorative, Clear)
Customized Door Systems
Proprietary Dealer Portal and Order Configurator

8
Strategic M&AKolder Acquisition
HIGHLY STRATEGIC BOLT-ON; CREATING LEADERSHIP POSITION
Leading Australian provider of shower enclosures, closet systems, and related building products
Rationale: Significantly enhances our existing Australian capabilities in glass shower enclosures and built-in closet systems, and supports our strategy to build leadership positions in attractive markets
Closed August 31, 2017
Primary products include:• Shower enclosures• Closet systems• Kitchen splash backs• Mirrors
Headquarters outside of Sydney, Australia

9
Strategic M&ADomoferm Acquisition
HIGHLY STRATEGIC BOLT-ON; SYNERGIES IN BOTH REVENUES AND COST
Leading European provider of steel doors, steel door frames, and fire doors for the commercial and residential markets
Rationale: Capabilities in steel frames and doors significantly expand JELD-WEN’s European product range, including certified door systems
Expected closing in Q1 2018
Primary products include:• Steel doors• Steel frames• Fire doors
Four manufacturing sites:• Germany (2)• Austria• Czech Republic

10
Strategic M&AAcquisitions Are Delivering Solid Results – USD in Millions
CREATING VALUE THROUGH M&A BY DELIVERING ON SYNERGIES
Acquisition (Closing Date)
Total Purchase Price
(Net of cash acquired)
Annual Revenues at
Acquisition Date
2015-2016Dooria (Aug 2015)Aneeta (Aug 2015)Karona (Sep 2015)
LaCantina (Oct 2015)Trend (Feb 2016)
Breezway (Aug 2016)
$173 $250
2017 YTDMattiovi (Jun 2017)
MMI Door (Aug 2017)Kolder (Aug 2017)
$124 $138
Total Closed Deals $297 $388
(1) Exc ludes addi t ional revenue and cost synerg ies recognized in “core” JELD-WEN locat ions
LTM Q3 2017 Contribution to JELD-WEN’s Results (1)
Net Revenue $303
Adjusted EBITDA ~$48
Adjusted EBITDA Margins ~16%

11
Third Quarter Highlights
BUSINESS TRANSFORMATION DRIVING EARNINGS AND FCF IMPROVEMENT
Net revenues increased 6.3%- Positive core growth 2%, favorable foreign exchange impact 2%, and contribution of
recent acquisitions 3%
Adjusted EBITDA margin of 12.9%, a 20 bps increase over prior year- Favorable pricing and operational cost savings initiatives in all regions, offset by isolated
operational inefficiencies in North America windows and the U.K.- YTD margin improvement of 120 bps, in line with full year expectation of 100 – 150 bps
Free cash flow for the year to date increased $94 million to $141.7 million from $47.7 million for the prior year
North American retail line review win a result of investments in innovation and merchandising
Investing in strategic M&A - four acquisitions announced in 2017

12
Consistent Margin Improvement
TRACK RECORD OF CONSISTENT MARGIN IMPROVEMENT
6.1%
9.4%
10.8%
12.0%
2014 2015 2016 2017
9.5%
11.3%
12.7% 12.9%
2014 2015 2016 2017
Q3 Adjusted EBITDA Margins Q3 YTD Adjusted EBITDA Margins

13
Financial ReviewBrooks Mallard, EVP and Chief Financial Officer

14
REVENUE GROWTH ACCELERATES IN Q3; YTD MARGIN IMPROVEMENT ON TRACK
2017 YoY Change 2017 YoY Change
Net Revenues $991.4 6.3% $2,787.9 3.5%
Gross Margin $228.2 11.0% $642.5 12.9%
Gross Margin Percent 23.0% 90 bps 23.0% 190 bps
Net Income $51.3 11.3% $104.5 (12.2%)
EPS – Diluted (1) $0.47 N/A N/A N/A
Adjusted EPS – Diluted (1) $0.55 N/A N/A N/A
Adjusted EBITDA $128.2 8.7% $334.5 14.6%
Adjusted EBITDA Margin 12.9% 20 bps 12.0% 120 bps
Q3 and YTD 2017 Financial SummaryUSD in millions (except for per share items)
Q3 YTD
( 1 ) Y T D f i g u r e s a n d p r i o r p e r i o d c o mp a r i s o n s a r e n o t me a n i n g f u l , a s Q 2 2 0 1 7 wa s t h e f i r s t f u l l q u a r t e r r e f l e c t i n g t h e p o s t - I P O c a p i t a l s t r u c t u r e a n d d i l u t i o n o f t h e I P O t r a n s a c t i o n .

15
Q3 2017Pricing 1% 2% 1% -
Volume/Mix 1% - - 4%
Core Growth 2% 2% 1% 4%
Acquisitions 3% 2% 2% 8%
FX 2% - 4% 4%
Total 6.3% 3.6% 7.4% 15.7%
CORE GROWTH IN ALL 3 REGIONS; FAVORABLE FX IN Q3
Q3 and YTD 2017 Net Revenues Walk
JELD-WEN North America Europe Australasia
YTD 2017Pricing 1% 2% 1% 1%
Volume/Mix 1% (1%) 2% 3%
Core Growth 2% 1% 3% 4%
Acquisitions 2% 1% 1% 8%
FX - - (2%) 3%
Total 3.5% 1.8% 1.9% 14.5%

16
MARGIN EXPANSION LIMITED BY OPERATIONAL INEFFICIENCIES IN WINDOWS
2017 YoY Change 2017 YoY Change
Net Revenues $572.0 3.6% $1,607.7 1.8%
Adjusted EBITDA $82.5 4.8% $212.5 14.1%
Adjusted EBITDA Margin 14.4% 10 bps 13.2% 140 bps
North America Segment PerformanceUSD in millions
Q3 YTD
Wood Windows Vinyl Windows Interior Doors Exterior Doors Wall Systems

17
STRONG REVENUE GROWTH, FX TAILWIND; TEMPORARY MARGIN INEFFICIENCES
2017 YoY Change 2017 YoY Change
Net Revenues $265.1 7.4% $766.3 1.9%
Adjusted EBITDA $33.4 6.2% $97.6 8.0%
Adjusted EBITDA Margin 12.6% (10 bps) 12.7% 70 bps
Europe Segment PerformanceUSD in millions
Q3 YTD
Residential Doors Commercial Doors Fire Resistant Sound Dampening Security Doors
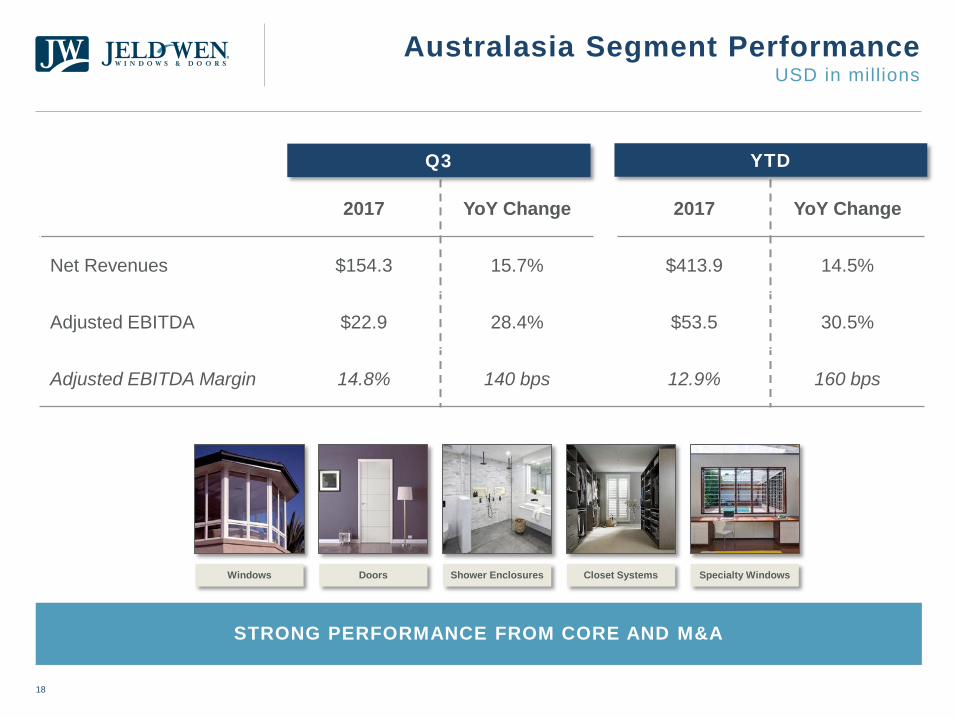
18
STRONG PERFORMANCE FROM CORE AND M&A
2017 YoY Change 2017 YoY Change
Net Revenues $154.3 15.7% $413.9 14.5%
Adjusted EBITDA $22.9 28.4% $53.5 30.5%
Adjusted EBITDA Margin 14.8% 140 bps 12.9% 160 bps
Australasia Segment PerformanceUSD in millions
Q3 YTD
Windows Doors Shower Enclosures Closet Systems Specialty Windows

19
Balance Sheet and Cash FlowUSD in millions
NET LEVERAGE REMAINS AT 2.4x; SIGNIFICANT YOY CASH FLOW IMPROVEMENT
Balance Sheet and Liquidity September 30, 2017 December 31, 2016(1)
Total Debt $1,251.2 $1,620.0
Cash $219.5 $102.7
Total Net Debt $1,031.7 $1,517.3
Net Debt / Adjusted EBITDA 2.4x 3.9x
Liquidity (2) $518.8 $381.9
Cash Flow YTD Q3 2017 YTD Q3 2016
Cash Flow From Operations $174.1 $110.2
Capital Expenditures (3) ($32.4) ($62.5)
Free Cash Flow $141.7 $47.7
( 1 ) D o e s n o t r e f l e c t t h e i mp a c t o f p r o c e e d s r e c e i v e d f r o m i n i t i a l p u b l i c o f f e r i n g s u b s e q u e n t t o y e a r e n d .( 2 ) L i q u i d i t y i n c l u d e s c a s h a n d a v a i l a b i l i t y f r o m u n d r a wn r e v o l v i n g c r e d i t f a c i l i t i e s .( 3 ) I n c l u d e s p u r c h a s e s o f p r o p e r t y , e q u i p me n t , a n d i n t a n g i b l e a s s e t s .

20
Summary and 2017 OutlookMark Beck, President and Chief Executive Officer

21
Net Revenue Growth 2.0% – 4.0%
Adjusted EBITDA $440 – $450
Capital Expenditures $60 – $70
2017 OutlookUSD in millions

22
Appendix

23
Non-GAAP ReconciliationAdjusted EBITDA (USD in millions)
(1) For the nine months ended September 30, 2017, interest expense includes the write-off of $7.0 million of original issue discount and deferred financing fees related to the repayment of debt.
(2) Other non-cash items include: (i) in the three and nine months ended September 30, 2017, charges of $0.4 million for Mattiovi PPA inventory valuation adjustment; and (ii) in the nine months ended September 24, 2016, (1) $2.6 million out-of-period charge for European warranty liability adjustment, and (2) charges of $0.4 million for Trend PPA inventory valuation adjustment.
(3) Other items not core to business activity include: (i) in the three months ended September 30, 2017, (1) $9.1 million in legal costs, (2) $2.7 million in realized loss on hedges (3) $1.4 million in acquisition costs and (4) $0.3 million in secondary offering costs; (ii) in the three months ended September 24, 2016, (1) $2.1 million professional fees related to the IPO process, (2) $0.5 million in acquisition costs and (3) $0.2 million in legal costs associated with disposal of non-core properties in Europe; (iii) in the nine months ended September 30, 2017, (1) $24.9 million in legal costs, (2)$2.7 million in realized loss on hedges, (3) $1.4 million in acquisition costs, (4) $1.3 million secondary offering costs, (5) $0.8 million in legal entity consolidation costs, (6) $0.3 million in IPO costs and (7) $(2.2) million gain on settlement of contract escrow; (iv) in the nine months ended September 24, 2016, (1) $2.4 million of professional fees related to IPO process, (2) $1.5 million in acquisition costs, (3) $0.4 million in Dooria plant closure costs, (4) $0.3 million related to a legal settlement accrual for CMI, and (5) $0.2 million in legal costs associated with disposal of non-core properties in Europe.
(4) Adjusted EBITDA is a financial measure that is not calculated in accordance with GAAP. For a discussion of our presentation of Adjusted EBITDA, see above under the heading “Non-GAAP Financial Information”.
Three Months Ended Nine Months Ended
September
30, 2017 September
24, 2016 September
30, 2017 September
24, 2016 Net income $ 51.3 $ 46.1 $ 104.5 $ 119.0
Income from discontinued operations, net of tax — 2.7 — 2.8 Equity earnings of non-consolidated entities (1.1 ) (1.2 ) (2.6 ) (2.5 Income tax expense (benefit) 13.0 13.5 33.0 (0.1 Depreciation and intangible amortization 27.6 25.5 80.6 77.5 Interest expense, net(1) 17.2 18.5 61.6 53.7 Impairment and restructuring charges 2.3 3.9 4.0 12.1 (Gain) loss on sale of property and equipment (0.1 ) 0.1 (0.2 ) (3.3 Stock-based compensation expense 5.1 5.1 15.8 15.8 Non-cash foreign exchange transaction/translation
(1.8 ) 0.4 5.3 7.2
Other non-cash items(2) 0.5 0.1 0.5 3.1 Other items(3) 14.3 3.3 31.6 6.5 Costs relating to debt restructuring and refinancing — — 0.3 —
Adjusted EBITDA(4) $ 128.2 $ 118.0 $ 334.5 $ 291.9

24
Non-GAAP ReconciliationAdjusted EPS & Free Cash Flow (USD in millions)
Three Months
Ended
(amounts in millions, except share and per share data) September 30, 2017
Net income $ 51.3 Legal and professional fees 7.9 Non-cash foreign exchange transactions/translation loss (1.3 ) Impairment and restructuring charges 1.7
Adjusted net income $ 59.6 Diluted net income per share $ 0.47
Legal and professional fees 0.07 Non-cash foreign exchange transactions/translation loss (0.01 ) Impairment and restructuring charges 0.02
Adjusted net income per share $ 0.55 Diluted shares 108,962,240
NOTE: All adjustments to net income and net income per share are tax-effected at our estimated annual effective tax rate of approximately 26.9%
Nine Months Ended
September 30,
2017 September 24,
2016 Net cash provided by operating activities $ 174.1 $ 110.2 Less capital expenditures 32.4 62.5
Free cash flow $ 141.7 $ 47.7