q3 2013 investor presentation - norbord 2013 investor presentation november 2013 2 • all financial...
TRANSCRIPT

Q3 2013
Investor Presentation
November 2013

2
• All financial references are expressed in US$ unless otherwise noted.
• Financial numbers prior to 2010 were prepared in accordance with CGAAP, while numbers from 2010 onward have been prepared in accordance with IFRS.
• This presentation contains forward-looking statements and estimates.
• Actual company results could differ materially from a conclusion, forecast or projection in the forward-looking information.
• Certain material factors or assumptions were applied in drawing a conclusion or making a forecast or projection as reflected in the forward-looking information.
• Additional information can be found in the Company’s annual information form, annual MD&A, and on Norbord’s website (www.norbord.com) about the material factors that could cause actual results to differ materially from the conclusion, forecast or projection in the forward-looking information, and the material factors or assumptions that were applied in drawing a conclusion or making a forecast or projection as reflected in the forward-looking information.
• During the course of this presentation, certain non-IFRS financial information will be presented. Definitions and reconciliation of terms can be found in the Company’s annual and quarterly MD&A.
Forward-Looking Statements and
Non-IFRS Financial Information

3
Company Snapshot
• Norbord is a leading manufacturer of wood-based panel
products and one of the largest global producers of OSB
─ Installed OSB capacity of over 5 Bsf
─ 1,900 employees at 13 plants across the US, Europe
and Canada
• Listed on TSX (“NBD” and “NBD.WT”)
• Reports in US dollars and in accordance with IFRS
• As at September 28, 2013:
─ Total assets of $1,266 million
─ LTM sales of $1,363 million
─ LTM EBITDA of $328 million
I. COMPANY OVERVIEW
US
61%
Europe
27%
Canada
12%
6.1 Bsf
Panel Capacity by Region

4
Norbord’s Products
• New home construction
• Repair and remodel
• Light commercial construction
• Industrial applications
OSB – 84% of Capacity
Particleboard – 10% of Capacity
MDF – 6% of Capacity
• New home construction
• Repair and remodel
• Furniture
• Fixtures
• Furniture
• Fixtures
• Mill work
• Norbord’s operations include 11 OSB mills, two particleboard mills, one
medium density fibreboard (“MDF”) mill and one furniture plant
I. COMPANY OVERVIEW
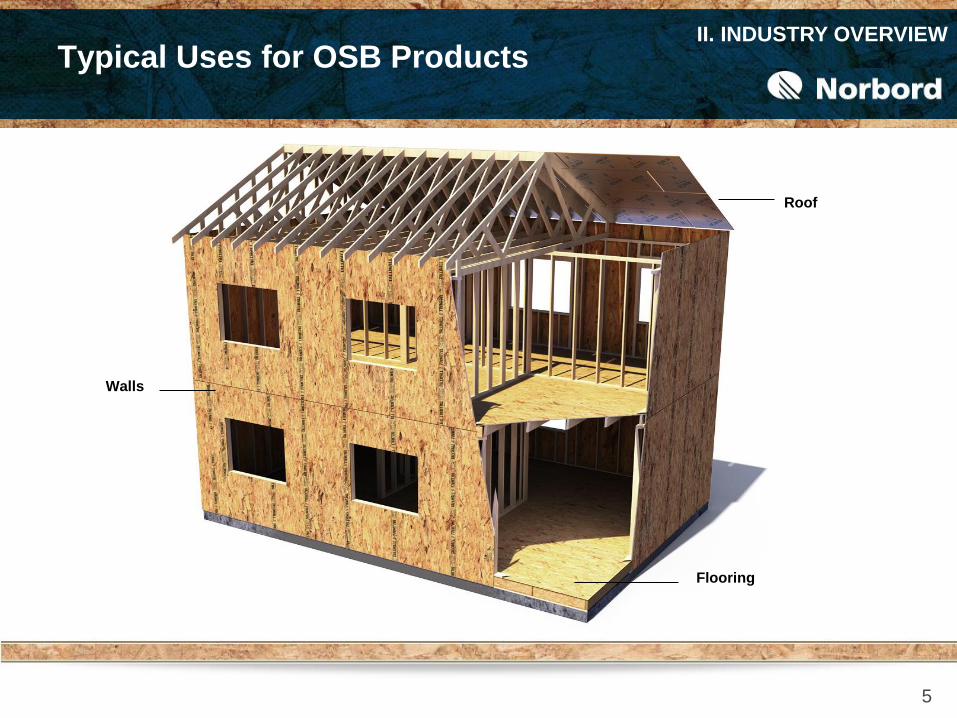
Typical Uses for OSB Products II. INDUSTRY OVERVIEW
5
Walls
Flooring
Roof

6
The OSB Market II. INDUSTRY OVERVIEW
• OSB is an innovative, affordable and environmentally “smart” structural panel
─ Serves many of the same uses as plywood, but produced at a lower cost
• Norbord expects that OSB will continue to capture market share from plywood
Sources: APA-The Engineered Wood Association (“APA”) and Forest Economic Advisors, LLC (“FEA”)
North American Structural Panels Market Share
0%
10%
20%
30%
40%
50%
60%
70%
80%
90%
100%
'80 '85 '90 '95 '00 '05 '10 '15F
% S
hare
of
No
rth
Am
eri
can
Str
uctu
ral
Pan
el P
rod
ucti
on
OSB
Plywood

7
US Housing Starts Recovery is Real
0.0
0.5
1.0
1.5
2.0
Housing Starts
Underlying Demand
US Housing Starts (millions)
Source: FEA
• Leverage to US housing recovery
• Favourable long-term OSB industry fundamentals
OVER
built
UNDER
built
II. INDUSTRY OVERVIEW
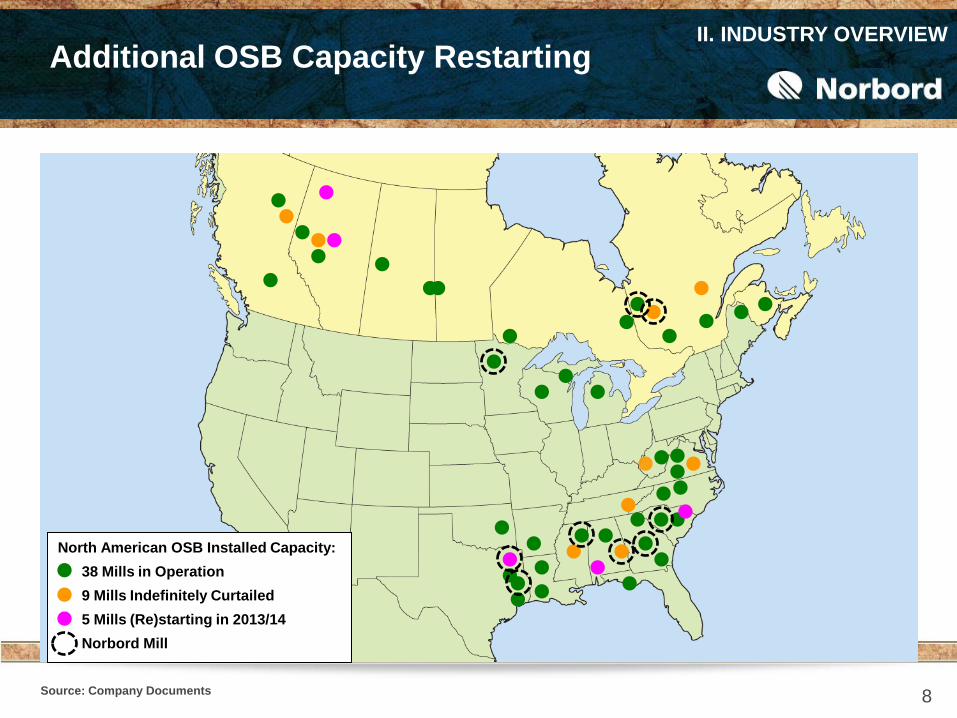
8 Source: Company Documents
II. INDUSTRY OVERVIEW
Additional OSB Capacity Restarting
38 Mills in Operation
9 Mills Indefinitely Curtailed
North American OSB Installed Capacity:
Norbord Mill
5 Mills (Re)starting in 2013/14

9 Source: FEA
II. INDUSTRY OVERVIEW High Demand/Capacity Ratio Supports
Robust Pricing Environment
0%
25%
50%
75%
100%
15
20
25
30
35
00 01 02 03 04 05 06 07 08 09 10 11 12 13 14 15 16 17 18 19
Capacity (Bsf 3/8") Demand/Capacity %
Operating Capacity
Mothballed
Effective Demand/Capacity

10
Attractive OSB Outlook II. INDUSTRY OVERVIEW
Sources: Random Lengths and FEA
• OSB prices are tied to demand for building products, which is influenced by
the general economy, demographics and the need for housing
• With US housing recovering, OSB prices are projected to remain above trend
North Central Benchmark OSB Price
100
150
200
250
300
350
400
2003 2004 2005 2006 2007 2008 2009 2010 2011 2012 2013E 2014E 2015E 2016E
An
nu
al A
vera
ge N
C P
rice
US
$ p
er
Msf
7/1
6"

11
Kronospan
37%
Kronoswiss
21%
Norbord
14%
Sonae
13%
Egger
8%
Smartply
6%
Norbord a Significant Player in
OSB Industry
Louisiana-
Pacific*20%
Georgia-
Pacific17%
Norbord
16%
Weyer-
haeuser14%
Ainsworth*
10%
Huber
7%
Tolko
5%
Other
11%
Source: Company Documents - Installed Capacity
*Louisiana-Pacific announced plans to acquire Ainsworth in September 2013
Industry
Capacity
28 Bsf
Industry
Capacity
5 Bsf
II. INDUSTRY OVERVIEW
North American OSB Industry European OSB Industry

12
Norbord’s Strategy is Well Defined
• Pursue growth in OSB
• Own highest-quality assets with
lowest cost position
• Maintain a margin-focused operating
culture
• Focus on growth customers through
best-in-class service and product
development
• Allocate capital with discipline
III. BUSINESS STRATEGY

13
Norbord’s Growth Focused on OSB
0
1
2
3
4
5
6
'92 '93 '94 '95 '96 '97 '98 '99 '00 '01 '02 '03 '04 '05 '06 '07 '08 '09 '10 '11 '12
Norbord OSB Capacity (Billion Square Feet 3/8”)
III. BUSINESS STRATEGY

-30%
-20%
-10%
0%
10%
20%
30%
40%
50%
2005 2006 2007 2008 2009 2010 2011 2012 LTM
Norbord North American peer (1)
14
-30%-20%-10%0%10%20%30%40%50%
2005 2006 2007 2008 2009 2010 2011 2012
Norbord North American peer (1)
Low Cost Margin-Focused
Operating Platform
• Low cost operating platform providing superior margins versus peers
Source: Company Documents
(1) North American peer = Louisiana-Pacific
III. BUSINESS STRATEGY
North American OSB EBITDA Margin %

15
35 37
28
56
914
29
16
25 23
$0
$10
$20
$30
$40
$50
$60
2003 2004 2005 2006 2007 2008 2009 2010 2011 2012
Margin Improvement is an
Operational Priority
• Margin Improvement Program
(MIP) gains help offset impact of
industry-wide rising input costs,
without capex investment:
─ Increased productivity
─ Reduced overhead costs
─ Reduced raw material usage
─ Improved product mix
III. BUSINESS STRATEGY
MIP Gains (US$ millions)

16
Customer Strategy Sets Norbord Apart
• New housing sales volume growing as US housing starts recover
• Pro-dealer shipments now represent 50% of Norbord sales volume
50%
30%
20%
35%
35%
30%New Home
Construction
(Pro-dealers)
Repair & Remodel
(Big Box)
Industrial
NA
Shipments
2.9 Bsf
NA
Shipments
3.5 Bsf
III. BUSINESS STRATEGY
2011 Q3 2013 (annualized)

17
Disciplined Capital Allocation
• Track record of disciplined capital
allocation
─ Accretive acquisitions
─ Low cost capacity additions
─ Divestment of non-core assets
─ Deleverage on cyclical upturns
─ Dividends
─ Share buybacks
$0
$20
$40
$60
$80
$100
$120
$140
$160
$180
2003 2004 2005 2006 2007 2008 2009 2010 2011 2012 2013F
Capex Greenfield Expansion
III. BUSINESS STRATEGY
Capex Investment (US$ millions)

18
Strong Operating Cash Flow
Through Cycle
365
631
495
247
42
(60)
0
107
45
188
328
($100)
$0
$100
$200
$300
$400
$500
$600
$700
2003 2004 2005 2006 2007 2008 2009 2010 2011 2012 LTM
10yr Average
$206 million
North Central
Benchmark OSB Price 293 369 320 217 161 172 163 219 186 271 337
Norbord Sensitivity to North American
OSB Price Changes:
+$10/Msf 7/16” = +$36 million EBITDA
(at full capacity)
Total EBITDA (US$ millions)
IV. FINANCIAL OVERVIEW

19
Stable Results Continue from
European Operations
• Norbord’s European operations provide greater sales and earnings
diversification than other North American-based competitors
29
58
32 35
81
4
17
3744
3943
$0
$10
$20
$30
$40
$50
$60
$70
$80
$90
2003 2004 2005 2006 2007 2008 2009 2010 2011 2012 LTM
IV. FINANCIAL OVERVIEW
European EBITDA (US$ millions)

20
245
200
240
0
50
100
150
200
250
300
2014 2015 2016 2017
Pri
nc
ipa
l V
alu
e -
US
$ m
illio
ns
6.25%
Bonds
Revolving
Bank Lines
(Undrawn) 7.70%
Bonds
Strong Liquidity
US$ millions Q3 2013
Cash 239
Bank Lines 241
A/R Sec. (1) 100
Liquidity
580
(1) In addition, the Company has an undrawn $100 million 1-year evergreen A/R securitization program.
DBRS BB
Moody’s Ba3
S&P BB-
Norbord’s Financial House Is In Order IV. FINANCIAL OVERVIEW
Manageable Debt Maturities (1) Strong Liquidity
Stable Issuer Credit Ratings

21
Attractive Investment Opportunity
• Leverage to accelerating US housing recovery
─ Every +$10 in OSB price = +$36 million in EBITDA at full capacity
• Low-cost operating platform
• Superior margins versus peers
• Track record of disciplined capital allocation
• Well positioned for recovery
─ Strong customer partnerships
─ Diversification from European operations
─ Strong financial liquidity and comfortable debt maturities
─ Improving OSB demand requires more North American capacity
V. SUMMARY

22
Appendices

Ticker Symbol TSX: NBD, NBD.WT
Common Shares 53.3 million outstanding
Warrants 1.2 million outstanding; expire December 24, 2013 (to purchase 0.1 million Common Shares, on a cash exercise basis)
Cash Exercise:
(10 Warrants + CAD $13.60) = 1 Common Share
OR Cashless Exercise:
(# Warrants / 10 * (Market Price(1) – Exercise Price)) /
Market Price(1) = # Common Shares
Quarterly Dividend CAD $0.60 per share (payable on Dec. 21, 2013 to shareholders of record on Dec. 1, 2013)
Majority Shareholder Brookfield Asset Management – 53%
Capital Structure (as at October 31, 2013)
(1) Market Price = volume weighted average trading price (“VWAP”) on the TSX for the five trading days immediately preceding the Exercise Date 23

24
0
50
100
150
200
250
300
350
400
1998 1999 2000 2001 2002 2003 2004 2005 2006 2007 2008 2009 2010 2011 2012 2013
An
nu
al A
vera
ge N
C P
rice
US
$ p
er
Msf
7/1
6"
Source: Random Lengths
Q1 157 217 261 132 163 175 423 364 285 145 137 154 212 198 203 417
Q2 195 291 240 190 159 215 443 297 238 156 179 146 295 173 235 347
Q3 287 301 171 180 159 381 351 303 181 177 201 178 180 184 313 252
Q4 178 230 155 140 156 401 264 317 166 165 170 172 191 190 332
Average 204 260 207 160 159 293 369 320 217 161 172 163 219 186 271
15 year Average
OSB Prices Strong Over the Cycle
Historical North Central Benchmark OSB Price

25
(1) Assumes operation at full capacity levels
Before the impact of any cash flow currency hedges
Tax operating loss carry-forwards (gross) as at Dec. 31, 2012 – US $145 million, Canada C$85 million,
Belgium €38 million
Exposure Change
EBITDA
Impact (1)
($ millions)
North American OSB $10 per Msf 7/16” + $36
European OSB €10 per m3 + $7
Canadian dollar $0.01 per Cdn$ + $1
Pound sterling £0.01 per € + $2
Financial Sensitivities

26
Analyst Analyst Name Contact
BMO Capital Markets Stephen Atkinson (514) 286-7309 [email protected]
CIBC Mark Kennedy (403) 221-4133 [email protected]
Credit Suisse Andrew Kuske (416) 352-4561 [email protected]
Desjardins Securities Pierre Lacroix (514) 281-4231 [email protected]
ERA Forest Products
Research Claire Huxtable (604) 886-5741 [email protected]
John Tumazos Very
Independent Research John Tumazos (732) 444-1083 [email protected]
Raymond James Daryl Swetlishoff (604) 659-8246 [email protected]
RBC Capital Markets Paul Quinn (604) 257-7048 [email protected]
Salman Partners Rajiv Mukhi (604) 622-5289 [email protected]
Scotia Capital Benoit Laprade (514) 287-3627 [email protected]
TD Securities Sean Steuart (416) 308-3399 [email protected]
Vertical Research Partners James Armstrong (212) 256-6157 [email protected]
Analyst Coverage of Norbord

27
• Norbord does not provide guidance regarding its expectations of future OSB prices. The following is a
sample of price forecasts by analysts as at November 7, 2013. It is not exhaustive.
Annual Average
North Central Benchmark OSB Price US$ per Msf 7/16” 2013 2014
BMO 320 255
CIBC 324 325
Desjardins Securities 319 278
ERA Forest Products Research 349 246
Raymond James 320 300
RBC Capital Markets 320 300
Salman Partners 325 300
Scotia Capital 322 300
TD Securities 320 290
Vertical Research Partners 340 365
Average $326 $296
Forecast OSB Pricing – North Central 7/16”