q3 2012 global digital advertising update · adobe igital nde reort 2 q3 2012 global digital...
TRANSCRIPT
Q3 2012 Global Digital Advertising Update
Adobe® Digital Index
2Adobe Digital Index Report
Q3 2012 Global Digital Advertising Update
Executive summarySocial engagement and paid search continued to grow in Q3. In search marketing, spend grew by double digits across geographies and ROI improved due to dollars shifting from offline to digital marketing. Bing/Yahoo’s share of click volume fell, while Google shifted up slightly from Q2.
Engagement, which is defined as likes, comments, and shares, grew 896% YOY, as shown in Figure 9. Mobile users account for nearly one quarter of all Facebook engagement up four-fold from the period prior. We surmise that increased engagement rates result from format changes made in the last three quarters, use of new acquisition and engagement metrics, and more effective social marketing by brands.
The cost per click (CPC) downward trend caused by mobile traffic appears to have bottomed out and is projected to rise in Q4 due to seasonal trends and changes to the Google Shopping model.
A comparison of iOS and Android™ traffic reveals a monetization advantage for iOS of nearly two times that of Android traffic.
For digital marketers and advertisers, these findings have four implications:
• Social engagement is booming. The increase in engagement levels indicates that Facebook is becoming a more valuable advertising marketing channel than in the past. Marketers should capitalize on this trend to include more social marketing in their digital marketing initiatives.
• Search, especially on mobile devices, should continue to be a major part of the marketing mix given growth in mobile device use and attractive ROI.
• Marketers can drive higher returns by optimizing spend across devices. Search spend for iOS devices offers attractive opportunities.
• Retailers need to account for additional spending on Google Shopping because that free service has transitioned to a paid model.1
Table of contents2: Executive summary3: Overall search trends5: Search by device type5: Facebook update6: Forecast for Q4 2012–
Q1 20136: Implications6: Methodology7: Definitions7: Appendix7: About Adobe Digital
Index 7: About Adobe Digital
Marketing Suite

3Adobe Digital Index Report
Overall search trendsIn Q3 2012, search continued to grow in the U.S., U.K., and Germany. Growth continued in these countries despite economic uncertainty, demonstrating the stability and importance of search for digital marketers. Increases in ROI continue to drive this growth trend. As in Q2 2012, healthy room for additional growth in spending exists.2 Additionally, increased traffic across mobile devices shifted search spend to smartphones and tablets, changing CPCs, especially for Google.
Spend and ROI—Figures 1 and 2 show that U.S. search spend grew 11% over the prior year, while ROI improved by 26%. Search spend in the U.K. and Germany grew 36% and 25% year over year (YoY), respectively. Spend share for Google and Bing/Yahoo! were roughly flat over the prior quarter. Bing/Yahoo! increased share 1% YoY, while Google’s share declined 1% (see Appendix Table 1).
Automobile [U.S.]
Q3/11 Q4/11 Q1/12 Q2/12 Q3/12
100%
Spend up 15% YoY
ROI up 21% YoY
Retail [U.S.]
Q3/11 Q4/11 Q1/12 Q2/12 Q3/12
100%
ROI up 13% YoY
Spend up 9% YoY
Financial Services [U.S.]
Q3/11 Q4/11 Q1/12 Q2/12 Q3/12
100%
ROI up 50% YoY
Spend up 10% YoY
Q3/11 Q4/11 Q1/12 Q2/12 Q3/12
100%
Bing/Yahoo up 6% YoY
Google down 10% YoY
Q3/11 Q4/11 Q1/12 Q2/12 Q3/12
100%
Clicks up 22% YoY
CPC up 10% YoY
Q3/11 Q4/11 Q1/12 Q2/12 Q3/12
100%
Clicks up 7% YoY
CPC up 14% YoY
Q3/11 Q4/11 Q1/12 Q2/12 Q3/12
100%
Germany up 25% YoY
U.K. up 36% YoY
U.S. up 11% YoY
Q3/11 Q4/11 Q1/12 Q2/12 Q3/12
Indexed at 100%
U.K. down8% YoY
Germanydown 17% YoY
U.S. up 26% YoY
Q3/11 Q4/11 Q1/12 Q2/12 Q3/12
100%
Google up 21% YoY
Bing/Yahoo up 11% YoY
Bing/Yahoo Google
Q42011
Q32011
81.8% 83.5%
Q32012
Q22012
81.5% 83.0%
18.2%
18.5%
16.5%
17.0%
Q12012
83.1%16.9%
100% 284% 649%
Q3 2011
Q3 2012
91%
Q1 2012
996%
Android = 100%
CPC
CTR
ROI
CVR
0 100 200
200%
165%UK / Germany
Other
USA
0 100 200
181%
193%Finance
Travel
Other
Retail
0 100 200
199%
Android = 100%
Android = 100%
Facebook, January 2012 - September 2012
Jan Feb Mar Apr May Jun Jul Aug Sept
5% 5% 5% 5%
8%
15%
19%
23% 24%
Increase four-foldfrom the periodprior to the timeline format change.
Figure 1—Overall spend by country Figure 2—Overall ROI by country
Click volume and CPC—Click volume on Google recovered compared with the prior quarter, reaching a new high with a four-quarter rolling average up 21% YoY, as shown in Figure 3. Bing/Yahoo’s increase in click volume, which had surged between Quarters 1 and 2, was short-lived, falling 14% to end at an 11% increase YoY. Due to growth in mobile search traffic where CPCs are cheaper and Google is more dominant, U.S. click share for Bing/Yahoo gave back some prior quarter gains, standing at 17% share, as shown in Figure 4.
Automobile [U.S.]
Q3/11 Q4/11 Q1/12 Q2/12 Q3/12
100%
Spend up 15% YoY
ROI up 21% YoY
Retail [U.S.]
Q3/11 Q4/11 Q1/12 Q2/12 Q3/12
100%
ROI up 13% YoY
Spend up 9% YoY
Financial Services [U.S.]
Q3/11 Q4/11 Q1/12 Q2/12 Q3/12
100%
ROI up 50% YoY
Spend up 10% YoY
Q3/11 Q4/11 Q1/12 Q2/12 Q3/12
100%
Bing/Yahoo up 6% YoY
Google down 10% YoY
Q3/11 Q4/11 Q1/12 Q2/12 Q3/12
100%
Clicks up 22% YoY
CPC up 10% YoY
Q3/11 Q4/11 Q1/12 Q2/12 Q3/12
100%
Clicks up 7% YoY
CPC up 14% YoY
Q3/11 Q4/11 Q1/12 Q2/12 Q3/12
100%
Germany up 25% YoY
U.K. up 36% YoY
U.S. up 11% YoY
Q3/11 Q4/11 Q1/12 Q2/12 Q3/12
Indexed at 100%
U.K. down8% YoY
Germanydown 17% YoY
U.S. up 26% YoY
Q3/11 Q4/11 Q1/12 Q2/12 Q3/12
100%
Google up 21% YoY
Bing/Yahoo up 11% YoY
Bing/Yahoo Google
Q42011
Q32011
81.8% 83.5%
Q32012
Q22012
81.5% 83.0%
18.2%
18.5%
16.5%
17.0%
Q12012
83.1%16.9%
100% 284% 649%
Q3 2011
Q3 2012
91%
Q1 2012
996%
Android = 100%
CPC
CTR
ROI
CVR
0 100 200
200%
165%UK / Germany
Other
USA
0 100 200
181%
193%Finance
Travel
Other
Retail
0 100 200
199%
Android = 100%
Android = 100%
Facebook, January 2012 - September 2012
Jan Feb Mar Apr May Jun Jul Aug Sept
5% 5% 5% 5%
8%
15%
19%
23% 24%
Increase four-foldfrom the periodprior to the timeline format change.
Figure 3—Click volume by search engines, U.S. Figure 4—Click share by search engines, U.S.

4Adobe Digital Index Report
Figure 5 shows CPCs on Google recovering slightly but still down 10 percentage points YoY, while Bing/Yahoo CPCs rebounded from the prior quarter to end up 6%. We attribute the decrease in overall Google CPCs to an increase in share of mobile clicks, where CPCs are less expensive. The increase in Bing/Yahoo CPCs may be attributed to a recovery in the finance sector, where CPCs improved considerably over the prior quarter. Because CPCs in the financial sector tend to be much higher than average, fluctuations in CPCs typically have a significant impact on the CPC average for the overall index.
The European search market is robust, likely as a result of offline marketing spend seeking more measureable results via search. Figure 6 shows that, in the U.K., click volume is up sharply from Q2 and increased 22% YoY, and CPCs also edged up 4% for the quarter, increasing 10% YoY. Germany click volume decreased eight percentage points over the second quarter for growth of 7% YoY, while CPCs remained flat from the second quarter for a 14% YoY improvement.
Automobile [U.S.]
Q3/11 Q4/11 Q1/12 Q2/12 Q3/12
100%
Spend up 15% YoY
ROI up 21% YoY
Retail [U.S.]
Q3/11 Q4/11 Q1/12 Q2/12 Q3/12
100%
ROI up 13% YoY
Spend up 9% YoY
Financial Services [U.S.]
Q3/11 Q4/11 Q1/12 Q2/12 Q3/12
100%
ROI up 50% YoY
Spend up 10% YoY
Q3/11 Q4/11 Q1/12 Q2/12 Q3/12
100%
Bing/Yahoo up 6% YoY
Google down 10% YoY
Q3/11 Q4/11 Q1/12 Q2/12 Q3/12
100%
Clicks up 22% YoY
CPC up 10% YoY
Q3/11 Q4/11 Q1/12 Q2/12 Q3/12
100%
Clicks up 7% YoY
CPC up 14% YoY
Q3/11 Q4/11 Q1/12 Q2/12 Q3/12
100%
Germany up 25% YoY
U.K. up 36% YoY
U.S. up 11% YoY
Q3/11 Q4/11 Q1/12 Q2/12 Q3/12
Indexed at 100%
U.K. down8% YoY
Germanydown 17% YoY
U.S. up 26% YoY
Q3/11 Q4/11 Q1/12 Q2/12 Q3/12
100%
Google up 21% YoY
Bing/Yahoo up 11% YoY
Bing/Yahoo Google
Q42011
Q32011
81.8% 83.5%
Q32012
Q22012
81.5% 83.0%
18.2%
18.5%
16.5%
17.0%
Q12012
83.1%16.9%
100% 284% 649%
Q3 2011
Q3 2012
91%
Q1 2012
996%
Android = 100%
CPC
CTR
ROI
CVR
0 100 200
200%
165%UK / Germany
Other
USA
0 100 200
181%
193%Finance
Travel
Other
Retail
0 100 200
199%
Android = 100%
Android = 100%
Facebook, January 2012 - September 2012
Jan Feb Mar Apr May Jun Jul Aug Sept
5% 5% 5% 5%
8%
15%
19%
23% 24%
Increase four-foldfrom the periodprior to the timeline format change.
Figure 5—CPC, U.S. Figure 6—Click volume and CPC, U.K. and Germany
Industry breakdown—Figure 7 shows performance trends for the automobile, financial services, and retail industries in the United States. The auto industry saw a robust increase in spend and ROI, up 15% and 21% respectively YoY, while maintaining flat CPC, consistent with broader recovery in this industry. The financial services industry, which saw a steep decline in CPC in Q2, bounced up turning CPC levels back to historical norms by increasing spend at 10% YoY and ROI at 50% YoY. The retail sector headed into its run up to the holiday season with spend and ROI increasing by 3% quarter over quarter. Retail CPC continued a downward trend ending up 9% down YoY, perhaps, in part, due to the increased use of mobile search. Overall, the search market is poised to carry improvements in all sectors into the fourth quarter.
Automobile [U.S.]
Q3/11 Q4/11 Q1/12 Q2/12 Q3/12
100%
Spend up 15% YoY
ROI up 21% YoY
Retail [U.S.]
Q3/11 Q4/11 Q1/12 Q2/12 Q3/12
100%
ROI up 13% YoY
Spend up 9% YoY
Financial Services [U.S.]
Q3/11 Q4/11 Q1/12 Q2/12 Q3/12
100%
ROI up 50% YoY
Spend up 10% YoY
Q3/11 Q4/11 Q1/12 Q2/12 Q3/12
100%
Bing/Yahoo up 6% YoY
Google down 10% YoY
Q3/11 Q4/11 Q1/12 Q2/12 Q3/12
100%
Clicks up 22% YoY
CPC up 10% YoY
Q3/11 Q4/11 Q1/12 Q2/12 Q3/12
100%
Clicks up 7% YoY
CPC up 14% YoY
Q3/11 Q4/11 Q1/12 Q2/12 Q3/12
100%
Germany up 25% YoY
U.K. up 36% YoY
U.S. up 11% YoY
Q3/11 Q4/11 Q1/12 Q2/12 Q3/12
Indexed at 100%
U.K. down8% YoY
Germanydown 17% YoY
U.S. up 26% YoY
Q3/11 Q4/11 Q1/12 Q2/12 Q3/12
100%
Google up 21% YoY
Bing/Yahoo up 11% YoY
Bing/Yahoo Google
Q42011
Q32011
81.8% 83.5%
Q32012
Q22012
81.5% 83.0%
18.2%
18.5%
16.5%
17.0%
Q12012
83.1%16.9%
100% 284% 649%
Q3 2011
Q3 2012
91%
Q1 2012
996%
Android = 100%
CPC
CTR
ROI
CVR
0 100 200
200%
165%UK / Germany
Other
USA
0 100 200
181%
193%Finance
Travel
Other
Retail
0 100 200
199%
Android = 100%
Android = 100%
Facebook, January 2012 - September 2012
Jan Feb Mar Apr May Jun Jul Aug Sept
5% 5% 5% 5%
8%
15%
19%
23% 24%
Increase four-foldfrom the periodprior to the timeline format change.
Figure 7—Spend and ROI by industry

5Adobe Digital Index Report
Search by mobile operating systemWhile overall search spend increased YoY across PC, smartphone, and tablet device types, conversion rates, CPCs, and ROI for these devices varied widely. Conversion rates by mobile operating system are increasing in importance as mobile search traffic continues to rise. This indicates that marketers have significant opportunities to drive higher ROI by optimizing mobile search spend by device OS, findings consistent with those in prior Adobe Digital Index reports on the use of mobile devices and returns on mobile search spend.3
Conversion rates relative to device OS by geo and industry—Figure 8 shows that across industries, overall iOS conversion rates were nearly double those of Android. Likewise, across geographies, iOS conversion rates were significantly higher across the board, with overall conversion rates up to 93% higher than Android conversion rates. Higher conversion when matched with an 18% lower CPC give iOS search traffic a huge edge in ROI with two times the ROI of Android search traffic.
Automobile [U.S.]
Q3/11 Q4/11 Q1/12 Q2/12 Q3/12
100%
Spend up 15% YoY
ROI up 21% YoY
Retail [U.S.]
Q3/11 Q4/11 Q1/12 Q2/12 Q3/12
100%
ROI up 13% YoY
Spend up 9% YoY
Financial Services [U.S.]
Q3/11 Q4/11 Q1/12 Q2/12 Q3/12
100%
ROI up 50% YoY
Spend up 10% YoY
Q3/11 Q4/11 Q1/12 Q2/12 Q3/12
100%
Bing/Yahoo up 6% YoY
Google down 10% YoY
Q3/11 Q4/11 Q1/12 Q2/12 Q3/12
100%
Clicks up 22% YoY
CPC up 10% YoY
Q3/11 Q4/11 Q1/12 Q2/12 Q3/12
100%
Clicks up 7% YoY
CPC up 14% YoY
Q3/11 Q4/11 Q1/12 Q2/12 Q3/12
100%
Germany up 25% YoY
U.K. up 36% YoY
U.S. up 11% YoY
Q3/11 Q4/11 Q1/12 Q2/12 Q3/12
Indexed at 100%
U.K. down8% YoY
Germanydown 17% YoY
U.S. up 26% YoY
Q3/11 Q4/11 Q1/12 Q2/12 Q3/12
100%
Google up 21% YoY
Bing/Yahoo up 11% YoY
Bing/Yahoo Google
Q42011
Q32011
81.8% 83.5%
Q32012
Q22012
81.5% 83.0%
18.2%
18.5%
16.5%
17.0%
Q12012
83.1%16.9%
100% 284% 649%
Q3 2011
Q3 2012
91%
Q1 2012
996%
Android = 100%
CPC
CTR
ROI
CVR
0 100 200
200%
165%UK / Germany
Other
USA
0 100 200
181%
193%Finance
Travel
Other
Retail
0 100 200
199%
Android = 100%
Android = 100%
Facebook, January 2012 - September 2012
Jan Feb Mar Apr May Jun Jul Aug Sept
5% 5% 5% 5%
8%
15%
19%
23% 24%
Increase four-foldfrom the periodprior to the timeline format change.
Figure 8—Conversion rates by device OS, geography and industry
Facebook updateBrands continued to invest in Facebook to drive fan growth, and Facebook continued to show significant increases in engagement. Engagement, which is defined as likes, comments, and shares, grew 896% YOY, as shown in Figure 9. We surmise that increased engagement rates result from platform changes (Timeline) made in the last three quarters, use of new acquisition and engagement metrics, and more effective social marketing by brands. Increases in engagement levels in future quarters would indicate that Facebook is becoming a more valuable advertising marketing channel than in the past.
Automobile [U.S.]
Q3/11 Q4/11 Q1/12 Q2/12 Q3/12
100%
Spend up 15% YoY
ROI up 21% YoY
Retail [U.S.]
Q3/11 Q4/11 Q1/12 Q2/12 Q3/12
100%
ROI up 13% YoY
Spend up 9% YoY
Financial Services [U.S.]
Q3/11 Q4/11 Q1/12 Q2/12 Q3/12
100%
ROI up 50% YoY
Spend up 10% YoY
Q3/11 Q4/11 Q1/12 Q2/12 Q3/12
100%
Bing/Yahoo up 6% YoY
Google down 10% YoY
Q3/11 Q4/11 Q1/12 Q2/12 Q3/12
100%
Clicks up 22% YoY
CPC up 10% YoY
Q3/11 Q4/11 Q1/12 Q2/12 Q3/12
100%
Clicks up 7% YoY
CPC up 14% YoY
Q3/11 Q4/11 Q1/12 Q2/12 Q3/12
100%
Germany up 25% YoY
U.K. up 36% YoY
U.S. up 11% YoY
Q3/11 Q4/11 Q1/12 Q2/12 Q3/12
Indexed at 100%
U.K. down8% YoY
Germanydown 17% YoY
U.S. up 26% YoY
Q3/11 Q4/11 Q1/12 Q2/12 Q3/12
100%
Google up 21% YoY
Bing/Yahoo up 11% YoY
Bing/Yahoo Google
Q42011
Q32011
81.8% 83.5%
Q32012
Q22012
81.5% 83.0%
18.2%
18.5%
16.5%
17.0%
Q12012
83.1%16.9%
100% 284% 649%
Q3 2011
Q3 2012
91%
Q1 2012
996%
Android = 100%
CPC
CTR
ROI
CVR
0 100 200
200%
165%UK / Germany
Other
USA
0 100 200
181%
193%Finance
Travel
Other
Retail
0 100 200
199%
Android = 100%
Android = 100%
Facebook, January 2012 - September 2012
Jan Feb Mar Apr May Jun Jul Aug Sept
5% 5% 5% 5%
8%
15%
19%
23% 24%
Increase four-foldfrom the periodprior to the timeline format change.
Figure 9—Average brand post engagement
6Adobe Digital Index Report
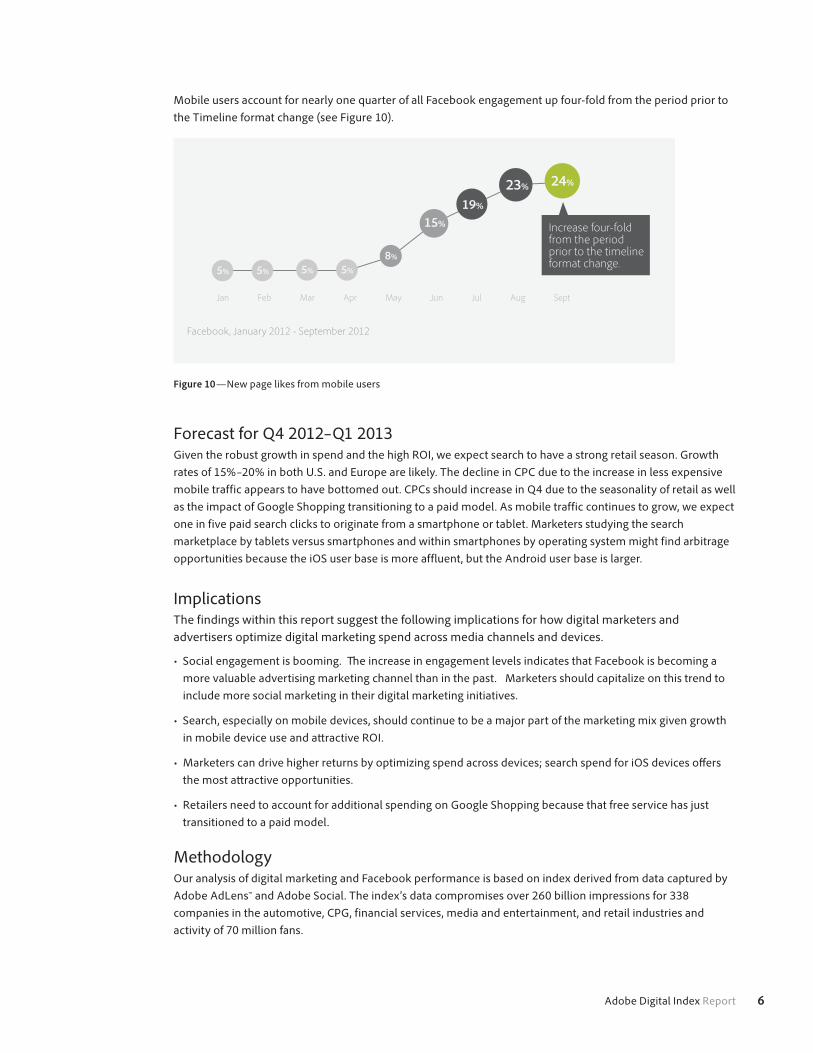
Mobile users account for nearly one quarter of all Facebook engagement up four-fold from the period prior to the Timeline format change (see Figure 10).
Automobile [U.S.]
Q3/11 Q4/11 Q1/12 Q2/12 Q3/12
100%
Spend up 15% YoY
ROI up 21% YoY
Retail [U.S.]
Q3/11 Q4/11 Q1/12 Q2/12 Q3/12
100%
ROI up 13% YoY
Spend up 9% YoY
Financial Services [U.S.]
Q3/11 Q4/11 Q1/12 Q2/12 Q3/12
100%
ROI up 50% YoY
Spend up 10% YoY
Q3/11 Q4/11 Q1/12 Q2/12 Q3/12
100%
Bing/Yahoo up 6% YoY
Google down 10% YoY
Q3/11 Q4/11 Q1/12 Q2/12 Q3/12
100%
Clicks up 22% YoY
CPC up 10% YoY
Q3/11 Q4/11 Q1/12 Q2/12 Q3/12
100%
Clicks up 7% YoY
CPC up 14% YoY
Q3/11 Q4/11 Q1/12 Q2/12 Q3/12
100%
Germany up 25% YoY
U.K. up 36% YoY
U.S. up 11% YoY
Q3/11 Q4/11 Q1/12 Q2/12 Q3/12
Indexed at 100%
U.K. down8% YoY
Germanydown 17% YoY
U.S. up 26% YoY
Q3/11 Q4/11 Q1/12 Q2/12 Q3/12
100%
Google up 21% YoY
Bing/Yahoo up 11% YoY
Bing/Yahoo Google
Q42011
Q32011
81.8% 83.5%
Q32012
Q22012
81.5% 83.0%
18.2%
18.5%
16.5%
17.0%
Q12012
83.1%16.9%
100% 284% 649%
Q3 2011
Q3 2012
91%
Q1 2012
996%
Android = 100%
CPC
CTR
ROI
CVR
0 100 200
200%
165%UK / Germany
Other
USA
0 100 200
181%
193%Finance
Travel
Other
Retail
0 100 200
199%
Android = 100%
Android = 100%
Facebook, January 2012 - September 2012
Jan Feb Mar Apr May Jun Jul Aug Sept
5% 5% 5% 5%
8%
15%
19%
23% 24%
Increase four-foldfrom the periodprior to the timeline format change.
Figure 10—New page likes from mobile users
Forecast for Q4 2012–Q1 2013Given the robust growth in spend and the high ROI, we expect search to have a strong retail season. Growth rates of 15%–20% in both U.S. and Europe are likely. The decline in CPC due to the increase in less expensive mobile traffic appears to have bottomed out. CPCs should increase in Q4 due to the seasonality of retail as well as the impact of Google Shopping transitioning to a paid model. As mobile traffic continues to grow, we expect one in five paid search clicks to originate from a smartphone or tablet. Marketers studying the search marketplace by tablets versus smartphones and within smartphones by operating system might find arbitrage opportunities because the iOS user base is more affluent, but the Android user base is larger.
ImplicationsThe findings within this report suggest the following implications for how digital marketers and advertisers optimize digital marketing spend across media channels and devices.
• Social engagement is booming. The increase in engagement levels indicates that Facebook is becoming a more valuable advertising marketing channel than in the past. Marketers should capitalize on this trend to include more social marketing in their digital marketing initiatives.
• Search, especially on mobile devices, should continue to be a major part of the marketing mix given growth in mobile device use and attractive ROI.
• Marketers can drive higher returns by optimizing spend across devices; search spend for iOS devices offers the most attractive opportunities.
• Retailers need to account for additional spending on Google Shopping because that free service has just transitioned to a paid model.
MethodologyOur analysis of digital marketing and Facebook performance is based on index derived from data captured by Adobe AdLens™ and Adobe Social. The index’s data compromises over 260 billion impressions for 338 companies in the automotive, CPG, financial services, media and entertainment, and retail industries and activity of 70 million fans.

Adobe Systems Incorporated 345 Park Avenue San Jose, CA 95110-2704 USA www.adobe.com
Adobe, Adobe logo, and Adobe AdLens are either registered trademarks or trademarks of Adobe Systems Incorporated in the United States and/or other countries. iOS is a trademark of Apple Computer, Inc. Android is a trademark of Google, Inc. All other trademarks are the property of their respective owners.
© 2012 Adobe Systems Incorporated. All rights reserved. Printed in the USA.
10/12
DefinitionsKey terms in this report are defined as follows:
• Cost per click (CPC)—The amount paid by a marketer per user click on a paid search ad. CPC is determined by an auctioning process and is a good indicator of market conditions. Increases in CPC indicate advertisers are willing to spend more on advertising, and decreases indicate that advertisers are willing to spend less.
• Return on investment (ROI)—A measure of profitability based on how much a marketer receives in terms of results compared with how much is invested. It is also known as a measure of efficiency.
• Spend share—A measure of profitability based on how much a marketer receives in terms of results compared with how much is invested. It is also known as a measure of efficiency.
Appendix
Table 1: Spend Share by Search Engine, US
Quarter Q2 ’11 Q3’11 Q4 ’11 Q1 ‘12 Q2 ’12 Q3 ‘12
Bing/Yahoo! 19.1 18.7 18.9 20.4 20.1 20.4
Google 80.9 81.3 81.1 79.6 79.9 79.6
About Adobe Digital Index Adobe Digital Index publishes research on digital marketing and other topics of interest to senior marketing and e-commerce executives across industries. Research is based on the analysis of select, anonymous, and aggregated data from over 5,000 companies worldwide that use the Adobe Digital Marketing Suite, powered by Adobe technology and solutions, to obtain actionable data and analysis of activity on their websites.
This report was prepared by Kohki Yamaguchi, Sara Miller, Sid Shah, and Tamara Gaffney of Adobe Systems Incorporated. For additional information about this report, contact Adobe Digital Index, at [email protected]. Access more reports like this one for free at www.adobe.com/solutions/digital-marketing/digital-index.html.
1 http://googlecommerce.blogspot.com/2012/10/google-shopping-transition-update-and.html/2 “Global Digital Advertising Update Q2 2012,” Adobe Digital Index, July 20123 See “The Impact of Tablet Visitors on Retail Websites,” January 2012; “Global Digital Advertising Update Q1 2012,” April 2012; and “How Tablets Are Catalyzing Brand Website Engagement,” May 2012