q2fy22: steady momentum
TRANSCRIPT

Edelweiss Research is also available on www.edelweissresearch.com, Bloomberg - EDEL, Thomson Reuters, and Factset Edelweiss Securities Limited
Q2FY22: Steady momentum
We estimate revenue/EBITDA of our coverage universe would grow 19.2%/14.3% on a two-year basis (Q2FY22 versus Q2FY20) compared with 11.2% growth/a 2.9% dip for Q1FY22 (Q1FY22 versus Q1FY20).
In Q2FY22, rural demand remained resilient while urban demand, including modern trade, is starting to recover. Discretionary and out-
of-home segments are showing a good pickup, but it is not yet back to 2019 levels, while the health & hygiene segment is likely to slow down. We expect margin pressure for most companies, and expect demand sentiment to improve in Q3FY22 on the back of festive demand.
Bizom data suggests strong growth but we disagree
According to Bizom, FMCG industry sales grew ~30%/44%/60% YoY in Sep/Aug/Jul-
21. However, we expect our coverage universe to see relatively modest growth, and
estimate average volume growth at 8.5% YoY for Q2FY22 (base 1.8%). September
salaried jobs data is the best since Feb-20, which ties up with recovery in urban
consumption. Rural consumption remains strong as rural job markets continue to
show uptick, not to mention the third year in a row of normal rainfall.
Rising mobility helps but In-home consumption suffering
With rising mobility, discretionary categories such skin care, cosmetics, hair colour,
and juices are seeing an uptick. Liquor and cigarettes are likely to show good YoY
growth on a soft base. Health supplements (honey and chyawanprash), hygiene
products and products like Saffola edible oil would see a slowdown.
Price hikes not enough to negate raw material inflation
All companies have taken price hikes, but we still we expect gross margins of most
companies to dip YoY. Most companies are likely to increase ad spends YoY
(especially Tata Consumer); thus, YoY EBITDA margin compression is likely as many
costs are coming back.
Model Consumer Portfolio and outlook
Companies in top-tier in terms of YoY volume growth in Q2FY22 would be paint companies, Pidilite while companies in the bottom tier will be Bajaj Consumer and Emami. We have analysed in this report based both on two year basis and one year basis given covid impact in base quarter. We expect rural growth to accelerate riding a good monsoon overall and government sops. With offices re-starting, we expect urban growth to start picking up as well. In-home food consumption, will ease off impacting Marico’s Saffola edible oil portfolio. We expect festive demand to give a boost to the sector, which should help it end FY22 on a strong note.
We assign the following weightings in our Model Consumer Portfolio—30% to HUL,
20% each to Nestle, Dabur and Asian Paints and 10% to Pidilite.
India Equity Research Consumer Staples October 6, 2021
Consumer Goods Preview SECTOR UPDATE
Abneesh Roy Tushar Sundrani Amritasai Sista +91 (22) 6620 3141 +91 (22) 6620 3004 [email protected] [email protected] [email protected]
Consumer Goods Preview
Edelweiss Securities Limited
2 Edelweiss Research is also available on www.edelweissresearch.com, Bloomberg - EDEL, Thomson Reuters, and Factset
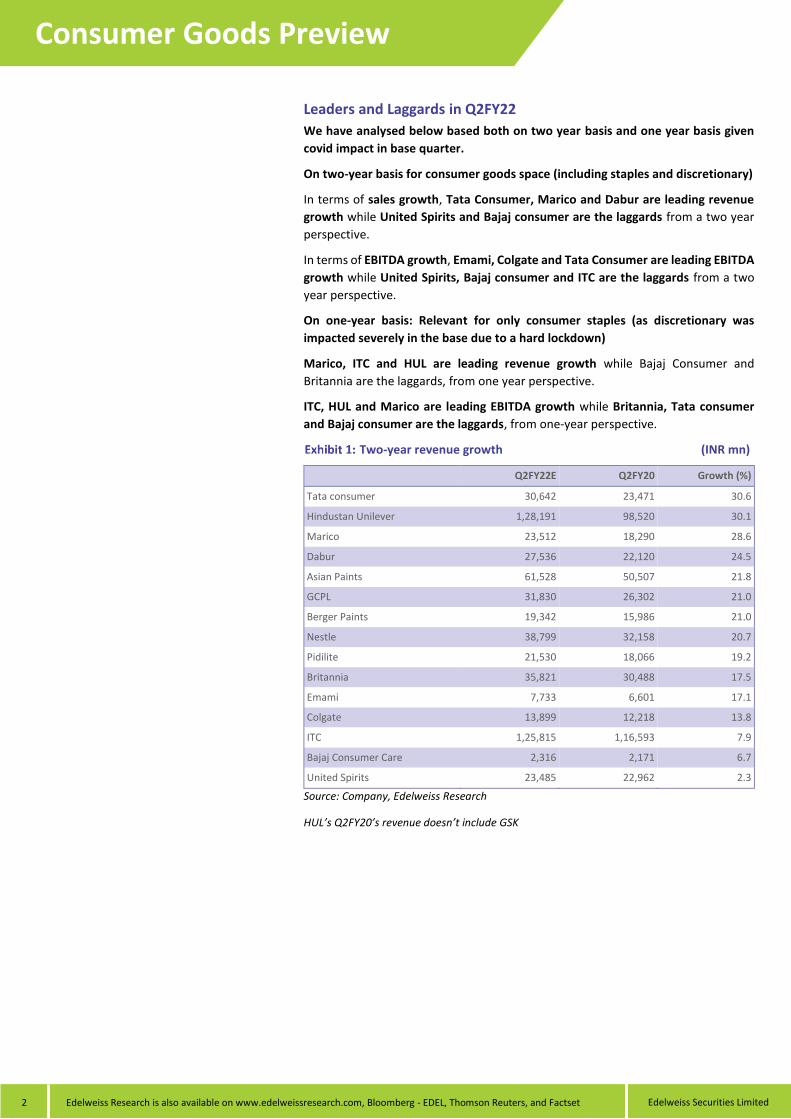
Leaders and Laggards in Q2FY22
We have analysed below based both on two year basis and one year basis given
covid impact in base quarter.
On two-year basis for consumer goods space (including staples and discretionary)
In terms of sales growth, Tata Consumer, Marico and Dabur are leading revenue
growth while United Spirits and Bajaj consumer are the laggards from a two year
perspective.
In terms of EBITDA growth, Emami, Colgate and Tata Consumer are leading EBITDA
growth while United Spirits, Bajaj consumer and ITC are the laggards from a two
year perspective.
On one-year basis: Relevant for only consumer staples (as discretionary was
impacted severely in the base due to a hard lockdown)
Marico, ITC and HUL are leading revenue growth while Bajaj Consumer and
Britannia are the laggards, from one year perspective.
ITC, HUL and Marico are leading EBITDA growth while Britannia, Tata consumer
and Bajaj consumer are the laggards, from one-year perspective.
Two-year revenue growth (INR mn)
Q2FY22E Q2FY20 Growth (%)
Tata consumer 30,642 23,471 30.6
Hindustan Unilever 1,28,191 98,520 30.1
Marico 23,512 18,290 28.6
Dabur 27,536 22,120 24.5
Asian Paints 61,528 50,507 21.8
GCPL 31,830 26,302 21.0
Berger Paints 19,342 15,986 21.0
Nestle 38,799 32,158 20.7
Pidilite 21,530 18,066 19.2
Britannia 35,821 30,488 17.5
Emami 7,733 6,601 17.1
Colgate 13,899 12,218 13.8
ITC 1,25,815 1,16,593 7.9
Bajaj Consumer Care 2,316 2,171 6.7
United Spirits 23,485 22,962 2.3
Source: Company, Edelweiss Research
HUL’s Q2FY20’s revenue doesn’t include GSK

Edelweiss Securities Limited
Consumer Goods Preview
Edelweiss Research is also available on www.edelweissresearch.com, Bloomberg - EDEL, Thomson Reuters, and Factset 3
Two-year EBITDA growth (INR mn)
Q2FY22E Q2FY20 Growth (%)
Emami 2,629 1,930 36.2
Colgate 4,364 3,230 35.1
Hindustan Unilever 31,663 24,430 29.6
Tata consumer 3,983 3,148 26.5
Nestle 9,506 7,645 24.3
Pidilite 4,521 3,682 22.8
Asian Paints 11,690 9,548 22.4
Marico 4,303 3,530 21.9
Britannia 5,954 4,922 21.0
Dabur 5,920 4,895 20.9
GCPL 6,907 5,719 20.8
Berger Paints 2,979 2,511 18.6
ITC 45,167 45,624 -1.0
Bajaj Consumer Care 556 622 -10.6
United Spirits 3,405 4,156 -18.1
Source: Company, Edelweiss Research
HUL’s Q2FY20’s EBITDA doesn’t include GSK
Q2FY22 analysis on one-year basis
% YoY growth
Revenue EBITDA Volume
Asian Paints 15.0 (7.6) 16.0
Bajaj Consumer Care 2.8 (11.3) (1.0)
Berger Paints 11.0 (11.1) 11.0
Britannia 4.8 (11.9) 4.0
Colgate 8.1 6.6 3.0
Dabur 9.4 4.0 7.0
Emami 5.2 2.3 2.0
Godrej Consumer 9.2 0.9 5.0
Hindustan Unilever 12.0 10.4 7.0
Indigo Paints* 36.4 16.2 50.0
ITC 12.5 11.2 9.0
Marico 18.2 10.6 8.0
Nestle India 9.5 5.7 NA
Pidilite 14.5 (11.8) 11.0
Tata consumer 10.2 (0.3) NA
United Spirits - P&A 9.4 26.3 6.0
Source: Edelweiss Research
*For Indigo paints volume growth only for Emulsions
**For ITC volume growth is only cigarettes

Consumer Goods Preview
Edelweiss Securities Limited
4 Edelweiss Research is also available on www.edelweissresearch.com, Bloomberg - EDEL, Thomson Reuters, and Factset
Bizom data suggests strong recovery but we disagree
As per Bizom, FMCG industry sales grew ~30% YoY in Sept, 44% in Aug and 60% in
July. We expect our Coverage Universe to see calibrated growth vs Bizom numbers.
September salaried jobs number is the best since February 2020, at 84 mn salaried
jobs in September which ties up with recovery in Urban consumption. Rural
consumption remains strong as rural job markets continue to show uptick apart from
a 3rd consecutive normal rainfall year.
Many segments gain as lockdown eases
We estimate average volume growth at 9.1% YoY in Q2FY22 (base 1.6%) versus a
growth of 35.7% in Q1FY21 (base -20.7%). With rising mobility, discretionary
categories such skin care, cosmetics, hair colour, and juices are seeing an uptick.
Liquor and cigarettes categories are likely to show a good YoY growth on a soft base.
Health supplements (Honey and chyawanprash) will see a slowdown impacting
Dabur, Emami and Marico.
Price hikes partially negate raw material inflation but not enough
Most companies have taken pricing actions to pass on part of the inflation, hence
we still expect a YoY dip in gross margins for most companies. HUL has taken one
more calibrated hike in Q2FY22 in the skin care and laundry segment. Most other
staples companies have also taken calibrated price hikes. Paint companies have
taken an additional 2% price hike taking their total annual price hike to 6%.
From a raw material standpoint, Palm oil remains inflationary, which will impact HUL
and GCPL. However these companies have taken pricing action to large portion of
this inflation. Crude being up YoY will lead to margin pressure on companies with
higher exposure to crude derivatives—such as Asian Paints, Berger Paints and
Pidilite. For Pidilite, VAM prices are up 133% YoY and after relatively cooling off in
Q2FY22 they have shot back up. Rise in crude prices has also impacted freight and
packaging cost of most companies. Mentha prices are soft YoY which will benefit
Emami. Although glass prices are inflationary for United Spirits, ENA prices are
flattish QoQ and YoY.
Raw material tracker
Name of the Commodity YoY (%) QoQ (%)
Palm Oil 60.5 5.5
PFAD 67.7 5.1
Wheat 4.0 -
Brent 69.3 6.3
Mentha (2.2) (1.0)
Soda Ash 19.7 20.6
Gold (9.2) (1.4)
India WPI rectified spirit (0.3) 0.5
Source: Bloomberg
Modern trade likely to recover, benefiting discretionary segments
We expect modern trade to show a strong YoY recovery led by rising mobility and
addition of new stores. Avenue Supermarts (DMart) Q2FY22 sales update points
towards this. Standalone Revenue from operations for Q2FY22 stood at INR 76.5bn
(up 47% YoY, 52% QoQ). The total number of stores as of September 30, 2021 stood
at 246 (Q1FY22: 238)

Edelweiss Securities Limited
Consumer Goods Preview
Edelweiss Research is also available on www.edelweissresearch.com, Bloomberg - EDEL, Thomson Reuters, and Factset 5
Edelweiss Consumer Goods sector - Q2FY22 estimates snapshot
Source: Edelweiss Research
Company Name Q2FY22E Q2FY21 YoY growth (%) Q1FY22 QoQ growth (%)
Asian Paints Revenues 61,528 53,502 15.0 55,854 10.2
EBITDA 11,690 12,652 (7.6) 9,136 28.0
PAT 7,885 8,519 (7.4) 5,743 37.3
Other income 800 826 896
Tax 2,606 2,936 2,043
EBITDA margin 19.0 23.6 16.4
Bajaj Consumer Care Revenues 2,316 2,253 2.8 2,153 7.6
EBITDA 556 627 (11.3) 523 6.2
PAT 514 573 (10.2) 489 5.2
Other income 90 - 83
Tax 113 121 103
EBITDA margin 24.0 27.8 24.3
Berger Paints Revenues 19,342 17,426 11.0 17,985 7.5
EBITDA 2,979 3,352 (11.1) 2,385 24.9
PAT 1,869 2,221 (15.9) 1,413 32.3
Other income 150 232 170
Tax 630 716 498
EBITDA margin 15.4 19.2 13.3
Britannia Revenues 35,821 34,191 4.8 34,035 5.2
EBITDA 5,954 6,754 (11.9) 5,538 7.5
PAT 4,435 4,951 (10.4) 3,868 14.6
Other income 750 735 605
Tax 1,494 1,750 1,442
EBITDA margin 16.6 19.8 16.3
Colgate Revenues 13,899 12,855 8.1 11,660 19.2
EBITDA 4,364 4,093 6.6 3,552 22.9
PAT 2,973 2,742 8.4 2,332 27.5
Other income 80 76 52
Tax 1,001 947 810
EBITDA margin 31.4 31.8 30.5
Dabur Revenues 27,536 25,160 9.4 23,368 17.8
EBITDA 5,920 5,694 4.0 4,425 33.8
PAT 4,754 4,829 (1.5) 3,773 26.0
Other income 800 876 850
Tax 1,341 1,067 744
EBITDA margin 21.5 22.6 18.9
Emami Revenues 7,733 7,348 5.2 7,733 -
EBITDA 2,629 2,571 2.3 1,628 61.5
PAT 1,487 1,185 25.6 891 67.0
Other income 95 79 465
Tax 372 284 326
EBITDA margin 34.0 35.0 21.1
Godrej Consumer Revenues 31,830 29,151 9.2 28,945 10.0
EBITDA 6,907 6,844 0.9 6,111 13.0
PAT 4,794 4,584 4.6 4,152 15.5
Other income 150 139 209
Tax 1,514 1,463 1,272
EBITDA margin 21.7 23.5 21.1

Consumer Goods Preview
Edelweiss Securities Limited
6 Edelweiss Research is also available on www.edelweissresearch.com, Bloomberg - EDEL, Thomson Reuters, and Factset
Edelweiss Consumer Goods sector - Q2FY22 estimates snapshot
Source: Edelweiss Research
Note: * For Nestle India, corresponding periods are: Q3CY21E, Q3CY20 and Q2CY21 respectively
Company Name Q2FY22E Q2FY21 YoY growth (%) Q1FY22 QoQ growth (%)
Hindustan Unilever Revenues 1,28,191 1,14,420 12.0 1,19,150 7.6
EBITDA 31,663 28,690 10.4 28,470 11.2
PAT 22,495 20,090 12.0 20,610 9.1
Other income 1,200 1,510 670
Tax 7,578 6,520 5,720
EBITDA margin 24.7 25.1 23.9
Indigo Paints Revenues 2,112 1,548 36.4 1,560 35.4
EBITDA 338 291 16.2 202 67.6
PAT 216 188 14.9 116 86.1
Other income 30 6 30
Tax 74 42 40
EBITDA margin 16.0 18.8 12.9
ITC Revenues 1,25,815 1,11,831 12.5 1,22,171 3.0
EBITDA 45,167 40,606 11.2 39,922 13.1
PAT 35,700 32,324 10.4 30,135 18.5
Other income 6,500 6,100 4,290
Tax 12,027 10,419 10,019
EBITDA margin 35.9 36.3 32.7
Marico Revenues 23,512 19,890 18.2 25,250 (6.9)
EBITDA 4,303 3,890 10.6 4,810 (10.5)
PAT 3,076 3,060 0.5 3,650 (15.7)
Other income 250 270 270
Tax 1,036 690 1,020
EBITDA margin 18.3 19.6 19.0
Nestle India * Revenues 38,799 35,417 9.5 34,767 11.6
EBITDA 9,506 8,990 5.7 8,339 14.0
PAT 6,250 5,871 6.5 5,386 16.0
Other income 300 345 295
Tax 2,106 1,994 1,919
EBITDA margin 24.5 25.4 24.0
Pidilite Revenues 21,530 18,803 14.5 19,368 11.2
EBITDA 4,521 5,126 (11.8) 3,476 30.1
PAT 3,083 3,558 (13.4) 2,154 43.1
Other income 200 217 61
Tax 1,039 1,220 721
EBITDA margin 21.0 27.3 17.9
Tata consumer Revenues 30,642.0 27,813.4 10.2 30,084.6 1.9
EBITDA 3,983.5 3,995.8 (0.3) 3,994.9 (0.3)
PAT 2,683.2 2,970.8 (9.7) 1,890.7 41.9
Other income 300.0 262.2 280.1
Tax 870.3 871.3 957.1
EBITDA margin 13.0 14.4 13.3
United Spirits Revenues 23,485 21,459 9.4 16,151 45.4
EBITDA 3,405 2,697 26.3 1,677 103.1
PAT 2,024 1,284 57.6 1,055 91.8
Other income 150 128 106
Tax 682 463 (24)
EBITDA margin 14.5 12.6 10.4

Edelweiss Securities Limited
Consumer Goods Preview
Edelweiss Research is also available on www.edelweissresearch.com, Bloomberg - EDEL, Thomson Reuters, and Factset 7
The Story in Charts
Staples companies’ volume trajectory
Source: Edelweiss Research
Food companies’ revenue growth trajectory
Source: Edelweiss Research, Company
Discretionary companies’ volume growth trajectory
Source: Edelweiss Research, Company
Paint and adhesive companies’ volume growth trajectory
Source: Edelweiss Research, Company
(20.0)
(8.0)
4.0
16.0
28.0
40.0
Q2
FY1
9
Q3
FY1
9
Q4
FY1
9
Q1
FY2
0
Q2
FY2
0
Q3
FY2
0
Q4
FY2
0
Q1
FY2
1
Q2
FY2
1
Q3
FY2
1
Q4
FY2
1
Q1
FY2
2
Q2
FY2
2
(%)
Hindustan Unilever GCPL Dabur Marico Colgate - Toothpaste
(10.0)
0.0
10.0
20.0
30.0
40.0
Q2
FY2
0
Q3
FY2
0
Q4
FY2
0
Q1
FY2
1
Q2
FY2
1
Q3
FY2
1
Q4
FY2
1
Q1
FY2
2
Q2
FY2
2
(%)
Britannia Nestle Tata consumer
(70.0)
(40.0)
(10.0)
20.0
50.0
80.0Q
2FY
19
Q3
FY1
9
Q4
FY1
9
Q1
FY2
0
Q2
FY2
0
Q3
FY2
0
Q4
FY2
0
Q1
FY2
1
Q2
FY2
1
Q3
FY2
1
Q4
FY2
1
Q1
FY2
2
Q2
FY2
2
(%)
ITC - Cigarettes United Spirits - P&A
(70.0)
(30.0)
10.0
50.0
90.0
130.0
Q2
FY1
9
Q3
FY1
9
Q4
FY1
9
Q1
FY2
0
Q2
FY2
0
Q3
FY2
0
Q4
FY2
0
Q1
FY2
1
Q2
FY2
1
Q3
FY2
1
Q4
FY2
1
Q1
FY2
2
Q2
FY2
2
(%)
Asian Paints Berger Paints Pidilite - C&B Business

Consumer Goods Preview
Edelweiss Securities Limited
8 Edelweiss Research is also available on www.edelweissresearch.com, Bloomberg - EDEL, Thomson Reuters, and Factset
Edelweiss Consumer Goods sector volume growth snapshot (%)
Company Name Q2FY20 Q3FY20 Q4FY20 Q1FY21 Q2FY21 Q3FY21 Q4FY21 Q1FY22 Q2FY22E
Asian Paints 14.0 11.0 1.0 (36.0) 11.0 33.0 48.0 106.0 16.0
Bajaj Consumer Care 0.1 (1.0) (30.0) (25.0) 5.0 18.0 40.0 24.3 (1.0)
Berger Paints 13.0 10.0 (4.0) NA 17.0 32.0 60.0 60.0 11.0
Britannia 3.0 3.0 0.1 21.5 9.0 4.0 8.0 1.0 4.0
Colgate - Toothpaste 2.0 1.0 (8.0) (7.0) 3.0 5.0 NA 5.0 3.0
Dabur - Domestic 4.8 5.6 (14.6) (9.7) 16.8 18.1 25.4 34.4 7.0
Emami - Domestic 1.0 (3.0) (19.0) (28.0) 10.0 13.0 39.0 38.0 2.0
Hindustan Unilever 5.0 5.0 (7.0) (8.0) 1.0 4.0 16.0 9.0 7.0
Indigo Paints 73.1 50.0
ITC - Cigarettes 3.0 2.0 (10.0) (40.0) (12.0) (5.0) 8.0 32.0 9.0
GCPL - domestic vol growth 7.0 7.0 (15.0) 3.0 5.0 7.0 29.0 15.0 5.0
Marico - Domestic 1.0 (1.0) (3.0) (14.0) 11.0 15.0 25.0 21.0 8.0
Pidilite - C&B Business (1.0) 2.0 (3.1) (58.3) 3.6 19.0 42.0 105.0 11.0
United Spirits - volume growth 1.0 (1.8) (13.3) (49.2) (3.9) (0.8) 8.1 61.0 6.9
United Spirits - P&A 3.0 2.7 (20.0) (51.5) (0.6) 0.6 19.4 60.0 6.0
Average volume 5.1 4.2 (7.3) (20.6) 1.8 8.3 21.6 36.1 8.5
Source: Edelweiss Research, Company
Edelweiss Consumer Goods sector EBITDA margin snapshot (%)
Company Name Q1FY20 Q2FY20 Q3FY20 Q4FY20 Q1FY21 Q2FY21 Q3FY21 Q4FY21 Q1FY22 Q2FY22E
Asian Paints 22.7 18.9 21.9 18.5 16.6 23.6 26.3 19.8 16.4 19.0
Bajaj Consumer Care 29.3 28.6 25.7 13.5 29.0 27.8 25.5 24.7 24.3 24.0
Berger Paints 17.8 15.7 17.5 15.4 9.9 19.2 19.6 16.6 13.3 15.4
Britannia 14.6 16.1 16.8 15.8 21.0 19.8 19.3 16.1 16.3 16.6
Colgate 27.6 26.4 27.6 24.5 29.6 31.8 30.1 32.9 30.5 31.4
Dabur 20.1 22.1 20.9 18.9 21.0 22.6 21.0 18.9 21.1 21.5
Emami 20.7 29.2 32.5 18.5 25.5 35.0 36.4 22.3 25.7 34.0
Hindustan Unilever 26.2 24.8 24.9 22.9 25.0 25.1 24.1 24.4 23.9 24.7
GCPL 19.4 21.7 22.7 22.1 20.3 23.5 23.3 21.0 21.1 21.7
Indigo Paints 18.2 18.8 15.0 16.9 12.9 16.0
ITC 39.7 38.4 38.4 38.4 29.7 36.3 36.0 33.6 32.7 35.9
Marico 21.3 19.3 20.4 18.9 24.3 19.6 19.5 15.9 19.0 18.3
Nestle 23.9 23.8 21.8 24.1 24.9 25.4 22.1 24.1 24.0 24.5
Pidilite 22.0 20.4 24.0 19.5 7.6 27.3 27.9 20.6 17.9 21.0
Tata consumer 14.7 13.4 12.8 12.8 17.8 14.4 11.8 9.9 13.3 13.0
United Spirits 17.8 18.1 16.4 13.6 -7.5 12.6 15.4 18.5 10.4 14.5
Source: Edelweiss Research, Company

Edelweiss Securities Limited
Consumer Goods Preview
Edelweiss Research is also available on www.edelweissresearch.com, Bloomberg - EDEL, Thomson Reuters, and Factset 9
Asian Paints' EBITDA margin snapshot
Source: Edelweiss Research, Company
Hindustan Unilever's EBITDA margin snapshot
Source: Edelweiss Research, Company
Britannia's EBITDA margin snapshot
Source: Edelweiss Research, Company
United Spirits’ EBITDA margin snapshot
Source: Edelweiss Research, Company
439
128 (21)
(465)
-1,000
-600
-200
200
600
1,000
0.0
6.0
12.0
18.0
24.0
30.0
Q3 Q4 Q1 Q2
(%)
Last year Current year YoY change (bps)
(87)
146
(114)
(37)
-160
-40
80
200
320
440
0.0
6.0
12.0
18.0
24.0
30.0
Q3 Q4 Q1 Q2
(%)
Last year Current year YoY change (bps)
249
30
(469)
(313)
-560
-420
-280
-140
0
140
280
420
0.0
5.0
10.0
15.0
20.0
25.0
Q3 Q4 Q1 Q2
(%)
Last year Current year YoY change (bps)
(100)
490
1,792
193
-700.0
0.0
700.0
1,400.0
2,100.0
-10.0
-4.0
2.0
8.0
14.0
20.0
Q3 Q4 Q1 Q2
(%)
Last year Current year YoY change (bps)

Consumer Goods Preview
Edelweiss Securities Limited
10 Edelweiss Research is also available on www.edelweissresearch.com, Bloomberg - EDEL, Thomson Reuters, and Factset
Asian Paints
We anticipate revenue to grow at 15% YoY, while EBITDA and PAT to dip 7.6% and
7.4% YoY respectively. In the base quarter Q2FY21, we saw a sales and EBITDA
growth of 5.9% and 32.5% YoY respectively. We expect 16% YoY volume growth on
a base of 11% YoY (Q1FY22 saw 106% volume growth on base of -38% YoY). On
account of lower realisation, discounts and lower end of portfolio growing faster we
expect price volume gap to remain flattish. There has been revival in discretionary
spending and real estate in Q2FY22 which has benefited the company. The
company has taken some price hike to counter inflation. Overall we expect EBITDA
margins to fall this quarter by 460bps YoY due to inflationary pressure and improve
260bps QoQ due to price hike and inflation coming off relatively.
Edelweiss estimates - Asian Paints (INR mn)
Q2FY22E Q2FY21 YoY growth (%) Q1FY22 QoQ growth (%)
Revenues 61,528 53,502 15.0 55,854 10.2
EBITDA 11,690 12,652 (7.6) 9,136 28.0
PAT 7,885 8,519 (7.4) 5,743 37.3
Other income 800 826 896
Tax 2,606 2,936 2,043
EBITDA margin 19.0 23.6 16.4
Source: Edelweiss Research
Bajaj Consumer
We expect revenue to grow 2.8% YoY while EBITDA and PAT to dip 11.3% and 10.2%
YoY respectively. Q2FY21 revenue and EBITDA grew 3.8% YoY and 0.7% YoY
respectively. We expect 1% YoY volume dip on a 5% base (Q1FY22 saw a volume
growth (excluding sanitiser) of 24.3% YoY on a -25% base). Price hike is about 3%.
This quarter will see no sanitiser sales in the base. Overall, we expect an EBITDA
margin contraction of 430bps YoY due to raw material inflation pressure.
Edelweiss estimates - Bajaj Consumer (INR mn)
Q2FY22E Q2FY21 YoY growth (%) Q1FY22 QoQ growth (%)
Revenues 2,316 2,253 2.8 2,153 7.6
EBITDA 556 627 (11.3) 523 6.2
PAT 514 573 (10.2) 489 5.2
Other income 90 - 83
Tax 113 121 103
EBITDA margin 24.0 27.8 24.3
Source: Edelweiss Research

Edelweiss Securities Limited
Consumer Goods Preview
Edelweiss Research is also available on www.edelweissresearch.com, Bloomberg - EDEL, Thomson Reuters, and Factset 11
Berger Paints
We anticipate revenue to grow 11% YoY, while EBITDA and PAT to dip 11.1% and
15.9% YoY respectively. In the base quarter Q2FY21, we saw sales and EBITDA
growth of 7.4% and 37.2% YoY respectively. We expect a volume growth of 11% YoY
on a base of 17% YoY (Q1FY22 saw 91% YoY volume growth). The company has seen
inflationary pressure YoY but there should be some improvement QoQ.
Discretionary spending has seen some revival in the quarter which should benefit
the company. Overall, we expect EBITDA margins to to fall 380bps YoY due to
inflation but improve 210bps QoQ due to price hike and inflation coming off
relatively.
Edelweiss estimates - Berger Paints (INR mn)
Q2FY22E Q2FY21 YoY growth (%) Q1FY22 QoQ growth (%)
Revenues 19,342 17,426 11.0 17,985 7.5
EBITDA 2,979 3,352 (11.1) 2,385 24.9
PAT 1,869 2,221 (15.9) 1,413 32.3
Other income 150 232 170
Tax 630 716 498
EBITDA margin 15.4 19.2 13.3
Source: Edelweiss Research
Britannia Industries
We expect Britannia’s revenue to grow 4.8% YoY while EBITDA and PAT to fall by
11.9% and 10.4% YoY respectively. Q2FY21 revenue and EBITDA grew 12.1% YoY and
37.2% YoY respectively. We expect Britannia's volume to grow 4% on a base of 9%
YoY (Q1FY22 saw 1% YoY volume growth on a base of 21.5%). Price hikes are about
3% YoY however value-volume differential will be lower on account of adverse mix.
On the margin front, raw material trend is inflationary and will lead to 310bps YoY
gross margin contraction. We expect 300bps YoY contraction in EBITDA margins as
base quarter had operating leverage benefit.
Edelweiss estimates - Britannia Industries (INR mn)
Q2FY22E Q2FY21 YoY growth (%) Q1FY22 QoQ growth (%)
Revenues 35,821 34,191 4.8 34,035 5.2
EBITDA 5,954 6,754 (11.9) 5,538 7.5
PAT 4,435 4,951 (10.4) 3,868 14.6
Other income 750 735 605
Tax 1,494 1,750 1,442
EBITDA margin 16.6 19.8 16.3
Source: Edelweiss Research

Consumer Goods Preview
Edelweiss Securities Limited
12 Edelweiss Research is also available on www.edelweissresearch.com, Bloomberg - EDEL, Thomson Reuters, and Factset
Colgate Palmolive
We anticipate revenue, EBITDA and PAT growth of 8.1%, 6.6% and 8.4% YoY
respectively. In the base quarter Q2FY21, we saw revenue and EBITDA growth of
5.2% and 26.7% YoY respectively. We expect volume growth of 3% YoY on a base of
3% (Q1FY22 saw 10% YoY volume growth on -7% base). We expect price hike to be
roughly 5%. There has been some inflation in corrugated boxes which will impact
packaging costs. Overall, we expect EBITDA margins to fall 40bps YoY.
Edelweiss estimates - Colgate Palmolive (INR mn)
Q2FY22E Q2FY21 YoY growth (%) Q1FY22 QoQ growth (%)
Revenues 13,899 12,855 8.1 11,660 19.2
EBITDA 4,364 4,093 6.6 3,552 22.9
PAT 2,973 2,742 8.4 2,332 27.5
Other income 80 76 52
Tax 1,001 947 810
EBITDA margin 31.4 31.8 30.5
Source: Edelweiss Research
Dabur
We expect Dabur’s Revenue and EBITDA to grow 9.4% and 4% respectively while PAT
to dip 1.5% YoY. In Q2FY21, Dabur's revenue and EBITDA grew 13.7% YoY and 16.3%
YoY. We expect domestic volumes to grow 7% YoY on a base of 16.8% (Q1FY21 saw
34.4% YoY volume jump on a base of -9.7% YoY). Growth in the immunity boosting
products will slow down due to a high base while food and HPC will see double digit
growth. Raw material prices firming up with agro- and crude-linked prices trending
up. The company will take calibrated price hikes to combat inflation. We expect
gross margins to contract 260bps due to raw material inflation and adverse base.
We expect 110bps YoY EBITDA margin contraction. On account of higher tax rate,
PAT growth will lag EBITDA growth.
Edelweiss estimates - Dabur (INR mn)
Q2FY22E Q2FY21 YoY growth (%) Q1FY22 QoQ growth (%)
Revenues 27,536 25,160 9.4 23,368 17.8
EBITDA 5,920 5,694 4.0 4,425 33.8
PAT 4,754 4,829 (1.5) 3,773 26.0
Other income 800 876 850
Tax 1,341 1,067 744
EBITDA margin 21.5 22.6 18.9
Source: Edelweiss Research

Edelweiss Securities Limited
Consumer Goods Preview
Edelweiss Research is also available on www.edelweissresearch.com, Bloomberg - EDEL, Thomson Reuters, and Factset 13
Emami
We expect revenue, EBITDA and PAT growth of 5.2%, 2.3% and 25.6% YoY,
respectively. In the base quarter Q2FY21 we saw sales and EBITDA growth of 11%
and 33.2% YoY respectively. PAT growth is ahead of EBITDA growth on account of
higher depreciation expense in the base. We expect volume growth of 2% YoY on a
base of 10% (Q1FY22 saw 38% YoY volume growth on -28% base) Immunity
portfolio will see slower growth due to high base. We expect price hike of 2-3% in
the quarter. Summer and international business continue to be laggards. Inputs are
witnessing some inflation. Overall we expect EBITDA margins to dip 100bps YoY and
increase 1290bps QoQ.
Edelweiss estimates – Emami (INR mn)
Q2FY22E Q2FY21 YoY growth (%) Q1FY22 QoQ growth (%)
Revenues 7,733 7,348 5.2 7,733 -
EBITDA 2,629 2,571 2.3 1,628 61.5
PAT 1,487 1,185 25.6 891 67.0
Other income 95 79 465
Tax 372 284 326
EBITDA margin 34.0 35.0 21.1
Source: Edelweiss Research
Godrej Consumer Products
We expect revenue, EBITDA and PAT to grow by 9.2%, 0.9% and 4.6% YoY,
respectively. In the base quarter Q2FY21 we saw revenue and EBITDA growth of
10.8% and 19.7% YoY respectively. We expect a volume growth of 5% YoY on a base
of 5% (Q1FY22 saw 15% YoY on a base of 3%). We expect Home care to grow in low
double digit YoY (Q2FY21 saw 18% YoY growth and 5% dip YoY in Soaps and hair care
respectively) and Personal care to grow by mid-single digit (Q2FY21 saw 4% and
14.6% YoY growth in Household insecticides and others respectively) ( Q1FY22 saw
17% and 21% YoY growth in Personal and Home care respectively). India HI sales in
Q2FY22 were below our expectation. August month saw very little rainfall while
September month saw very high rainfall, both of which is not good for HI due to
lower mosquito breeding.
On international business we expect 8.8% YoY growth overall. In Indonesia, marginal
decline in constant currency sales on a base of 5%. This is impacted by challenging
macroeconomic variables, a gradual recovery in the Air Fresheners category, and
high competitive intensity in the Wet Wipes category. In GAUM, constant currency
sales growth in mid-teens on a base of 5%. 2-year CAGR to be in the double digits.
GCPL’s sales growth in Latin America and SAARC businesses to be soft. Overall, we
expect 180bps compression YoY and 60bps QoQ expansion in EBITDA margin.
Edelweiss estimates – Godrej Consumer Products (INR mn)
Q2FY22E Q2FY21 YoY growth (%) Q1FY22 QoQ growth (%)
Revenues 31,830 29,151 9.2 28,945 10.0
EBITDA 6,907 6,844 0.9 6,111 13.0
PAT 4,794 4,584 4.6 4,152 15.5
Other income 150 139 209
Tax 1,514 1,463 1,272
EBITDA margin 21.7 23.5 21.1
Source: Edelweiss Research
Consumer Goods Preview
Edelweiss Securities Limited
14 Edelweiss Research is also available on www.edelweissresearch.com, Bloomberg - EDEL, Thomson Reuters, and Factset
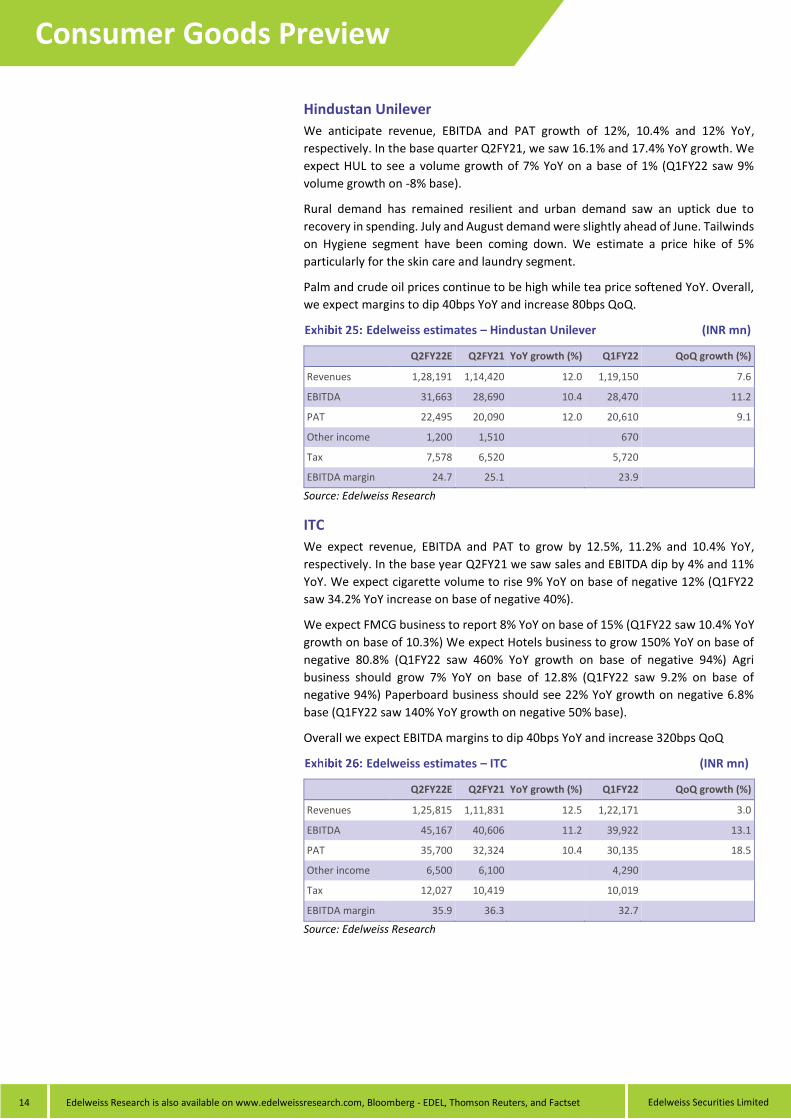
Hindustan Unilever
We anticipate revenue, EBITDA and PAT growth of 12%, 10.4% and 12% YoY,
respectively. In the base quarter Q2FY21, we saw 16.1% and 17.4% YoY growth. We
expect HUL to see a volume growth of 7% YoY on a base of 1% (Q1FY22 saw 9%
volume growth on -8% base).
Rural demand has remained resilient and urban demand saw an uptick due to
recovery in spending. July and August demand were slightly ahead of June. Tailwinds
on Hygiene segment have been coming down. We estimate a price hike of 5%
particularly for the skin care and laundry segment.
Palm and crude oil prices continue to be high while tea price softened YoY. Overall,
we expect margins to dip 40bps YoY and increase 80bps QoQ.
Edelweiss estimates – Hindustan Unilever (INR mn)
Q2FY22E Q2FY21 YoY growth (%) Q1FY22 QoQ growth (%)
Revenues 1,28,191 1,14,420 12.0 1,19,150 7.6
EBITDA 31,663 28,690 10.4 28,470 11.2
PAT 22,495 20,090 12.0 20,610 9.1
Other income 1,200 1,510 670
Tax 7,578 6,520 5,720
EBITDA margin 24.7 25.1 23.9
Source: Edelweiss Research
ITC
We expect revenue, EBITDA and PAT to grow by 12.5%, 11.2% and 10.4% YoY,
respectively. In the base year Q2FY21 we saw sales and EBITDA dip by 4% and 11%
YoY. We expect cigarette volume to rise 9% YoY on base of negative 12% (Q1FY22
saw 34.2% YoY increase on base of negative 40%).
We expect FMCG business to report 8% YoY on base of 15% (Q1FY22 saw 10.4% YoY
growth on base of 10.3%) We expect Hotels business to grow 150% YoY on base of
negative 80.8% (Q1FY22 saw 460% YoY growth on base of negative 94%) Agri
business should grow 7% YoY on base of 12.8% (Q1FY22 saw 9.2% on base of
negative 94%) Paperboard business should see 22% YoY growth on negative 6.8%
base (Q1FY22 saw 140% YoY growth on negative 50% base).
Overall we expect EBITDA margins to dip 40bps YoY and increase 320bps QoQ
Edelweiss estimates – ITC (INR mn)
Q2FY22E Q2FY21 YoY growth (%) Q1FY22 QoQ growth (%)
Revenues 1,25,815 1,11,831 12.5 1,22,171 3.0
EBITDA 45,167 40,606 11.2 39,922 13.1
PAT 35,700 32,324 10.4 30,135 18.5
Other income 6,500 6,100 4,290
Tax 12,027 10,419 10,019
EBITDA margin 35.9 36.3 32.7
Source: Edelweiss Research

Edelweiss Securities Limited
Consumer Goods Preview
Edelweiss Research is also available on www.edelweissresearch.com, Bloomberg - EDEL, Thomson Reuters, and Factset 15
Indigo Paints
We expect revenue EBITDA and PAT to grow 36.4%, 16.2% and 14.9% YoY,
respectively. We expect Emulsions and Primers segments volume to grow by 50%
and 10% YoY. There has been some recovery in the discretionary spending and we
expect the company to benefit from it. Kerala saw severe impact due to the second
covid wave. The company has taken a roughly 6% price hike so far. We expect a
280bps compression YoY in EBITDA margin.
Edelweiss estimates – Indigo Paints (INR mn)
Q2FY22E Q2FY21 YoY growth (%) Q1FY22 QoQ growth (%)
Revenues 2,112 1,548 36.4 1,560 35.4
EBITDA 338 291 16.2 202 67.6
PAT 216 188 14.9 116 86.1
Other income 30 6 30
Tax 74 42 40
EBITDA margin 16.0 18.8 12.9
Source: Edelweiss Research
Marico
We expect revenue, EBITDA and PAT to grow 18.2%, 10.6% and 0.5% YoY,
respectively. In base quarter Q2FY21 we saw sales and EBITDA growth of 8.7% and
10.2% YoY, respectively. We expect domestic volumes to grow 8% YoY on a base of
11% (Q1FY22 saw 21% YoY growth on base of negative 14%) We expect parachute
to clock volume of 7% on 10% base (Q1FY22 saw 12% YoY volume growth on base
of negative 11%) we expect VAHO volumes to grow 11% YoY on base of 4% (Q1FY22
saw 34% YoY volume growth on 30% base).
Saffola Edible Oils had a muted quarter, largely due to volatility in edible oil prices
leading to trade destocking and partly owing to lower in-home consumption. Saffola
volumes to grow 3% YoY on 20% base. (Q1FY22 saw 24% YoY on 16% base).
International business delivered double digit constant currency growth on a base of
12%, due to positive trends in all markets, except Vietnam. Vietnam has a big
discretionary portfolio which got impacted due to severe covid restrictions.
Consolidated gross margin is expected to improve marginally QoQ, but will be under
pressure on YoY basis. Copra prices corrected, crude remained firm, while edible oil
prices was higher. Overall we expect 130bps YoY dip and 70bps dip QoQ on EBITDA
margins.
Edelweiss estimates – Marico (INR mn)
Q2FY22E Q2FY21 YoY growth (%) Q1FY22 QoQ growth (%)
Revenues 23,512 19,890 18.2 25,250 (6.9)
EBITDA 4,303 3,890 10.6 4,810 (10.5)
PAT 3,076 3,060 0.5 3,650 (15.7)
Other income 250 270 270
Tax 1,036 690 1,020
EBITDA margin 18.3 19.6 19.0
Source: Edelweiss Research

Consumer Goods Preview
Edelweiss Securities Limited
16 Edelweiss Research is also available on www.edelweissresearch.com, Bloomberg - EDEL, Thomson Reuters, and Factset
Nestle
We expect revenue, EBITDA and PAT to grow 9.5%, 5.7% and 6.5% YoY, respectively.
In the base quarter Q3CY20, we saw sales growth of 10% and 17.6% YoY,
respectively. Nestle is likely to see ~10.5% YoY growth in domestic revenues on a
base of 10.2% (Q2CY21 saw 13.7% YoY domestic sales growth on a base of 2.6%).
Export revenue is likely to dip 7% YoY (Q2CY21 saw 17.7% YoY growth on a base of -
9.3%). Raw material pressure is high and we expect EBITDA margins to fall 90bps
YoY.
Edelweiss estimates – Nestle (INR mn)
Q3CY21E Q3CY20 YoY growth (%) Q2CY21 QoQ growth (%)
Revenues 38,799 35,417 9.5 34,767 11.6
EBITDA 9,506 8,990 5.7 8,339 14.0
PAT 6,250 5,871 6.5 5,386 16.0
Other income 300 345 295
Tax 2,106 1,994 1,919
EBITDA margin 24.5 25.4 24.0
Source: Edelweiss Research
Pidilite
We estimate revenue to grow 14.5% YoY while EBITDA and PAT to dip 11.8% YoY
and 13.4% YoY respectively. Q2FY21 saw revenue and EBITDA growth of 4.1% YoY
and 39.2% YoY respectively. We expect volumes to improve sequentially on a two
year basis driven by the rural and smaller towns, overall we expect the company
reporting ~11% YoY volume growth on a base of 3.6% (Q1FY22 saw 105% volume
growth on a base of -58.3%). Overall pricing growth will be 4%. We expect gross
margin compression of 490bps YoY due to low VAM prices in the base. VAM prices
which had cooled off have once again risen sharply by the end of the quarter. We
expect EBITDA margin compression of 630bps YoY and expansion of 310bps QoQ.
Edelweiss estimates – Pidilite (INR mn)
Q2FY22E Q2FY21 YoY growth (%) Q1FY22 QoQ growth (%)
Revenues 21,530 18,803 14.5 19,368 11.2
EBITDA 4,521 5,126 (11.8) 3,476 30.1
PAT 3,083 3,558 (13.4) 2,154 43.1
Other income 200 217 61
Tax 1,039 1,220 721
EBITDA margin 21.0 27.3 17.9
Source: Edelweiss Research

Edelweiss Securities Limited
Consumer Goods Preview
Edelweiss Research is also available on www.edelweissresearch.com, Bloomberg - EDEL, Thomson Reuters, and Factset 17
Tata Consumer Products
We expect revenue to grow 10.2% YoY while EBITDA and PAT to dip 0.3% and 9.7%
YoY respectively. The strong fall in PAT is due to spike in JV profit share due to high
seasonal gains in plantation. We expect packages beverages to grow 15% YoY on a
base of 32% (Q1FY22 saw 27% YoY growth on base of 11%). we expect India foods
business to grow 25% YoY on a base of 13% (Q1FY22 saw growth of 20% YoY on base
of 18.9%) we expect international revenue to dip 2% YoY on base of 7.3% (Q1FY22
saw dip of 8%YoY on base of 15%. Overall, we expect EBITDA margins to fall 130bps
YoY and increase 460bps QoQ.
Edelweiss estimates – Tata Consumer Products (INR mn)
Q2FY22E Q2FY21 YoY growth (%) Q1FY22 QoQ growth (%)
Revenues 30,642 27,813 10.2 30,085 1.9
EBITDA 3,983 3,996 (0.3) 3,995 (0.3)
PAT 2,683 2,971 (9.7) 1,891 41.9
Other income 300 262 280
Tax 870 871 957
EBITDA margin 13.0 14.4 13.3
Source: Edelweiss Research
United Spirits
We expect Revenue, EBITDA and PAT growth of 9.4%, 26.3% and 57.6% YoY
respectively. In the base quarter Q2FY21, we saw sales and EBITDA fall of 6.5% and
35.1% YoY. We expect volume growth of 6% YoY on base of -0.6% for Prestige and
above segment (Q1FY22 saw 60% YoY growth on -51.5% base) and 8% YoY volume
growth on -7.5% base for Popular segment (Q1FY22 saw 62% YoY growth on -46.7%
base). Glass inflation of ~8% will impact gross margins. Corrugated box, freight and
fuel also saw some inflation. Popular segment review will conclude mid Q3FY22.
Overall we expect EBITDA margins to fall 190bps YoY due to inflation pressure but
improve sequentially 410bps QoQ.
Edelweiss estimates – United Spirits (INR mn)
Q2FY22E Q2FY21 YoY growth (%) Q1FY22 QoQ growth (%)
Revenues 23,485 21,459 9.4 16,151 45.4
EBITDA 3,405 2,697 26.3 1,677 103.1
PAT 2,024 1,284 57.6 1,055 91.8
Other income 150 128 106
Tax 682 463 (24)
EBITDA margin 14.5 12.6 10.4
Source: Edelweiss Research

Consumer Goods Preview
Edelweiss Securities Limited
18 Edelweiss Research is also available on www.edelweissresearch.com, Bloomberg - EDEL, Thomson Reuters, and Factset
DISCLAIMER Edelweiss Securities Limited (“ESL” or “Research Entity”) is regulated by the Securities and Exchange Board of India (“SEBI”) and is licensed to carry on the business of broking, Investment Adviser, Research Analyst and related activities.
This Report has been prepared by Edelweiss Securities Limited in the capacity of a Research Analyst having SEBI Registration No.INH200000121 and distributed as per SEBI (Research Analysts) Regulations 2014. This report does not constitute an offer or solicitation for the purchase or sale of any financial instrument or as an official confirmation of any transaction. Securities as defined in clause (h) of section 2 of the Securities Contracts (Regulation) Act, 1956 includes Financial Instruments and Currency Derivatives. The information contained herein is from publicly available data or other sources believed to be reliable. This report is provided for assistance only and is not intended to be and must not alone be taken as the basis for an investment decision. The user assumes the entire risk of any use made of this information. Each recipient of this report should make such investigation as it deems necessary to arrive at an independent evaluation of an investment in Securities referred to in this document (including the merits and risks involved), and should consult his own advisors to determine the merits and risks of such investment. The investment discussed or views expressed may not be suitable for all investors.
This information is strictly confidential and is being furnished to you solely for your information. This information should not be reproduced or redistributed or passed on directly or indirectly in any form to any other person or published, copied, in whole or in part, for any purpose. This report is not directed or intended for distribution to, or use by, any person or entity who is a citizen or resident of or located in any locality, state, country or other jurisdiction, where such distribution, publication, availability or use would be contrary to law, regulation or which would subject ESL and associates / group companies to any registration or licensing requirements within such jurisdiction. The distribution of this report in certain jurisdictions may be restricted by law, and persons in whose possession this report comes, should observe, any such restrictions. The information given in this report is as of the date of this report and there can be no assurance that future results or events will be consistent with this information. This information is subject to change without any prior notice. ESL reserves the right to make modifications and alterations to this statement as may be required from time to time. ESL or any of its associates / group companies shall not be in any way responsible for any loss or damage that may arise to any person from any inadvertent error in the information contained in this report. ESL is committed to providing independent and transparent recommendation to its clients. Neither ESL nor any of its associates, group companies, directors, employees, agents or representatives shall be liable for any damages whether direct, indirect, special or consequential including loss of revenue or lost profits that may arise from or in connection with the use of the information. Our proprietary trading and investment businesses may make investment decisions that are inconsistent with the recommendations expressed herein. Past performance is not necessarily a guide to future performance .The disclosures of interest statements incorporated in this report are provided solely to enhance the transparency and should not be treated as endorsement of the views expressed in the report. The information provided in these reports remains, unless otherwise stated, the copyright of ESL. All layout, design, original artwork, concepts and other Intellectual Properties, remains the property and copyright of ESL and may not be used in any form or for any purpose whatsoever by any party without the express written permission of the copyright holders.
ESL shall not be liable for any delay or any other interruption which may occur in presenting the data due to any reason including network (Internet) reasons or snags in the system, break down of the system or any other equipment, server breakdown, maintenance shutdown, breakdown of communication services or inability of the ESL to present the data. In no event shall ESL be liable for any damages, including without limitation direct or indirect, special, incidental, or consequential damages, losses or expenses arising in connection with the data presented by the ESL through this report.
We offer our research services to clients as well as our prospects. Though this report is disseminated to all the customers simultaneously, not all customers may receive this report at the same time. We will not treat recipients as customers by virtue of their receiving this report.
ESL and its associates, officer, directors, and employees, research analyst (including relatives) worldwide may: (a) from time to time, have long or short positions in, and buy or sell the
Securities, mentioned herein or (b) be engaged in any other transaction involving such Securities and earn brokerage or other compensation or act as a market maker in the financial
instruments of the subject company/company(ies) discussed herein or act as advisor or lender/borrower to such company(ies) or have other potential/material conflict of interest with
respect to any recommendation and related information and opinions at the time of publication of research report or at the time of public appearance. ESL may have proprietary long/short
position in the above mentioned scrip(s) and therefore should be considered as interested. The views provided herein are general in nature and do not consider risk appetite or investment
objective of any particular investor; readers are requested to take independent professional advice before investing. This should not be construed as invitation or solicitation to do business
with ESL.
ESL or its associates may have received compensation from the subject company in the past 12 months. ESL or its associates may have managed or co-managed public offering of securities for the subject company in the past 12 months. ESL or its associates may have received compensation for investment banking or merchant banking or brokerage services from the subject company in the past 12 months. ESL or its associates may have received any compensation for products or services other than investment banking or merchant banking or brokerage services from the subject company in the past 12 months. ESL or its associates have not received any compensation or other benefits from the Subject Company or third party in connection with the research report. Research analyst or his/her relative or ESL’s associates may have financial interest in the subject company. ESL and/or its Group Companies, their Directors, affiliates and/or employees may have interests/ positions, financial or otherwise in the Securities/Currencies and other investment products mentioned in this report. ESL, its associates, research analyst and his/her relative may have other potential/material conflict of interest with respect to any recommendation and related information and opinions at the time of publication of research report or at the time of public appearance.
Participants in foreign exchange transactions may incur risks arising from several factors, including the following: ( i) exchange rates can be volatile and are subject to large fluctuations; ( ii) the value of currencies may be affected by numerous market factors, including world and national economic, political and regulatory events, events in equity and debt markets and changes in interest rates; and (iii) currencies may be subject to devaluation or government imposed exchange controls which could affect the value of the currency. Investors in securities such as ADRs and Currency Derivatives, whose values are affected by the currency of an underlying security, effectively assume currency risk.
Research analyst has served as an officer, director or employee of subject Company: No
ESL has financial interest in the subject companies: No
ESL’s Associates may have actual / beneficial ownership of 1% or more securities of the subject company at the end of the month immediately preceding the date of publication of research report.
Research analyst or his/her relative has actual/beneficial ownership of 1% or more securities of the subject company at the end of the month immediately preceding the date of publication of research report: No
ESL has actual/beneficial ownership of 1% or more securities of the subject company at the end of the month immediately preceding the date of publication of research report: No
Subject company may have been client during twelve months preceding the date of distribution of the research report.
There were no instances of non-compliance by ESL on any matter related to the capital markets, resulting in significant and material disciplinary action during the last three years except that ESL had submitted an offer of settlement with Securities and Exchange commission, USA (SEC) and the same has been accepted by SEC without admitting or denying the findings in relation to their charges of non registration as a broker dealer.
A graph of daily closing prices of the securities is also available at www.nseindia.com
Analyst Certification:
The analyst for this report certifies that all of the views expressed in this report accurately reflect his or her personal views about the subject company or companies and its or their securities, and no part of his or her compensation was, is or will be, directly or indirectly related to specific recommendations or views expressed in this report.

Edelweiss Securities Limited
Consumer Goods Preview
Edelweiss Research is also available on www.edelweissresearch.com, Bloomberg - EDEL, Thomson Reuters, and Factset 19
Additional Disclaimers
Disclaimer for U.S. Persons
This research report is a product of Edelweiss Securities Limited, which is the employer of the research analyst(s) who has prepared the research report. The research analyst(s) preparing the research report is/are resident outside the United States (U.S.) and are not associated persons of any U.S. regulated broker-dealer and therefore the analyst(s) is/are not subject to supervision by a U.S. broker-dealer, and is/are not required to satisfy the regulatory licensing requirements of FINRA or required to otherwise comply with U.S. rules or regulations regarding, among other things, communications with a subject company, public appearances and trading securities held by a research analyst account.
This report is intended for distribution by Edelweiss Securities Limited only to "Major Institutional Investors" as defined by Rule 15a-6(b)(4) of the U.S. Securities and Exchange Act, 1934 (the Exchange Act) and interpretations thereof by U.S. Securities and Exchange Commission (SEC) in reliance on Rule 15a 6(a)(2). If the recipient of this report is not a Major Institutional Investor as specified above, then it should not act upon this report and return the same to the sender. Further, this report may not be copied, duplicated and/or transmitted onward to any U.S. person, which is not the Major Institutional Investor.
In reliance on the exemption from registration provided by Rule 15a-6 of the Exchange Act and interpretations thereof by the SEC in order to conduct certain business with Major Institutional Investors, Edelweiss Securities Limited has entered into an agreement with a U.S. registered broker-dealer, Edelweiss Financial Services Inc. ("EFSI"). Transactions in securities discussed in this research report should be effected through Edelweiss Financial Services Inc.
Disclaimer for U.K. Persons
The contents of this research report have not been approved by an authorised person within the meaning of the Financial Services and Markets Act 2000 ("FSMA"). In the United Kingdom, this research report is being distributed only to and is directed only at (a) persons who have professional experience in matters relating to investments falling within Article 19(5) of the FSMA (Financial Promotion) Order 2005 (the “Order”); (b) persons falling within Article 49(2)(a) to (d) of the Order (including high net worth companies and unincorporated associations); and (c) any other persons to whom it may otherwise lawfully be communicated (all such persons together being referred to as “relevant persons”). This research report must not be acted on or relied on by persons who are not relevant persons. Any investment or investment activity to which this research report relates is available only to relevant persons and will be engaged in only with relevant persons. Any person who is not a relevant person should not act or rely on this research report or any of its contents. This research report must not be distributed, published, reproduced or disclosed (in whole or in part) by recipients to any other person. Disclaimer for Canadian Persons
This research report is a product of Edelweiss Securities Limited ("ESL"), which is the employer of the research analysts who have prepared the research report. The research analysts preparing the research report are resident outside the Canada and are not associated persons of any Canadian registered adviser and/or dealer and, therefore, the analysts are not subject to supervision by a Canadian registered adviser and/or dealer, and are not required to satisfy the regulatory licensing requirements of the Ontario Securities Commission, other Canadian provincial securities regulators, the Investment Industry Regulatory Organization of Canada and are not required to otherwise comply with Canadian rules or regulations regarding, among other things, the research analysts' business or relationship with a subject company or trading of securities by a research analyst.
This report is intended for distribution by ESL only to "Permitted Clients" (as defined in National Instrument 31-103 ("NI 31-103")) who are resident in the Province of Ontario, Canada (an "Ontario Permitted Client"). If the recipient of this report is not an Ontario Permitted Client, as specified above, then the recipient should not act upon this report and should return the report to the sender. Further, this report may not be copied, duplicated and/or transmitted onward to any Canadian person.
ESL is relying on an exemption from the adviser and/or dealer registration requirements under NI 31-103 available to certain international advisers and/or dealers. Please be advised that (i) ESL is not registered in the Province of Ontario to trade in securities nor is it registered in the Province of Ontario to provide advice with respect to securities; (ii) ESL's head office or principal place of business is located in India; (iii) all or substantially all of ESL's assets may be situated outside of Canada; (iv) there may be difficulty enforcing legal rights against ESL because of the above; and (v) the name and address of the ESL's agent for service of process in the Province of Ontario is: Bamac Services Inc., 181 Bay Street, Suite 2100, Toronto, Ontario M5J 2T3 Canada.
Disclaimer for Singapore Persons
In Singapore, this report is being distributed by Edelweiss Investment Advisors Private Limited ("EIAPL") (Co. Reg. No. 201016306H) which is a holder of a capital markets services license and an exempt financial adviser in Singapore and (ii) solely to persons who qualify as "institutional investors" or "accredited investors" as defined in section 4A(1) of the Securities and Futures Act, Chapter 289 of Singapore ("the SFA"). Pursuant to regulations 33, 34, 35 and 36 of the Financial Advisers Regulations ("FAR"), sections 25, 27 and 36 of the Financial Advisers Act, Chapter 110 of Singapore shall not apply to EIAPL when providing any financial advisory services to an accredited investor (as defined in regulation 36 of the FAR. Persons in Singapore should contact EIAPL in respect of any matter arising from, or in connection with this publication/communication. This report is not suitable for private investors.
Disclaimer for Hong Kong persons
This report is distributed in Hong Kong by Edelweiss Securities (Hong Kong) Private Limited (ESHK), a licensed corporation (BOM -874) licensed and regulated by the Hong Kong Securities and Futures Commission (SFC) pursuant to Section 116(1) of the Securities and Futures Ordinance “SFO”. This report is intended for distribution only to “Professional Investors” as defined in Part I of Schedule 1 to SFO. Any investment or investment activity to which this document relates is only available to professional investor and will be engaged only with professional investors.” Nothing here is an offer or solicitation of these securities, products and services in any jurisdiction where their offer or sale is not qualified or exempt from registration. The report also does not constitute a personal recommendation or take into account the particular investment objectives, financial situations, or needs of any individual recipients. The Indian Analyst(s) who compile this report is/are not located in Hong Kong and is/are not licensed to carry on regulated activities in Hong Kong and does not / do not hold themselves out as being able to do so. Copyright 2009 Edelweiss Research (Edelweiss Securities Ltd). All rights reserved.
Aditya Narain
Head of Research