q2 fiscal 2019 letter to shareholders › 122868703 › files › doc_financials › ...2 q2 fiscal...
TRANSCRIPT

1
Q2 FISCAL 2019
Letter to Shareholders
August 12, 2019

2
Q2 Fiscal 2019 Highlights
Achieved 271 acceptances, a 49.7% year-over-year increase.
Posted $233.8 million of revenue, a gross margin of 17.8% and a
net loss of $62.2 million. Excluding stock-based compensation, we
achieved 22.3% gross margin and $21.9 million of adjusted
EBITDA.
We augmented our leadership team by appointing former Signify
(previously Phillips Lighting) and Cisco executive, Chris White as
Executive Vice President and Chief Sales Officer.
We announced an investment by Duke Energy One, a subsidiary of
Duke Energy, for 37 megawatts of US Commercial and Industrial
Bloom Energy Server projects valued at approximately $250
million.
We announced a new technical capability for our Energy Servers
to operate using hydrogen as a fuel source. The news further
extends the fuel flexibility we offer our customers, and thereby
adds additional paths for generating on-site, always-on electric
power with low or no emissions.
“We are pleased to have delivered a record Q2 for acceptances, which exceeded analyst expectations. Our positive momentum was enabled by the continued success of our diversification strategy, and by greater predictability in our installs. We also made substantial progress against our cost reduction goals, delivering both sequential and year-over-year reductions in our cost of product accepted.“
KR Sridhar, Founder, Chairman and CEO, Bloom Energy
Q2 Fiscal 2019 Key Results
Total Acceptances (100 kW units)
271 systems
Revenue ($M)
$233.8M
GAAP Gross Margin
17.8%
Non GAAP Gross Margin (excluding SBC)
22.3%
622
809
181235 271
FY'17 FY'18 Q2'18 Q1'19 Q2'19
$376.0
$742.0
$168.9 $200.7 $233.8
FY'17 FY'18 Q2'18 Q1'19 Q2'19
-4.8%
15.8%19.4%
7.8%
17.8%
FY'17 FY'18 Q2'18 Q1'19 Q2'19
-2.7%
21.4% 20.6%
15.0%
22.3%
FY'17 FY'18 Q2'18 Q1'19 Q2'19

3
Dear Shareholder,
During our second fiscal quarter, which ended June 30, 2019, Bloom
Energy continued to deliver strong same quarter year-over-year
acceptance and revenue growth, characterized by a diversity of
customers, industries and international business. We also continued
to proliferate our relationships with customer financing partners,
expanded our ability to provide zero carbon baseload power
generation solutions, as well as added a seasoned sales executive to
lead our outbound sales efforts.
This quarter, we achieved 271 acceptances, a 49.7% year-over-year
increase and a record Q2 for the company, and slightly above the
midpoint of our estimates.
Revenue for the quarter was $233.8 million, up 38.4% year-over-year,
yielding a net loss of $62.2 million (including $51.2 million of stock-
based compensation) and adjusted EBITDA of $21.9 million.
Q2 Fiscal 2019 Business Highlights
Data Center and Health Care Lead Sectors with Strongest Acceptance Momentum
We delivered another strong quarter with a diversity of acceptances
across industry sectors and international markets. Our momentum in
core health care, retail and data center sectors continued, and we saw
new acceptances in the tech, telecommunications, utility, food and
beverage, media, hospitality and education sectors.
Notable new customers of Bloom Energy Servers this quarter include
Agilent Technologies, the global leader in life sciences, diagnostics,
and applied chemical markets, and Altice USA, one of the largest
broadband communications and video services operators in the U.S.
We also deployed the latest generation of our Energy Servers at The
Alhambra, a LEED Gold certified, mixed-use health-and-wellness-
focused community that is home to the County of Los Angeles.
New Strategic Alliance with Duke Energy Underscores Confidence in Bloom Energy Servers
This quarter, we were pleased to announce a subsidiary of Duke
Energy, one of the largest electric power holding companies in the
U.S., made a $250 million investment in our technology.
Duke Energy One will acquire approximately 37 megawatts of Bloom
Energy Server projects through a power purchase agreement
Bloom Energy Servers were deployed at The
Alhambra, a mixed-use health-and-wellness
community in Los Angeles during Q2
4
mechanism as it seeks to serve commercial and industrial customers’
evolving energy needs behind the meter. Duke recognizes that
commercial and industrial customers increasingly need power that is
reliable, resilient and affordable, and its investment is a significant
validation of the Bloom Energy Server value proposition.
Duke Energy One has already secured long-term power purchase
agreements with creditworthy customers primarily located in
California, Connecticut, Maryland and New York. Duke and Bloom
Energy will deploy the servers at more than 30 sites across a portfolio
of customers during the next 18 months, including hospitals,
technology companies, data centers and universities.
Bloom Energy Continues on Path to Zero Emissions with New Capability to Run on Hydrogen
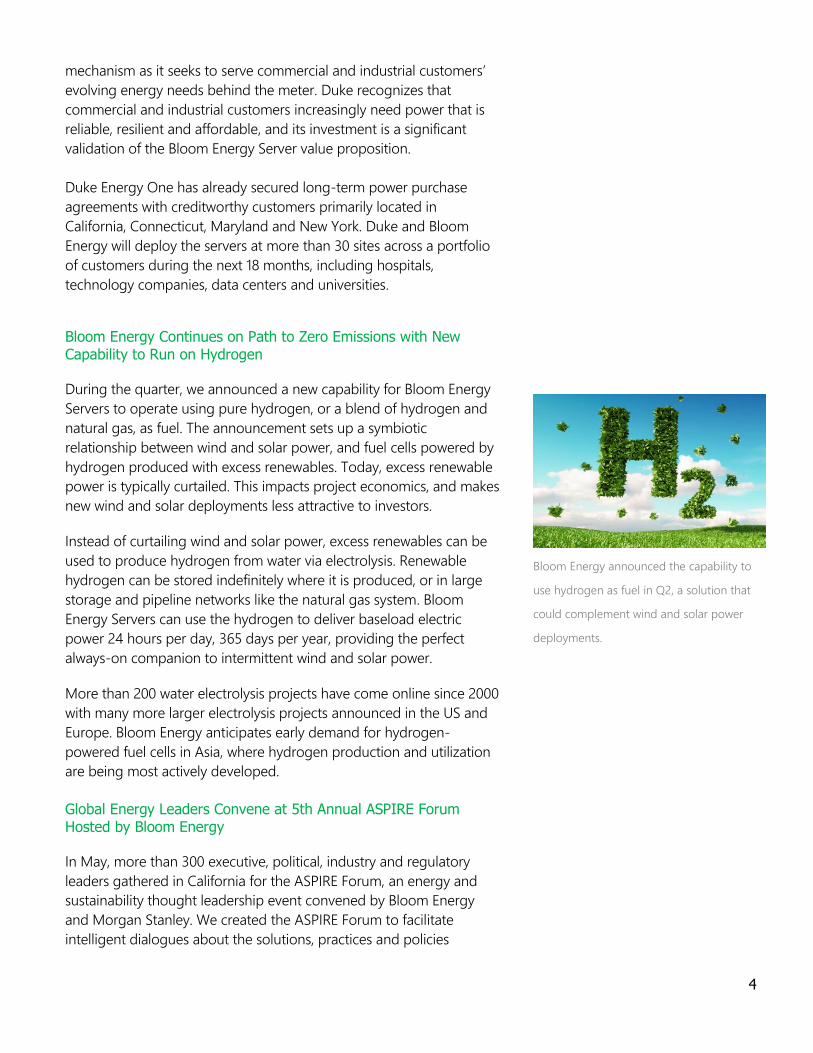
During the quarter, we announced a new capability for Bloom Energy
Servers to operate using pure hydrogen, or a blend of hydrogen and
natural gas, as fuel. The announcement sets up a symbiotic
relationship between wind and solar power, and fuel cells powered by
hydrogen produced with excess renewables. Today, excess renewable
power is typically curtailed. This impacts project economics, and makes
new wind and solar deployments less attractive to investors.
Instead of curtailing wind and solar power, excess renewables can be
used to produce hydrogen from water via electrolysis. Renewable
hydrogen can be stored indefinitely where it is produced, or in large
storage and pipeline networks like the natural gas system. Bloom
Energy Servers can use the hydrogen to deliver baseload electric
power 24 hours per day, 365 days per year, providing the perfect
always-on companion to intermittent wind and solar power.
More than 200 water electrolysis projects have come online since 2000
with many more larger electrolysis projects announced in the US and
Europe. Bloom Energy anticipates early demand for hydrogen-
powered fuel cells in Asia, where hydrogen production and utilization
are being most actively developed.
Global Energy Leaders Convene at 5th Annual ASPIRE Forum Hosted by Bloom Energy
In May, more than 300 executive, political, industry and regulatory
leaders gathered in California for the ASPIRE Forum, an energy and
sustainability thought leadership event convened by Bloom Energy
and Morgan Stanley. We created the ASPIRE Forum to facilitate
intelligent dialogues about the solutions, practices and policies
Bloom Energy announced the capability to
use hydrogen as fuel in Q2, a solution that
could complement wind and solar power
deployments.

5
required to comprehensively address the causes and consequences of
climate change.
This year’s event, our fifth, featured keynote speakers including Laszlo
Varro, Chief Economist of the International Energy Agency, Neil
Chatterjee, Chairman of the Federal Energy Regulatory Commission,
Charlie Baker, Governor of Massachusetts, Stacey Cunningham,
President of the New York Stock Exchange and California Lieutenant
Governor Eleni Kounalakis.
ASPIRE Forum is a key moment in our marketing calendar and we
were delighted to welcome many customers and many potential
future customers to the event.
New Global Sales Leader Appointment Further Strengthens Leadership Team
Finally, we are pleased to report another high caliber executive
appointment. Chris White has joined Bloom Energy as executive vice
president and chief sales officer.
Chris has more than 25 years experience leading industry and market
transformations. He most recently served as CEO of the Americas at
Signify (formerly Philips Lighting). Before joining Signify, Chris had an
impressive 20-year tenure at Cisco. His accomplishments at the IT and
communications company include building a $1 billion Internet of
Things business in three years. He also grew Cisco’s sports and
entertainment technology business from a $20 million start-up to a
$500 million business in less than five years.
Chris succeeds Bill Thayer, who has been Bloom’s U.S. sales leader
since 2005. Bill retired from his role during Q2. We are tremendously
grateful for all that he contributed to our company over the past 14
years!
FERC Chairman Neil Chatterjee and
IEA Chief Economist Laszlo Varro at ASPIRE
Forum 2019 with Fareed Zakaria of CNN.
Chris White has joined Bloom Energy as
EVP and Chief Sales Officer
.

6
Q2 Fiscal 2019 Financial Highlights
Q2’19 Q1’19 Q2’18
Acceptances (100 kW) 271 235 181
Revenue ($M) $233.8 $200.7 $168.9
GAAP Gross Margin (%) 17.8% 7.8% 19.4%
Gross Margin Excluding SBC (%) 22.3% 15.0% 20.6%
GAAP Net Loss ($M) ($62.2) ($84.4) ($45.7)
Adjusted EBITDA ($M) $21.9 $2.1 $12.5
GAAP Net Loss per Share ($) ($0.55) ($0.76) ($4.34)
Adjusted Net Loss per Share ($) ($0.13) ($0.22) ($0.27)
Total Acceptances
We achieved 271 acceptances in Q2 of FY19, or 27.1 megawatts, a
49.7% increase year-over-year.
Generally, an acceptance occurs when the system is turned on and
producing full power. For orders where one of our international
partners performs the installation, our acceptance criteria is
different. Those acceptances are generally achieved when the
systems are shipped to our partner. Upon acceptance, the
customer order is moved from product backlog and is recognized
as revenue.
The 271 acceptances represented ten different end customers,
across eight industries and two countries.
Revenue
We achieved $233.8 million of revenue in Q2 of FY19 compared to
$168.9 million in Q2 of FY18, an increase of 38.4% year-over-year and
up 16.5% sequentially relative to Q1 of FY19.
Note that relative to our Q2 of FY19 estimates that we provided last
quarter, there was a change related to the PPA II upgrade project
that we announced during the quarter. Our Q2 of FY19 estimates
netted certain expenses associated with the upgrade against the
proceeds received. The Q2 of FY19 actual results recognize
incremental revenue and expenses on our profit and loss statement.
So that you can understand the impact of the difference between our
Q2 of FY19 stimates and our Q2 of FY19 actual results, we have
provided a table in the “Summary Non-GAAP Financial Information”
section on page 10 of this letter. This table bridges our actual results
to a normalized or “adjusted actuals” that aligns with the
methodology of the estimates that we provided last quarter.
On an adjusted actuals basis, removing the impact of the $40.6
million of revenue associated with the difference as outlined on page
10, we achieved $193.2 million of revenue, which is an increase of
Bloom Energy Servers deployed at a
California manufacturer

7
14.4% year-over-year, but down 3.8% sequentially due to a mix of
lower ASPs associated with our international acceptances, where we
don’t achieve installation revenue and from the PPA II upgrade,
where we achieved minimal installation revenue.
Gross Profit and Gross Margin
Gross profit was $41.7 million in Q2 of FY19, yielding a gross margin of
17.8% compared to $32.8 million in Q2 of FY18, with a gross margin of
19.4%. While absolute gross profit increased on higher acceptance
volume, gross margin declined primarily driven by an increase in
stock based compensation related to shares issued in conjunction
with our IPO in July of FY18.
Excluding stock-based compensation, gross profit for Q2 of FY19 was
$52.1 million, which represented gross margin of 22.3%. Gross margin
was up sequentially by 7.3 percentage points relative to Q1 of FY19,
generally driven by a 15.3% increase in volume, as well as typical
quarter-to-quarter mix of profitability in acceptances. Compared to
Q2 of FY18 and removing stock based compensation, gross profit
was up by $17.3 million, and gross margin was up by 1.7 percentage
points. Both metrics were driven primarily by larger acceptance
volumes and changes in mix of acceptances in Q2 of FY19 compared
to Q2 of FY18.
On an adjusted actuals basis and normalized to how we provided the
estimates, non-GAAP gross profit was $45.1 million, up $10.4 million,
and gross margin was 23.4%, up by 2.8 percentage points, again
driven primarily by larger acceptance volumes and changes in mix of
acceptances in Q2 of FY19 compared to Q2 of FY18.
Operating Expenses
Operating expenses for Q2 of FY19 were $91.8 million, which included
an increase in year-over-year stock-based compensation related to
our IPO, investments in people and materials to support our next
generation Energy Server development, new product application
development, investments in our demand generation functions to
support increased growth and investments in G&A to support public
company readiness. Additionally, we incurred a one-time expense
associated with the PPA II upgrade.
Excluding stock-based compensation, Q2 of FY19 operating expenses
were $51.0 million, which were up $12.1 million sequentially from Q1
of FY19 and increased $18.8 million year-over-year, or 58.4%. Q2 of
Bloom Energy Servers deployed at utility scale

8
FY19 operating expenses included $5.9 million of one time charges
associated with the PPA II upgrade. On an adjusted basis, removing
the impact of these one-time charges, operating expenses were up
$6.1 million sequentially from Q1 of FY19 and increased $12.8 million
year-over-year.
As a percent of total revenue, our operating expenses, again
excluding stock-based compensation, increased 2.7 percentage
points from 19.1% of revenue in Q2 of FY18 to 21.8% of revenue in Q2
of FY19.
Net Loss and Adjusted EBITDA
Net loss for Q2 of FY19 was $62.2 million. The results for Q2 of FY19
included $51.2 million of stock-based compensation expenses related
to stock grants issued at the time of our IPO.
The change from our Q2 of FY19 estimates to the Q2 of FY19 actuals
for the PPA II upgrade had no impact to our net loss or EPS.
Adjusted EBITDA for Q2 of FY19 was $21.9 million. When compared
to Q2 of FY18 adjusted EBITDA, which was $12.5 million, Q2 of FY19’s
adjusted EBITDA increased $9.4 million.
Adjusting for the change from our Q2 of FY19 estimates for the PPA
II upgrade, adjusted EBITDA was $12.8 million.
Free Cash Flow
Our cash position, including restricted cash, increased sequentially by
$1.2 million in Q2 of FY19. We calculate free cash flow as cash flow
from operations less capital expenditures. For Q2 of FY19, we
achieved free cash flow of $108.9 million. Included in this amount are
proceeds that were used to pay down debt and equity with our PPA
II upgrade project.

9
Estimates
Our outlook for key metrics for Q3 of FY19:
Q3 FY19
Acceptances (100 kW units) 280 to 310
Average Sales Price (dollars-per-kilowatt) $6,300 to $6,600
Total Installed System Cost (dollars-per-kilowatt) $4,125 to $4,425
This outlook is subject to a number of risks and uncertainties and
actual results may differ materially due to a variety of factors, as
more clearly outlined in the “Forward-Looking Statements” section of
this letter.
Summary
Q2 was characterized by continued execution of our current business
plan of growth and cost reduction, but with an eye toward the future.
We announced another world-class strategic financing partner with
Duke Energy One. Additionally, we introduced our hydrogen powered
fuel cell solution that can become a key part of a zero carbon-based
distributed energy solution. Finally, we also delivered financial results in
line with expectations.
With the tailwinds that we see in the current marketplace and the ever-
growing need for reliable, always-on power, we are excited for the rest
of FY19, as we continue on our mission to deliver clean, reliable and
affordable energy to everyone in the world.
Sincerely,
KR Sridhar, Founder, Chairman and Chief Executive Officer
Randy Furr, Chief Financial Officer
10
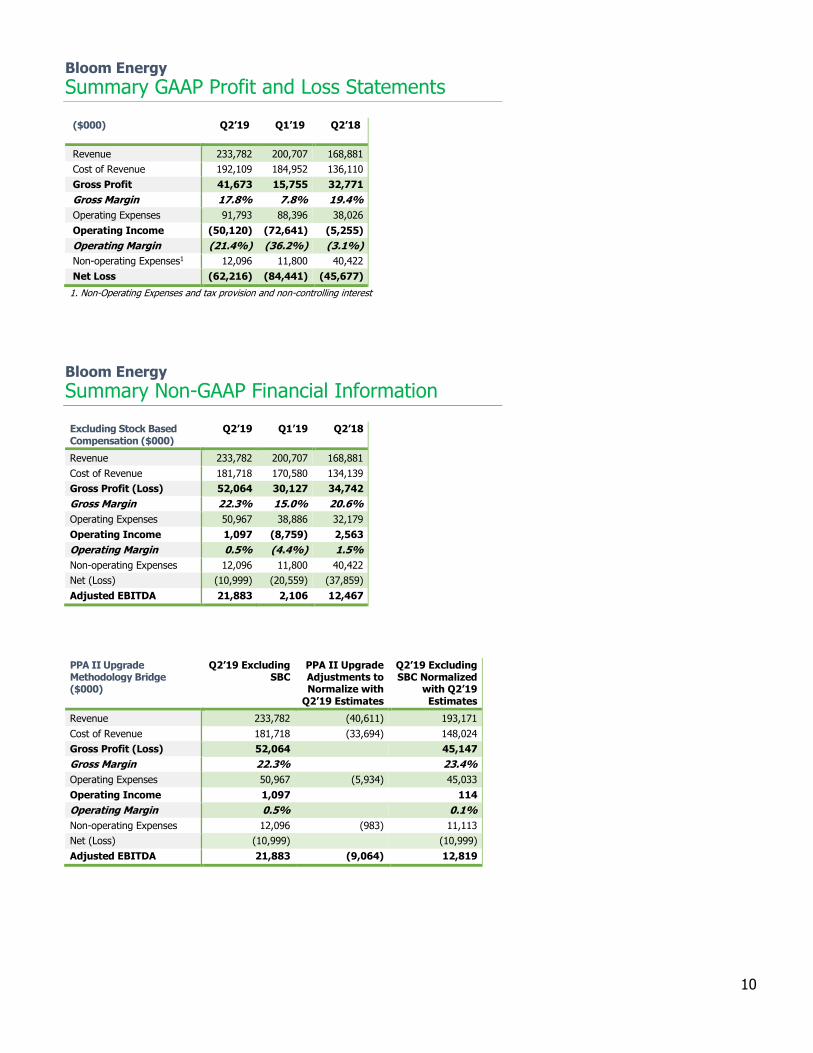
Bloom Energy
Summary GAAP Profit and Loss Statements
($000) Q2’19 Q1’19 Q2’18
Revenue 233,782 200,707 168,881
Cost of Revenue 192,109 184,952 136,110
Gross Profit 41,673 15,755 32,771
Gross Margin 17.8% 7.8% 19.4%
Operating Expenses 91,793 88,396 38,026
Operating Income (50,120) (72,641) (5,255)
Operating Margin (21.4%) (36.2%) (3.1%)
Non-operating Expenses1 12,096 11,800 40,422
Net Loss (62,216) (84,441) (45,677)
1. Non-Operating Expenses and tax provision and non-controlling interest
Bloom Energy
Summary Non-GAAP Financial Information
Excluding Stock Based Compensation ($000)
Q2’19 Q1’19 Q2’18
Revenue 233,782 200,707 168,881
Cost of Revenue 181,718 170,580 134,139
Gross Profit (Loss) 52,064 30,127 34,742
Gross Margin 22.3% 15.0% 20.6%
Operating Expenses 50,967 38,886 32,179
Operating Income 1,097 (8,759) 2,563
Operating Margin 0.5% (4.4%) 1.5%
Non-operating Expenses 12,096 11,800 40,422
Net (Loss) (10,999) (20,559) (37,859)
Adjusted EBITDA 21,883 2,106 12,467
PPA II Upgrade Methodology Bridge ($000)
Q2’19 Excluding SBC
PPA II Upgrade Adjustments to Normalize with
Q2’19 Estimates
Q2’19 Excluding SBC Normalized
with Q2’19 Estimates
Revenue 233,782 (40,611) 193,171
Cost of Revenue 181,718 (33,694) 148,024
Gross Profit (Loss) 52,064 45,147
Gross Margin 22.3% 23.4%
Operating Expenses 50,967 (5,934) 45,033
Operating Income 1,097 114
Operating Margin 0.5% 0.1%
Non-operating Expenses 12,096 (983) 11,113
Net (Loss) (10,999) (10,999)
Adjusted EBITDA 21,883 (9,064) 12,819

11
Stock-Based Compensation Bridge ($000)
Q2’19 Q1’19 Q2’18
Gross Profit (Loss) 41,673 15,755 32,771
Stock-based compensation-Cost of Revenue
10,391 14,372 1,971
Gross Profit – excluding SBC
52,064 30,127 34,742
Operating Expenses 91,793 88,396 38,026
Stock-based compensation-Operating Expenses
40,826 49,510 5,847
Operating Expenses -excluding SBC
50,967 38,886 32,179
Upfront Ongoing Total
Q2’19 Non GAAP Financial Information $’000
Product + Install
Service Product +
Install Electricity
Total Ongoing
Q2’19
Acceptances (100kW) 271 0 271
Revenue 195,191 23,659 1,993 12,939 38,591 233,782
Cost of Revenue 142,921 18,384 1,971 18,442 38,797 181,718
Gross Profit 52,270 5,275 22 (5,503) (206) 52,064
Opex 50,967
Operating Income 1,097
Product & Install Unit Economics ($/kW)
Q2’19 Q2’19 Normalized with Q2’19
Estimates
Q1’19 Q2’18
ASP 7,203 5,704 6,870 7,093
TISC1 5,274 4,329 5,658 5,607
Profit (Loss) 1,929 1,375 1,212 1,486
1. Total installed system cost is a cost metric to approximate the product and install cost of goods sold on a per kilowatt basis
Working Capital Metrics
Q2’19 Q1’19 Q2’18
Days of Sales 24 38 26
Days of Inventory 73 70 85
Days of Payables 37 35 35

12
Bloom Energy
Servers have
been deployed at
approximately
600 locations
across diverse
industries in
four countries.

13
Bloom Energy
Condensed Consolidated Balance Sheet (unaudited) (in thousands)
June 30, December 31,
2019 2018
Assets
Current assets:
Cash and cash equivalents $ 308,009 $ 220,728
Restricted cash 23,706 28,657
Short-term investments — 104,350
Accounts receivable 38,296 84,887
Inventories 104,934 132,476
Deferred cost of revenue 86,434 62,147
Customer financing receivable 5,817 5,594
Prepaid expense and other current assets 25,088 33,742
Total current assets 592,284 672,581
Property, plant and equipment, net 406,610 481,414
Customer financing receivable, non-current 64,146 67,082
Restricted cash, non-current 39,351 31,100
Deferred cost of revenue, non-current 59,213 102,699
Other long-term assets 60,975 34,792
Total assets $ 1,222,579 $ 1,389,668
Liabilities, Redeemable Noncontrolling Interest, Stockholders’ Deficit and Noncontrolling Interests
Current liabilities:
Accounts payable $ 61,427 $ 66,889
Accrued warranty 12,393 19,236
Accrued other current liabilities 109,722 69,535
Deferred revenue and customer deposits 129,321 94,158
Current portion of recourse debt 15,681 8,686
Current portion of non-recourse debt 7,654 18,962
Current portion of non-recourse debt from related parties 2,889 2,200
Total current liabilities 339,087 279,666
Derivative liabilities, net of current portion 13,079 10,128
Deferred revenue and customer deposits, net of current portion 181,221 241,794
Long-term portion of recourse debt 362,424 360,339
Long-term portion of non-recourse debt 219,182 289,241
Long-term portion of recourse debt from related parties 27,734 27,734
Long-term portion of non-recourse debt from related parties 32,643 34,119
Other long-term liabilities 58,417 55,937
Total liabilities 1,233,787 1,298,958
Redeemable noncontrolling interest 505 57,261
Stockholders’ deficit (115,785 ) (91,661 )
Noncontrolling interest 104,072 125,110
Total liabilities, redeemable noncontrolling interest, stockholders' deficit and noncontrolling interest $ 1,222,579 $ 1,389,668

14
Bloom Energy
Condensed Consolidated Statement of Operations (unaudited) (in thousands, except per share data)
Three Months Ended June 30, 2019 June 30, 2018
Revenue:
Product $ 179,899 $ 108,654
Installation 17,285 26,245
Service 23,659 19,975
Electricity 12,939 14,007
Total revenue 233,782 168,881
Cost of revenue:
Product 131,952 70,802
Installation 22,116 37,099
Service 19,599 19,260
Electricity 18,442 8,949
Total cost of revenue 192,109 136,110
Gross profit 41,673 32,771
Operating expenses:
Research and development 29,772 14,413
Sales and marketing 18,359 8,254
General and administrative 43,662 15,359
Total operating expenses 91,793 38,026
Gain (loss) from operations (50,120 ) (5,255)
Interest income 1,700 444
Interest expense (16,725 ) (22,525 )
Interest expense to related parties (1,606 ) (2,672 )
Other income (expense), net (222) (855 )
Loss on revaluation of warrant liabilities and embedded derivatives — (19,198 )
Net loss before income taxes (66,973 ) (50,061 )
Income tax provision 258 128
Net loss (67,231 ) (50,189 )
Net loss attributable to noncontrolling interests and redeemable noncontrolling interests (5,015 ) (4,512 )
Net loss attributable to Class A and Class B common stockholders $ (62,216 ) $ (45,677 )
Net loss per share attributable to Class A and Class B common stockholders, basic and diluted $ (0.55 ) $ (4.34 )
Weighted average shares used to compute net loss per share attributable to Class A and Class B common stockholders, basic and diluted 133,622
10,536
15
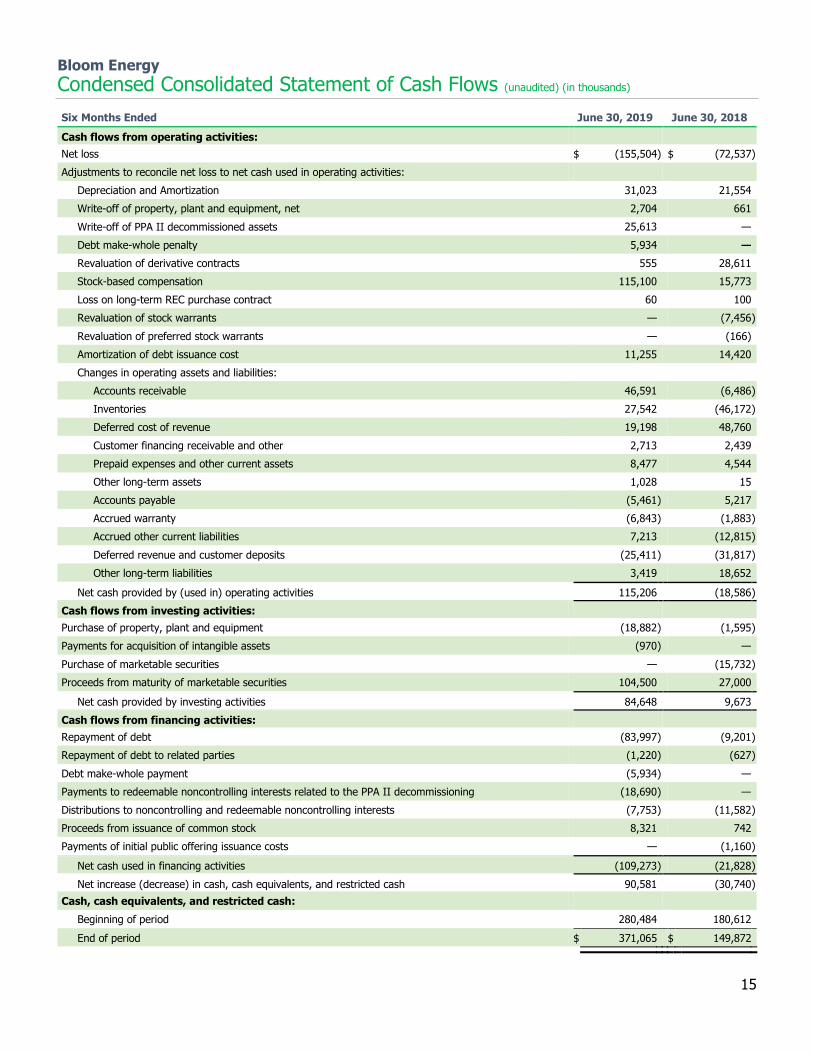
Bloom Energy
Condensed Consolidated Statement of Cash Flows (unaudited) (in thousands)
Six Months Ended June 30, 2019 June 30, 2018
Cash flows from operating activities:
Net loss $ (155,504 ) $ (72,537 )
Adjustments to reconcile net loss to net cash used in operating activities:
Depreciation and Amortization 31,023 21,554
Write-off of property, plant and equipment, net 2,704 661
Write-off of PPA II decommissioned assets 25,613 —
Debt make-whole penalty 5,934 —
Revaluation of derivative contracts 555 28,611
Stock-based compensation 115,100 15,773
Loss on long-term REC purchase contract 60 100
Revaluation of stock warrants — (7,456 )
Revaluation of preferred stock warrants — (166)
Amortization of debt issuance cost 11,255 14,420
Changes in operating assets and liabilities:
Accounts receivable 46,591 (6,486 )
Inventories 27,542 (46,172 )
Deferred cost of revenue 19,198 48,760
Customer financing receivable and other 2,713 2,439
Prepaid expenses and other current assets 8,477 4,544
Other long-term assets 1,028 15
Accounts payable (5,461 ) 5,217
Accrued warranty (6,843 ) (1,883 )
Accrued other current liabilities 7,213 (12,815 )
Deferred revenue and customer deposits (25,411 ) (31,817 )
Other long-term liabilities 3,419 18,652
Net cash provided by (used in) operating activities 115,206 (18,586 )
Cash flows from investing activities:
Purchase of property, plant and equipment (18,882 ) (1,595 )
Payments for acquisition of intangible assets (970 ) —
Purchase of marketable securities — (15,732 )
Proceeds from maturity of marketable securities 104,500 27,000
Net cash provided by investing activities 84,648 9,673
Cash flows from financing activities:
Repayment of debt (83,997 ) (9,201 )
Repayment of debt to related parties (1,220 ) (627 )
Debt make-whole payment (5,934 ) —
Payments to redeemable noncontrolling interests related to the PPA II decommissioning (18,690 ) —
Distributions to noncontrolling and redeemable noncontrolling interests (7,753 ) (11,582 )
Proceeds from issuance of common stock 8,321 742
Payments of initial public offering issuance costs — (1,160 )
Net cash used in financing activities (109,273 ) (21,828 )
Net increase (decrease) in cash, cash equivalents, and restricted cash 90,581 (30,740 )
Cash, cash equivalents, and restricted cash:
Beginning of period 280,484 180,612
End of period $ 371,065 $ 149,872

16
Bloom Energy
Reconciliation of GAAP to Non-GAAP Financial Measures (Unaudited) (In Thousands)
Gross Margin to Gross Margin Excluding Stock Based Compensation
Gross margin excluding stock based compensation (SBC) is a supplemental measure of operating performance that does not represent
and should not be considered an alternative to gross margin, as determined under GAAP. This measure removes the impact of stock
based compensation. We believe that gross margin excluding stock based compensation supplements the GAAP measure and enables
us to more effectively evaluate our performance period-over-period. A reconciliation of gross margin excluding stock based
compensation to gross margin, the most directly comparable GAAP measure, and the computation of gross margin excluding stock
based compensation are as follows:
Q2’19 Q1’19 Q2’18
Revenue 233,782 200,707 168,881
Gross Profit 41,673 15,755 32,771
Gross Margin % 17.8% 7.8% 19.4%
Stock-based compensation (Cost of Revenue) 10,391 14,372 1,971
Gross Profit excluding SBC 52,064 30,127 34,742
Gross Margin excluding SBC % 22.3% 15.0% 20.6%
Operating Income to Operating Income Excluding Stock Based Compensation
Operating income excluding stock based compensation is a supplemental measure of operating performance that does not represent
and should not be considered an alternative to operating income, as determined under GAAP. This measure removes the impact of
stock based compensation. We believe that operating income excluding stock based compensation supplement the GAAP measure and
enable us to more effectively evaluate our performance period-over-period. A reconciliation of operating income excluding stock based
compensation to operating income, the most directly comparable GAAP measure, and the computation of operating income excluding
stock based compensation are as follows:
Q2’19 Q1’19 Q2’18
Operating Income (50,120) (72,641) (5,255)
Stock-based compensation 51,217 63,882 7,818
Operating Income excluding SBC 1,097 (8,759) 2,563
17
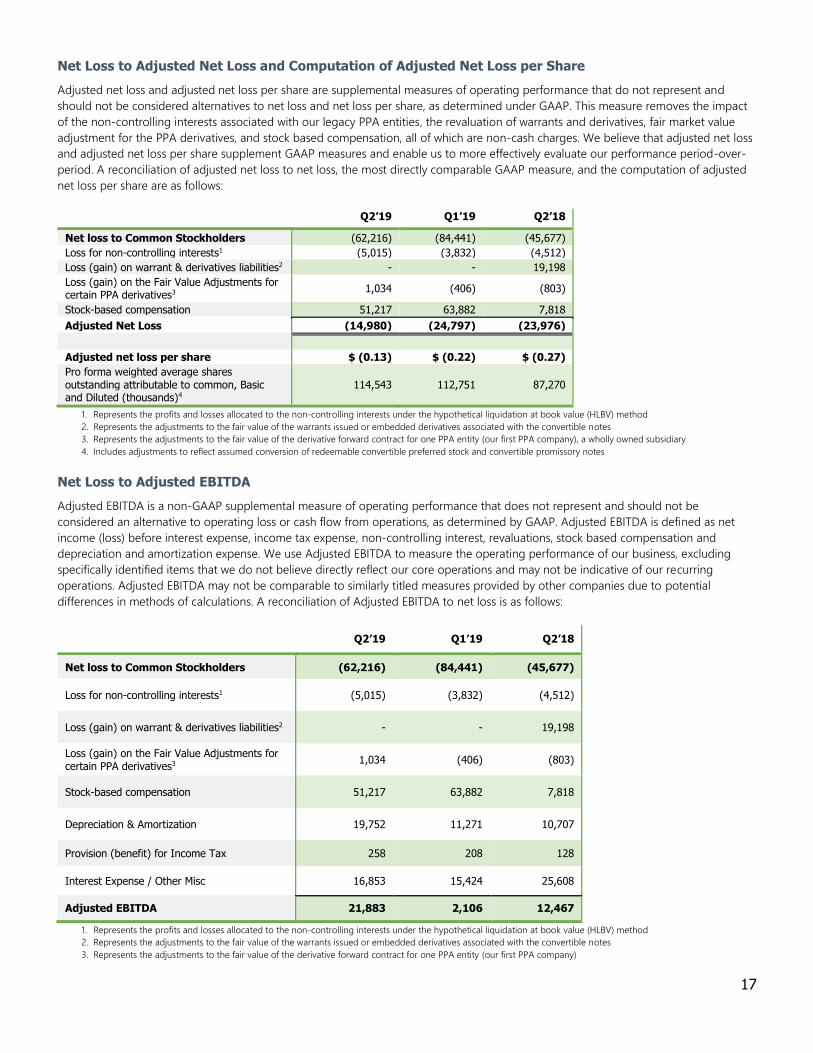
Net Loss to Adjusted Net Loss and Computation of Adjusted Net Loss per Share
Adjusted net loss and adjusted net loss per share are supplemental measures of operating performance that do not represent and
should not be considered alternatives to net loss and net loss per share, as determined under GAAP. This measure removes the impact
of the non-controlling interests associated with our legacy PPA entities, the revaluation of warrants and derivatives, fair market value
adjustment for the PPA derivatives, and stock based compensation, all of which are non-cash charges. We believe that adjusted net loss
and adjusted net loss per share supplement GAAP measures and enable us to more effectively evaluate our performance period-over-
period. A reconciliation of adjusted net loss to net loss, the most directly comparable GAAP measure, and the computation of adjusted
net loss per share are as follows:
Q2’19 Q1’19 Q2’18
Net loss to Common Stockholders (62,216) (84,441) (45,677)
Loss for non-controlling interests1 (5,015) (3,832) (4,512)
Loss (gain) on warrant & derivatives liabilities2 - - 19,198
Loss (gain) on the Fair Value Adjustments for certain PPA derivatives3
1,034 (406) (803)
Stock-based compensation 51,217 63,882 7,818
Adjusted Net Loss (14,980) (24,797) (23,976)
Adjusted net loss per share $ (0.13) $ (0.22) $ (0.27)
Pro forma weighted average shares outstanding attributable to common, Basic and Diluted (thousands)4
114,543 112,751 87,270
1. Represents the profits and losses allocated to the non-controlling interests under the hypothetical liquidation at book value (HLBV) method
2. Represents the adjustments to the fair value of the warrants issued or embedded derivatives associated with the convertible notes
3. Represents the adjustments to the fair value of the derivative forward contract for one PPA entity (our first PPA company), a wholly owned subsidiary
4. Includes adjustments to reflect assumed conversion of redeemable convertible preferred stock and convertible promissory notes
Net Loss to Adjusted EBITDA
Adjusted EBITDA is a non-GAAP supplemental measure of operating performance that does not represent and should not be
considered an alternative to operating loss or cash flow from operations, as determined by GAAP. Adjusted EBITDA is defined as net
income (loss) before interest expense, income tax expense, non-controlling interest, revaluations, stock based compensation and
depreciation and amortization expense. We use Adjusted EBITDA to measure the operating performance of our business, excluding
specifically identified items that we do not believe directly reflect our core operations and may not be indicative of our recurring
operations. Adjusted EBITDA may not be comparable to similarly titled measures provided by other companies due to potential
differences in methods of calculations. A reconciliation of Adjusted EBITDA to net loss is as follows:
Q2’19 Q1’19 Q2’18
Net loss to Common Stockholders (62,216) (84,441) (45,677)
Loss for non-controlling interests1 (5,015) (3,832) (4,512)
Loss (gain) on warrant & derivatives liabilities2 - - 19,198
Loss (gain) on the Fair Value Adjustments for certain PPA derivatives3
1,034 (406) (803)
Stock-based compensation 51,217 63,882 7,818
Depreciation & Amortization 19,752 11,271 10,707
Provision (benefit) for Income Tax 258 208 128
Interest Expense / Other Misc 16,853 15,424 25,608
Adjusted EBITDA 21,883 2,106 12,467
1. Represents the profits and losses allocated to the non-controlling interests under the hypothetical liquidation at book value (HLBV) method
2. Represents the adjustments to the fair value of the warrants issued or embedded derivatives associated with the convertible notes
3. Represents the adjustments to the fair value of the derivative forward contract for one PPA entity (our first PPA company)
18
Safe Harbor Statement / Forward-Looking Statements
This letter may be deemed to contain forward-looking statements, which are subject to the safe harbor
provisions of the Private Securities Litigation Reform Act of 1995. These forward-looking statements include,
among other things, statements regarding our strategies, trends and expected expansion and estimates of
future acceptances, Average Sales Price and Total Installed System Costs. Readers are cautioned that these
forward-looking statements are only predictions and may differ materially from actual future events or results
due to a variety of factors including, but not limited to, our limited operating history, the emerging nature of
the distributed generation market, the significant losses we have incurred in the past, the significant upfront
costs of our Energy Servers, the risk of manufacturing defects, the accuracy of our estimates regarding the
useful life of our Energy Servers, the availability of rebates, tax credits and other tax benefits, our reliance on tax
equity financing arrangements, our reliance upon a limited number of customers, our lengthy sales and
installation cycle, construction, utility interconnection and other delays and cost overruns related to the
installation of our Energy Servers, business and economic conditions and growth trends in commercial and
industrial energy markets, global economic conditions and uncertainties in the geopolitical environment; overall
electricity generation market and other risks and uncertainties.
You should not rely upon forward-looking statements as predictions of future events. Although we believe that
the expectations reflected in our forward-looking statements are reasonable, we cannot guarantee that the
future results, performance, or events and circumstances described in the forward-looking statements will be
achieved or occur. Moreover, neither we, nor any other person (including any potential underwriter of our
securities), assume responsibility for the accuracy and completeness of the forward-looking statements. We
undertake no obligation to update any forward-looking statements for any reason after the date of this
presentation to conform these statements to actual results or to changes in our expectations, except as
required by law.
These forward-looking statements should also be read in conjunction with the other cautionary statements that
are included elsewhere in our public filings, including under the heading “Risk Factors” in the Company’s
Quarterly Report on Form 10-Q for the quarter ended March 31, 2019 and subsequent filings with the SEC.
These statements were made as of August 12, 2019, and reflect management’s views and expectations at that
time. We disclaim any obligation to update or revise any forward-looking statements in this letter to reflect
subsequent events, actual results or changes in our expectations.
This letter includes certain non-GAAP financial measures as defined by SEC rules. These non-GAAP financial
measures are in addition to, and not a substitute for or superior to, measures of financial performance
prepared in accordance with U.S. GAAP. There are a number of limitations related to the use of these non-
GAAP financial measures versus their nearest GAAP equivalents. For example, other companies may calculate
non-GAAP financial measures differently or may use other measure to evaluate their performance, all of which
could reduce the usefulness of our non-GAAP financial measures as tools for comparison. We urge you to
review the reconciliations of our non-GAAP financial measures to the most directly comparable U.S. GAAP
financial measures set forth in this letter, and not to rely on any single financial measure to evaluate our
business.