q2 2021 supplemental information
TRANSCRIPT

1Newell Brands Quarterly Earnings
Q2 2021 Supplemental Information

2© Newell Brands
Forward Looking StatementsSome of the statements in this presentation and its exhibits, particularly those anticipating future financial performance, business prospects, growth, operating strategies, the impact of the COVID-19 pandemic andsimilar matters, are forward-looking statements within the meaning of the U.S. Private Securities Litigation Reform Act of 1995. These statements generally can be identified by the use of words or phrases,including, but not limited to, "guidance", "outlook", “intend,” “anticipate,” “believe,” “estimate,” “project,” “target,” “plan,” “expect,” “setting up,” "beginning to,” “will,” “should,” “would,” "could," “resume,” “are confident that,”"remain optimistic," or similar statements. We caution that forward-looking statements are not guarantees because there are inherent difficulties in predicting future results. Actual results may differ materially fromthose expressed or implied in the forward-looking statements, including the impairment charges and accounting for income taxes. Important factors that could cause actual results to differ materially from thosesuggested by the forward-looking statements include, but are not limited to:
• our ability to manage the demand, supply and operational challenges with the actual or perceived effects of the COVID-19 pandemic, including as a result of any additional variants of the virus or the efficacy anddistribution of vaccines;
• our dependence on the strength of retail, commercial and industrial sectors of the economy in various countries around the world;• competition with other manufacturers and distributors of consumer products;• major retailers’ strong bargaining power and consolidation of our customers;• changes in the prices and availability of labor, transportation, raw materials and sourced products, including significant inflation, and our ability to obtain them in a timely manner;• our ability to improve productivity, reduce complexity and streamline operations;• our ability to develop innovative new products, to develop, maintain and strengthen end-user brands and to realize the benefits of increased advertising and promotion spend;• our ability to consistently maintain effective internal control over financial reporting;• risks related to our substantial indebtedness, potential increases in interest rates or changes in our credit ratings;• future events that could adversely affect the value of our assets and/or stock price and require additional impairment charges;• unexpected costs or expenses associated with divestitures;• our ability to effectively execute our turnaround plan;• the impact of governmental investigations, inspections, lawsuits, legislative requests or other actions by third parties;• the risks inherent to our foreign operations, including currency fluctuations, exchange controls and pricing restrictions;• a failure or breach of one of our key information technology systems, networks, processes or related controls or those of our service providers;• the impact of U.S. and foreign regulations on our operations, including the impact of tariffs and environmental remediation costs;• the potential inability to attract, retain and motivate key employees;• the resolution of tax contingencies resulting in additional tax liabilities;• product liability, product recalls or related regulatory actions;• our ability to protect intellectual property rights;• significant increases in funding obligations related to our pension plans; and• other factors listed from time to time in our filings with the SEC, including, but not limited to, our Annual Report on Form 10-K and our other SEC filings.
The consolidated condensed financial statements are prepared in conformity with accounting principles generally accepted in the United States (“U.S. GAAP”). Management’s application of U.S. GAAP requires thepervasive use of estimates and assumptions in preparing the unaudited condensed consolidated financial statements. As discussed above, the world is currently experiencing the global COVID-19 pandemic whichhas required greater use of estimates and assumptions in the preparation of our condensed consolidated financial statements. Although we have made our best estimates based upon current information, theeffects of the COVID-19 pandemic on our business may result in future changes to management’s estimates and assumptions, especially if the severity worsens or duration lengthens. Actual results may differmaterially from the estimates and assumptions developed by management. If so, the company may be subject to future incremental impairment charges as well as changes to recorded reserves and valuations.
The information contained in this presentation and the tables is as of the date indicated. The company assumes no obligation to update any forward-looking statements as a result of newinformation, future events or developments.
This presentation and the accompanying remarks contain non-GAAP measures. An explanation of most directly comparable GAAP measures and if available, reconciliations to U.S. GAAP are contained in theAppendix.

3© Newell Brands
Q2 2021 TakeawaysStrong Q2 results, including core sales growth in all eight business units and all geographic regions, building on underlying momentum from the last three quarters
Lapped year-ago period that included significant COVID-19 disruption across the business
Overall healthy consumption trends in the U.S. relative to 2020 and 2019 levels, even as some categories moderated
Significant normalized operating margin expansion driven by operating leverage from top line growth, FUEL productivity savings, favorable business mix, pricing and tight cost controls, which offset significant inflationary headwinds and an increase in A&P spending
Improved cash conversion cycle and leverage ratio versus year ago and ended Q2 with a leverage ratio close to evergreen target
Initiating outlook for Q3 and updating full year 2021 outlook

4© Newell Brands
Q2 2021 Financial Highlights
Leverage ratio is defined as the ratio of net debt to normalized EBITDA from continuing operations. An explanation of how the leverage ratio is calculated and a related reconciliation, as well as a reconciliation of reported results to normalized results, are in the Appendix.
CCC: Cash Conversion Cycle
$2.7BNET SALES
__._%NORMALIZED OPERATING
MARGIN
3.1xLEVERAGE
RATIO
+240 bps YoY vs. 4.6x in Q2’20
$0.56NORMALIZED
EARNINGS PER SHARE
+87% YoY
12.6%NORMALIZED OPERATING
MARGIN
+25.4% Core Sales
$76MYTD OPERATING
CASH FLOW
CCC down ~14 days

5© Newell Brands
Q2 2021 Core Sales Growth by Region
NA21.8%
EMEA29.2%
LATAM55.3%
APAC28.4%
Markets Outside NA 34.8%
6© Newell Brands
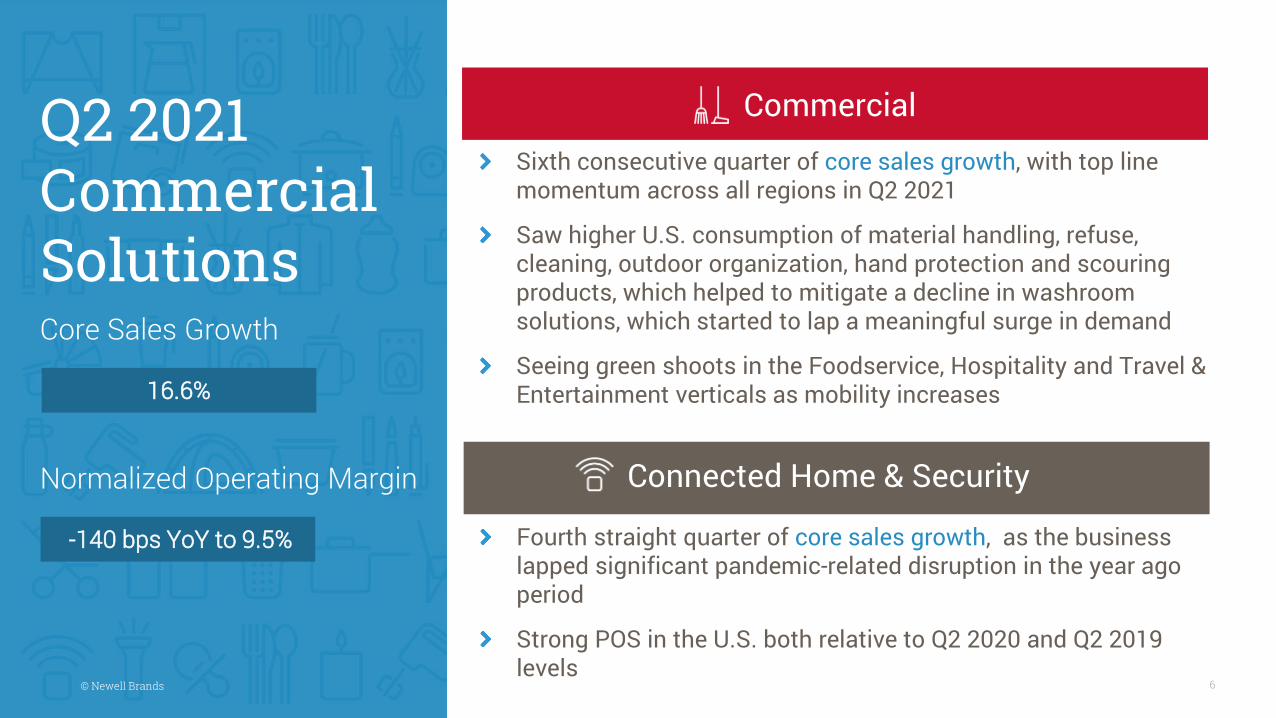
Q2 2021 Commercial Solutions
Commercial
Connected Home & Security
Core Sales Growth
Normalized Operating Margin
16.6%
-140 bps YoY to 9.5%
Sixth consecutive quarter of core sales growth, with top line momentum across all regions in Q2 2021
Saw higher U.S. consumption of material handling, refuse, cleaning, outdoor organization, hand protection and scouring products, which helped to mitigate a decline in washroom solutions, which started to lap a meaningful surge in demand
Seeing green shoots in the Foodservice, Hospitality and Travel & Entertainment verticals as mobility increases
Fourth straight quarter of core sales growth, as the business lapped significant pandemic-related disruption in the year ago period
Strong POS in the U.S. both relative to Q2 2020 and Q2 2019 levels

7© Newell Brands
Q2 2021 Home Appliances
Home Appliances
Core Sales Growth
Normalized Operating Margin
15.3%
+210 bps YoY to 4.8%
Fifth consecutive quarter of core sales growth, largely driven by strong top line momentum in Latin America in Q2 2021
As anticipated, U.S. consumption moderated from the surge in the prior-year period, although remains meaningfully ahead of the 2019 levels
Expanding distribution of Mr. Coffee Iced, which continues to see strong traction
8© Newell Brands
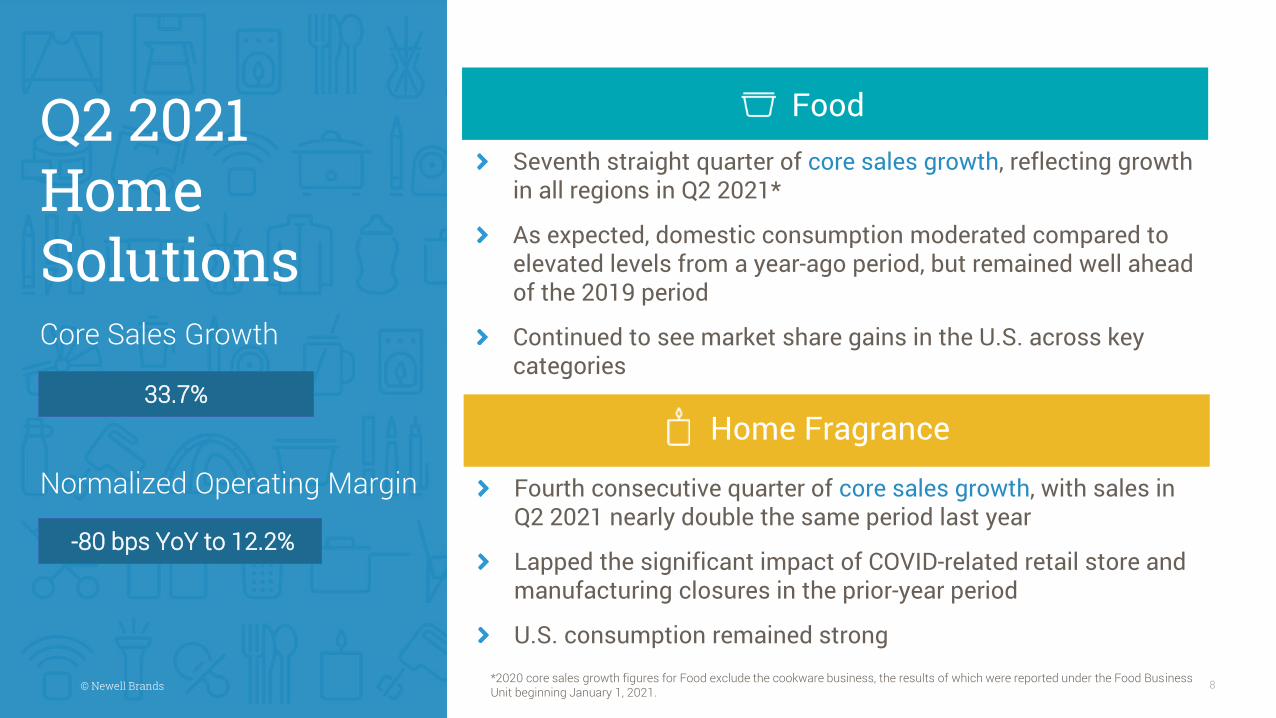
Q2 2021 Home Solutions
Food
Home Fragrance
Core Sales Growth
Normalized Operating Margin
33.7%
-80 bps YoY to 12.2%
Seventh straight quarter of core sales growth, reflecting growth in all regions in Q2 2021*
As expected, domestic consumption moderated compared to elevated levels from a year-ago period, but remained well ahead of the 2019 period
Continued to see market share gains in the U.S. across key categories
Fourth consecutive quarter of core sales growth, with sales in Q2 2021 nearly double the same period last year
Lapped the significant impact of COVID-related retail store and manufacturing closures in the prior-year period
U.S. consumption remained strong*2020 core sales growth figures for Food exclude the cookware business, the results of which were reported under the Food Business Unit beginning January 1, 2021.

9© Newell Brands
Q2 2021 Learning & Development
Baby & Parenting
Writing
Core Sales Growth
Normalized Operating Margin
31.6%
+550 bps YoY to 25.9%
Fourth straight quarter of core sales growth, with broad-based growth across all regions in Q2 2021
Strong domestic consumption, in part reflecting stimulus-related spending
Gained market share in baby gear in the U.S.
Second consecutive quarter of core sales growth, reflecting a rebound in the market and market share gains in the U.S.
Strong U.S. consumption accelerated on a sequential basis, with continued momentum in everyday writing and labeling
Remain optimistic about back-to-school season with robust merchandising plans in place

10© Newell Brands
Q2 2021 Outdoor & Recreation
Outdoor & Recreation
Core Sales Growth
Normalized Operating Margin
25.0%
+220 bps YoY to 11.5%
Second consecutive quarter of core sales growth, with all regions growing double digits in Q2 2021
Continued strength in Outdoor Equipment, with a resurgence in Technical Apparel and Beverage businesses, as COVID headwinds abate
Healthy domestic consumption

11© Newell Brands
2021 Assumptions
Major Assumptions
Strong FUEL productivity
Fixed cost leverage frombetter top line growth
Favorable foreign exchange
Inflation now projected at $560 million and taking additional mitigation actions
Higher YoY A&P investment
Higher tax rate YoY
COVID uncertainty continues throughout 2021
More normal back-to-school
Status quo external supply chain dynamics

12© Newell Brands
Q3 2021 Outlook
Q3 2021Outlook
Net Sales $2.7 to $2.78 billion
Core Sales Flat to 3% growth
Normalized Operating Margin 10.3% to 10.8%
Normalized EPS $0.46 to $0.50
The company has presented forward-looking statements regarding normalized operating margin and normalized earnings per share. These non-GAAP financial measures are derived by excluding certain amounts,expenses or income from the corresponding financial measures determined in accordance with GAAP. The determination of the amounts that are excluded from these non-GAAP financial measures is a matter ofmanagement judgement and depends upon, among other factors, the nature of the underlying expense or income amounts recognized in a given period. We are unable to present a quantitative reconciliation offorward-looking normalized operating margin or normalized earnings per share to their most directly comparable forward-looking GAAP financial measures because such information is not available, andmanagement cannot reliably predict all of the necessary components of such GAAP measures without unreasonable effort or expense. In addition, we believe such reconciliations would imply a degree of precisionthat would be confusing or misleading to investors. The unavailable information could have a significant impact on the company's future financial results. These non-GAAP financial measures are preliminaryestimates and are subject to risks and uncertainties, including, among others, changes in connection with quarter-end and year-end adjustments. Any variation between the company's actual results and preliminaryfinancial data set forth above may be material.

13© Newell Brands
Full Year 2021 Outlook
Previous 2021 Full Year Outlook
Updated 2021 Full Year Outlook
Net Sales $9.9 to $10.1 billion $10.1 to $10.35 billion
Core Sales 5% to 7% growth 7% to 10% growth
Normalized Operating Margin 11.4% to 11.7% ~11.1%
Normalized EPS $1.63 to $1.73 $1.63 to $1.73
Operating Cash Flow ~$1.0 billion ~$1.0 billion
The company has presented forward-looking statements regarding normalized operating margin and normalized earnings per share. These non-GAAP financial measures are derived by excluding certain amounts,expenses or income from the corresponding financial measures determined in accordance with GAAP. The determination of the amounts that are excluded from these non-GAAP financial measures is a matter ofmanagement judgement and depends upon, among other factors, the nature of the underlying expense or income amounts recognized in a given period. We are unable to present a quantitative reconciliation offorward-looking normalized operating margin or normalized earnings per share to their most directly comparable forward-looking GAAP financial measures because such information is not available, andmanagement cannot reliably predict all of the necessary components of such GAAP measures without unreasonable effort or expense. In addition, we believe such reconciliations would imply a degree of precisionthat would be confusing or misleading to investors. The unavailable information could have a significant impact on the company's future financial results. These non-GAAP financial measures are preliminaryestimates and are subject to risks and uncertainties, including, among others, changes in connection with quarter-end and year-end adjustments. Any variation between the company's actual results and preliminaryfinancial data set forth above may be material.

14© Newell Brands
Recent Product Launches
15© Newell Brands
Appendix
Non-GAAP Reconciliations

16© Newell Brands
Non-GAAP InformationThis presentation contains non-GAAP financial measures within the meaning of Regulation G promulgated by the U.S. Securities and Exchange Commission (the "SEC") and includes areconciliation of non-GAAP financial measures to the most directly comparable financial measures calculated in accordance with GAAP.
The company uses certain non-GAAP financial measures that are included in this presentation and the additional financial information both to explain its results to stockholders and theinvestment community and in the internal evaluation and management of its businesses. The company’s management believes that these non-GAAP financial measures and theinformation they provide are useful to investors since these measures (a) permit investors to view the company’s performance and liquidity using the same tools that management uses toevaluate the company’s past performance, reportable business segments, prospects for future performance and liquidity, and (b) determine certain elements of management incentivecompensation.
The company’s management believes that core sales provides a more complete understanding of underlying sales trends by providing sales on a consistent basis as it excludes theimpacts of acquisitions, planned and completed divestitures, retail store openings and closings, certain market exits, impact of customer returns related to a product recall in Outdoor andRecreation segment, and changes in foreign exchange from year-over-year comparisons. The effect of changes in foreign exchange on reported sales is calculated by applying the prior yearaverage monthly exchange rates to the current year local currency sales amounts (excluding acquisitions and divestitures), with the difference between the 2020 reported sales andconstant currency sales presented as the foreign exchange impact increase or decrease in core sales. The company’s management believes that “normalized” gross margin, “normalized”operating income, “normalized” operating margin, "normalized EBITDA," "normalized EBITDA from continuing operations," “normalized” net income, “normalized” diluted earnings per share,“normalized” interest and “normalized” tax benefits, which exclude restructuring and restructuring-related expenses and one-time and other events such as costs related to theextinguishment of debt, certain tax benefits and charges, impairment charges, pension settlement charges, divestiture costs, costs related to the acquisition, integration and financing ofacquired businesses, amortization of acquisition-related intangible assets, inflationary adjustments, expenses related to certain product recalls and certain other items, are useful becausethey provide investors with a meaningful perspective on the current underlying performance of the company’s core ongoing operations and liquidity. On a pro forma basis, "normalized"items give effect to the company's decision not to sell the Commercial, Mapa and Quickie businesses. “Normalized EBITDA from continuing operations” is an ongoing liquidity measure (thatexcludes non-cash items) and is calculated as pro forma normalized earnings from continuing operations before interest, tax depreciation, amortization and stock-based compensationexpense. "Leverage ratio" is a liquidity measure calculated as the ratio of net debt (defined as total debt less cash and cash equivalents) to normalized EBITDA from continuing operations."Free cash flow productivity” is calculated as the ratio of free cash flow (calculated as net cash provided by operating activities less capital expenditures) to normalized net income, andthe company believes that free cash flow productivity is an important indicator of liquidity realized from the company’s core ongoing operations.
The company determines the tax effect of the items excluded from normalized diluted earnings per share by applying the estimated effective rate for the applicable jurisdiction in which thepre-tax items were incurred, and for which realization of the resulting tax benefit, if any, is expected. In certain situations in which an item excluded from normalized results impacts incometax expense, the company utilizes a “with” and “without” approach to determine normalized income tax benefit or expense. The company will also exclude one-time tax expenses related to achange in tax status of certain entities and the loss of GILTI tax credits as a result of utilizing the 50% IRC Section 163(j) limit resulting from the CARES Act to determine normalized incometax benefit.
While the company believes these non-GAAP financial measures are useful in evaluating the company’s performance and liquidity, this information should be considered as supplemental innature and not as a substitute for or superior to the related financial information prepared in accordance with GAAP. Additionally, these non-GAAP financial measures may differ fromsimilar measures presented by other companies.

NEWELL BRANDS INC.RECONCILIATION OF GAAP AND NON-GAAP INFORMATION (UNAUDITED)
CORE SALES GROWTH BY SEGMENT
Three Months Ended June 30, 2021 Six Months Ended June 30, 2021
Net Sales(REPORTED)
Acquisitions,Divestitures and
Other, Net [2]
Currency Impact
[3]Core Sales
[1] [4]Net Sales
(REPORTED)
Acquisitions,Divestitures and
Other, Net [2]
Currency Impact
[3]Core Sales
[1] [4]
COMMERCIAL SOLUTIONS 19.4 % — % (2.8) % 16.6 % 16.7 % — % (1.9) % 14.8 %
HOME APPLIANCES 19.4 % — % (4.1) % 15.3 % 27.6 % — % (1.9) % 25.7 %
HOME SOLUTIONS 36.7 % 0.5 % (3.5) % 33.7 % 35.2 % 1.8 % (3.2) % 33.8 %
LEARNING AND DEVELOPMENT 33.8 % 0.7 % (2.9) % 31.6 % 26.1 % 1.4 % (2.4) % 25.1 %
OUTDOOR AND RECREATION 28.3 % — % (3.3) % 25.0 % 19.5 % — % (2.9) % 16.6 %
TOTAL COMPANY 28.3 % 0.3 % (3.2) % 25.4 % 25.0 % 0.8 % (2.5) % 23.3 %
CORE SALES GROWTH BY GEOGRAPHY
Three Months Ended June 30, 2021 Six Months Ended June 30, 2021
Net Sales(REPORTED)
Acquisitions,Divestitures and
Other, Net [2]
Currency Impact
[3]Core Sales
[1] [4]Net Sales
(REPORTED)
Acquisitions,Divestitures and
Other, Net [2]
Currency Impact
[3]Core Sales
[1] [4]
NORTH AMERICA 22.3 % 0.4 % (0.9) % 21.8 % 19.8 % 1.1 % (0.7) % 20.2 %
EUROPE, MIDDLE EAST, AFRICA 42.6 % — % (13.4) % 29.2 % 36.0 % — % (11.8) % 24.2 %
LATIN AMERICA 60.8 % — % (5.5) % 55.3 % 41.6 % — % 4.2 % 45.8 %
ASIA PACIFIC 34.4 % — % (6.0) % 28.4 % 38.7 % — % (8.0) % 30.7 %
INTERNATIONAL [5] 44.6 % — % (9.8) % 34.8 % 38.0 % — % (7.2) % 30.8 %
TOTAL COMPANY 28.3 % 0.3 % (3.2) % 25.4 % 25.0 % 0.8 % (2.5) % 23.3 %
[1] "Core Sales” provides a consistent basis for year-over-year comparisons in sales as it excludes the impacts of acquisitions, completed divestitures, retail store openings and closings, changes in foreign currency.
[2] Divestitures include the exit of the North American distributorship of Uniball® products, current and prior period net sales from retail store closures (consistent with standard retail practice), disposition of the foamboards business and exit from Home Fragrance fundraising business.
[3] “Currency Impact” represents the effect of foreign currency on 2021 reported sales and is calculated by applying the 2020 average monthly exchange rates to the current year local currency sales amounts (excluding acquisitions and divestitures) and comparing to 2021 reported sales.
[4] Totals may not add due to rounding.[5] Markets outside North America.

NEWELL BRANDS INC.RECONCILIATION OF GAAP AND NON-GAAP INFORMATION (UNAUDITED)
CERTAIN LINE ITEMS(Amounts in millions, except per share data)
Three Months Ended June 30, 2021GAAP Restructuring Acquisition Transaction Non-GAAP
Measure and restructuring amortization and costs and MeasureReported related costs [1] impairment [2] other [3] Normalized*
Net sales $ 2,709 $ — $ — $ — $ 2,709 Cost of products sold 1,827 (2) — (1) 1,824 Gross profit 882 2 — 1 885
32.6 % 32.7 %Selling, general and administrative expenses 572 (1) (19) (8) 544
21.1 % 20.1 %Restructuring costs, net 5 (5) — — — Operating income 305 8 19 9 341
11.3 % 12.6 %Non-operating (income) expense 62 — — (3) 59 Income before income taxes 243 8 19 12 282 Income tax provision (benefit) [4] 46 2 4 (9) 43 Net income $ 197 $ 6 $ 15 $ 21 $ 239
Diluted earnings per share ** $ 0.46 $ 0.01 $ 0.04 $ 0.05 $ 0.56
* Normalized results are financial measures that are not in accordance with GAAP and exclude the above normalized adjustments. See below for a discussion of each of these adjustments. **Adjustments and normalized earnings per share are calculated based on diluted weighted average shares of 427.8 million shares for the three months ended June 30, 2021. Totals may not add due to rounding.
[1] Restructuring and restructuring related costs of $8 million.[2] Acquisition amortization costs of $19 million.[3] Other charges of $6 million primarily related to fees for certain legal proceedings; $2 million loss on disposition of businesses; $2 million related to Argentina hyperinflationary adjustment; and $2 million of costs related to completed divestitures. Includes income tax benefit of $12 million related to difference in effective tax rate.[4] The Company determined the tax effect of the items excluded from normalized results by applying the estimated effective rate for the applicable jurisdiction in which the pre-tax items were incurred, and for which realization of the resulting tax benefit, if any, is expected. In certain situations in which an item excluded from normalized results impacts income tax expense, the Company uses a "with" and "without" approach to determine normalized income tax expense.

NEWELL BRANDS INC.RECONCILIATION OF GAAP AND NON-GAAP INFORMATION (UNAUDITED)
CERTAIN LINE ITEMS(Amounts in millions, except per share data)
Three Months Ended June 30, 2020GAAP Restructuring Acquisition Transaction Non-GAAP
Measure and restructuring amortization and costs and MeasureReported related costs [1] impairment [2] other [3] Normalized*
Net sales $ 2,111 $ — $ — $ — $ 2,111 Cost of products sold 1,447 (2) — (2) 1,443 Gross profit 664 2 — 2 668
31.5 % 31.6 %Selling, general and administrative expenses 488 (7) (24) (4) 453
23.1 % 21.5 %Restructuring costs, net 8 (8) — — — Impairment of goodwill, intangibles and other assets 5 — (5) — — Operating income 163 17 29 6 215
7.7 % 10.2 %Non-operating expense 70 1 — 1 72 Income before income taxes 93 16 29 5 143 Income tax provision (benefit) [4] 15 2 4 (5) 16 Net income $ 78 $ 14 $ 25 $ 10 $ 127
Diluted earnings per share ** $ 0.18 $ 0.03 $ 0.06 $ 0.02 $ 0.30
* Normalized results are financial measures that are not in accordance with GAAP and exclude the above normalized adjustments. See below for a discussion of each of these adjustments. **Adjustments and normalized earnings per share are calculated based on diluted weighted average shares of 424.7 million shares for the three months ended June 30, 2020. Totals may not add due to rounding.
[1] Restructuring and restructuring related costs of $16 million.[2] Acquisition amortization costs of $24 million; $5 million of non-cash impairment charges related to the operating leases of Yankee Candle retail store business.[3] Other charges of $3 million primarily related to fees for certain legal proceedings; $2 million of gain due to changes in fair market value of investments; $1 million related to Argentina hyperinflationary adjustment; $1 million due to a product recall; divestiture costs of $1 million primarily related to completed divestitures and loss on disposition of $1 million related to the sale of the Gaming business.[4] The Company determined the tax effect of the items excluded from normalized results by applying the estimated effective rate for the applicable jurisdiction in which the pre-tax items were incurred, and for which realization of the resulting tax benefit, if any, is expected. In certain situations in which an item excluded from normalized results impacts income tax expense, the Company uses a "with" and "without" approach to determine normalized income tax expense.

NEWELL BRANDS INC.RECONCILIATION OF GAAP AND NON-GAAP INFORMATION (UNAUDITED)
FINANCIAL WORKSHEET - SEGMENT REPORTING(Amounts in millions)
Three Months Ended June 30, 2021 Three Months Ended June 30, 2020 Year over year changesReported Reported Normalized Normalized Reported Reported Normalized Normalized Normalized
Operating Operating Normalized Operating Operating Operating Operating Normalized Operating Operating Net Sales Operating Income
Net SalesIncome (Loss) Margin Items [1] Income
(Loss) Margin Net Sales Income (Loss) Margin Items [2] Income
(Loss) Margin $ % $ %
COMMERCIAL SOLUTIONS $ 493 $ 43 8.7 % $ 4 $ 47 9.5 % $ 413 $ 38 9.2 % $ 7 $ 45 10.9 % $ 80 19.4 % $ 2 4.4 %
HOME APPLIANCES 394 13 3.3 % 6 19 4.8 % 330 6 1.8 % 3 9 2.7 % 64 19.4 % 10 NM
HOME SOLUTIONS 525 53 10.1 % 11 64 12.2 % 384 29 7.6 % 21 50 13.0 % 141 36.7 % 14 28.0 %
LEARNING AND DEVELOPMENT 844 217 25.7 % 2 219 25.9 % 631 126 20.0 % 3 129 20.4 % 213 33.8 % 90 69.8 %
OUTDOOR AND RECREATION 453 48 10.6 % 4 52 11.5 % 353 24 6.8 % 9 33 9.3 % 100 28.3 % 19 57.6 %
CORPORATE — (69) — % 9 (60) — % — (60) — % 9 (51) — % — — % (9) (17.6) %
$ 2,709 $ 305 11.3 % $ 36 $ 341 12.6 % $ 2,111 $ 163 7.7 % $ 52 $ 215 10.2 % $ 598 28.3 % $ 126 58.6 %
[1] The three months ended June 30, 2021 normalized items consist of $19 million of acquisition amortization costs; $8 million of restructuring and restructuring-related charges; $6 million of fees for certain legal proceedings; $2 million of costs related to completed divestitures and $1 million related to Argentina hyperinflationary adjustment.
[2] The three months ended June 30, 2020 normalized items consist of $24 million of acquisition amortization costs; $17 million of restructuring and restructuring-related charges; $5 million of non-cash impairment charges related to the operating leases of Yankee Candle retail store business; $3 million of fees for certain legal proceedings; $1 million for product recall costs; $1 million of transaction-related costs and $1 million related to Argentina hyperinflationary adjustment.
*NM - NOT MEANINGFUL

NEWELL BRANDS INC.RECONCILIATION OF GAAP AND NON-GAAP INFORMATION (UNAUDITED)
NET DEBT TO NORMALIZED EBITDA FROM CONTINUING OPERATIONS RECONCILIATION(Amounts in millions)
June 30, 2021 December 31, 2020 [1] June 30, 2020NET DEBT RECONCILIATION:Short-term debt and current portion of long-term debt $ 610 $ 466 $ 402 Long-term debt 4,885 5,141 5,781 Gross debt 5,495 5,607 6,183 Less: Cash and cash equivalents 637 981 619 NET DEBT $ 4,858 $ 4,626 $ 5,564
Income (loss) from continuing operations [2] $ 717 $ (770) $ (1,064) Normalized items [2] 244 1,530 1,706 PROFORMA NORMALIZED INCOME (LOSS) FROM CONTINUING OPERATIONS 961 760 642
Proforma normalized income tax [2] 51 (10) 15 Interest expense, net [2] 272 274 279 Proforma normalized depreciation and amortization [2] [3] 246 245 242 Stock-based compensation [4] 49 41 39 NORMALIZED EBITDA $ 1,579 $ 1,310 $ 1,217
NET DEBT TO NORMALIZED EBITDA FROM CONTINUING OPERATIONS LEVERAGE RATIO [5] 3.1 x 3.5 x 4.6 x
[1] For the twelve months ended December 31, 2020, refer to "Reconciliation of GAAP and Non-GAAP Information (Unaudited) - Certain Line Items" for the twelve months ended December 31, 2020, on the Company’s Form 8-K furnished on February 12, 2021.
[2] For the trailing-twelve months ended June 30, 2021, refer to "Reconciliation of GAAP and Non-GAAP Information (Unaudited) - Certain Line Items" for the three months ended September 30, 2020, December 31, 2020 and March 31, 2021 on the Company’s Forms 8-K furnished on October 30, 2020, February 12, 2021 and April 30, 2021, respectively. For the trailing-twelve months ended June 30, 2020, refer to "Reconciliation of GAAP and Non-GAAP Information (Unaudited) - Certain Line Items" for the three months ended September 30, 2019, December 31, 2019 and March 31, 2020 on the Company’s Forms 8-K furnished on October 30, 2020, February 12, 2021 and April 30, 2021, respectively.
[3] For the trailing-twelve months ended June 30, 2021, Proforma normalized depreciation and amortization excludes the following items: (a) acquisition amortization expense of $84 million associated with intangible assets recognized in purchase accounting; (b) $17 million of accelerated depreciation costs associated with restructuring activities. Refer to "Reconciliation of GAAP and Non-GAAP Information (Unaudited) - Certain Line Items" for the three months ended September 30, 2020, December 31, 2020 and March 31, 2021 on the Company’s Forms 8-K furnished on October 30, 2020, February 12, 2021 and April 30, 2021, respectively. For the trailing-twelve months ended June 30, 2020, Proforma normalized depreciation and amortization excludes the following items: (a) acquisition amortization expense of $121 million associated with intangible assets recognized in purchase accounting; (b) $33 million of accelerated depreciation costs associated with restructuring activities; (c) cumulative depreciation and amortization cost of $53 million related to the inclusion of the Commercial Business in continuing operations. Refer to "Reconciliation of GAAP and Non-GAAP Information (Unaudited) - Certain Line Items" for the three months ended September 30, 2019, December 31, 2019 and March 31, 2021 on the Company’s Forms 8-K furnished on October 30, 2020, February 12, 2021, and April 30, 2021, respectively. Proforma Normalized depreciation and amortization excludes from GAAP depreciation and amortization for the twelve months ended December 31, 2020, the following items: (a) acquisition amortization expense of $99 million associated with intangible assets recognized in purchase accounting (b) accelerated depreciation and amortization costs of $13 million associated with restructuring activities. Refer to "Reconciliation of GAAP and Non-GAAP Information (Unaudited) - Certain Line Items" for the twelve months ended December 31, 2020 for further information.
[4] Represents non-cash expense associated with stock-based compensation from continuing operations.[5] The Net Debt to Normalized EBITDA from continuing operations ratio is defined as Net Debt divided by Normalized EBITDA from continuing operations. The Company's debt has certain financial
covenants such as debt to equity ratio and interest coverage ratio; however the Net Debt to Normalized EBITDA from continuing operations leverage ratio is used by management as a liquidity measure and is not prescribed in the Company's debt covenants.

NEWELL BRANDS INC.RECONCILIATION OF GAAP AND NON-GAAP INFORMATION (UNAUDITED)
CORE SALES OUTLOOK
Three Months Ending September 30, 2021
Twelve Months Ending December 31, 2021
Estimated net sales change (GAAP) 0% to 3% 8% to 10%Deduct: Estimated currency impact [1] and divestitures [2], net ~ 0% to ~ 0% ~ 1% to ~ 0%Core sales change (NON-GAAP) 0% to 3% 7% to 10%
[1] “Currency Impact” represents the effect of foreign currency on 2021 reported sales and is calculated by applying the 2020 average monthly exchange rates to the current year local currency sales amounts (excluding acquisitions and divestitures) and comparing to 2021 reported sales.
[2] Divestitures include the exit of the North American distributorship of Uniball® products, current and prior period net sales from retail store closures (consistent with standard retail practice), disposition of the foamboards business and exit from Home Fragrance fundraising business.

© Newell Brands