q2 2021 financial supplement
TRANSCRIPT

THE PNC FINANCIAL SERVICES GROUP, INC.
FINANCIAL SUPPLEMENTSECOND QUARTER 2021
(Unaudited)

THE PNC FINANCIAL SERVICES GROUP, INC.FINANCIAL SUPPLEMENT
SECOND QUARTER 2021(UNAUDITED)
Income Statement 1Balance Sheet 2Average Balance Sheet 3Details of Net Interest Margin 4Per Share Related Information 5Loans 6Allowance for Credit Losses 7-8Nonperforming Assets 9-10Accruing Loans Past Due 11-12
Glossary of Terms 13-15
Consolidated Results: Page
The information contained in this Financial Supplement is preliminary, unaudited and based on data available on July 14, 2021. We have reclassified certain prior period amounts to be consistent with the current period presentation, which we believe is more meaningful to readers of our consolidated financial statements. This information speaks only as of the particular date or dates included in the schedules. We do not undertake any obligation to, and disclaim any duty to, correct or update any of the information provided in this Financial Supplement. Our future financial performance is subject to risks and uncertainties as described in our United States Securities and Exchange Commission (SEC) filings.
BUSINESSPNC is one of the largest diversified financial services companies in the United States (U.S.) and is headquartered in Pittsburgh, Pennsylvania. PNC has businesses engaged in retail banking, including residential mortgage, corporate and institutional banking and asset management, providing many of its products and services nationally. PNC's retail branch network is located primarily in markets across the Mid-Atlantic, Midwest, Southeast and Southwest. PNC also has strategic international offices in four countries outside the U.S.
PNC has three reportable business segments: Retail Banking, Corporate & Institutional Banking, and Asset Management Group. Business segment results and a description of each business will be included in PNC's second quarter 2021 Form 10-Q.
ACQUISITION OF BBVA USA BANCSHARES, INC.On June 1, 2021, PNC acquired BBVA USA Bancshares Inc. (BBVA), a U.S. financial holding company conducting its business operations primarily through its U.S. banking subsidiary, BBVA USA. BBVA USA has more than 600 branches in Texas, Alabama, Arizona, California, Florida, Colorado and New Mexico. PNC paid $11.5 billion in cash as consideration for the acquisition, and added $82.2 billion of deposits and $60.5 billion of loans to PNC's Consolidated Balance Sheet as a result of the acquisition. PNC's second quarter earnings results reflect BBVA's acquired business operations for the month of June 2021 and PNC's balance sheet dated June 30, 2021 includes BBVA's balances. PNC's previously disclosed amounts do not include BBVA amounts. PNC's second quarter 2021 Form 10-Q will include additional information on this acquisition.
DISCONTINUED OPERATIONSOn May 15, 2020, PNC completed the sale of its 31.6 million shares of BlackRock, Inc., common and preferred stock through a registered secondary offering. In addition, BlackRock repurchased 2.65 million shares from PNC. The total proceeds from the sale were $14.2 billion in cash, net of $0.2 billion in expenses, and resulted in a gain on sale of $4.3 billion. Additionally, PNC contributed 500,000 BlackRock shares to the PNC Foundation on May 18, 2020. As a result, PNC has divested its entire holding in BlackRock. PNC and its affiliates only hold shares of BlackRock stock in a fiduciary capacity for clients of PNC and its affiliates. Activity for BlackRock for all periods presented on the Consolidated Income Statement have been reclassified to discontinued operations and prior period BlackRock investment balances have been reclassified to the Asset held for sale line on the Consolidated Balance Sheet in accordance with Accounting Standard Codification (ASC) 205-20, Presentation of Financial Statements - Discontinued Operations.

THE PNC FINANCIAL SERVICES GROUP, INC.Cross Reference Index to Second Quarter 2021 Financial Supplement (Unaudited)
Financial Supplement Table Reference
Table Description Page1 Consolidated Income Statement 12 Consolidated Balance Sheet 23 Average Consolidated Balance Sheet 34 Details of Net Interest Margin 45 Per Share Related Information 56 Details of Loans 67 Change in Allowance for Loan and Lease Losses 78 Components of the Provision for (Recapture of) Credit Losses Under CECL 89 Allowance for Credit Losses by Loan Class 810 Nonperforming Assets by Type 911 Change in Nonperforming Assets 1012 Largest Individual Nonperforming Assets 1013 Accruing Loans Past Due 30 to 59 Days 1114 Accruing Loans Past Due 60 to 89 Days 1215 Accruing Loans Past Due 90 Days or More 12

Table 1: Consolidated Income Statement (Unaudited)
Three months ended Six months endedJune 30 March 31 December 31 September 30 June 30 June 30 June 30
In millions, except per share data 2021 2021 2020 2020 2020 2021 2020Interest IncomeLoans $ 2,160 $ 1,996 $ 2,074 $ 2,116 $ 2,257 $ 4,156 $ 4,737 Investment securities 469 421 442 490 527 890 1,109 Other 72 66 60 70 71 138 209
Total interest income 2,701 2,483 2,576 2,676 2,855 5,184 6,055 Interest ExpenseDeposits 30 40 53 74 141 70 516 Borrowed funds 90 95 99 118 187 185 501
Total interest expense 120 135 152 192 328 255 1,017 Net interest income 2,581 2,348 2,424 2,484 2,527 4,929 5,038
Noninterest IncomeAsset management 239 226 221 215 199 465 400 Consumer services 457 384 387 390 330 841 707 Corporate services 688 555 650 479 512 1,243 1,038 Residential mortgage 103 105 99 137 158 208 368 Service charges on deposits 131 119 134 119 79 250 247 Other (a) 468 483 293 457 271 951 614
Total noninterest income 2,086 1,872 1,784 1,797 1,549 3,958 3,374 Total revenue 4,667 4,220 4,208 4,281 4,076 8,887 8,412
Provision For (Recapture of) Credit Losses 302 (551) (254) 52 2,463 (249) 3,377 Noninterest ExpensePersonnel 1,640 1,477 1,521 1,410 1,373 3,117 2,742 Occupancy 217 215 215 205 199 432 406 Equipment 326 293 296 292 301 619 588 Marketing 74 45 64 67 47 119 105 Other 793 544 612 557 595 1,337 1,217
Total noninterest expense 3,050 2,574 2,708 2,531 2,515 5,624 5,058 Income (loss) from continuing operations before income taxes and noncontrolling interests 1,315 2,197 1,754 1,698 (902) 3,512 (23) Income taxes (benefit) from continuing operations 212 371 298 166 (158) 583 (38)
Net income (loss) from continuing operations 1,103 1,826 1,456 1,532 (744) 2,929 15 Income from discontinued operations before taxes 5,596 5,777 Income taxes from discontinued operations 1,197 1,222
Net income from discontinued operations 4,399 4,555 Net income 1,103 1,826 1,456 1,532 3,655 2,929 4,570 Less: Net income attributable to noncontrolling interests 12 10 14 13 7 22 14
Preferred stock dividends (b) 48 57 48 63 55 105 118 Preferred stock discount accretion and redemptions 1 1 1 1 1 2 2
Net income attributable to common shareholders $ 1,042 $ 1,758 $ 1,393 $ 1,455 $ 3,592 $ 2,800 $ 4,436 Earnings Per Common Share
Basic earnings (loss) from continuing operations $ 2.43 $ 4.11 $ 3.26 $ 3.40 $ (1.90) $ 6.54 $ (0.29) Basic earnings from discontinued operations 10.28 10.60 Total basic earnings $ 2.43 $ 4.11 $ 3.26 $ 3.40 $ 8.40 $ 6.54 $ 10.33
Diluted earnings (loss) from continuing operations $ 2.43 $ 4.10 $ 3.26 $ 3.39 $ (1.90) $ 6.53 $ (0.29) Diluted earnings from discontinued operations 10.28 10.59 Total diluted earnings $ 2.43 $ 4.10 $ 3.26 $ 3.39 $ 8.40 $ 6.53 $ 10.32
Average Common Shares OutstandingBasic 427 426 425 426 426 426 428 Diluted 427 426 426 426 426 427 428
Efficiency 65 % 61 % 64 % 59 % 62 % 63 % 60 %Noninterest income to total revenue 45 % 44 % 42 % 42 % 38 % 45 % 40 %Effective tax rate from continuing operations (c) 16.1 % 16.9 % 17.0 % 9.8 % 17.5 % 16.6 % 165.2 %
(a) Includes net gains on sales of securities of $10 million, $25 million, $51 million, $32 million and $40 million for the quarters ended June 30, 2021, March 31, 2021, December 31, 2020, September 30, 2020 and June 30, 2020, respectively. Amounts for the six months ended June 30, 2021 and June 30, 2020 were $35 million and $222 million, respectively.
(b) Dividends are payable quarterly other than Series O, Series R and Series S preferred stock, which are payable semiannually, with the Series O payable in different quarters than the Series R and Series S preferred stock.
(c) The effective income tax rates are generally lower than the statutory rate due to the relationship of pretax income to tax credits and earnings that are not subject to tax.
THE PNC FINANCIAL SERVICES GROUP, INC. Page 1

Table 2: Consolidated Balance Sheet (Unaudited)June 30 March 31 December 31 September 30 June 30
In millions, except par value 2021 2021 2020 2020 2020
AssetsCash and due from banks $ 8,724 $ 7,455 $ 7,017 $ 6,629 $ 6,338 Interest-earning deposits with banks (a) 72,447 86,161 85,173 70,959 50,233 Loans held for sale (b) 2,227 1,967 1,597 1,787 1,443 Investment securities – available for sale 125,058 96,799 87,358 89,747 97,052 Investment securities – held to maturity 1,485 1,456 1,441 1,438 1,441 Loans (b) 294,704 237,013 241,928 249,279 258,236 Allowance for loan and lease losses (5,730) (4,714) (5,361) (5,751) (5,928)
Net loans 288,974 232,299 236,567 243,528 252,308 Equity investments 7,521 6,386 6,052 4,938 4,943 Mortgage servicing rights 1,793 1,680 1,242 1,113 1,067 Goodwill 10,958 9,317 9,233 9,233 9,233 Other (b) 35,025 30,894 30,999 32,445 34,920
Total assets $ 554,212 $ 474,414 $ 466,679 $ 461,817 $ 458,978 LiabilitiesDeposits
Noninterest-bearing $ 154,190 $ 120,641 $ 112,637 $ 107,281 $ 99,458 Interest-bearing 298,693 254,426 252,708 247,798 246,539 Total deposits 452,883 375,067 365,345 355,079 345,997
Borrowed fundsFederal Home Loan Bank borrowings 1,500 3,500 5,500 8,500 Bank notes and senior debt 24,408 22,139 24,271 26,839 27,704 Subordinated debt 7,120 6,241 6,403 6,465 6,500 Other (b) 3,285 3,150 3,021 3,306 4,322 Total borrowed funds 34,813 33,030 37,195 42,110 47,026
Allowance for unfunded lending related commitments 645 507 584 689 662 Accrued expenses and other liabilities 11,186 11,931 9,514 10,629 12,345
Total liabilities 499,527 420,535 412,638 408,507 406,030 EquityPreferred stock (c)Common stock - $5 par value
Authorized 800 shares, issued 543, 543, 543, 542, and 542 shares 2,713 2,713 2,713 2,712 2,712 Capital surplus 15,928 15,879 15,884 15,836 16,284 Retained earnings 48,663 48,113 46,848 45,947 44,986 Accumulated other comprehensive income 1,463 1,290 2,770 2,997 3,069 Common stock held in treasury at cost:118, 118, 119, 118 and 117 shares (14,140) (14,146) (14,205) (14,216) (14,128)
Total shareholders’ equity 54,627 53,849 54,010 53,276 52,923 Noncontrolling interests 58 30 31 34 25
Total equity 54,685 53,879 54,041 53,310 52,948 Total liabilities and equity $ 554,212 $ 474,414 $ 466,679 $ 461,817 $ 458,978
(a) Amounts include balances held with the Federal Reserve Bank of $71.9 billion, $85.8 billion, $84.9 billion, $70.6 billion and $50.0 billion as of June 30, 2021, March 31,
2021, December 31, 2020, September 30, 2020 and June 30, 2020, respectively. (b) Amounts include assets and liabilities for which PNC has elected the fair value option. Our first quarter 2021 Form 10-Q included, and our second quarter 2021 Form 10-Q
will include, additional information regarding these items. (c) Par value less than $0.5 million at each date.
THE PNC FINANCIAL SERVICES GROUP, INC. Page 2

Table 3: Average Consolidated Balance Sheet (Unaudited) (a) (c)Three months ended Six months ended
June 30 March 31 December 31 September 30 June 30 June 30 June 30In millions 2021 2021 2020 2020 2020 2021 2020AssetsInterest-earning assets:Investment securities
Securities available for saleResidential mortgage-backed
Agency $ 56,042 $ 45,298 $ 48,036 $ 52,215 $ 52,500 $ 50,700 $ 51,068 Non-agency 1,142 1,236 1,337 1,437 1,529 1,189 1,573
Commercial mortgage-backed 6,465 6,241 6,568 6,927 7,232 6,354 6,983 Asset-backed 5,855 5,304 5,017 5,033 5,309 5,581 5,156 U.S. Treasury and government agencies 32,419 22,309 18,783 18,724 15,457 27,392 15,697 Other 5,107 4,561 4,561 4,723 4,952 4,835 4,488
Total securities available for sale 107,030 84,949 84,302 89,059 86,979 96,051 84,965Securities held to maturity
Asset-backed 22 37 U.S. Treasury and government agencies 802 797 793 788 783 800 781 Other 671 650 650 655 646 660 643
Total securities held to maturity 1,473 1,447 1,443 1,443 1,451 1,460 1,461Total investment securities 108,503 86,396 85,745 90,502 88,430 97,511 86,426
LoansCommercial and industrial 137,892 129,996 134,944 139,795 153,595 133,966 141,159 Commercial real estate 31,611 28,598 28,991 29,081 28,707 30,113 28,491 Equipment lease financing 6,332 6,332 6,380 6,771 7,035 6,332 7,051 Consumer 52,575 50,904 52,872 54,692 56,485 51,744 57,082 Residential real estate 27,197 22,305 22,638 22,753 22,292 24,764 22,060
Total loans 255,607 238,135 245,825 253,092 268,114 246,919 255,843Interest-earning deposits with banks (b) 78,522 85,410 76,374 60,327 34,600 81,947 26,085 Other interest-earning assets 8,079 7,829 8,134 9,752 10,867 7,955 10,167
Total interest-earning assets 450,711 417,770 416,078 413,673 402,011 434,332 378,521Noninterest-earning assets 53,718 50,450 48,901 48,466 55,302 52,093 56,353
Total assets $ 504,429 $ 468,220 $ 464,979 $ 462,139 $ 457,313 $ 486,425 $ 434,874 Liabilities and EquityInterest-bearing liabilities:Interest-bearing deposits
Money market $ 64,990 $ 59,083 $ 62,621 $ 63,598 $ 61,346 $ 62,053 $ 57,317 Demand 99,091 91,619 88,026 87,226 82,881 95,376 76,906 Savings 87,307 82,926 79,430 77,479 75,345 85,129 72,661 Time deposits 18,048 18,449 19,448 20,248 21,873 18,246 21,506
Total interest-bearing deposits 269,436 252,077 249,525 248,551 241,445 260,804 228,390Borrowed funds
Federal Home Loan Bank borrowings 265 2,411 4,761 7,196 12,559 1,332 13,000 Bank notes and senior debt 22,620 22,799 24,022 25,858 28,298 22,709 29,143 Subordinated debt 6,218 5,929 5,936 5,936 5,937 6,074 5,935 Other 5,046 4,057 3,433 4,354 6,435 4,555 7,131
Total borrowed funds 34,149 35,196 38,152 43,344 53,229 34,670 55,209Total interest-bearing liabilities 303,585 287,273 287,677 291,895 294,674 295,474 283,599
Noninterest-bearing liabilities and equity:Noninterest-bearing deposits 132,283 113,299 109,878 101,931 93,776 122,843 84,086
Accrued expenses and other liabilities 14,755 14,258 14,348 15,341 16,989 14,508 16,712 Equity 53,806 53,390 53,076 52,972 51,874 53,600 50,477
Total liabilities and equity $ 504,429 $ 468,220 $ 464,979 $ 462,139 $ 457,313 $ 486,425 $ 434,874
(a) Calculated using average daily balances.(b) Amounts include average balances held with the Federal Reserve Bank of Cleveland of $78.3 billion, $85.2 billion, $76.1 billion, $60.0 billion and $34.2 billion for the three
months ended June 30, 2021, March 31, 2021, December 31, 2020, September 30, 2020 and June 30, 2020, and $81.7 billion and $25.8 billion for the six months ended June 30, 2021 and June 30, 2020, respectively.
(c) Second quarter results reflect BBVA's acquired business operations for the month of June. Previously disclosed amounts do not include BBVA amounts.
THE PNC FINANCIAL SERVICES GROUP, INC. Page 3

Table 4: Details of Net Interest Margin (Unaudited) (c)Three months ended Six months ended
June 30 March 31 December 31 September 30 June 30 June 30 June 302021 2021 2020 2020 2020 2021 2020
Average yields/rates (a)Yield on interest-earning assetsInvestment securities
Securities available for saleResidential mortgage-backed
Agency 1.61 % 1.72 % 1.81 % 2.03 % 2.29 % 1.66 % 2.45 %Non-agency 7.85 % 7.24 % 7.15 % 7.26 % 7.13 % 7.54 % 7.51 %
Commercial mortgage-backed 2.49 % 2.58 % 2.66 % 2.50 % 2.59 % 2.54 % 2.76 %Asset-backed 2.07 % 1.84 % 2.04 % 2.44 % 2.60 % 1.96 % 2.82 %U.S. Treasury and government agencies 1.30 % 1.68 % 1.77 % 1.64 % 1.77 % 1.45 % 2.03 %Other 3.00 % 3.28 % 3.45 % 3.39 % 3.47 % 3.13 % 3.57 %
Total securities available for sale 1.73 % 1.95 % 2.05 % 2.16 % 2.39 % 1.82 % 2.58 %Securities held to maturity
Asset-backed 2.38 % 2.65 %U.S. Treasury and government agencies 2.86 % 2.83 % 2.88 % 2.86 % 2.84 % 2.85 % 2.84 %Other 3.67 % 4.17 % 4.20 % 4.20 % 4.27 % 3.91 % 4.38 %
Total securities held to maturity 3.23 % 3.43 % 3.47 % 3.47 % 3.47 % 3.33 % 3.51 %Total investment securities 1.75 % 1.97 % 2.08 % 2.18 % 2.41 % 1.85 % 2.59 %
LoansCommercial and industrial 2.89 % 2.91 % 2.87 % 2.82 % 2.83 % 2.90 % 3.19 %Commercial real estate 2.92 % 2.80 % 2.63 % 2.65 % 2.84 % 2.86 % 3.23 %Equipment lease financing 3.76 % 3.90 % 3.90 % 3.80 % 3.82 % 3.83 % 3.88 %Consumer 4.82 % 4.78 % 4.74 % 4.69 % 4.86 % 4.80 % 5.12 %Residential real estate 3.50 % 3.53 % 3.69 % 3.74 % 3.86 % 3.51 % 3.91 %
Total loans 3.38 % 3.38 % 3.35 % 3.32 % 3.37 % 3.38 % 3.71 %Interest-earning deposits with banks 0.11 % 0.10 % 0.10 % 0.10 % 0.10 % 0.10 % 0.50 %Other interest-earning assets 2.46 % 2.34 % 1.99 % 2.23 % 2.26 % 2.40 % 2.84 %
Total yield on interest-earning assets 2.40 % 2.40 % 2.46 % 2.57 % 2.85 % 2.40 % 3.21 %Rate on interest-bearing liabilitiesInterest-bearing deposits
Money market 0.03 % 0.03 % 0.05 % 0.07 % 0.15 % 0.03 % 0.41 %Demand 0.03 % 0.04 % 0.04 % 0.05 % 0.08 % 0.03 % 0.23 %Savings 0.05 % 0.06 % 0.08 % 0.11 % 0.31 % 0.05 % 0.54 %Time deposits 0.20 % 0.32 % 0.41 % 0.58 % 0.80 % 0.26 % 1.06 %
Total interest-bearing deposits 0.05 % 0.06 % 0.08 % 0.12 % 0.23 % 0.05 % 0.45 %Borrowed funds
Federal Home Loan Bank borrowings 0.35 % 0.43 % 0.40 % 0.47 % 1.00 % 0.42 % 1.36 %Bank notes and senior debt 0.98 % 1.04 % 1.00 % 1.08 % 1.56 % 1.01 % 2.00 %Subordinated debt 1.35 % 1.43 % 1.38 % 1.51 % 1.91 % 1.39 % 2.32 %Other 0.97 % 1.21 % 1.39 % 1.31 % 0.92 % 1.07 % 1.34 %
Total borrowed funds 1.04 % 1.09 % 1.02 % 1.06 % 1.39 % 1.06 % 1.80 %Total rate on interest-bearing liabilities 0.16 % 0.19 % 0.21 % 0.26 % 0.44 % 0.17 % 0.71 %
Interest rate spread 2.24 % 2.21 % 2.25 % 2.31 % 2.41 % 2.23 % 2.50 %Benefit from use of noninterest bearing sources (b) 0.05 % 0.06 % 0.07 % 0.08 % 0.11 % 0.05 % 0.17 %
Net interest margin 2.29 % 2.27 % 2.32 % 2.39 % 2.52 % 2.28 % 2.67 %
(a) Yields and rates are calculated using the applicable annualized interest income or interest expense divided by the applicable average earning assets or interest-bearing liabilities. Net interest margin is the total yield on interest-earning assets minus the total rate on interest-bearing liabilities and includes the benefit from use of noninterest-bearing sources. To provide more meaningful comparisons of net interest margins, we use net interest income on a taxable-equivalent basis in calculating average yields used in the calculation of net interest margin by increasing the interest income earned on tax-exempt assets to make it fully equivalent to interest income earned on taxable investments. This adjustment is not permitted under GAAP in the Consolidated Income Statement. The taxable-equivalent adjustments to net interest income for the three months ended June 30, 2021, March 31, 2021, December 31, 2020, September 30, 2020 and June 30, 2020 were $15 million, $15 million, $17 million, $17 million and $19 million, respectively. The taxable-equivalent adjustments to net interest income for the six months ended June 30, 2021 and June 30, 2020 were $30 million and $41 million, respectively.
(b) Represents the positive effects of investing noninterest-bearing sources in interest-earning assets.(c) Second quarter results reflect BBVA's acquired business operations for the month of June. Previously disclosed amounts do not include BBVA amounts.
THE PNC FINANCIAL SERVICES GROUP, INC. Page 4

Table 5: Per Share Related Information (Unaudited) Three months ended Six months ended
June 30 March 31 December 31 September 30 June 30 June 30 June 30In millions, except per share data 2021 2021 2020 2020 2020 2021 2020BasicNet income (loss) from continuing operations $ 1,103 $ 1,826 $ 1,456 $ 1,532 $ (744) $ 2,929 $ 15 Less:
Net income attributable to noncontrolling interests 12 10 14 13 7 22 14 Preferred stock dividends 48 57 48 63 55 105 118 Preferred stock discount accretion and redemptions 1 1 1 1 1 2 2
Net income (loss) from continuing operations attributable to common shareholders 1,042 1,758 1,393 1,455 (807) 2,800 (119)
Less: Dividends and undistributed earnings allocated to nonvested restricted shares 5 8 6 8 1 13 4
Net income (loss) from continuing operations attributable to basic common shareholders $ 1,037 $ 1,750 $ 1,387 $ 1,447 $ (808) $ 2,787 $ (123) Net income from discontinued operations attributable to common shareholders $ 4,399 $ 4,555
Less: Undistributed earnings allocated to nonvested restricted shares 21 22
Net income from discontinued operations attributable to basic common shareholders $ 4,378 $ 4,533 Basic weighted-average common shares outstanding 427 426 425 426 426 426 428 Basic earnings (loss) per common share from continuing operations (a) $ 2.43 $ 4.11 $ 3.26 $ 3.40 $ (1.90) $ 6.54 $ (0.29) Basic earnings per common share from discontinued operations (a) $ 10.28 $ 10.60
Basic earnings per common share $ 2.43 $ 4.11 $ 3.26 $ 3.40 $ 8.40 $ 6.54 $ 10.33 DilutedNet income (loss) from continuing operations attributable to diluted common shareholder $ 1,037 $ 1,750 $ 1,387 $ 1,447 $ (808) $ 2,787 $ (123) Net income from discontinued operations attributable to basic common shareholders $ 4,378 $ 4,533
Less: Impact of earnings per share dilution from discontinued operations 1 2
Net income from discontinued operations attributable to diluted common shareholders $ 4,377 $ 4,531 Basic weighted-average common shares outstanding 427 426 425 426 426 426 428 Dilutive potential common shares 1 1 Diluted weighted-average common shares outstanding 427 426 426 426 426 427 428 Diluted earnings (loss) per common share from continuing operations (a) $ 2.43 $ 4.10 $ 3.26 $ 3.39 $ (1.90) $ 6.53 $ (0.29) Diluted earnings per common share from discontinued operations (a) $ 10.28 $ 10.59
Diluted earnings per common share $ 2.43 $ 4.10 $ 3.26 $ 3.39 $ 8.40 $ 6.53 $ 10.32
(a) Dividends are payable quarterly other than the Series O, Series R and Series S preferred stock, which are payable semiannually, with the Series O payable in different quarters than the Series R and Series S preferred stock.
THE PNC FINANCIAL SERVICES GROUP, INC. Page 5

Table 6: Details of Loans (Unaudited)
June 30 March 31 December 31 September 30 June 30In millions 2021 (a) 2021 2020 2020 2020Commercial
Commercial and industrial $ 155,300 $ 129,798 $ 132,073 $ 137,187 $ 144,335 Commercial real estate 37,964 28,319 28,716 29,028 28,763 Equipment lease financing 6,376 6,389 6,414 6,479 7,097
Total commercial 199,640 164,506 167,203 172,694 180,195Consumer
Home equity 25,174 23,493 24,088 24,539 24,879 Residential real estate 36,846 22,418 22,560 22,886 22,469 Automobile 17,551 13,584 14,218 14,977 16,157 Credit card 6,528 5,675 6,215 6,303 6,575 Education 2,726 2,842 2,946 3,051 3,132 Other consumer 6,239 4,495 4,698 4,829 4,829
Total consumer 95,064 72,507 74,725 76,585 78,041 Total loans $ 294,704 $ 237,013 $ 241,928 $ 249,279 $ 258,236
(a) Includes $60.5 billion of loans at June 30, 2021, $38.5 billion in the commercial portfolio and $22.0 billion in the consumer portfolio, that were acquired as a part of the BBVA acquisition on June 1, 2021. Additional information on this acquired loan portfolio will be included in our second quarter 2021 Form 10-Q.
THE PNC FINANCIAL SERVICES GROUP, INC. Page 6

Allowance for Credit Losses (Unaudited)Table 7: Change in Allowance for Loan and Lease Losses
Three months ended Six months endedJune 30 March 31 December 31 September 30 June 30 June 30 June 30
Dollars in millions 2021 2021 2020 2020 2020 2021 2020Allowance for loan and lease losses
Beginning balance $ 4,714 $ 5,361 $ 5,751 $ 5,928 $ 3,944 $ 5,361 $ 2,742 Adoption of ASU 2016-03 (a) 463 Acquisition PCD reserves 1,115 1,115 Gross charge-offs:Commercial and industrial (40) (59) (133) (59) (112) (99) (190) Commercial real estate (5) (1) (1) (5) Equipment lease financing (1) (5) (4) (4) (10) (6) (15) Home equity (7) (7) (11) (12) (8) (14) (19) Residential real estate (3) (4) (6) (2) (7) (2) Automobile (31) (52) (55) (57) (69) (83) (153) Credit card (58) (69) (72) (74) (76) (127) (154) Education (3) (5) (3) (3) (4) (8) (10) Other consumer (31) (37) (42) (35) (35) (68) (75) Acquired loan gross charge-offs (b) (254) (254)
Total gross charge-offs (428) (243) (327) (247) (314) (671) (618) Recoveries:Commercial and industrial 28 14 23 21 13 42 31 Commercial real estate 2 1 3 2 3 4 Equipment lease financing 3 3 3 3 2 6 4 Home equity 21 17 17 15 15 38 29 Residential real estate 6 5 4 4 4 11 8 Automobile 39 38 33 31 29 77 64 Credit card 10 12 9 9 9 22 17 Education 2 2 2 2 2 4 4 Other consumer 5 5 4 5 4 10 9 Acquired loan recoveries 6 6
Total recoveries 122 97 98 92 78 219 170 Net (charge-offs) / recoveries:Commercial and industrial (12) (45) (110) (38) (99) (57) (159) Commercial real estate 2 (4) 2 1 (2) 4 Equipment lease financing 2 (2) (1) (1) (8) (11) Home equity 14 10 6 3 7 24 10 Residential real estate 3 1 (2) 2 4 4 6 Automobile 8 (14) (22) (26) (40) (6) (89) Credit card (48) (57) (63) (65) (67) (105) (137) Education (1) (3) (1) (1) (2) (4) (6) Other consumer (26) (32) (38) (30) (31) (58) (66) Acquired loan net (charge-offs) (248) (248)
Total net (charge-offs) (306) (146) (229) (155) (236) (452) (448) Provision for (recapture of) credit losses (c) 206 (502) (164) (23) 2,220 (296) 3,172 Other 1 1 3 1 2 (1)
Ending balance $ 5,730 $ 4,714 $ 5,361 $ 5,751 $ 5,928 $ 5,730 $ 5,928 Supplemental InformationNet charge-offs
Commercial net charge-offs $ (240) $ (51) $ (109) $ (38) $ (107) $ (291) $ (166) Consumer net charge-offs (66) (95) (120) (117) (129) (161) (282) Total net charge-offs $ (306) $ (146) $ (229) $ (155) $ (236) $ (452) $ (448)
Net charge-offs to average loans (annualized) 0.48 % 0.25 % 0.37 % 0.24 % 0.35 % 0.37 % 0.35 %Commercial 0.55 % 0.13 % 0.25 % 0.09 % 0.23 % 0.34 % 0.19 %Consumer 0.33 % 0.53 % 0.63 % 0.60 % 0.66 % 0.42 % 0.72 %
(a) Represents the impact of adopting ASU 2016-13, Financial Instruments - Credit Losses on January 1, 2020, and our transition from an incurred loss methodology for our reserves to an expected credit loss methodology. Our 2020 Form 10-K included additional information related to our adoption of the CECL standard.
(b) Primarily represents the charge-off of certain loans previously charged off by BBVA, which were written up upon acquisition to unpaid principal balance as required by purchase accounting.
(c) See Table 8 for the components of the Provision for (recapture of) credit losses being reported on the Consolidated Income Statement.
THE PNC FINANCIAL SERVICES GROUP, INC. Page 7
Allowance for Credit Losses (Unaudited) (Continued)
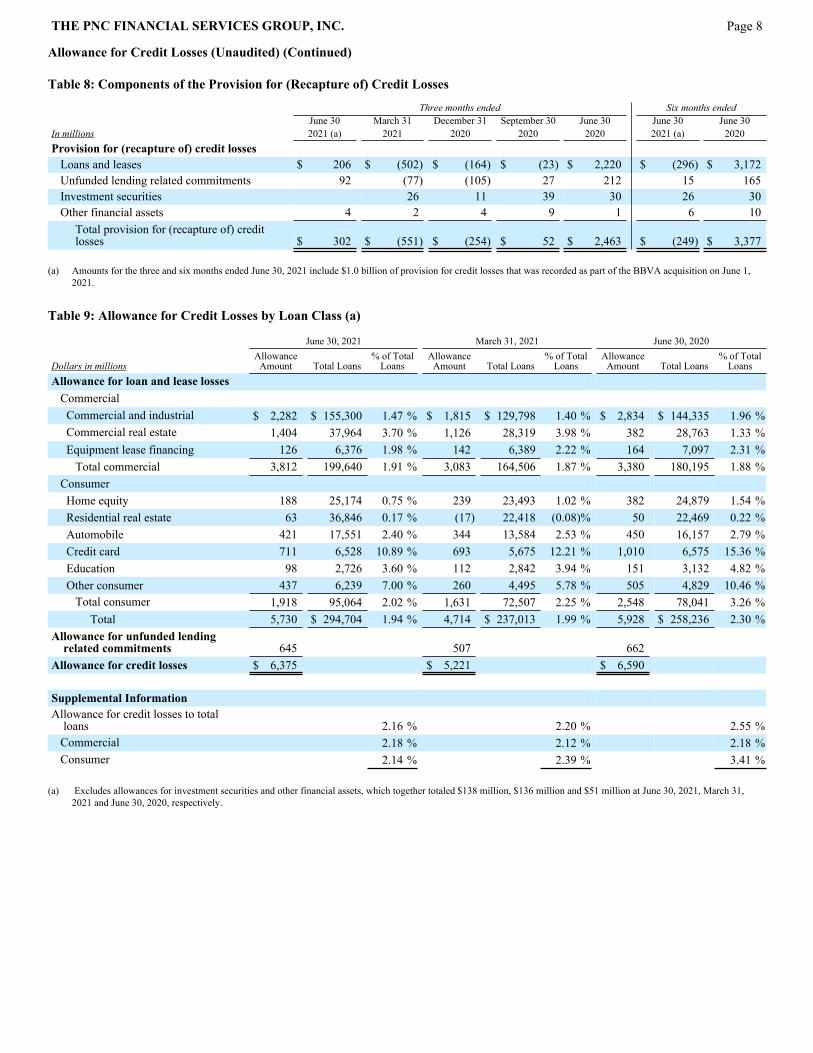
Table 8: Components of the Provision for (Recapture of) Credit Losses
Three months ended Six months endedJune 30 March 31 December 31 September 30 June 30 June 30 June 30
In millions 2021 (a) 2021 2020 2020 2020 2021 (a) 2020Provision for (recapture of) credit losses
Loans and leases $ 206 $ (502) $ (164) $ (23) $ 2,220 $ (296) $ 3,172 Unfunded lending related commitments 92 (77) (105) 27 212 15 165 Investment securities 26 11 39 30 26 30 Other financial assets 4 2 4 9 1 6 10
Total provision for (recapture of) credit losses $ 302 $ (551) $ (254) $ 52 $ 2,463 $ (249) $ 3,377
(a) Amounts for the three and six months ended June 30, 2021 include $1.0 billion of provision for credit losses that was recorded as part of the BBVA acquisition on June 1, 2021.
Table 9: Allowance for Credit Losses by Loan Class (a)
June 30, 2021 March 31, 2021 June 30, 2020
Dollars in millionsAllowance
Amount Total Loans% of Total
LoansAllowance
Amount Total Loans% of Total
LoansAllowance
Amount Total Loans% of Total
LoansAllowance for loan and lease losses
CommercialCommercial and industrial $ 2,282 $ 155,300 1.47 % $ 1,815 $ 129,798 1.40 % $ 2,834 $ 144,335 1.96 %Commercial real estate 1,404 37,964 3.70 % 1,126 28,319 3.98 % 382 28,763 1.33 %Equipment lease financing 126 6,376 1.98 % 142 6,389 2.22 % 164 7,097 2.31 %
Total commercial 3,812 199,640 1.91 % 3,083 164,506 1.87 % 3,380 180,195 1.88 %ConsumerHome equity 188 25,174 0.75 % 239 23,493 1.02 % 382 24,879 1.54 %Residential real estate 63 36,846 0.17 % (17) 22,418 (0.08) % 50 22,469 0.22 %Automobile 421 17,551 2.40 % 344 13,584 2.53 % 450 16,157 2.79 %Credit card 711 6,528 10.89 % 693 5,675 12.21 % 1,010 6,575 15.36 %Education 98 2,726 3.60 % 112 2,842 3.94 % 151 3,132 4.82 %Other consumer 437 6,239 7.00 % 260 4,495 5.78 % 505 4,829 10.46 %
Total consumer 1,918 95,064 2.02 % 1,631 72,507 2.25 % 2,548 78,041 3.26 %Total 5,730 $ 294,704 1.94 % 4,714 $ 237,013 1.99 % 5,928 $ 258,236 2.30 %
Allowance for unfunded lending related commitments 645 507 662
Allowance for credit losses $ 6,375 $ 5,221 $ 6,590
Supplemental InformationAllowance for credit losses to total
loans 2.16 % 2.20 % 2.55 %Commercial 2.18 % 2.12 % 2.18 %Consumer 2.14 % 2.39 % 3.41 %
(a) Excludes allowances for investment securities and other financial assets, which together totaled $138 million, $136 million and $51 million at June 30, 2021, March 31, 2021 and June 30, 2020, respectively.
THE PNC FINANCIAL SERVICES GROUP, INC. Page 8

Details of Nonperforming Assets (Unaudited)
Table 10: Nonperforming Assets by Type June 30 March 31 December 31 September 30 June 30
Dollars in millions 2021 2021 2020 2020 2020
Nonperforming loans, including TDRsCommercialCommercial and industrial
Retail/wholesale trade $ 25 $ 66 $ 61 $ 90 $ 117 Manufacturing 37 55 81 80 58 Service providers 87 79 90 69 57 Real estate related (a) 41 48 95 140 158 Health care 17 19 20 20 19 Transportation and warehousing 15 18 20 14 20 Other industries 144 227 299 264 264
Total commercial and industrial 366 512 666 677 693 Commercial real estate 218 221 224 217 43 Equipment lease financing 15 16 33 21 22 Acquired loans (b) 847
Total commercial 1,446 749 923 915 758 Consumer (c)Home equity 624 656 645 639 636 Residential real estate 502 541 528 339 305 Automobile 172 178 175 171 156 Credit card 5 7 8 13 15 Other consumer 6 7 7 8 6 Acquired loans (b) 24
Total consumer 1,333 1,389 1,363 1,170 1,118 Total nonperforming loans (d) 2,779 2,138 2,286 2,085 1,876 OREO and foreclosed assets 30 41 51 67 79 Acquired OREO and foreclosed assets (b) 9 Total nonperforming assets $ 2,818 $ 2,179 $ 2,337 $ 2,152 $ 1,955 Nonperforming loans to total loans 0.94 % 0.90 % 0.94 % 0.84 % 0.73 %Acquired nonperforming loans to total acquired loans (b) 1.44 %Nonperforming assets to total loans, OREO and foreclosed assets 0.96 % 0.92 % 0.97 % 0.86 % 0.76 %Nonperforming assets to total assets 0.51 % 0.46 % 0.50 % 0.47 % 0.43 %Allowance for loan and lease losses to nonperforming loans 206 % 220 % 235 % 276 % 316 %Allowance for acquired loan and lease losses to acquired nonperforming loans (b) 193 %
(a) Represents loans related to customers in the real estate and construction industries.(b) Reflects nonperforming assets acquired as a part of the BBVA acquisition on June 1, 2021. Additional information on this acquired portfolio will be included in our second
quarter 2021 Form 10-Q. (c) Excludes most unsecured consumer loans and lines of credit, which are charged off after 120 to 180 days past due and are not placed on nonperforming status.(d) Nonperforming loans exclude certain government insured or guaranteed loans, loans held for sale and loans accounted for under the fair value option.
THE PNC FINANCIAL SERVICES GROUP, INC. Page 9

Details of Nonperforming Assets (Unaudited) (Continued)
Table 11: Change in Nonperforming Assets
April 1, 2021 - January 1, 2021 - October 1, 2020 - July 1, 2020 - April 1, 2020 -In millions June 30, 2021 March 31, 2021 December 31, 2020 September 30, 2020 June 30, 2020
Beginning balance $ 2,179 $ 2,337 $ 2,152 $ 1,955 $ 1,755 New nonperforming assets 207 249 586 512 458 Charge-offs and valuation adjustments (61) (70) (97) (75) (104) Principal activity, including paydowns and payoffs (264) (186) (185) (175) (85) Asset sales and transfers to loans held for sale (15) (86) (14) (20) (28) Returned to performing status (108) (65) (105) (45) (41) Acquired nonperforming assets (a) 880
Ending balance $ 2,818 $ 2,179 $ 2,337 $ 2,152 $ 1,955
(a) Represents nonperforming assets acquired as a part of the BBVA acquisition on June 1, 2021 and includes $871 million of loans and $9 million of OREO and foreclosed assets. See our second quarter 2021 Form 10-Q for additional information on this acquired portfolio.
Table 12: Largest Individual Nonperforming Assets (a)
June 30, 2021 - Dollars in millionsRanking Outstandings Industry1 $ 141 Real Estate and Rental and Leasing2 56 Real Estate and Rental and Leasing3 49 Accommodation and Food Services4 46 Professional, Scientific, and Technical Services5 36 Accommodation and Food Services6 35 Mining, Quarrying, and Oil and Gas Extraction7 32 Health Care and Social Assistance8 32 Arts, Entertainment, and Recreation9 31 Real Estate and Rental and Leasing10 30 Mining, Quarrying, and Oil and Gas ExtractionTotal $ 488 As a percent of total nonperforming assets 17%
(a) Amounts shown are not net of related allowance for loan and lease losses, if applicable.
THE PNC FINANCIAL SERVICES GROUP, INC. Page 10

Accruing Loans Past Due (Unaudited)
Pursuant to the interagency guidance issued in April 2020 and in connection with the credit reporting rules from the U.S. Coronavirus Aid, Relief and Economic Security Act (CARES Act), the delinquency status of loans modified due to COVID-19 related hardships are reported for all periods presented in alignment with the rules set forth for banks to report delinquency status to the credit agencies. These rules require that COVID-19 related loan modifications be reported as follows:
• if current at the time of modification, the loan remains current throughout the modification period, • if delinquent at the time of modification and the borrower was not made current as part of the modification, the loan maintains its reported
as delinquent status during the modification period, or• if delinquent at the time of modification and the borrower was made current as part of the modification or beca4me current during the
modification period, the loan is reported as current. As a result, certain loans modified due to COVID-19 related hardships are not being reported as past due for the periods presented based on the contractual terms of the loan, even where borrowers may not be making payments on their loans during the modification period. Our first quarter 2021 Form 10-Q included, and our second quarter 2021 Form 10-Q will include, additional information on COVID-19 related loan modifications.
Table 13: Accruing Loans Past Due 30 to 59 Days (a) Jun. 30 Mar. 31 Dec. 31 Sept. 30 Jun. 30
Dollars in millions 2021 2021 2020 2020 2020Commercial
Commercial and industrial $ 46 $ 80 $ 106 $ 56 $ 49 Commercial real estate 1 12 6 6 51 Equipment lease financing 3 21 31 7 8 Acquired loans (b) 30
Total commercial 80 113 143 69 108 Consumer
Home equity 38 43 50 48 70 Residential real estate
Non government insured 77 61 89 99 135 Government insured 87 101 92 89 63
Automobile 70 76 134 116 105 Credit card 29 31 43 44 53 Education
Non government insured 5 6 5 6 3 Government insured 41 43 50 51 36
Other consumer 10 11 14 17 17 Acquired loans (b) 111
Total consumer 468 372 477 470 482 Total $ 548 $ 485 $ 620 $ 539 $ 590
Supplemental InformationTotal accruing loans past due 30-59 days to total loans 0.19 % 0.20 % 0.26 % 0.22 % 0.23 %
Commercial 0.04 % 0.07 % 0.09 % 0.04 % 0.06 %Consumer 0.49 % 0.51 % 0.64 % 0.61 % 0.62 %
THE PNC FINANCIAL SERVICES GROUP, INC. Page 11

Accruing Loans Past Due (Unaudited) (Continued)
Table 14: Accruing Loans Past Due 60 to 89 Days (a)
Jun. 30 Mar. 31 Dec. 31 Sept. 30 Jun. 30Dollars in millions 2021 2021 2020 2020 2020Commercial
Commercial and industrial $ 18 $ 13 $ 26 $ 37 $ 28 Commercial real estate 3 1 1 6 4 Equipment lease financing 3 1 5 4 9 Acquired loans (b) 10
Total commercial 34 15 32 47 41 Consumer
Home equity 15 20 21 22 27 Residential real estate
Non government insured 9 13 16 22 34 Government insured 51 60 62 58 59
Automobile 14 19 34 32 34 Credit card 19 24 30 33 38 Education
Non government insured 2 3 2 2 2 Government insured 20 22 27 24 21
Other consumer 5 6 10 11 8 Acquired loans (b) 46
Total consumer 181 167 202 204 223 Total $ 215 $ 182 $ 234 $ 251 $ 264
Supplemental InformationTotal accruing loans past due 60-89 days to total loans 0.07 % 0.08 % 0.10 % 0.10 % 0.10 %
Commercial 0.02 % 0.01 % 0.02 % 0.03 % 0.02 %Consumer 0.19 % 0.23 % 0.27 % 0.27 % 0.29 %
Table 15: Accruing Loans Past Due 90 Days or More (a)
Jun. 30 Mar. 31 Dec. 31 Sept. 30 Jun. 30Dollars in millions 2021 2021 2020 2020 2020Commercial
Commercial and industrial $ 40 $ 63 $ 30 $ 36 $ 34 Acquired loans (b) 7
Total commercial 47 63 30 36 34 Consumer
Residential real estateNon government insured 20 17 27 28 19 Government insured 257 258 292 241 245
Automobile 3 6 12 12 19 Credit card 41 52 60 60 61 Education
Non government insured 1 2 2 1 1 Government insured 66 74 75 62 65
Other consumer 5 7 11 8 12 Acquired loans (b) 87
Total consumer 480 416 479 412 422 Total $ 527 $ 479 $ 509 $ 448 $ 456
Supplemental InformationTotal accruing loans past due 90 days or more to total loans 0.18 % 0.20 % 0.21 % 0.18 % 0.18 %
Commercial 0.02 % 0.04 % 0.02 % 0.02 % 0.02 %Consumer 0.50 % 0.57 % 0.64 % 0.54 % 0.54 %
(a) Excludes loans held for sale.(b) Reflects loans acquired as part of the BBVA acquisition on June 1, 2021. Additional information on this acquired loan portfolio will be included in our second quarter 2021
Form 10-Q.
THE PNC FINANCIAL SERVICES GROUP, INC. Page 12

Glossary of Terms
2019 Tailoring Rules – Rules adopted by the federal banking agencies to better tailor the application of their capital, liquidity, and enhanced prudential requirements for banking organizations to the asset size and risk profile (as measured by certain regulatory metrics) of the banking organization. Effective January 1, 2020, the agencies' capital and liquidity rules classify all BHCs with $100 billion or more in total assets into one of four categories (Category I, Category II, Category III, and Category IV).
Adjusted average total assets - Primarily consisted of total average quarterly (or annual) assets plus/less unrealized losses (gains) on investment securities, less goodwill and certain other intangible assets (net of eligible deferred taxes).
Allowance for credit losses (ACL) – A valuation account that is deducted from or added to the amortized cost basis of the relatedfinancial assets to present the net carrying value at the amount expected to be collected on the financial asset.
Amortized cost basis - Amount at which a financial asset is originated or acquired, adjusted for applicable accretion or amortization of premiums, discounts and net deferred fees or costs, collection of cash, charge-offs, foreign exchange and fair value hedge accounting adjustments.
Basel III common equity Tier 1 (CET1) capital (Tailoring Rules) - Common stock plus related surplus, net of treasury stock, plus retained earnings, less goodwill, net of associated deferred tax liabilities, less other disallowed intangibles, net of deferred tax liabilities and plus/less other adjustments. Investments in unconsolidated financial institutions, as well as mortgage servicing rights and deferred tax assets, must then be deducted to the extent such items (net of associated deferred tax liabilities) individually exceed 25% of our adjusted Basel III common equity Tier 1 capital.
Basel III common equity Tier 1 capital ratio - Common equity Tier 1 capital divided by period-end risk-weighted assets (as applicable).
Basel III Tier 1 capital - Common equity Tier 1 capital, plus qualifying preferred stock, plus certain trust preferred capital securities, plus certain noncontrolling interests that are held by others and plus/less other adjustments.
Basel III Tier 1 capital ratio - Tier 1 capital divided by period-end risk-weighted assets (as applicable).
Basel III Total capital - Tier 1 capital plus qualifying subordinated debt, plus certain trust preferred securities, plus, under the Basel III transitional rules and the standardized approach, the allowance for loan and lease losses included in Tier 2 capital and other.
Basel III Total capital ratio - Basel III Total capital divided by period-end risk-weighted assets (as applicable).
BBVA – BBVA USA Bancshares, Inc.
BBVA, S.A. – Banco Bilbao Vizcaya Argentaria, S.A.
BBVA USA – BBVA USA, the Alabama-chartered bank subsidiary of BBVA USA Bancshares, Inc.
BlackRock – BlackRock, Inc.
Charge-off - Process of removing a loan or portion of a loan from our balance sheet because it is considered uncollectible. We also record a charge-off when a loan is transferred from portfolio holdings to held for sale by reducing the loan carrying amount to the fair value of the loan, if fair value is less than carrying amount.
Common shareholders’ equity - Total shareholders' equity less the liquidation value of preferred stock.
Credit valuation adjustment - Represents an adjustment to the fair value of our derivatives for our own and counterparties’ non-performance risk.
Criticized commercial loans - Loans with potential or identified weaknesses based upon internal risk ratings that comply with the regulatory classification definitions of “Special Mention,” “Substandard” or “Doubtful.”
Current Expected Credit Loss (CECL) - Methodology for estimating the allowance for credit losses on in-scope financial assets held at amortized cost and unfunded lending related commitments which uses a combination of expected losses over a reasonable and supportable forecast period, a reversion period and long run average credit losses for their estimated contractual term.
THE PNC FINANCIAL SERVICES GROUP, INC. Page 13

Discretionary client assets under management - Assets over which we have sole or shared investment authority for our customers/clients. We do not include these assets on our Consolidated Balance Sheet.
Earning assets - Assets that generate income, which include: interest-earning deposits with banks; loans held for sale; loans; investment securities; and certain other assets.
Effective duration - A measurement, expressed in years, that, when multiplied by a change in interest rates, would approximate the percentage change in value of on- and off- balance sheet positions.
Efficiency - Noninterest expense divided by total revenue.
Fair value - The price that would be received to sell an asset or paid to transfer a liability in an orderly transaction between market participants at the measurement date.
Fee income - Refers to the following categories within Noninterest income: Asset management; Consumer services; Corporate services; Residential mortgage; and Service charges on deposits.
FICO score - A credit bureau-based industry standard score created by Fair Isaac Co. which predicts the likelihood of borrower default. We use FICO scores both in underwriting and assessing credit risk in our consumer lending portfolio. Lower FICO scores indicate likely higher risk of default, while higher FICO scores indicate likely lower risk of default. FICO scores are updated on a periodic basis.
GAAP - Accounting principles generally accepted in the United States of America.
Leverage ratio - Basel III Tier 1 capital divided by average quarterly adjusted total assets.
Nondiscretionary client assets under administration - Assets we hold for our customers/clients in a nondiscretionary, custodial capacity. We do not include these assets on our Consolidated Balance Sheet.
Nonperforming assets - Nonperforming assets include nonperforming loans, OREO and foreclosed assets. We do not accrue interest income on assets classified as nonperforming.
Nonperforming loans - Loans accounted for at amortized cost whose credit quality has deteriorated to the extent that full collection of contractual principal and interest is not probable, including TDRs which have not returned to performing status. Interest income is not recognized on nonperforming loans. Nonperforming loans exclude certain government insured or guaranteed loans for which we expect to collect substantially all principal and interest, loans held for sale and loans accounted for under the fair value option.
Operating leverage - The period to period dollar or percentage change in total revenue less the dollar or percentage change in noninterest expense. A positive variance indicates that revenue growth exceeded expense growth (i.e., positive operating leverage) while a negative variance implies expense growth exceeded revenue growth (i.e., negative operating leverage).
Other real estate owned (OREO) and foreclosed assets - Assets taken in settlement of troubled loans primarily through deed-in-lieu of foreclosure or foreclosure. Foreclosed assets include real and personal property. Certain assets that have a government-guarantee which are classified as other receivables are excluded.
Purchased credit deteriorated assets (PCD) - Acquired loans or debt securities that, at acquisition, are determined to have experienced a more-than-insignificant deterioration in credit quality since origination or issuance.
Risk-weighted assets - Computed by the assignment of specific risk-weights (as defined by the Board of Governors of the Federal Reserve System) to assets and off-balance sheet instruments.
Servicing rights - Intangible assets or liabilities created by an obligation to service assets for others. Typical servicing rights include the right to receive a fee for collecting and forwarding payments on loans and related taxes and insurance premiums held in escrow.
Supplementary leverage ratio - Basel III Tier 1 capital divided by Supplementary leverage exposure.
Taxable-equivalent interest income - The interest income earned on certain assets that is completely or partially exempt from federal income tax. These tax-exempt instruments typically yield lower returns than taxable investments. To provide more meaningful comparisons of yields and margins for all interest-earning assets, we use interest income on a taxable-equivalent basis in calculating average yields and net interest margins by increasing the interest income earned on tax-exempt assets to make it fully equivalent to
THE PNC FINANCIAL SERVICES GROUP, INC. Page 14

interest income earned on other taxable investments. This adjustment is not permitted under GAAP on the Consolidated Income Statement.
Troubled debt restructuring (TDR) - A loan whose terms have been restructured in a manner that grants a concession to a borrower experiencing financial difficulties.
Unfunded lending related commitments - Standby letters of credit, financial guarantees, commitments to extend credit and similar unfunded obligations that are not unilaterally, unconditionally, cancelable at PNC’s option.
Yield curve - A graph showing the relationship between the yields on financial instruments or market indices of the same credit quality with different maturities. For example, a “normal” or “positive” yield curve exists when long-term bonds have higher yields than short-term bonds. A “flat” yield curve exists when yields are the same for short-term and long-term bonds. A “steep” yield curve exists when yields on long-term bonds are significantly higher than on short-term bonds. An “inverted” or “negative” yield curve exists when short-term bonds have higher yields than long-term bonds.
THE PNC FINANCIAL SERVICES GROUP, INC. Page 15